Weekly Data Chart Powerpoint and Keynote Slide


Description
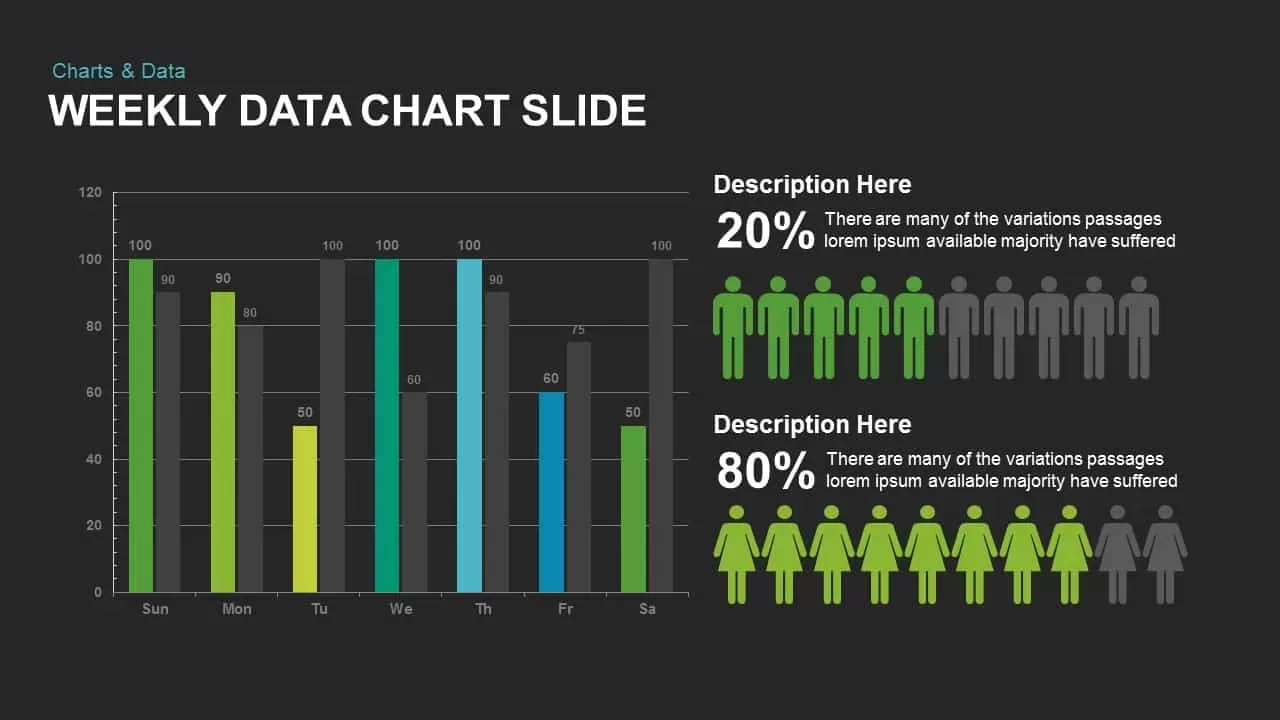
This Weekly Data Chart slide provides a visual representation of data trends over a week, using both a bar chart and a comparative demographic graphic. The left side of the slide features a dynamic bar chart showcasing weekly data points for Sunday through Saturday, with varying colors indicating different data sets. The chart is complemented by a demographic visualization on the right, showing gender-based distribution as pie charts.
The clear visual contrast between different data sets helps the audience easily understand trends, proportions, and comparisons, making it perfect for reporting or presenting any type of weekly metrics, such as productivity, sales, or participation. The included icons for male and female demographic representation further enhance the ability to convey demographic-based data.
Ideal for business presentations, weekly reports, or project tracking, this slide is versatile and simple to customize to your specific data needs.
Who is it for
This slide is beneficial for business analysts, project managers, marketing teams, and human resources professionals who need to present weekly data comparisons, sales metrics, or demographic information. It is also ideal for educational settings to present survey results or classroom data.
Other Uses
This slide can be repurposed for visualizing project milestones over time, team performance assessments, budget tracking, or sales team contributions. It can also be used to compare different departments, analyze employee engagement, or demonstrate customer surveys and their results.
Login to download this file


