
















Virtuous Cycle for Economy PowerPoint Template
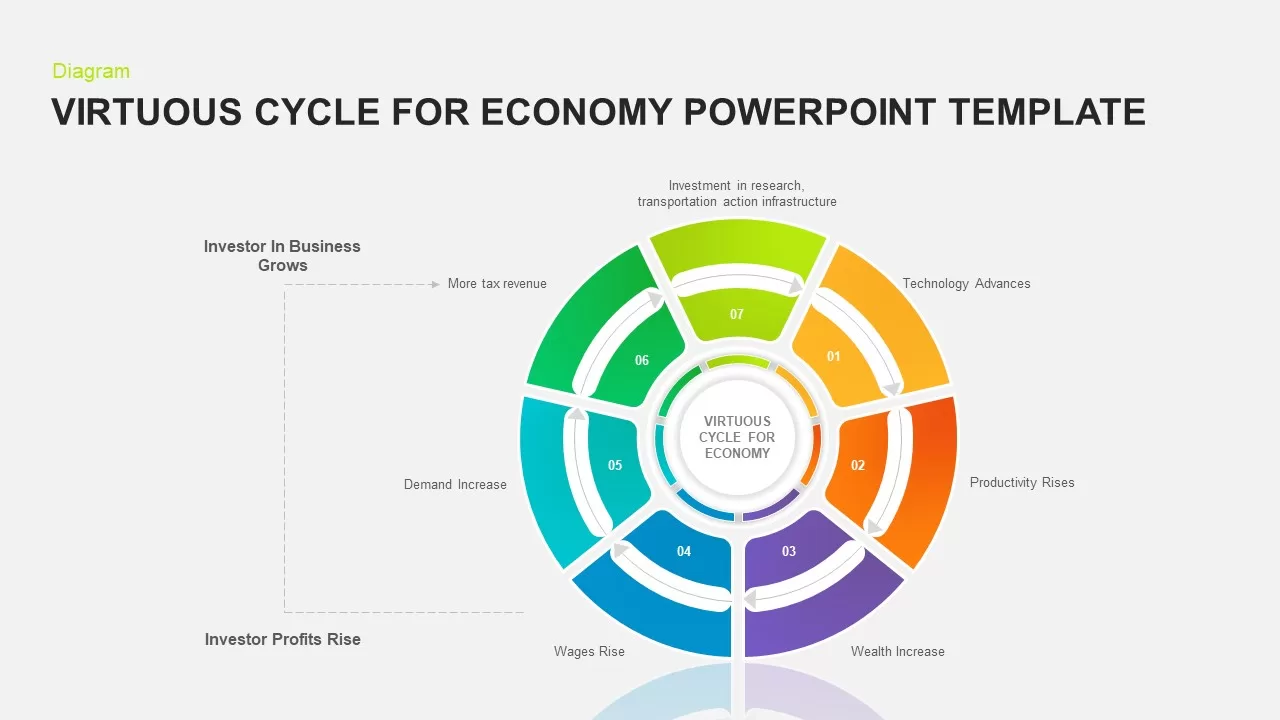


Virtuous Cycle PowerPoint Template
Virtuous cycle for economy PowerPoint template: virtuous cycle refers the chain of occurrences that having positive effect on the next. The virtuous cycle for economic diagram shows the chain of events that strengthen the economy to new heights. The A virtuous cycle is one where wages drive the rotation rather than external factors or even an increase in money supply due to fiscal mismanagement. This is complex graphical illustration which focusing economic complexities in a development phase. A virtuous cycle might be understood easily when knowing what vicious cycle is. A vicious cycle is a sequence of events that adversely impact the economy. Think high joblessness leads to lower spending leads to lower profit margins, hiring freezes, and layoffs. A virtuous cycle forms when robust wages stimulate economic growth.
As the name suggests virtuous cycle PowerPoint template is a circular diagram divided into several parts. The colorful segments are in a recurring flow indicated by the thin arrow PowerPoint objects on the inner circle. It displays how investor money is been increasing along with business growth cycle. When wage increases occurred the buying will be proliferated. When labors are become tax payer’s nation’s income would be increased. This is the core idea behind virtuous economic cycle. The cycle diagram for PowerPoint presentation is created as a colorful pp section template consumes any idea that has more than six variables.
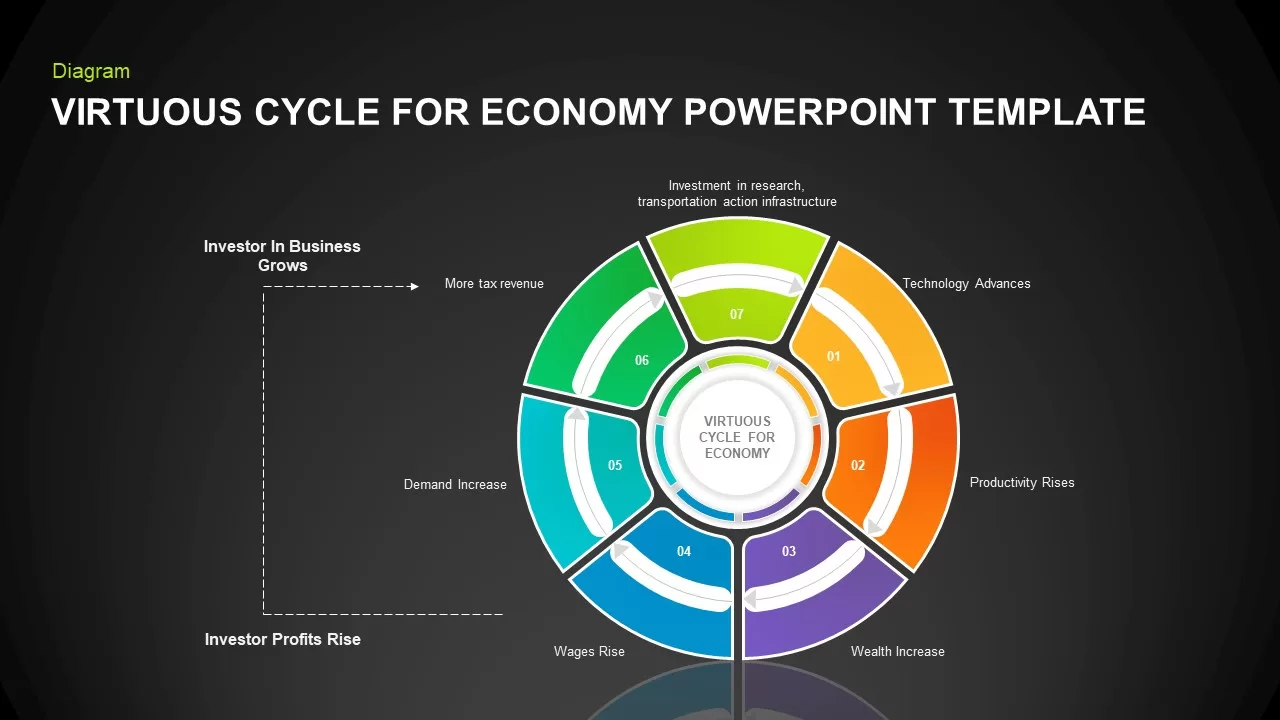
Virtuous cycle PowerPoint template for economic presentation contains 2 slides of different color background. The 7 stage PowerPoint diagram in a cycle pattern allow the user to make business presentation. Besides, academic or education presentation also be suited with the cycle ppt diagram. The circular section PowerPoint Diagrams are predominantly well suited for business operation, financial planning, technology processes in 7 steps. Otherwise, it is adequate to present an ongoing process of a procedure. Showing the virtuous circle of multifaceted events that supports itself through a cycle or loop.
Login to download this file

Item ID
SB01805


Related Templates

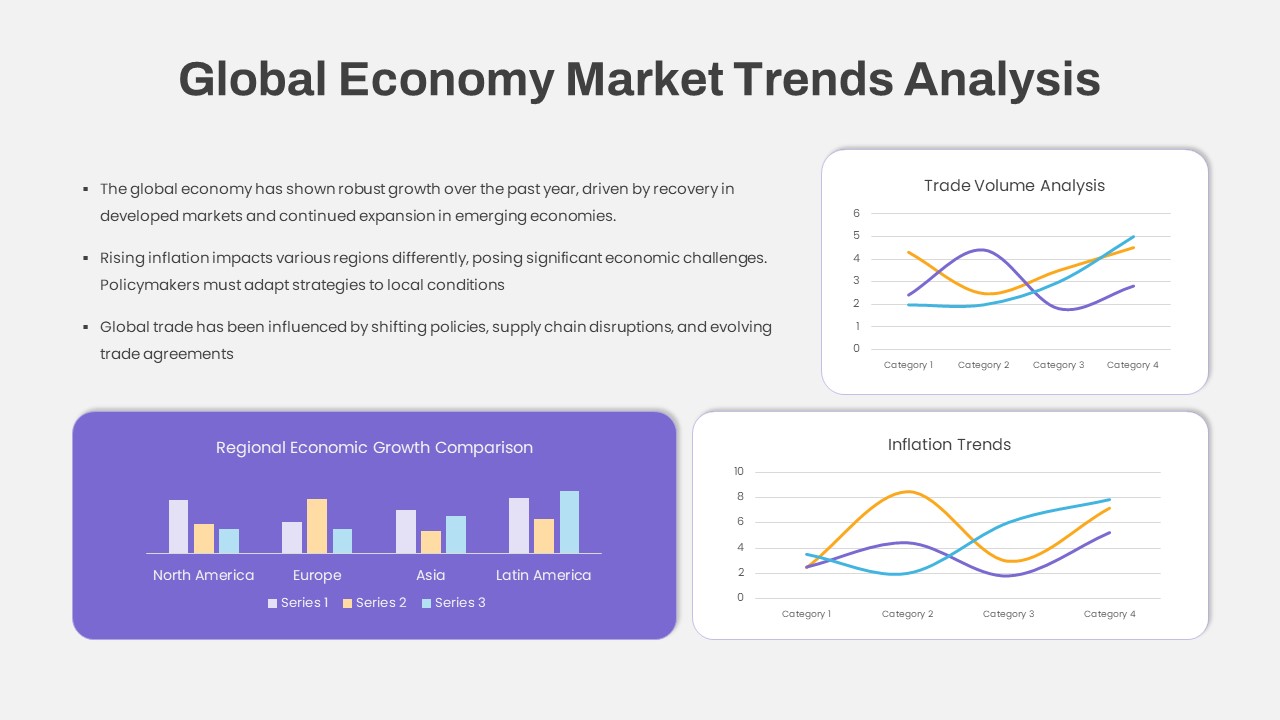
Global Economy Market Trends Analysis Template for PowerPoint & Google Slides
Comparison Chart
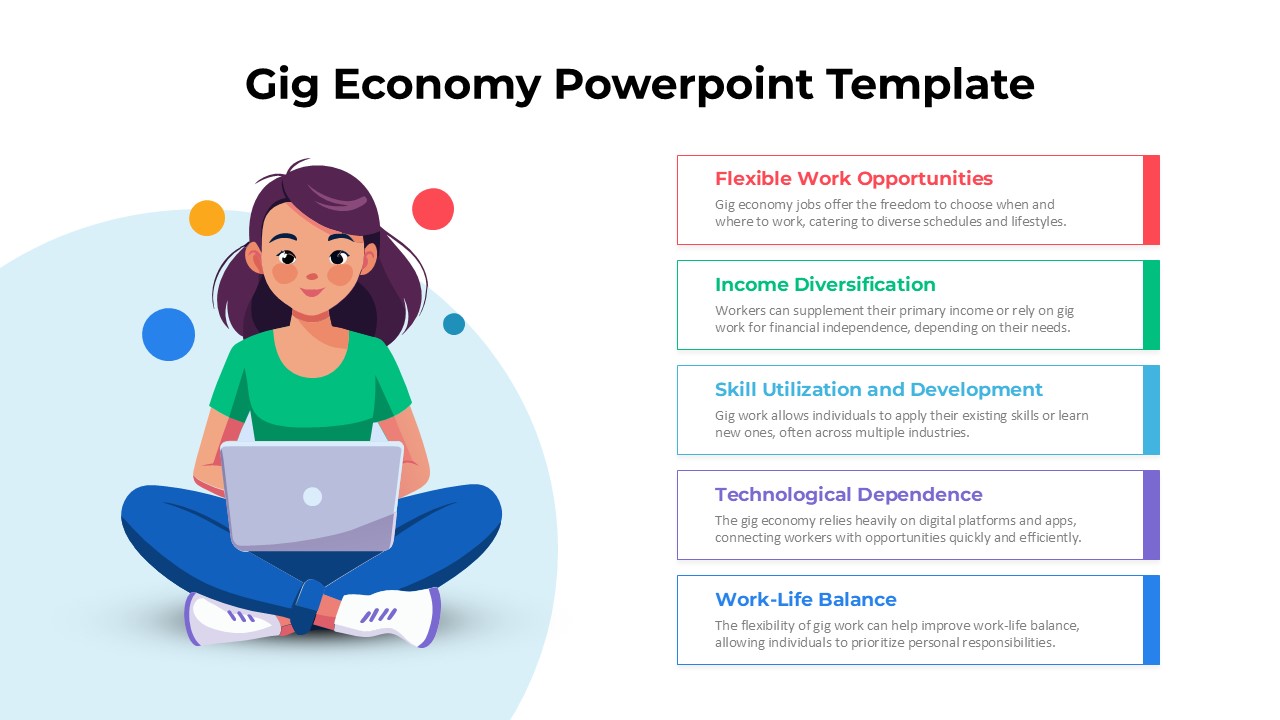
Gig Economy Infographic One-Pager Template for PowerPoint & Google Slides
Comparison
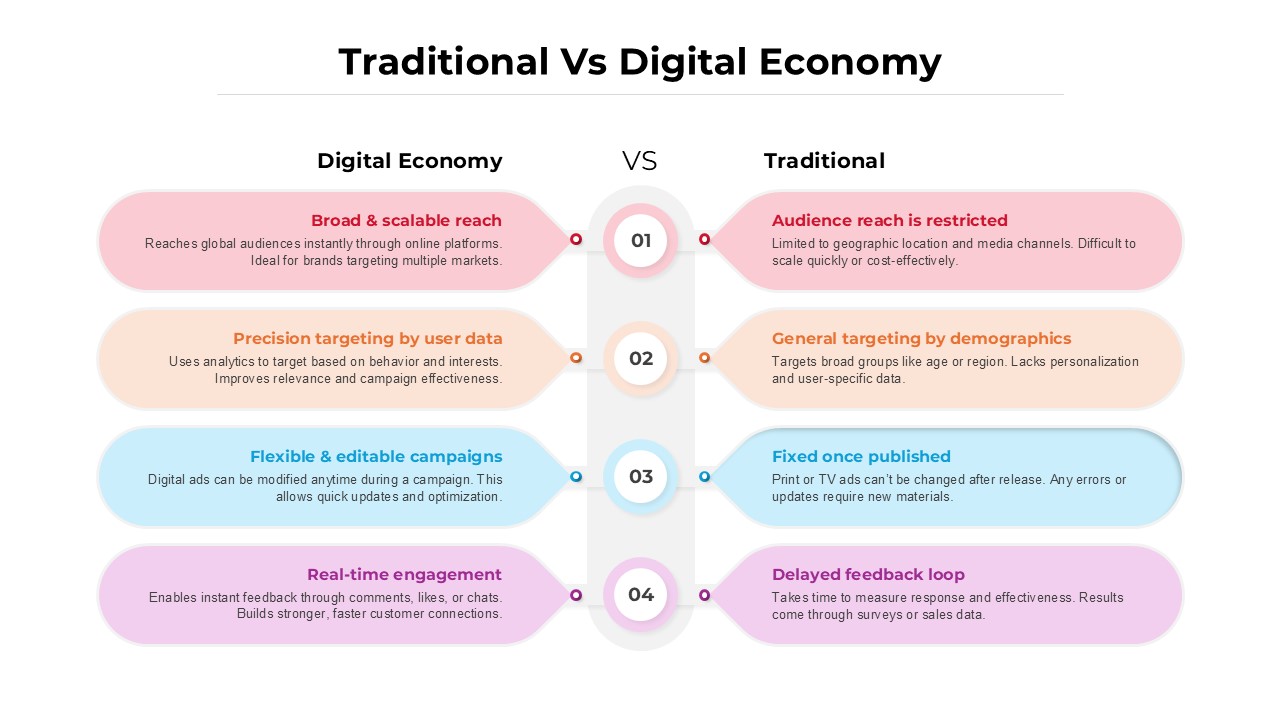
Traditional vs Digital Economy Template
Comparison
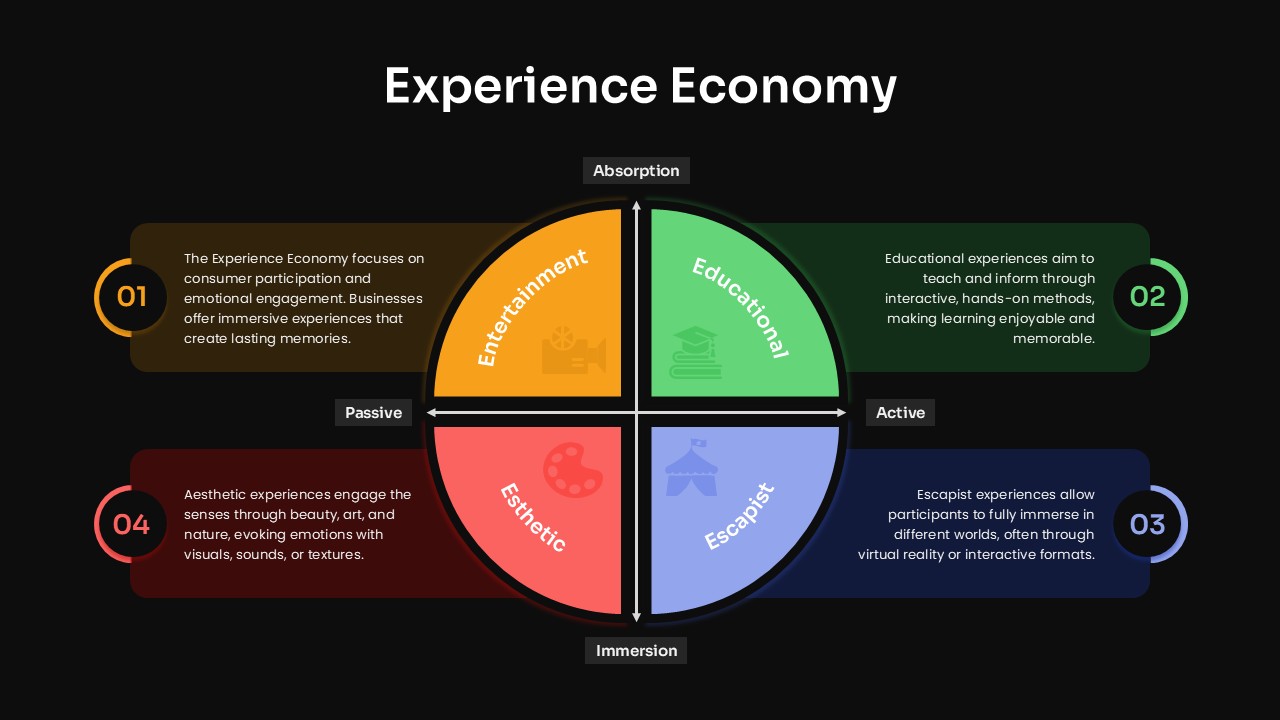
Experience Economy Quadrant Diagram Template for PowerPoint & Google Slides
Circular
Circular Economy Process Template for PowerPoint and Google Slides
Circular
Sales Cycle Steps PowerPoint Template and Google Slide Template
Process
Data Migration Life Cycle – Template for PowerPoint Template
Process
6 Stage Cycle Template for PowerPoint
Process
Software Development Life Cycle Diagram Template for PowerPoint & Google Slides
Circular
Employee Life Cycle Activities Process Template for PowerPoint & Google Slides
Employee Performance

Continuous Improvement Cycle Diagram Template for PowerPoint & Google Slides
Process
Modern Cycle Process Template for PowerPoint & Google Slides
Business Proposal
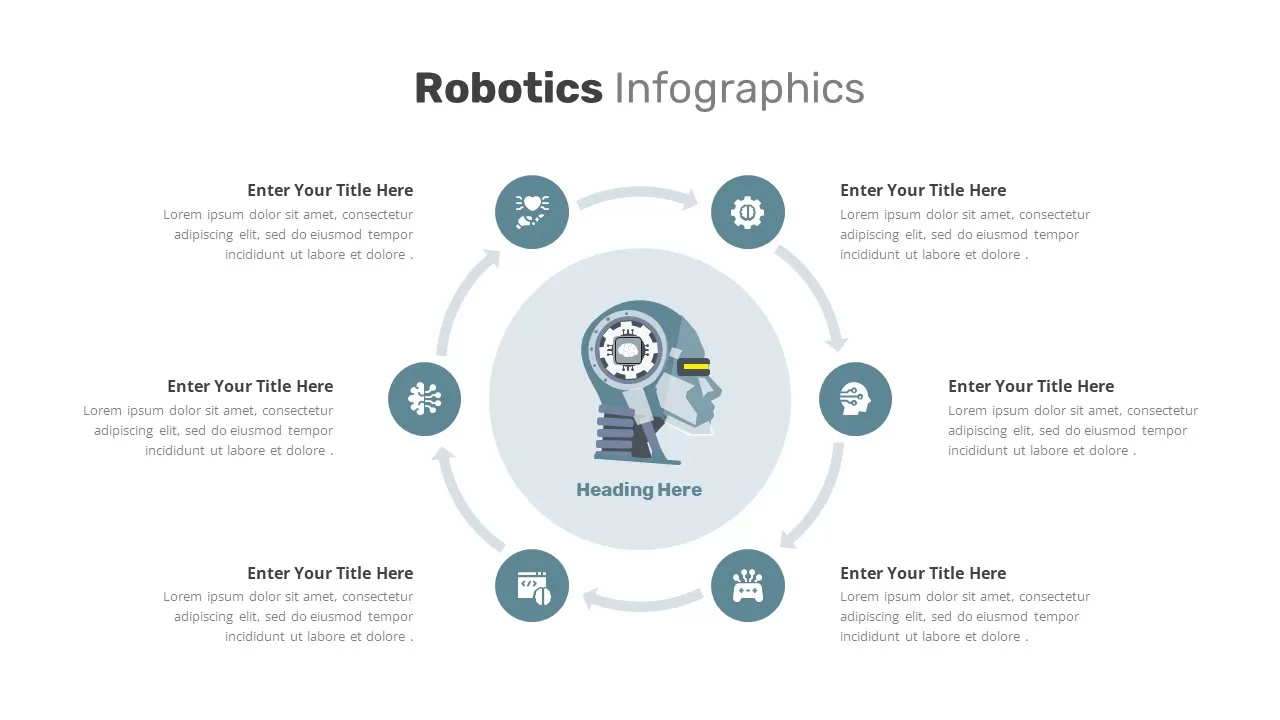
Robotics Process Cycle Infographic Template for PowerPoint & Google Slides
Process
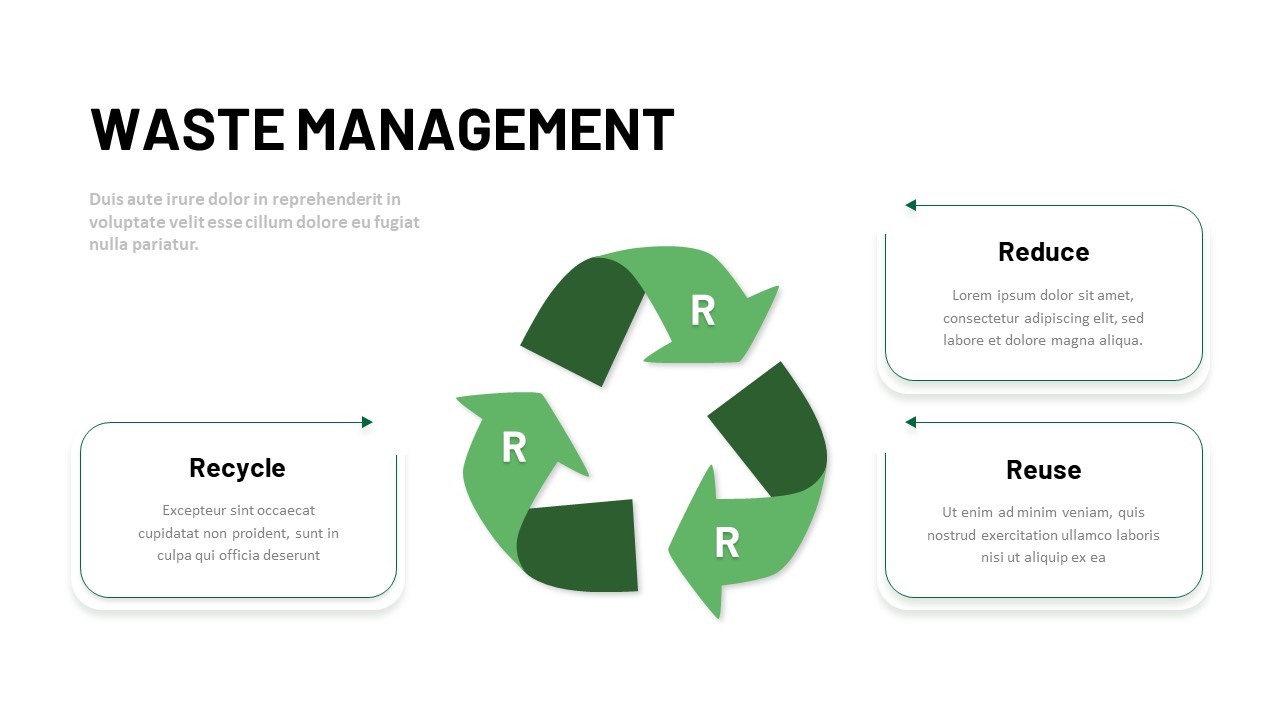
3R Waste Management Cycle Diagram Template for PowerPoint & Google Slides
Circular
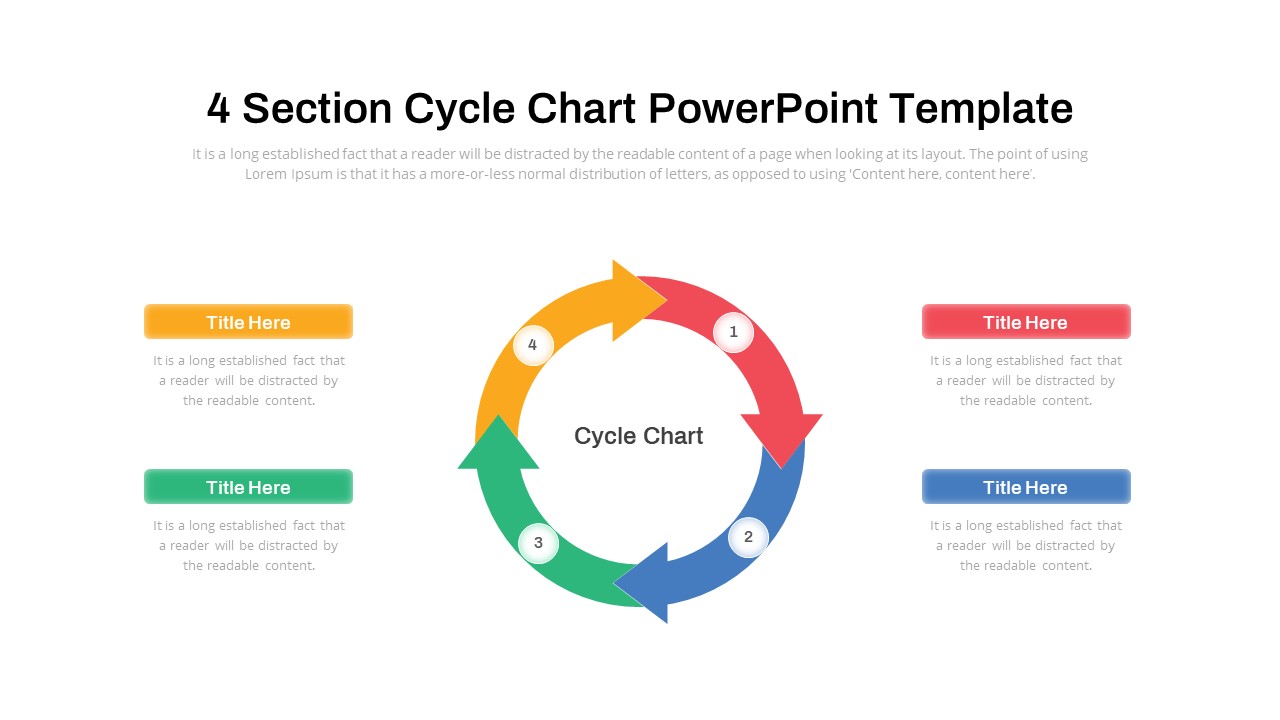
Cycle Chart Diagram PowerPoint Template
Circular
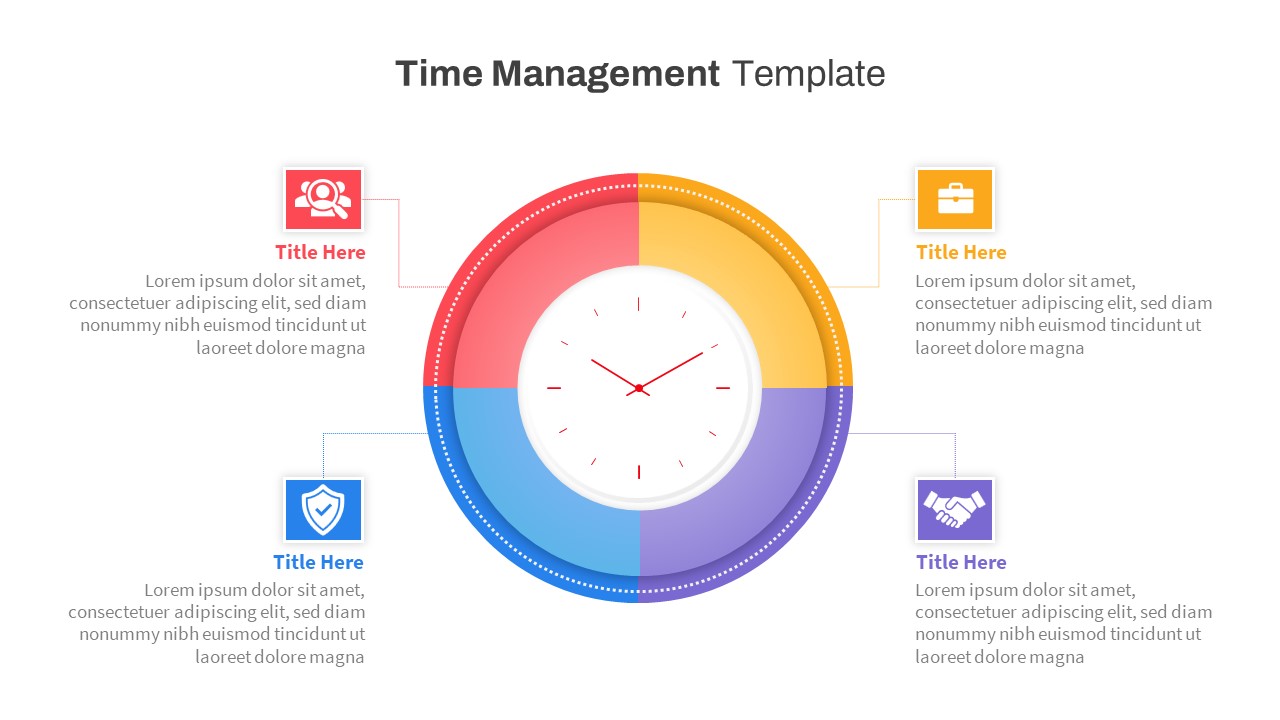
Free Time Management Template for PowerPoint Slides
Process
Free
Working Capital Cycle Diagram Template for PowerPoint & Google Slides
Circular
ML Development Life Cycle Diagram Template for PowerPoint & Google Slides
Machine Learning
Extreme Programming Process Cycle Template for PowerPoint & Google Slides
Software Development
Cashflow Management Template for PowerPoint
Finance