Vertical Crime Timeline Infographic Template for PowerPoint & Google Slides
Description
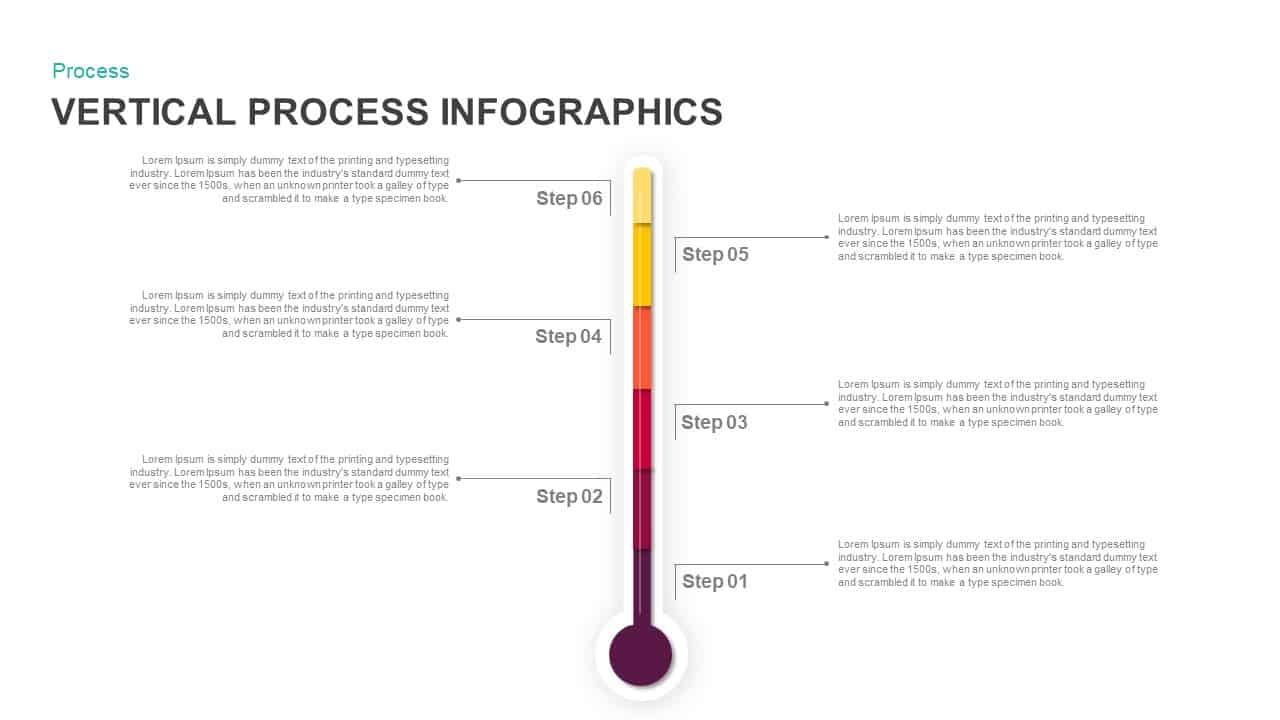
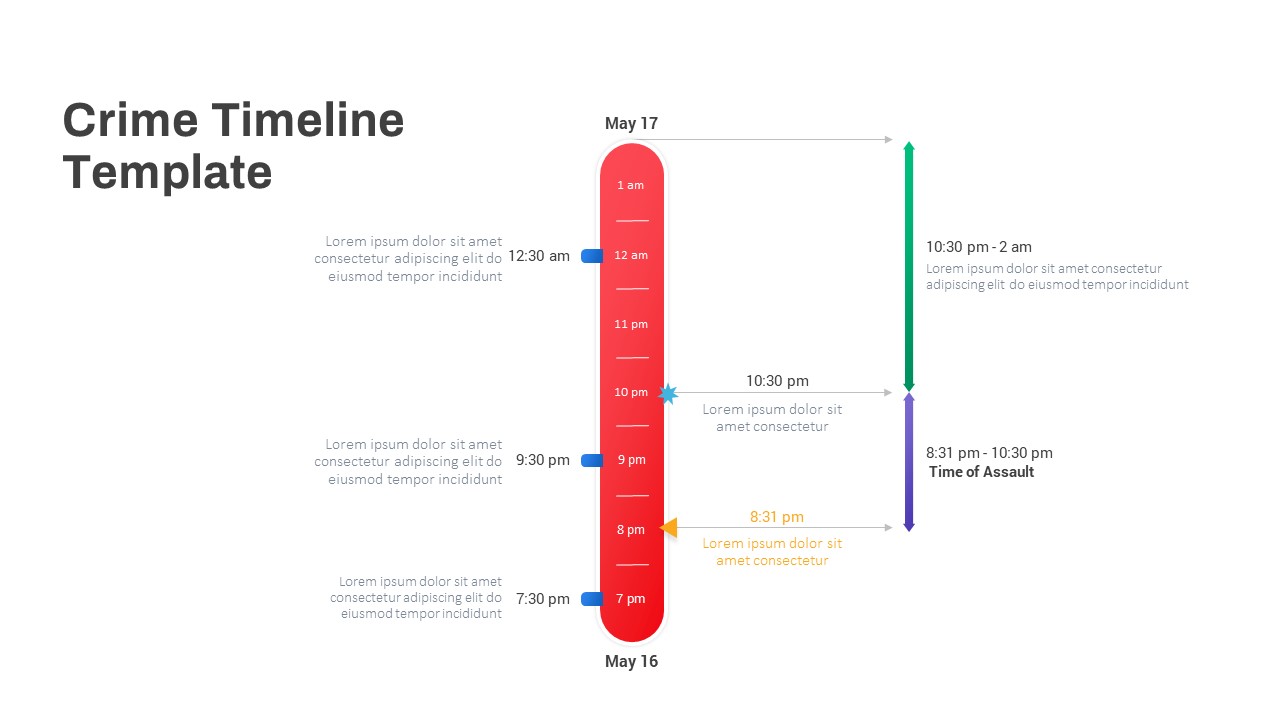
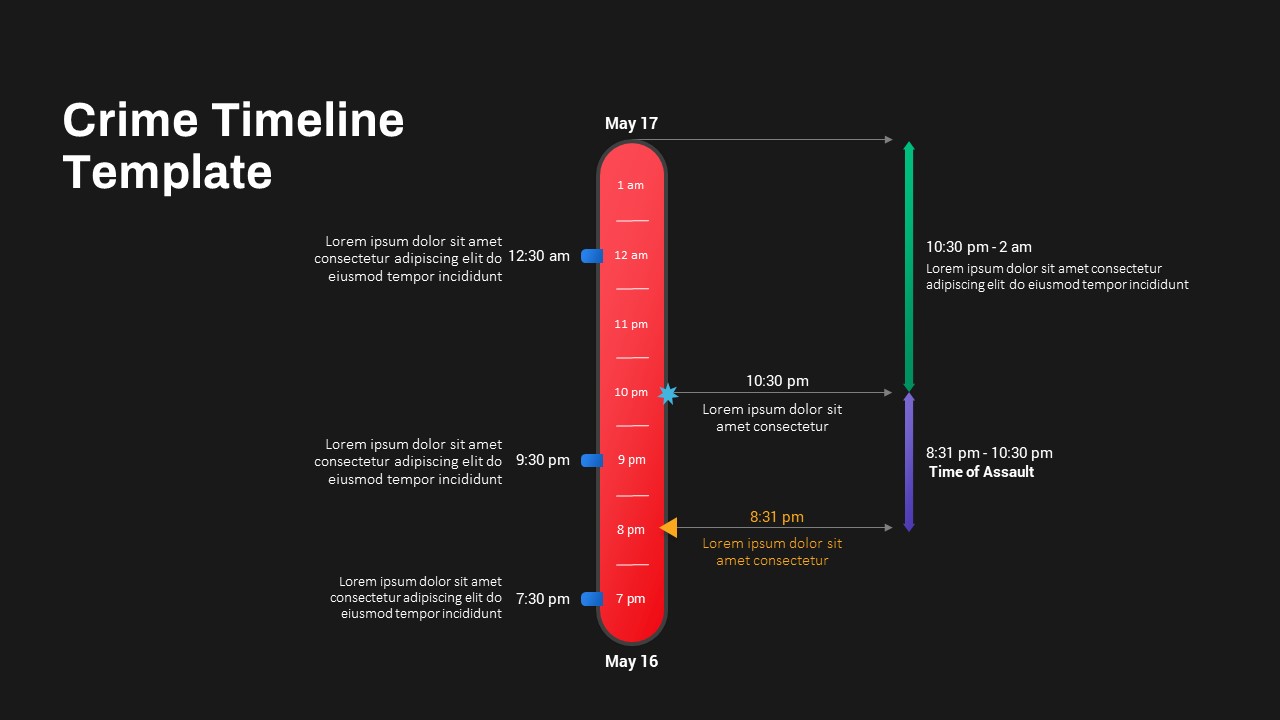
This timeline infographic template presents a sleek, vertical crime timeline on a crisp white canvas. A bold red capsule shape forms the central spine, marked with evenly spaced hour ticks from 7 p.m. to 1 a.m. Customizable blue slider markers denote point events like 7:30 p.m., 9:30 p.m., and 12:30 a.m., while colored arrows and star-shaped icons highlight critical moments at 8:31 p.m. and 10:30 p.m. Alternating solid arrows and dashed capsules offer clear placeholders for event descriptions, with space to annotate durations such as the 8:31 p.m.–10:30 p.m. assault window (purple) and the 10:30 p.m.–2 a.m. incident period (green). The minimalist layout leverages contrasting color accents and simple sans-serif typography to guide viewers’ eyes through sequential events without visual clutter.
Built on master slide layouts in PowerPoint and Google Slides, every element is fully editable. Easily adjust the timeline height, add or remove time markers, and swap out arrow shapes or icon styles with drag-and-drop simplicity. Theme-aware palettes enable one-click color updates, automatically recoloring markers, arrows, and capsules to match corporate branding. Alignment guides and snap-to-grid functionality ensure consistent spacing across all slide elements. For interactive presentations, animate each marker or arrow to sequentially reveal events, or overlay custom icons and mini-charts to convey statistics and case data. Optimized for both in-room projection and virtual meetings, this template ensures crisp readability on large screens and remote desktops. Print-ready slide settings deliver high-resolution handouts for forensic reports, briefs, or academic handouts. Whether mapping crime scenes, incident logs, or project timelines, this vertical timeline infographic provides a versatile, professional framework to clearly communicate chronological narratives.
Who is it for
Forensic analysts, legal professionals, and law enforcement teams will leverage this slide to map incident timelines, evidence logs, and case events. Project managers and consultants can adapt it to visualize critical milestones and investigation phases.
Other Uses
Repurpose this layout for safety drill schedules, medical case timelines, product incident reports, or project phase tracking. Swap icons and colors to represent different themes, departments, or event types across any industry context.
Login to download this file

Item ID
SB03704
Related Templates

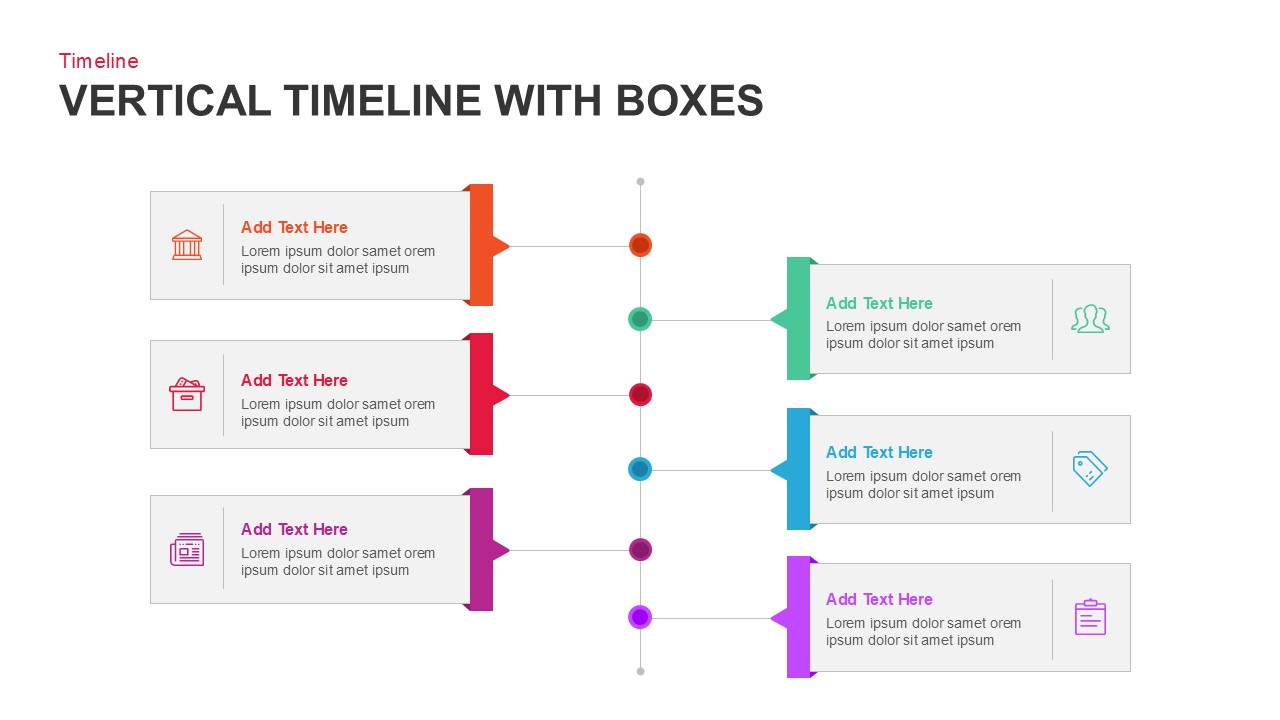
Vertical Timeline with Alternating Boxes Template for PowerPoint & Google Slides
Timeline
Animated Vertical Timeline Template for PowerPoint & Google Slides
Timeline
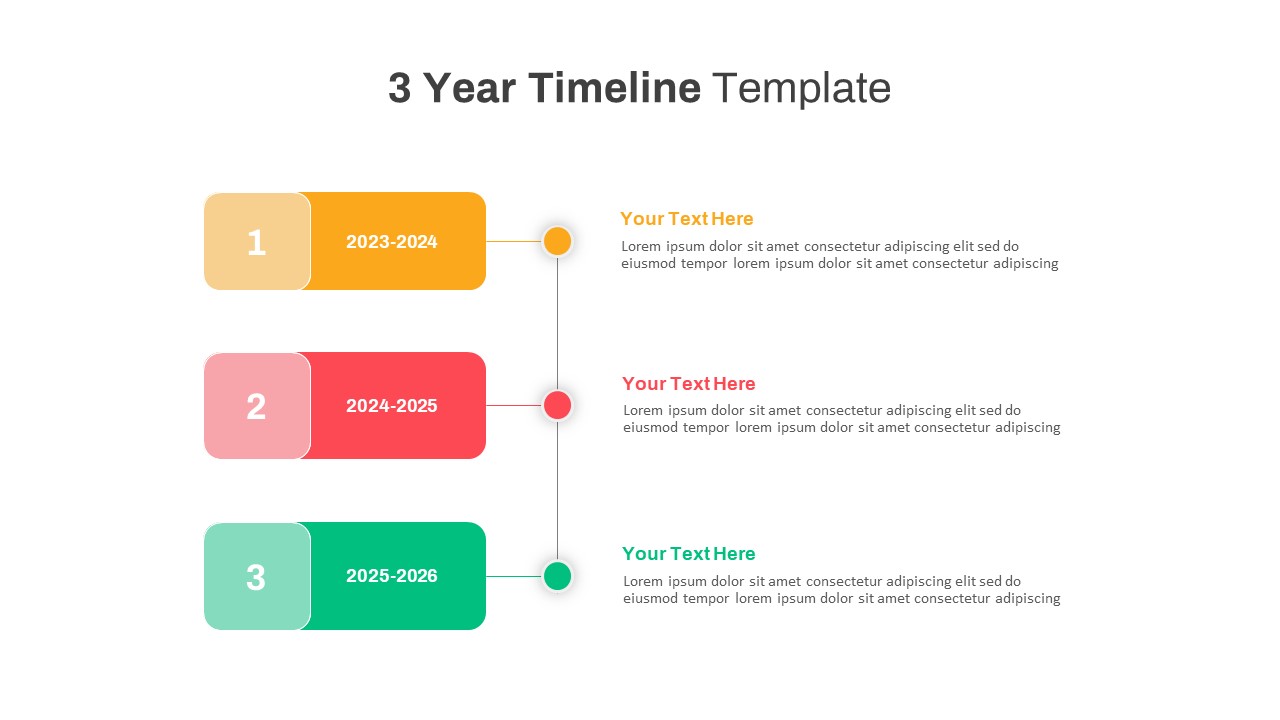
Three-Year Vertical Milestone Timeline Template for PowerPoint & Google Slides
Timeline
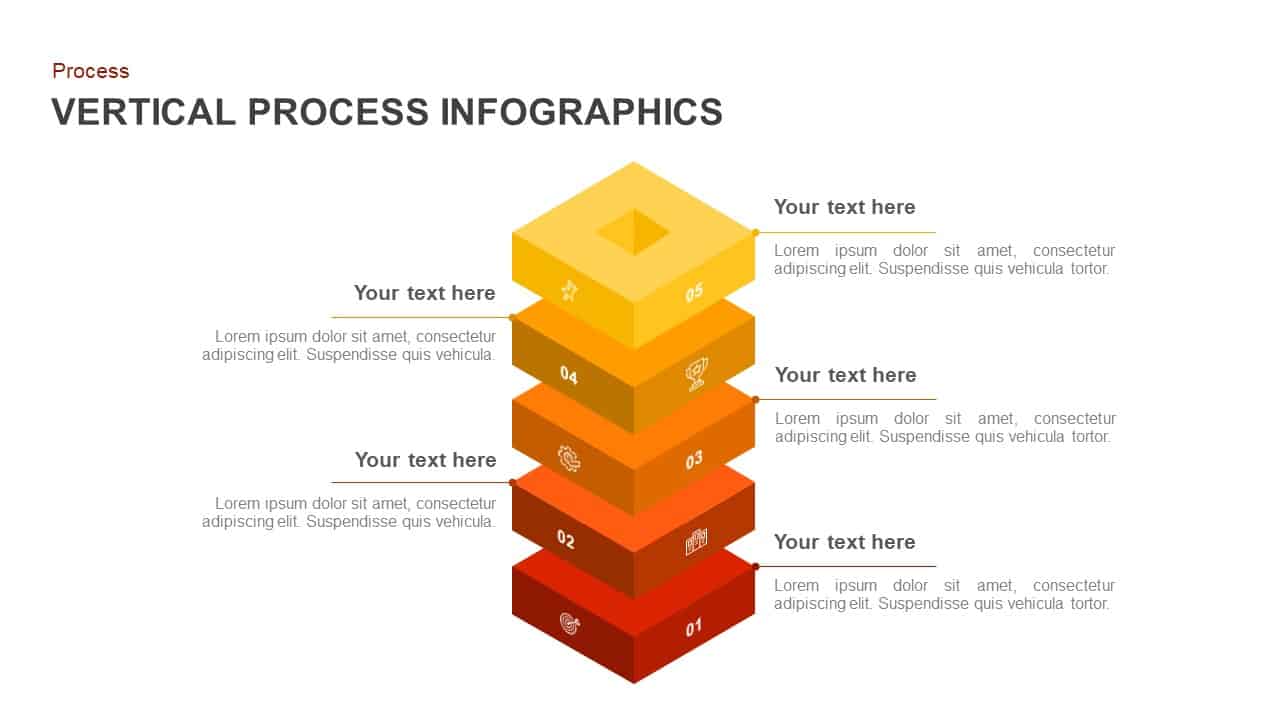
Vertical Stacked Process Infographic Template for PowerPoint & Google Slides
Process
Vertical Four-Step Process Infographic Template for PowerPoint & Google Slides
Process
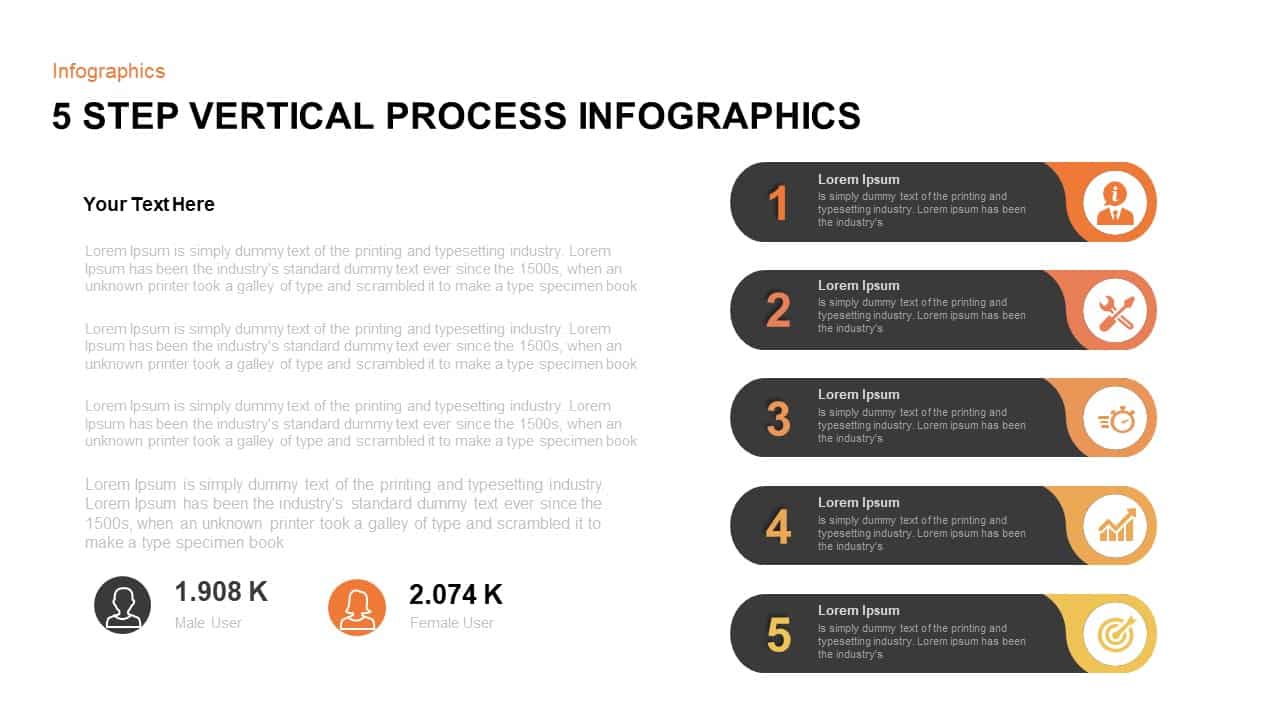
Five-Step Vertical Process Infographic Template for PowerPoint & Google Slides
Process

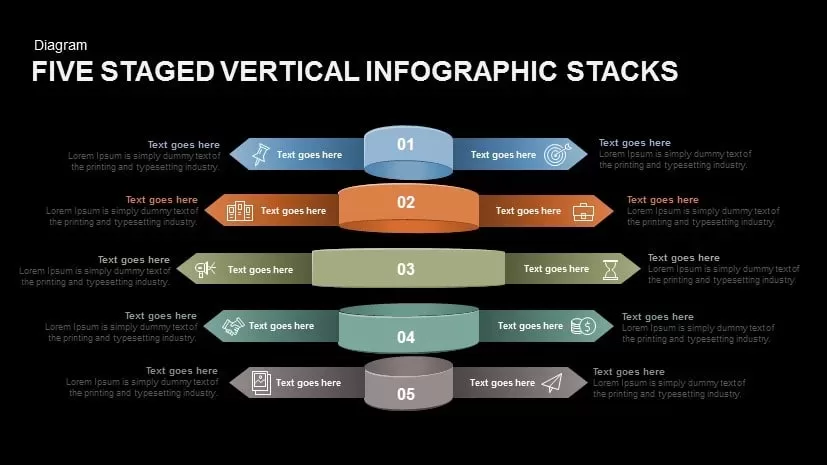
Five Staged Vertical Infographic Stacks for PowerPoint & Google Slides
Process
Vertical Business Process Flow Diagram Template for PowerPoint & Google Slides
Process
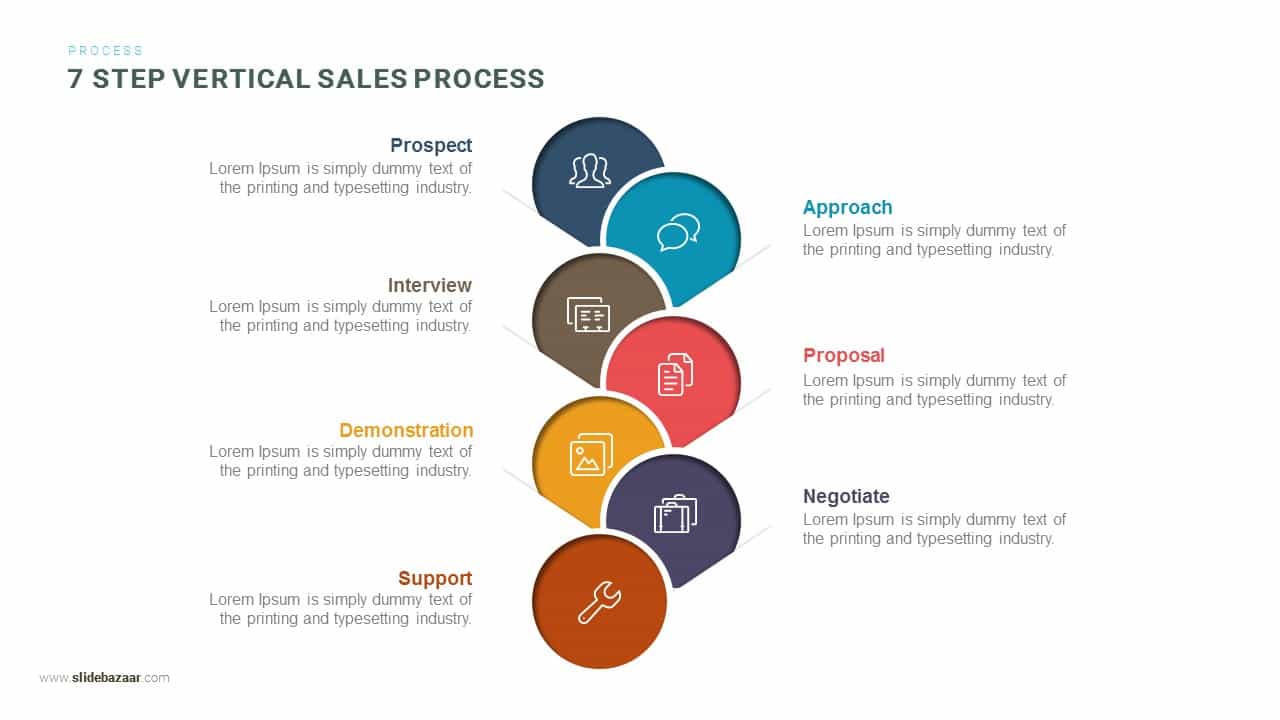
Seven-Step Vertical Sales Process Template for PowerPoint & Google Slides
Process
Six-Step Vertical Process Diagram Template for PowerPoint & Google Slides
Process
Five-Stage Vertical Bar Process Template for PowerPoint & Google Slides
Process
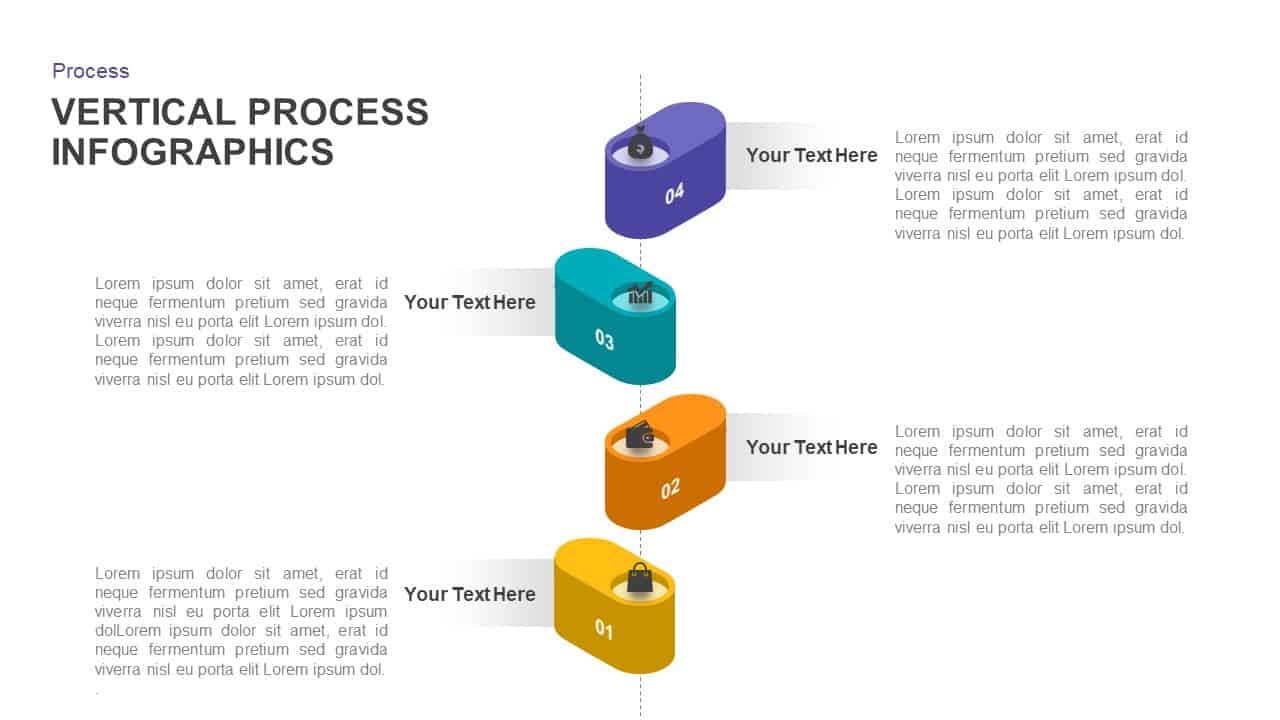
Vertical Process Infographics Template for PowerPoint & Google Slides
Process
Vertical Split Flow Chart Diagram Template for PowerPoint & Google Slides
Flow Charts
Vertical 4-Step Puzzle Process Diagram Template for PowerPoint & Google Slides
Process
Vertical 30-60-90 Business Plan Flow Template for PowerPoint & Google Slides
Timeline
Colorful Vertical SWOT Analysis Layout Template for PowerPoint & Google Slides
SWOT
Vertical Presentation Template for PowerPoint & Google Slides
Business Models
Multi-Series Vertical Dot Chart Template for PowerPoint & Google Slides
Comparison Chart
Vertical Roadmap Infographics Template for PowerPoint & Google Slides
Roadmap
Free Vertical Marketing Consultancy Presentation Template for PowerPoint & Google Slides
Company Profile
Free
Vertical Marketing Systems (VMS) Circular Diagram Template for PowerPoint & Google Slides
Marketing
7-Stage Colorful Timeline Infographic Template for PowerPoint & Google Slides
Timeline
Creative Pencil Timeline Infographic Template for PowerPoint & Google Slides
Timeline
Three Four Five Stage Timeline Infographic Template for PowerPoint & Google Slides
Timeline
Curved Five-Section Timeline Infographic template for PowerPoint & Google Slides
Timeline
Curved Road Map Timeline Infographic Template for PowerPoint & Google Slides
Roadmap
Roadmap Infographic Timeline Slide Template for PowerPoint & Google Slides
Roadmap
Horizontal Timeline Infographic Template for PowerPoint & Google Slides
Timeline
Professional Linear Timeline Infographic Template for PowerPoint & Google Slides
Timeline
Six-Stage Hexagon Timeline Infographic Template for PowerPoint & Google Slides
Timeline

Medical Stethoscope Timeline Infographic Template for PowerPoint & Google Slides
Timeline

Timeline Infographic Design Seven Stage template for PowerPoint & Google Slides
Timeline

Timeline Roadmap Milestones Infographic Template for PowerPoint & Google Slides
Roadmap
Modern Bubble Timeline Infographic Template for PowerPoint & Google Slides
Timeline
Creative Bubble Timeline Infographic Template for PowerPoint & Google Slides
Timeline
Multi-Year Timeline Infographic Template for PowerPoint & Google Slides
Timeline
Arrow Timeline Infographic Slide Template for PowerPoint & Google Slides
Timeline
Technology Advancement Timeline Infographic Template for PowerPoint & Google Slides
Information Technology
Animated 5-Stage Puzzle Timeline Infographic Template for PowerPoint & Google Slides
Timeline
5 Stage Circular Timeline Infographic Template for PowerPoint & Google Slides
Timeline
Six-Stage Timeline Infographic Template for PowerPoint & Google Slides
Timeline
5 Stage Timeline Infographic Slide Template for PowerPoint & Google Slides
Timeline
Five-Year Gradient Timeline Infographic Template for PowerPoint & Google Slides
Timeline
Five-Step Growth Timeline Infographic Template for PowerPoint & Google Slides
Timeline
Business Timeline Envelope Infographic Template for PowerPoint & Google Slides
Timeline
5-Stage Timeline Infographic Slide Template for PowerPoint & Google Slides
Timeline
Seven-Stage Hexagon Timeline Infographic Template for PowerPoint & Google Slides
Timeline
Lighthouse Timeline Infographic Template for PowerPoint & Google Slides
Timeline
Six-Stage Road Map Infographic Timeline Template for PowerPoint & Google Slides
Roadmap
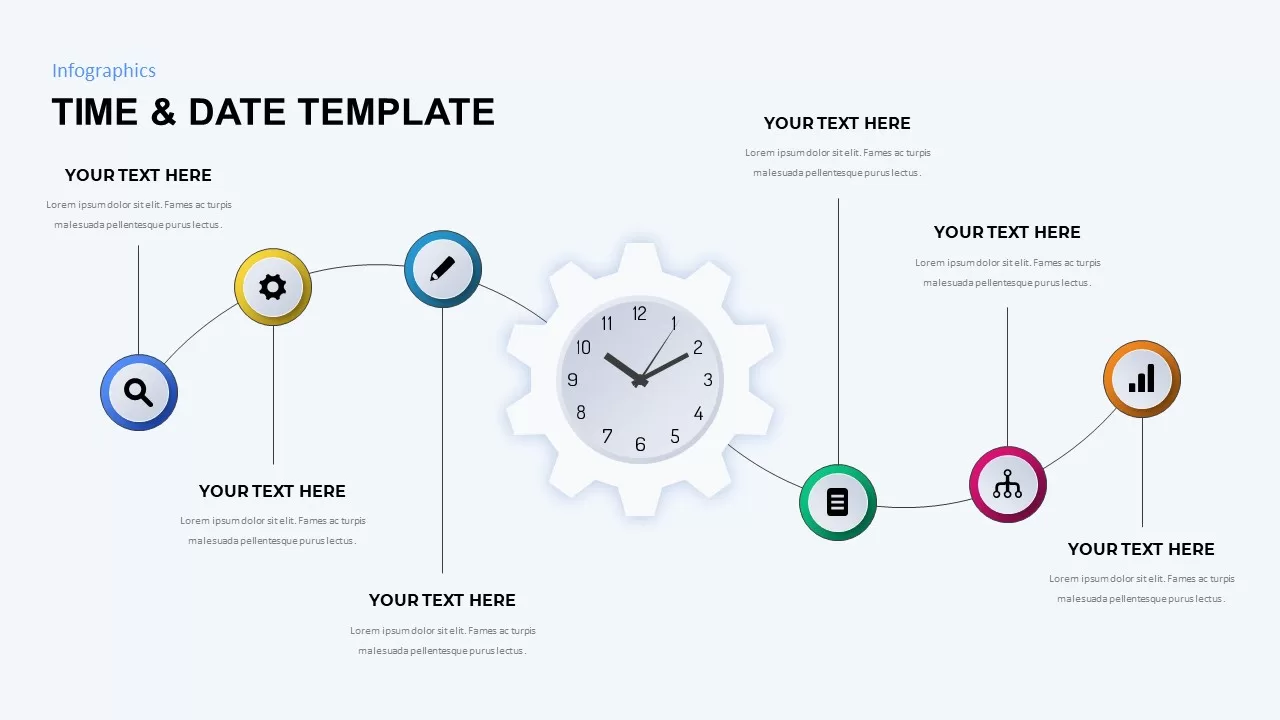
Time & Date Infographic Timeline Template for PowerPoint & Google Slides
Decks
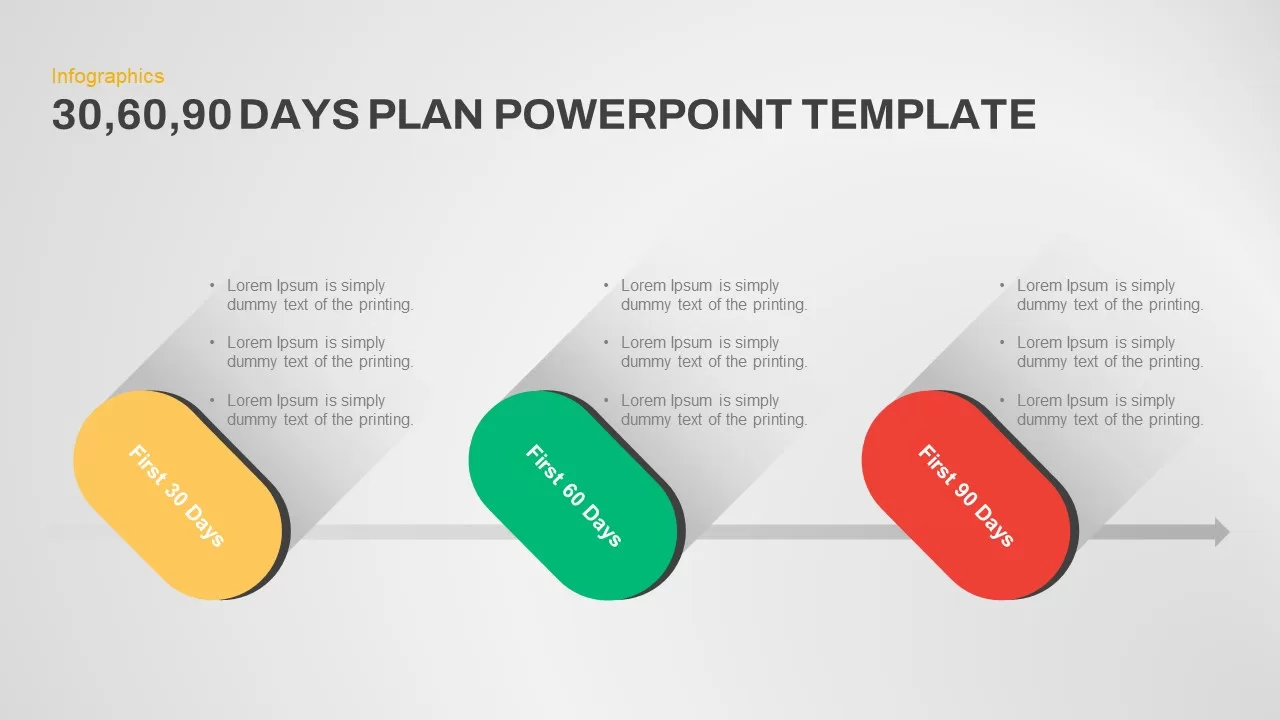
Pill-Style 30-60-90 Timeline Infographic Template for PowerPoint & Google Slides
Timeline
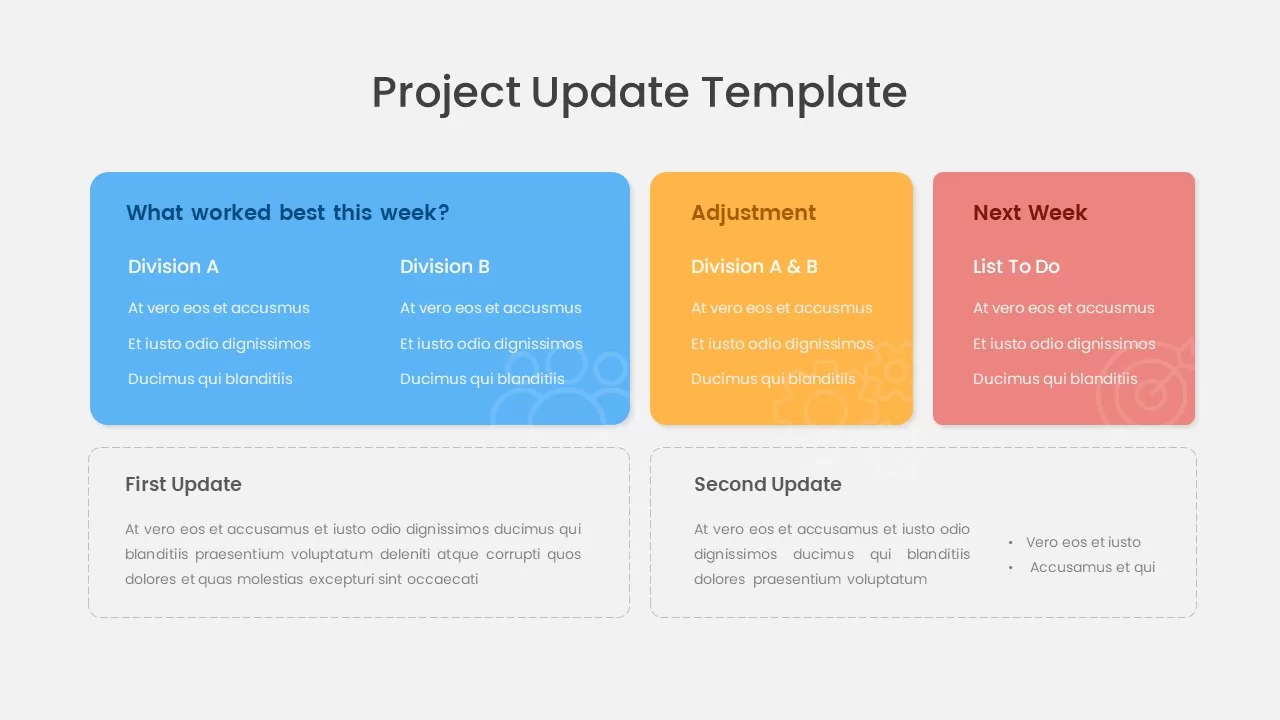
Project Update & Timeline Infographic Template for PowerPoint & Google Slides
Business
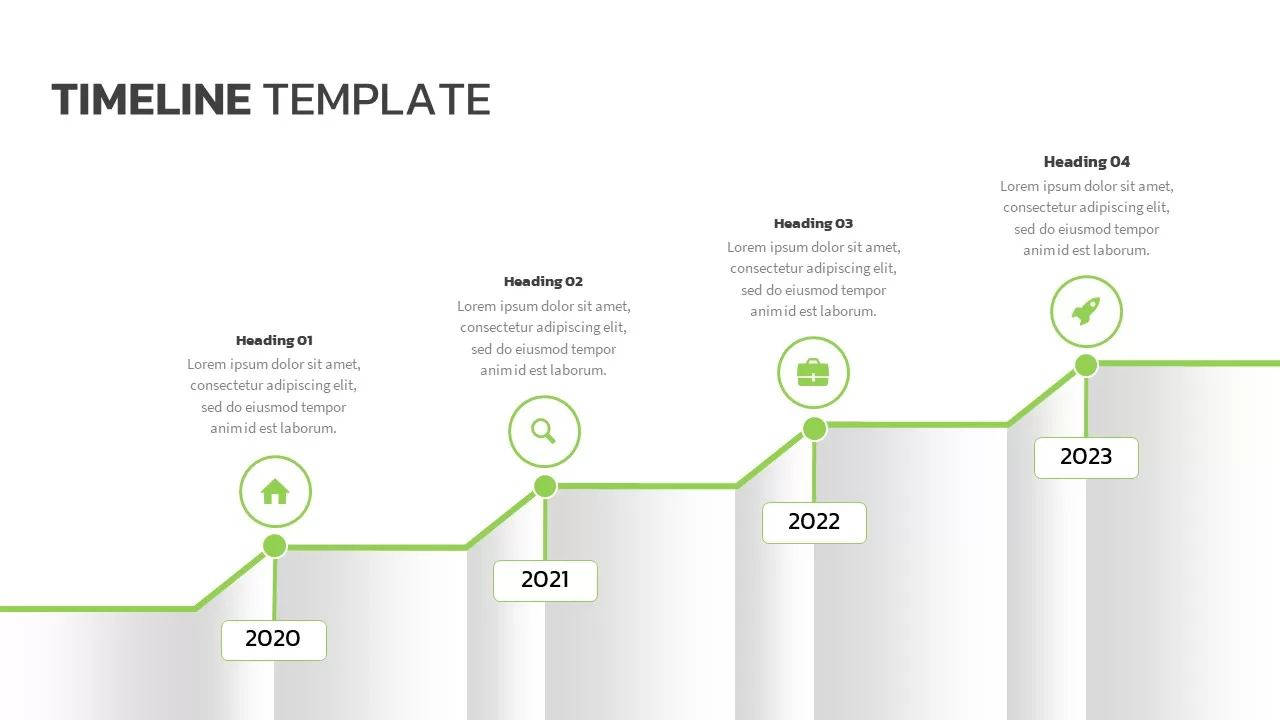
Modern Green Timeline Infographic Template for PowerPoint & Google Slides
Timeline
Free Multi-Year Arrow Timeline Infographic Template for PowerPoint & Google Slides
Timeline
Free
Free Five-Step Circular Timeline Infographic Template for PowerPoint & Google Slides
Timeline
Free
Free Colorful Roadmap Timeline Infographic Template for PowerPoint & Google Slides
Roadmap
Free
Timeline Infographic Steps template for PowerPoint & Google Slides
Business Plan
Six Core Values Infographic Timeline Template for PowerPoint & Google Slides
Comparison
Colorful Agenda Timeline Infographic Template for PowerPoint & Google Slides
Agenda
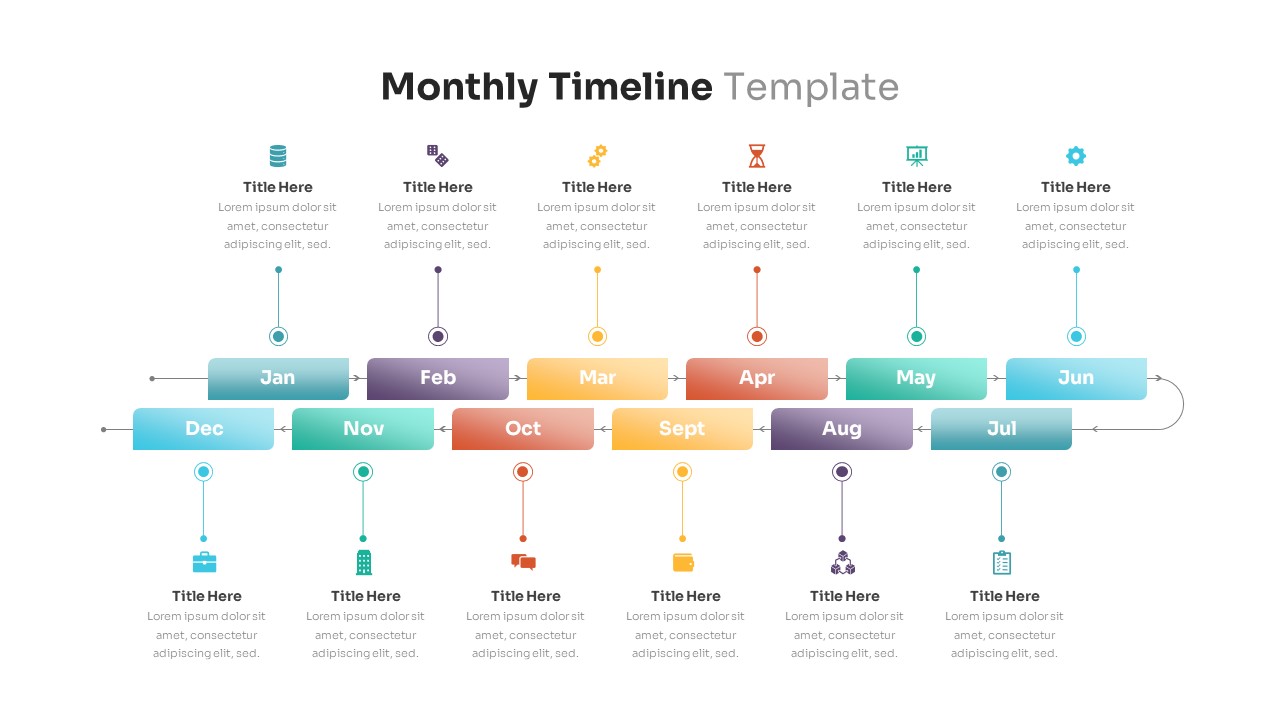
Editable Monthly Timeline Infographic Template for PowerPoint & Google Slides
Timeline
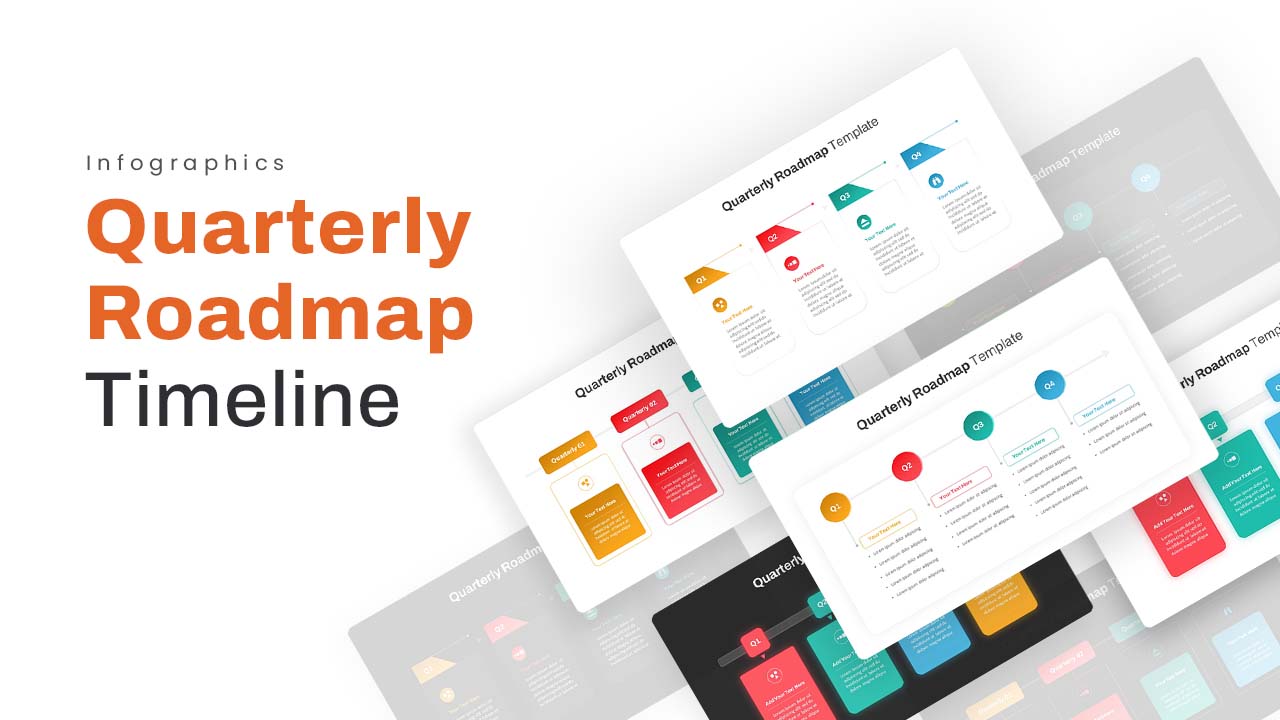
Quarterly Roadmap Timeline Infographic Template for PowerPoint & Google Slides
Timeline
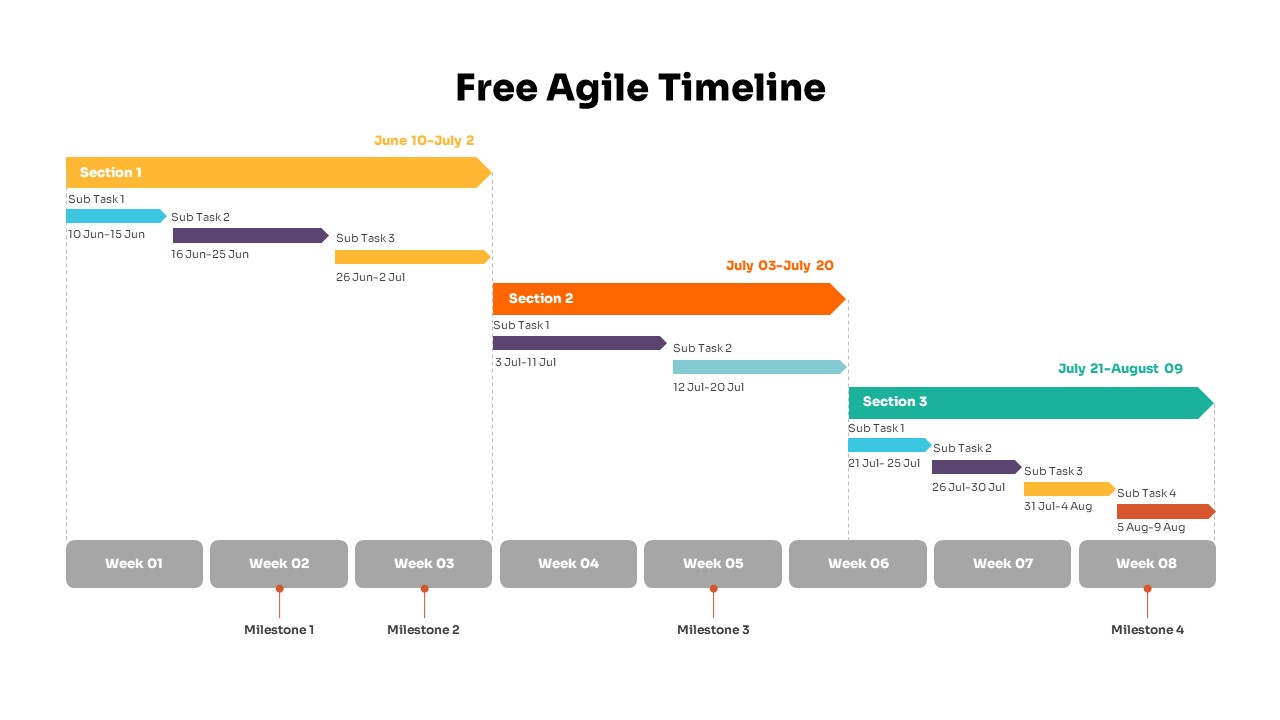
Colorful Agile Timeline Infographic Template for PowerPoint & Google Slides
Timeline
Free
Dynamic Chevron Timeline Infographic Template for PowerPoint & Google Slides
Timeline
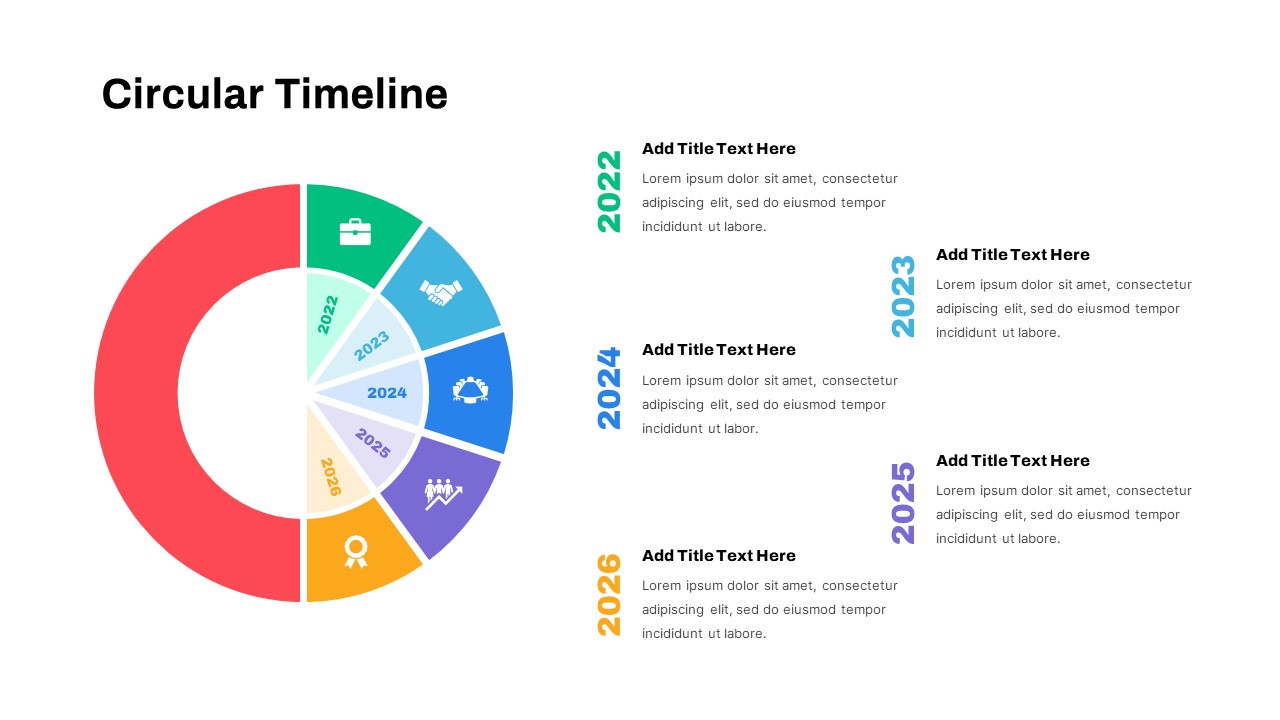
Circular Timeline Infographic Template for PowerPoint & Google Slides
Timeline
Quarterly Timeline Infographic Template for PowerPoint & Google Slides
Timeline
Minimalist Timeline Infographic Template for PowerPoint & Google Slides
Timeline
High-Level Timeline Infographic Template for PowerPoint & Google Slides
Timeline
Modern Six-Point Timeline Infographic Template for PowerPoint & Google Slides
Timeline
Fishbone Timeline Infographic Series Template for PowerPoint & Google Slides
Manufacturing
Personal Timeline Infographic Template for PowerPoint & Google Slides
Timeline
Brief History Timeline Infographic Template for PowerPoint & Google Slides
Timeline
Project Milestone Timeline Infographic Template for PowerPoint & Google Slides
Timeline
Curved Road Timeline Infographic Template for PowerPoint & Google Slides
Timeline
Dark Horizontal Timeline Infographic Template for PowerPoint & Google Slides
Timeline
Strategy Roadmap Timeline Slides Template for PowerPoint & Google Slides
Roadmap
10 Stage Business Milestone Timeline PowerPoint Template for PowerPoint & Google Slides
Timeline
Google Ads Optimization & Performance Infographic Template for PowerPoint & Google Slides
Digital Marketing
Investor Timeline template for PowerPoint & Google Slides
Timeline

Dynamic Circle Timeline Infographics template for PowerPoint & Google Slides
Timeline
Process Timeline Infographics Design template for PowerPoint & Google Slides
Timeline
Five-Point Circle Timeline Diagram Template for PowerPoint & Google Slides
Timeline
Curved Road Roadmap Timeline Diagram Template for PowerPoint & Google Slides
Roadmap
Wavy Ribbon Timeline Infographics Template for PowerPoint & Google Slides
Timeline
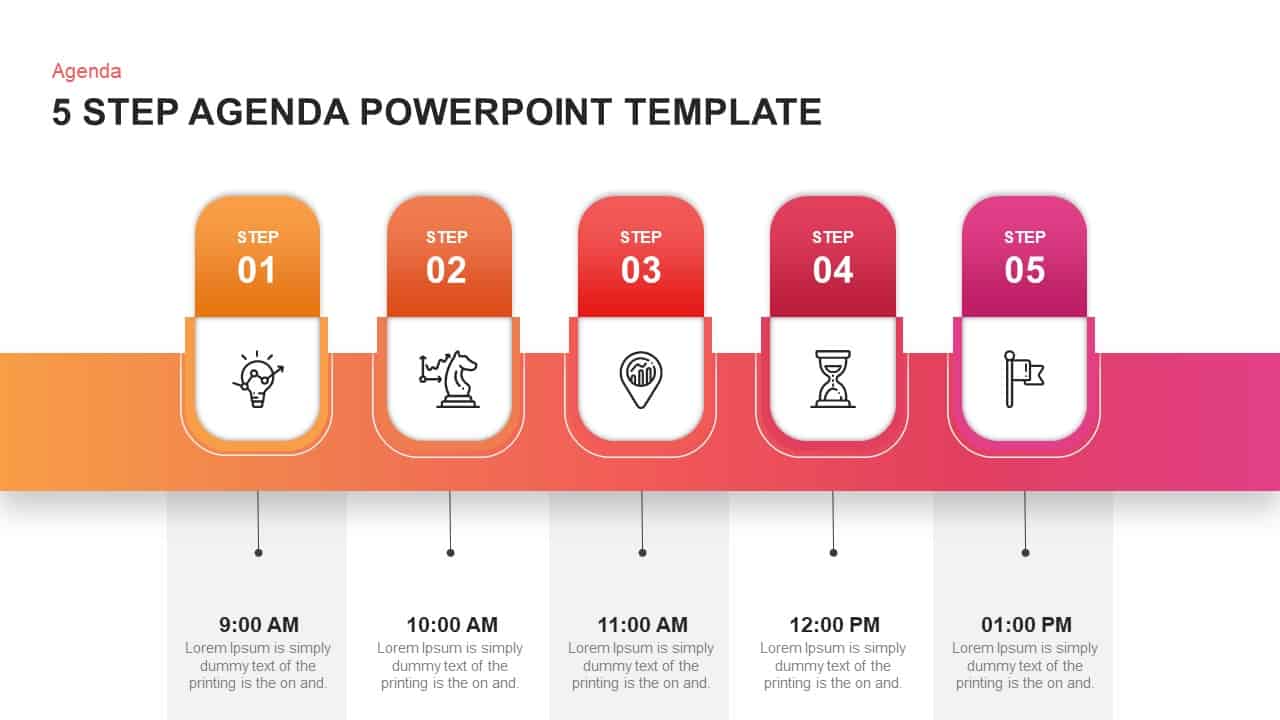
Five-Step Gradient Agenda Timeline Template for PowerPoint & Google Slides
Agenda
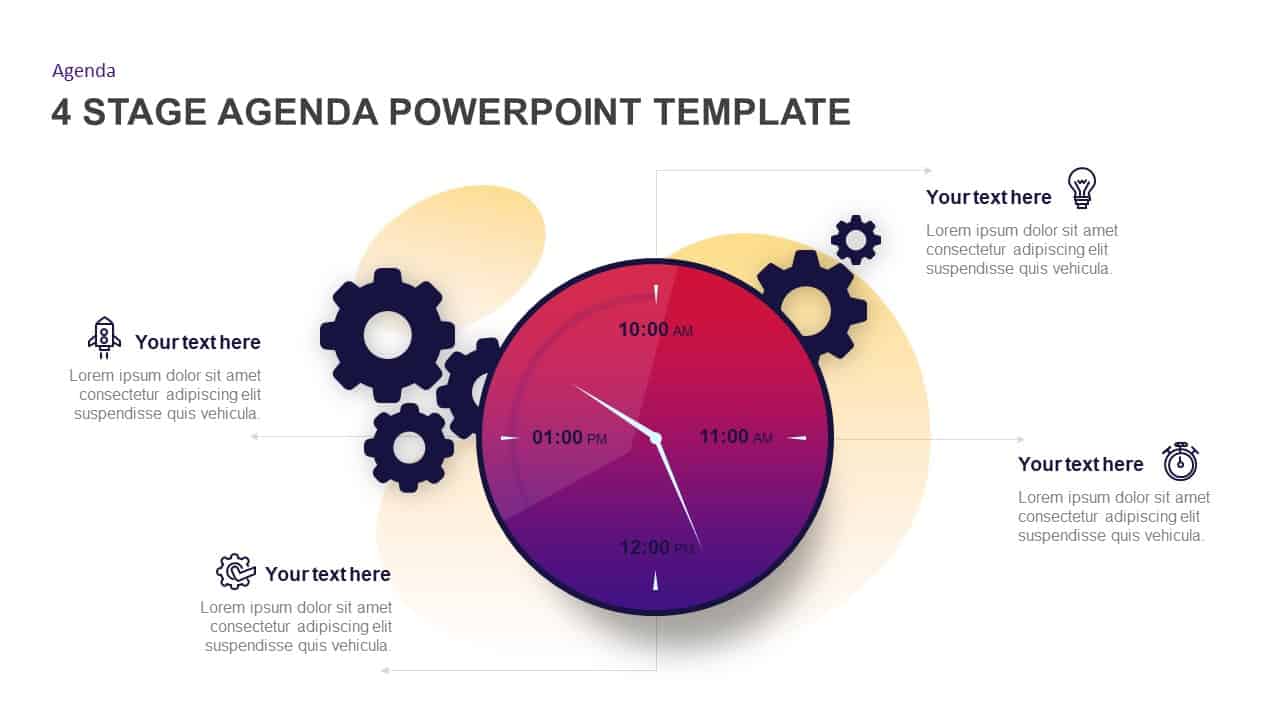
Gradient Clock Agenda Timeline Diagram Template for PowerPoint & Google Slides
Agenda
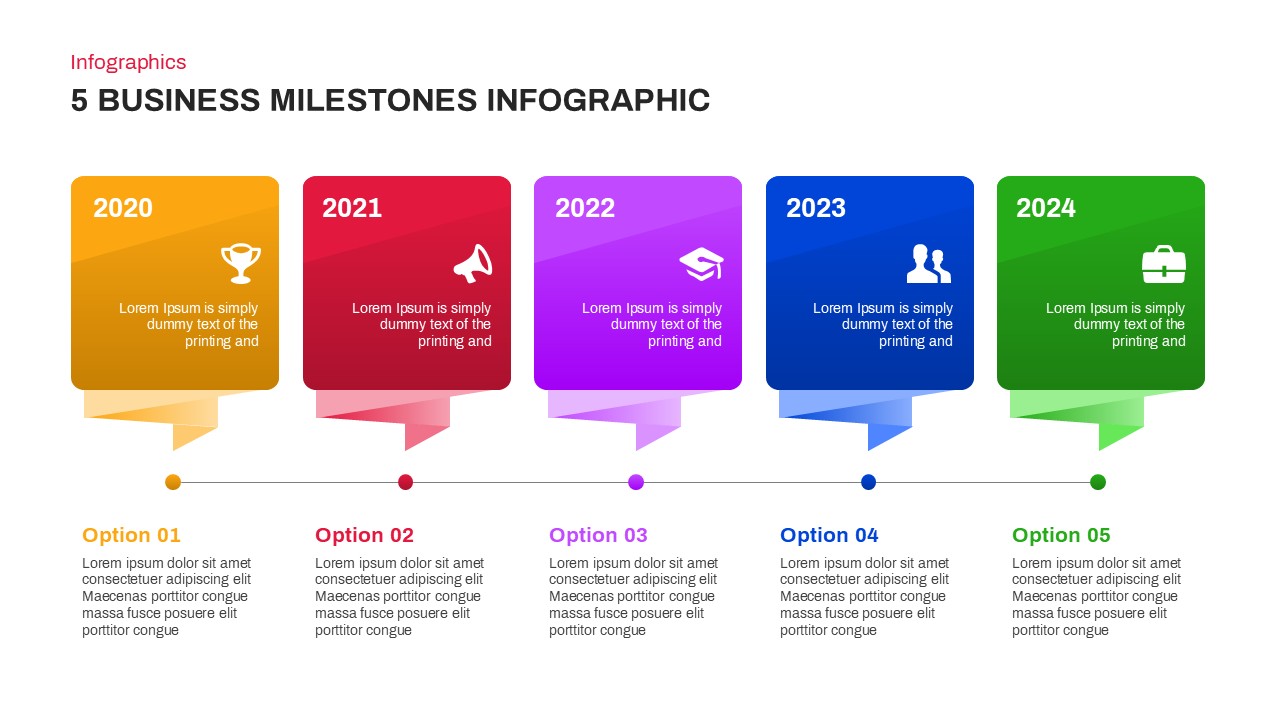
5 Business Milestones Timeline Template for PowerPoint & Google Slides
Timeline
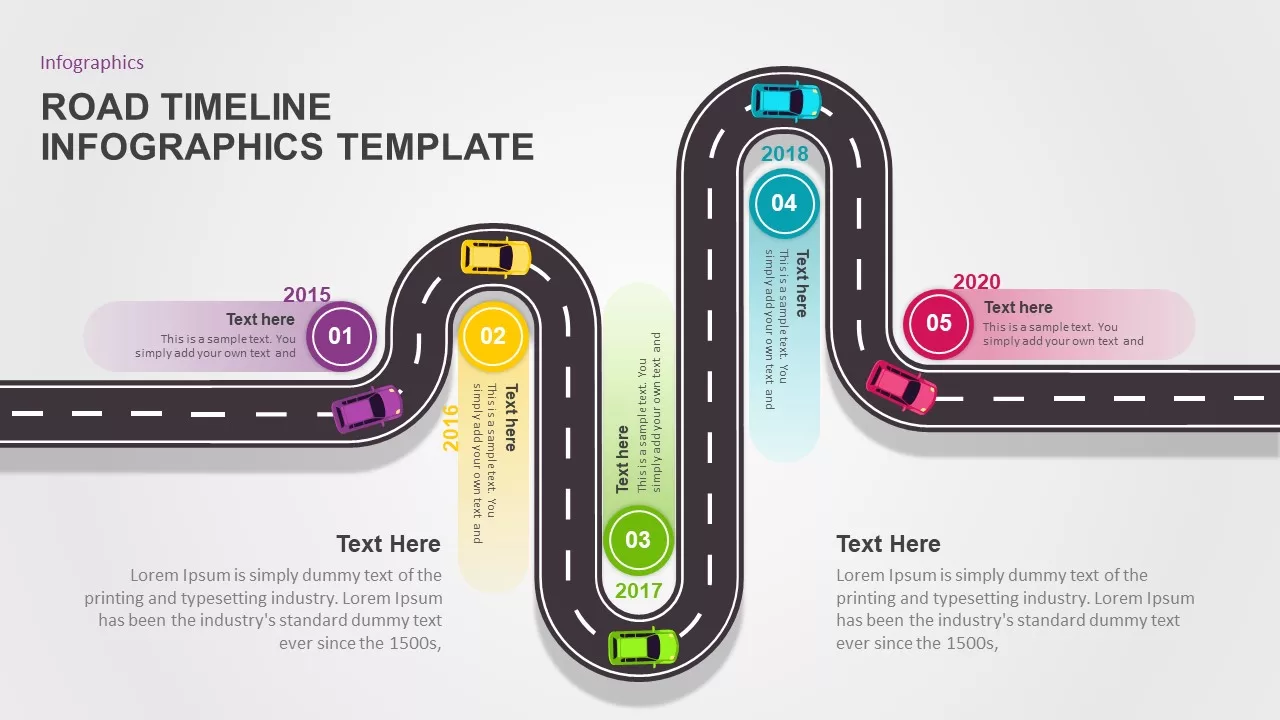
Road Timeline Infographics Template for PowerPoint & Google Slides
Timeline
Clock-Timeline Nine-Stage Agenda Template for PowerPoint & Google Slides
Agenda
Project Timeline Management template for PowerPoint & Google Slides
Infographics
Free Winding Road Timeline Milestones Template for PowerPoint & Google Slides
Roadmap
Free
Profile Slide with Timeline & Skills Template for PowerPoint & Google Slides
Our Team
Multi-Color Milestone Timeline Layout Template for PowerPoint & Google Slides
Timeline
Delivery Timeline Multi-Row Template for PowerPoint & Google Slides
Timeline
Professional Milestone Timeline Chart Template for PowerPoint & Google Slides
Timeline
Agile Project Roadmap Timeline Template Pack for PowerPoint & Google Slides
Scrum
Multicolor Alternating Timeline Roadmap Template for PowerPoint & Google Slides
Timeline
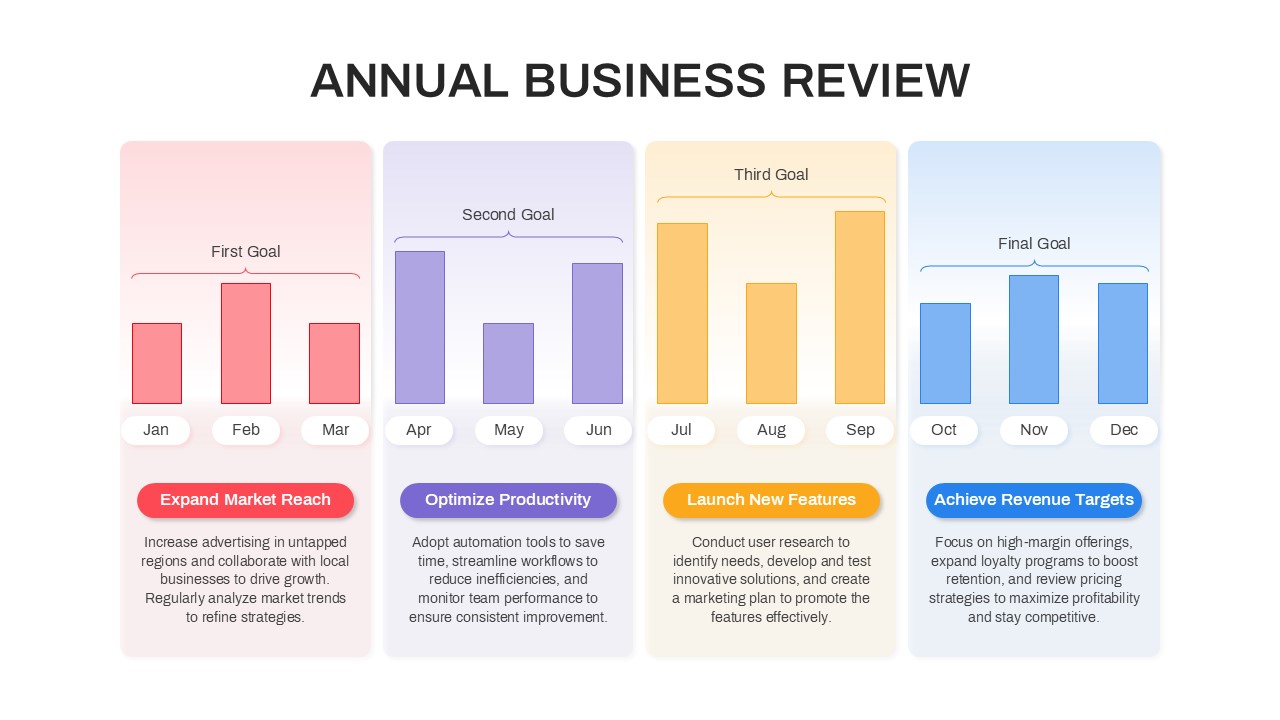
Annual Business Review Timeline Template for PowerPoint & Google Slides
Timeline
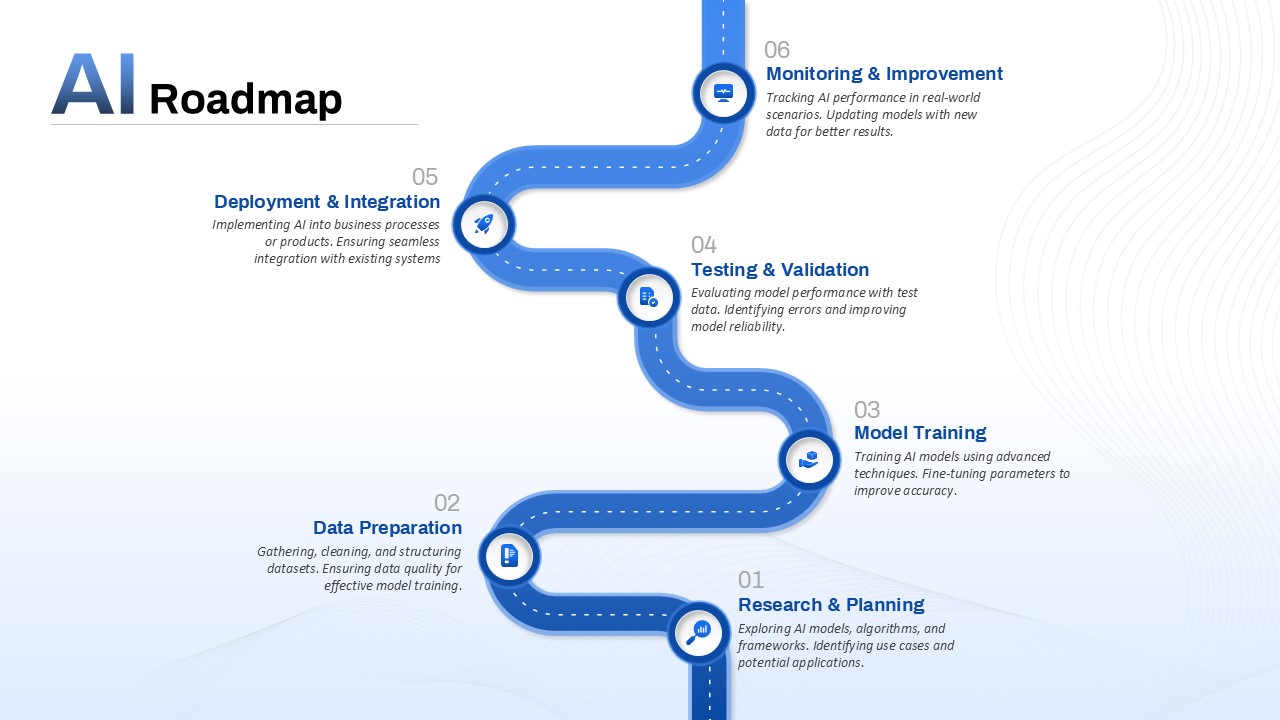
AI Roadmap & Planning Timeline Template for PowerPoint & Google Slides
Roadmap
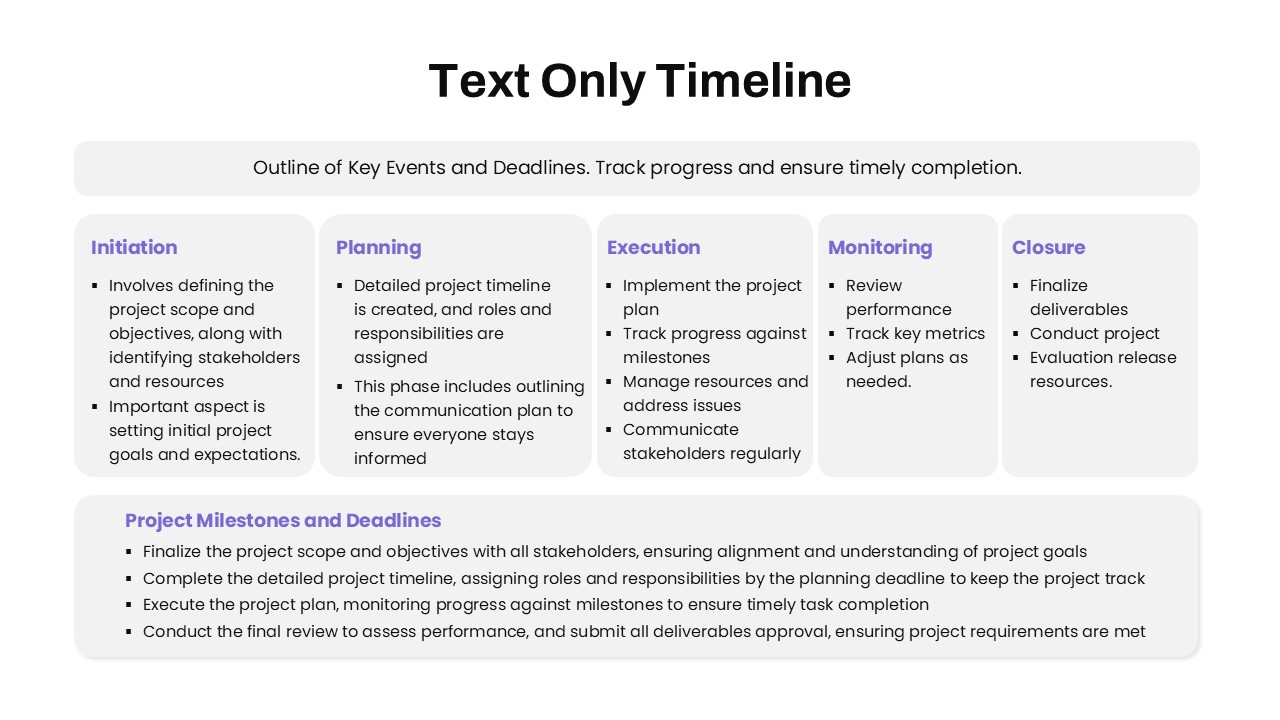
Text-Only Five-Phase Timeline Template for PowerPoint & Google Slides
Timeline
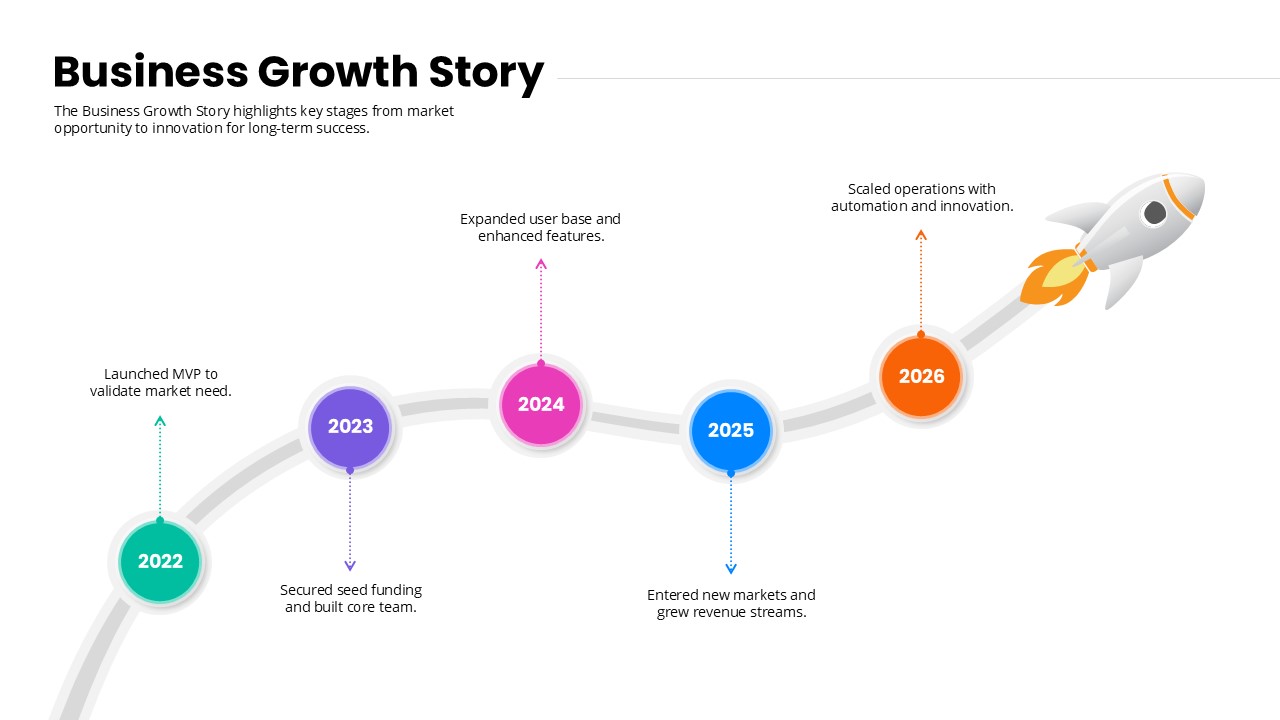
Business Growth Story timeline template for PowerPoint & Google Slides
Timeline