Editable USA Map with Data-Driven Bar Chart Template

Description
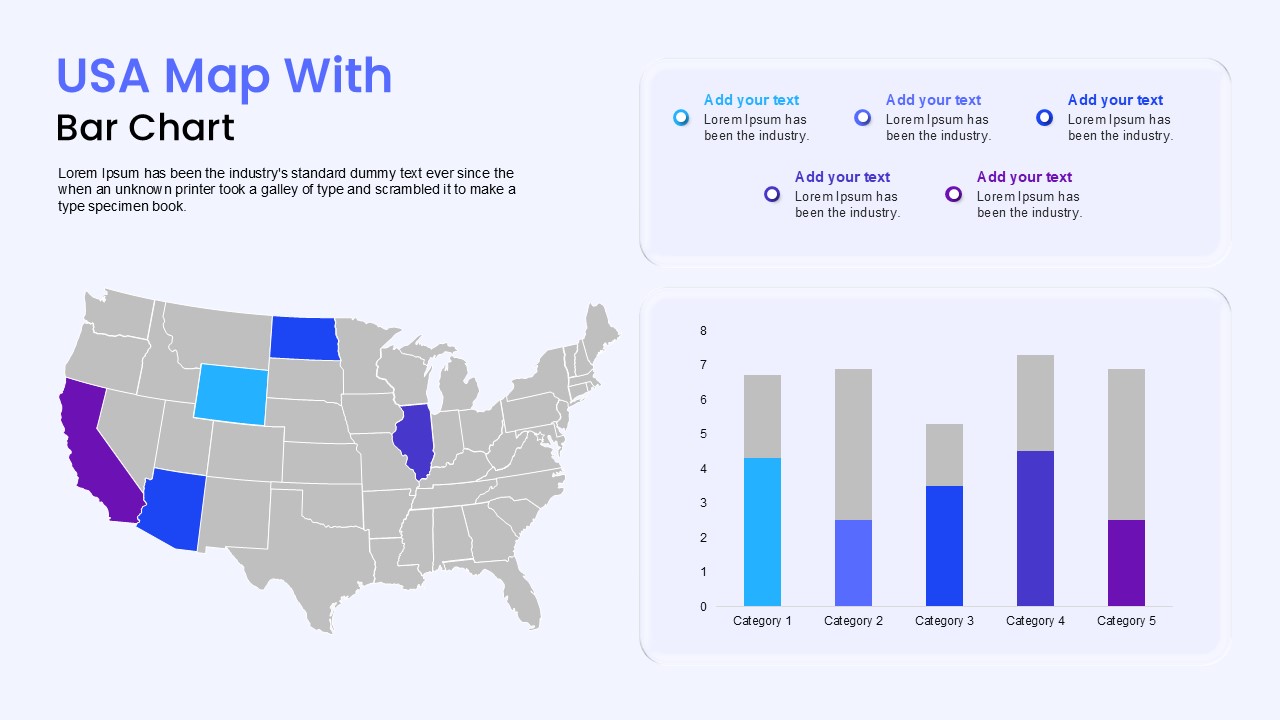
The USA Map with Data-Driven Bar Chart Template for PowerPoint & Google Slides offers a visually engaging way to combine geographic insights with comparative data analysis. The left side of the slide presents a detailed USA map with selected states highlighted in vibrant colors, making it easy to emphasize key regions for sales, marketing, or demographic studies. On the right, a clean bar chart allows you to display quantitative data across categories, enabling quick comparisons and pattern recognition.
This dual-layout design helps presenters link location-based information with numerical performance, making it particularly useful for reporting regional business growth, market share, or operational statistics. The map highlights can be customized by color to reflect specific states of interest, while the bar chart supports fully editable values, ensuring quick adaptation to changing datasets. A supporting text panel at the top provides space for key insights, labels, or legends, helping audiences contextualize the presented data.
The sleek, modern design with balanced use of color enhances readability and visual appeal, ensuring clarity in professional and academic presentations alike. Fully compatible with both PowerPoint and Google Slides, this template allows seamless integration with existing presentations and branding requirements.
Who is it for
This template is perfect for business analysts, marketers, sales managers, and consultants who need to present U.S. regional performance data. It is also beneficial for educators, researchers, and policy professionals looking to visualize geographic trends alongside supporting statistics.
Other Uses
Beyond business reporting, this slide can be used for illustrating population demographics, election results, regional survey outcomes, academic research, or even educational lessons in geography and economics. Its flexible combination of map and chart ensures adaptability across industries.
Login to download this file


