Requirements Traceability Matrix Template PowerPoint
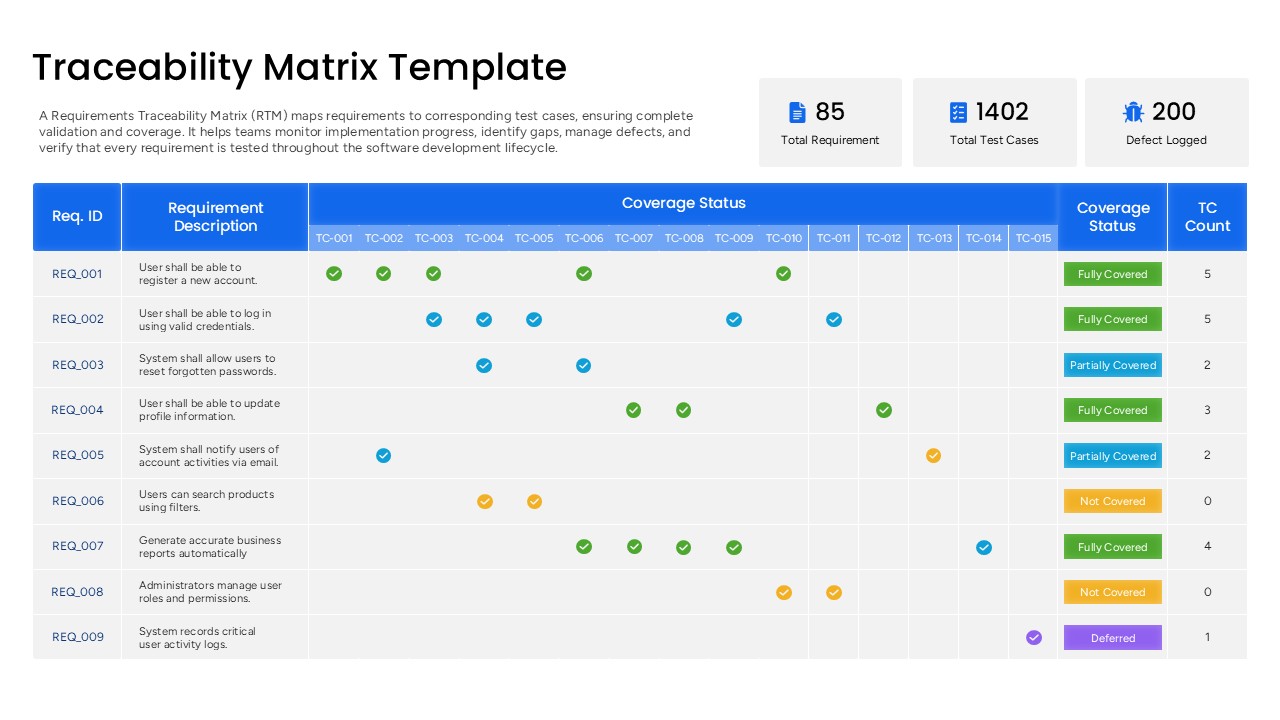
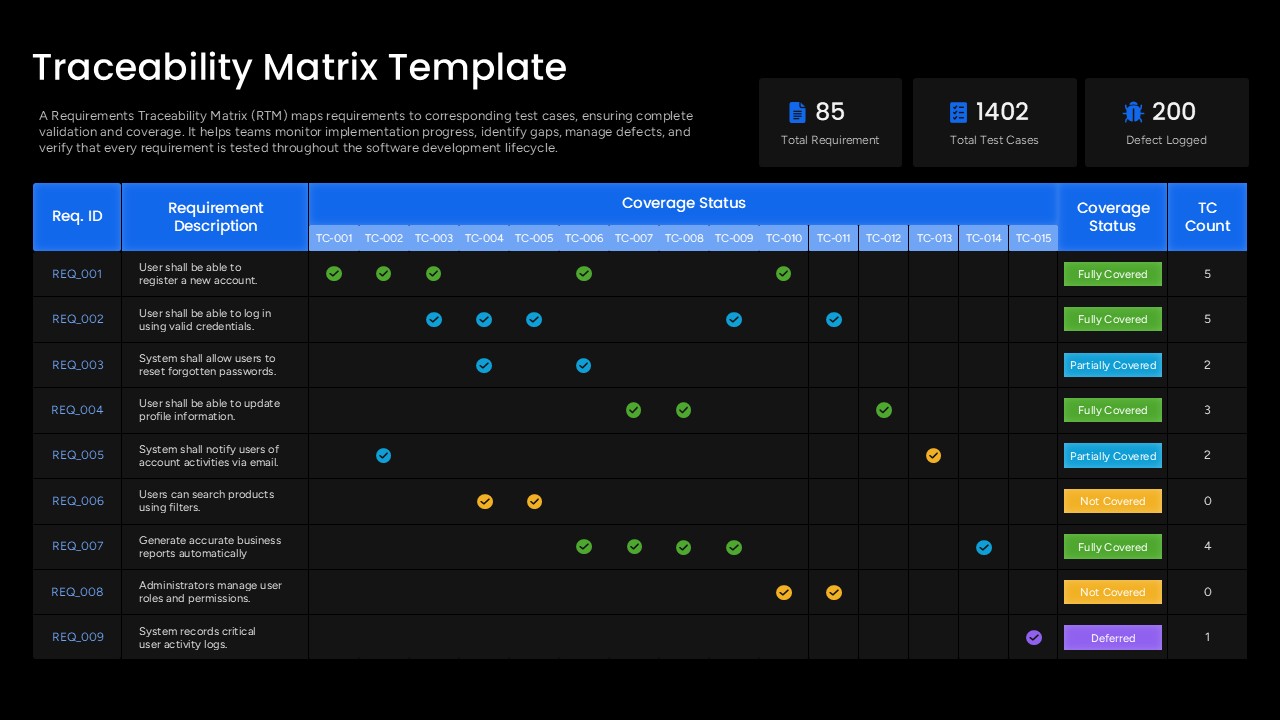
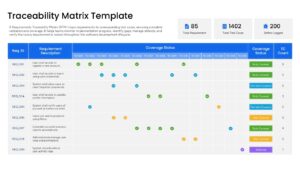
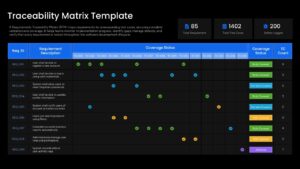
A Requirements Traceability Matrix(RTM), is a project management document that maps every requirement to its corresponding test cases, so quality assurance teams can confirm complete validation and catch coverage gaps before a product ships. Without this kind of matrix, teams often lose track of which requirements have been tested, which are only partially verified, and which have no test coverage at all, a gap that frequently surfaces late in a project when it is most expensive to fix. This Requirements Traceability Matrix PowerPoint template turns that tracking process into a single structured slide, opening with three summary metric cards showing Total Requirements, Total Test Cases, and Defect Logged counts, followed by a detailed grid mapping nine requirement rows against fifteen test case columns.
Each row in this presentation slide represents one requirement, described in plain language such as user registration, login validation, or password reset, with colored checkmarks across the test case columns showing exactly which test cases apply to that requirement. A Coverage Status column on the right classifies each requirement as Fully Covered, Partially Covered, Not Covered, or Deferred, using green, blue, orange, and purple tags respectively, while a final column totals the test case count per requirement:
- Fully Covered – All necessary test cases have been mapped and executed against the requirement
- Partially Covered – Some test cases exist, but coverage is incomplete
- Not Covered – No test case has yet been mapped to the requirement, flagging a testing gap
- Deferred – Testing has been intentionally postponed to a later cycle
Why Teams Rely on a Visual Traceability Matrix
Presenting this data as a PowerPoint presentation rather than a raw spreadsheet makes gaps immediately visible during sprint reviews, audits, or client-facing status meetings, since color-coded status tags draw attention to Not Covered and Partially Covered rows that need follow-up. As a fully editable PPT template, every requirement row, test case column, status tag, and summary metric can be updated, expanded, or recolored to reflect a specific project’s actual requirements and test data. QA leads and project managers use this PowerPoint template during release readiness reviews to confirm coverage before go-live, while business analysts use the same slide to demonstrate requirement traceability to stakeholders and auditors in regulated industries. Download this Traceability Matrix PowerPoint presentation and edit it now.
Frequently Asked Questions
Can I add more requirements and test cases to this template?
Which version should I use, the light theme or the dark theme?
Login to download this file

Item ID
SB06056Designed By
Naseeba Sithara


Related Templates

Requirements Analysis PowerPoint Template
Business Requirements
Agile Requirements Gathering PowerPoint Template
Scrum
Funding Requirements Template
Finance
RASCI Matrix Template for PowerPoint and Google slides
Infographics
RASCI Responsibility Matrix Chart Template for PowerPoint & Google Slides
Business

RACI Matrix PowerPoint Template and SlideDiagram
Project
Concentric Marketing Matrix Slide Template for PowerPoint & Google Slides
Circular
Eisenhower Matrix PowerPoint Template
Comparison Chart

Nine Field Matrix Diagrams PowerPoint Template
Comparison Chart
Social Styles Matrix PowerPoint template
Business
Competitive Landscape Matrix Template for PowerPoint & Google Slides
Comparison
Risk Assessment Heatmap Matrix Template
Comparison Chart
Matrix PowerPoint Template
Business Models
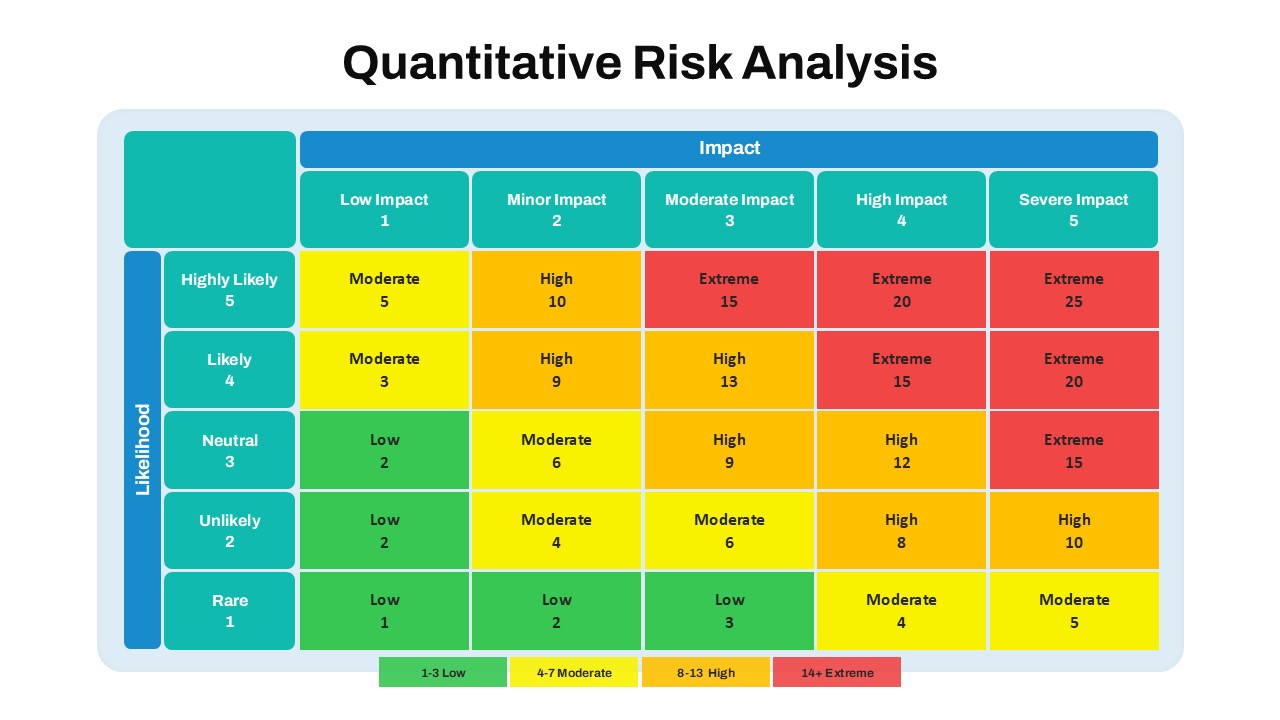
Quantitative Risk Analysis Matrix Template
Risk Management
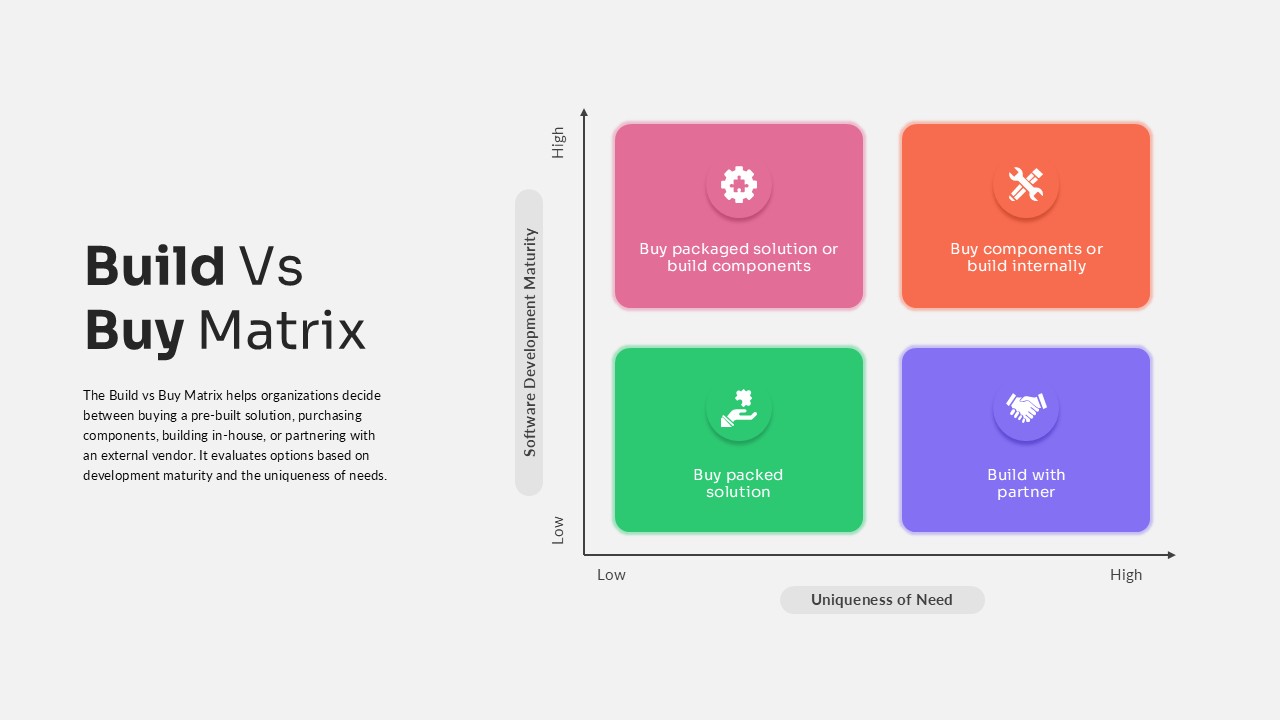
Build vs Buy Matrix Decision Framework template PPT
Business Strategy
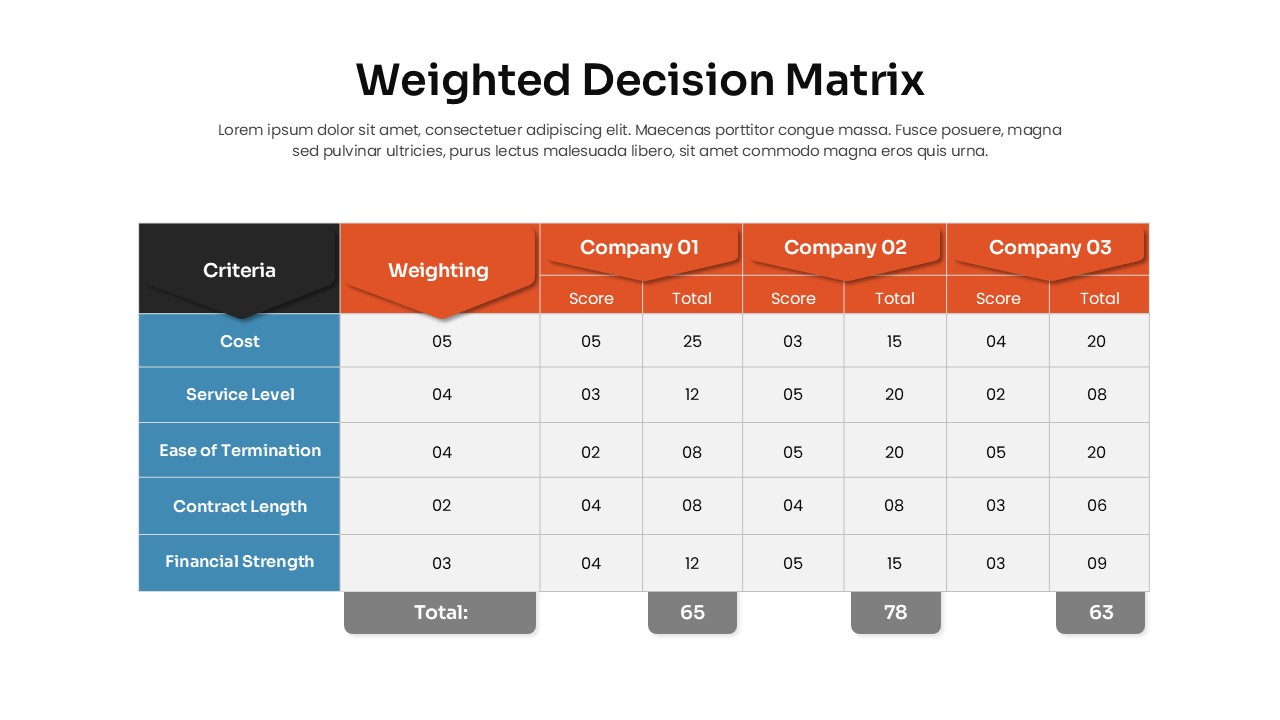
Weighted Decision Matrix PowerPoint Template
Business Models
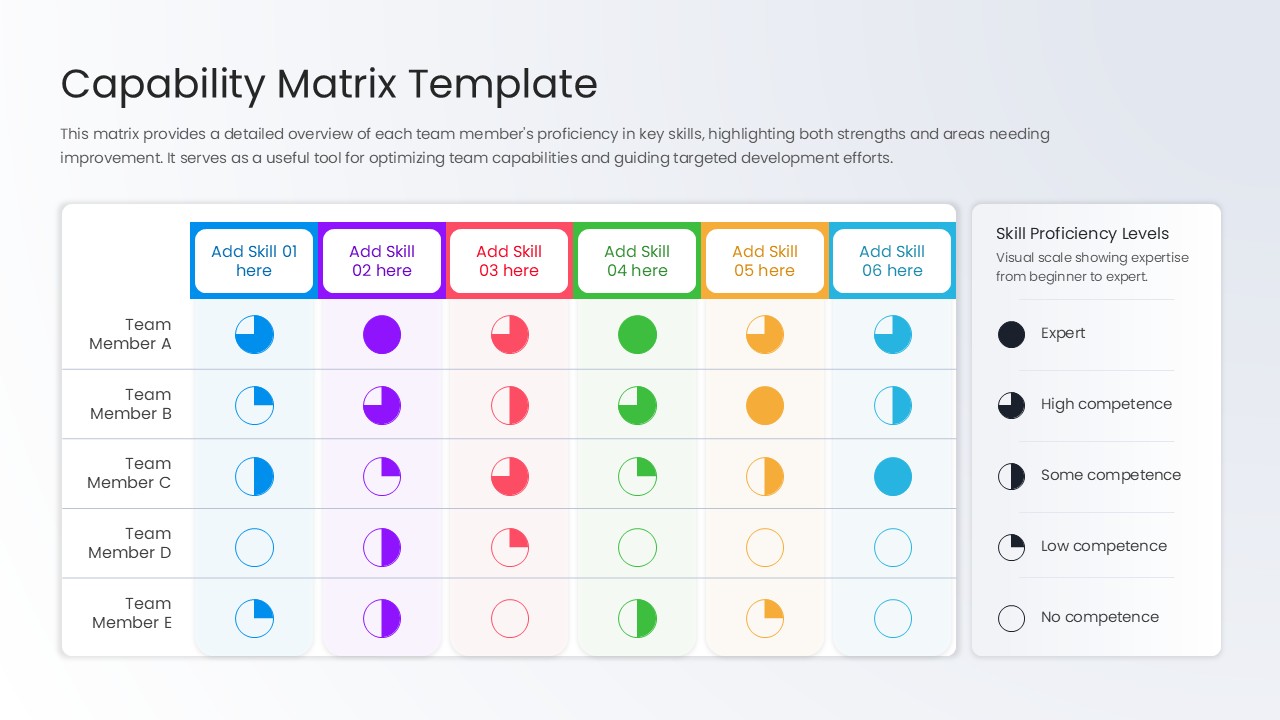
Capability Matrix PowerPoint Template
HR
WOW Matrix Template
Business Strategy
Hoshin Kanri Template for PPT & Google Slides Theme
Business Strategy
Materiality Assessment Matrix Diagram Template for PowerPoint & Google Slides
Risk Management