Thermometer Measurement Diagram for PowerPoint & Google Slides
Description
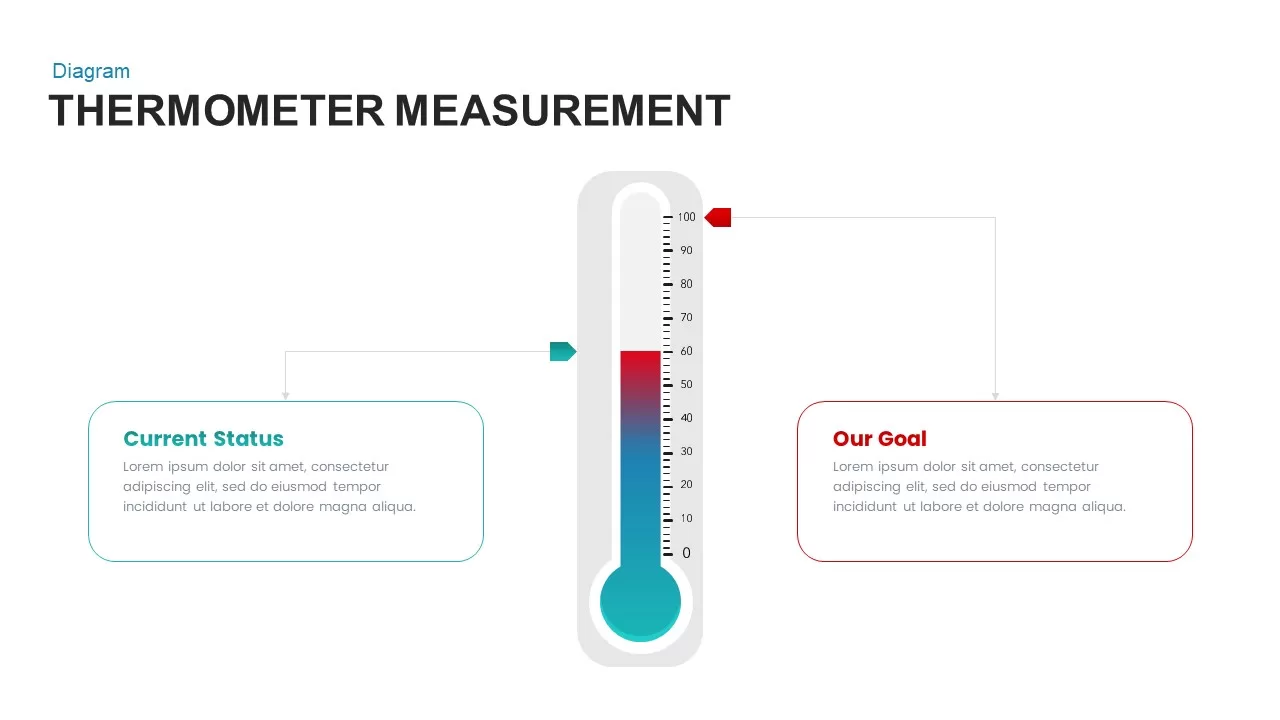
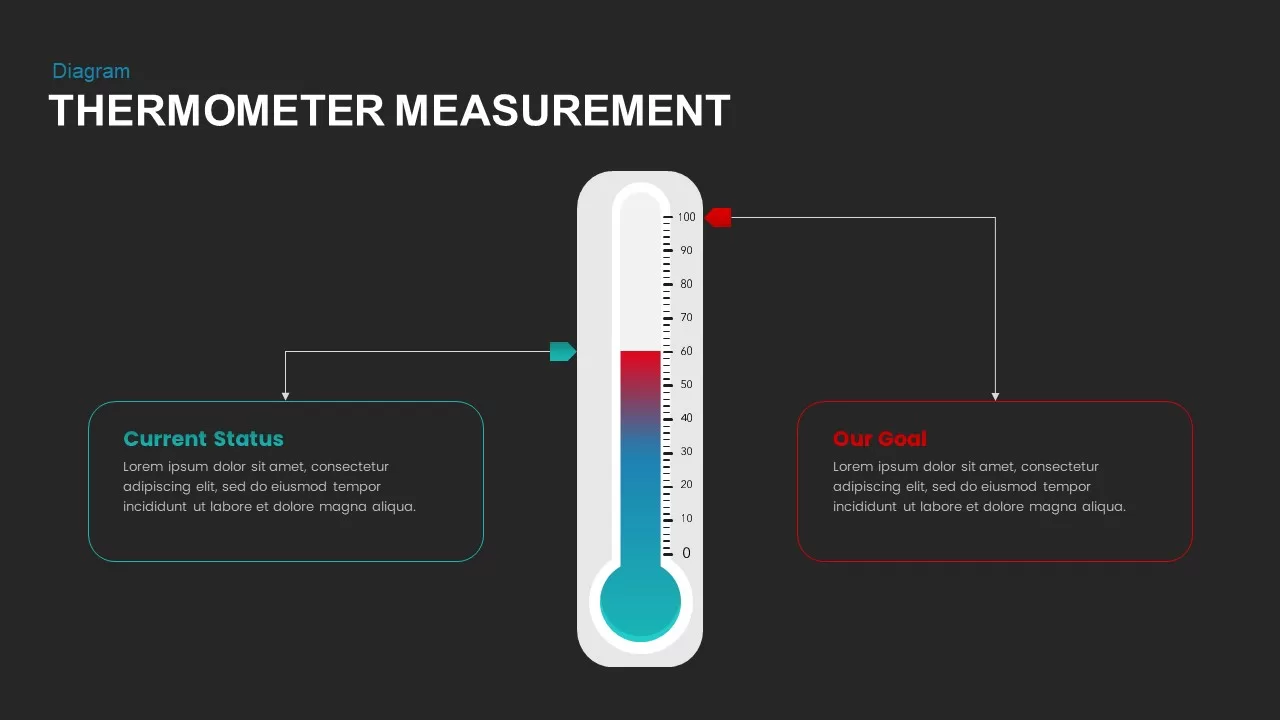
This Thermometer Measurement diagram slide provides an engaging way to visually display the current status and target goals. It features a thermometer graphic with a color gradient that illustrates the measurement progress, clearly highlighting where the current status and desired goal lie. The left side is dedicated to displaying the current status with a teal arrow pointing to the thermometer’s level, while the right side shows the goal with a red arrow, allowing for easy comparison. This layout is simple yet highly effective for presenting data or progress toward objectives in an easily digestible visual format.
This slide is customizable, allowing you to edit the thermometer and text to fit any relevant context, from project status updates to performance metrics or goal tracking. The modern design ensures that this slide will integrate smoothly into any professional presentation, enhancing the clarity of your message.
Whether you’re presenting to stakeholders, clients, or team members, this diagram can help quickly communicate where you stand and where you’re aiming to go. The editable nature of the slide ensures flexibility across a range of industries, from business and project management to education and health.
Who is it for
This slide is ideal for project managers, business analysts, marketing teams, and educators who need to present progress and goals in a clear, engaging way. It will also benefit team leaders and executives who wish to communicate key performance indicators and targets during meetings or reports.
Other Uses
Beyond progress tracking, this thermometer diagram can be adapted for use in displaying customer satisfaction scores, budget tracking, or milestone achievements. It can also be repurposed for use in health data visualizations, such as tracking patient recovery or medication progress. With slight modifications, this versatile slide can support various use cases across industries.
Login to download this file

Item ID
SB00776
Related Templates

Thermometer Measurement Timeline Diagram Template for PowerPoint & Google Slides
Timeline
Thermometer Gauge Progress Measurement Template for PowerPoint & Google Slides
Comparison
Multi-Variation Thermometer Chart Template for PowerPoint & Google Slides
Bar/Column
Dynamic Fundraising Thermometer Slide Template for PowerPoint & Google Slides
Revenue
Snake Diagram Pack of 8 Slides template for PowerPoint & Google Slides
Process
Gear Process Diagram PowerPoint Template for PowerPoint & Google Slides
Process
Sales Process Workflow Funnel Diagram PowerPoint Template for PowerPoint & Google Slides
Funnel
Puzzle Diagram PowerPoint Template for PowerPoint & Google Slides
Process
Transportation Logistics PowerPoint Diagram template for PowerPoint & Google Slides
Process
Emoji Scale PowerPoint Diagram for PowerPoint & Google Slides
Infographics
4 Step Problem Solving PowerPoint Diagram for PowerPoint & Google Slides
Process