team-efficiency-metaphor-powerpoint-and-keynote-template

Description
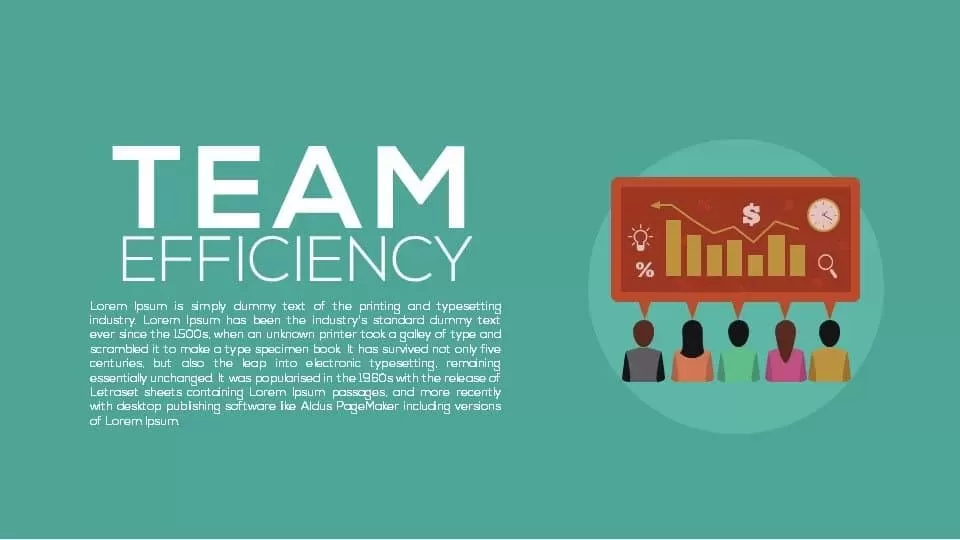
Leverage this Team Efficiency dashboard slide to communicate your group’s productivity, workflow optimization strategies, and performance targets with professional, modern design. The slide features a clean, flat-style illustration—silhouettes of team members facing a large presentation screen that displays key performance indicators like bar charts, percentage markers, and financial icons—set against a vibrant teal backdrop. A prominent title area on the left accommodates your main heading, subtitle, and supporting copy, while the right-hand graphic anchors the visual narrative. Fully editable vector graphics and a cohesive color palette maintain clarity and ensure your branding remains consistent across devices.
Crafted on master slides for both PowerPoint and Google Slides, this template offers intuitive drag-and-drop customization. Update data placeholders, swap icons, and adjust segment counts or connector lines in seconds without distortion. Preformatted chart objects and theme-linked color swatches streamline formatting, while built-in safe-zone guides help maintain balanced layouts. Choose from light or dark background variants, apply optional entrance animations, and leverage editable text styles to fine-tune typography and hierarchy across your entire deck. The asset’s full-resolution fidelity means crisp visuals even on large screens, eliminating formatting headaches during high-stakes presentations.
Beyond standard KPI reporting, this versatile slide integrates seamlessly into performance reviews, project status reports, and boardroom briefings. Its structured layout and clear visual cues enable audiences to quickly grasp complex data and align on strategic objectives. Whether illustrating productivity benchmarks, highlighting quarterly goals, or mapping resource allocations, this asset transforms raw metrics into an engaging narrative. Use the flexible placeholders to tailor the content for stakeholder updates, team-training sessions, or operational workshops, ensuring your message resonates with clarity and confidence.
Who is it for
Business leaders, project managers, and team leads who need to present efficiency metrics, productivity analyses, and performance dashboards will benefit from this slide. Marketing managers, HR professionals, and operations executives can leverage its visual metaphor to align teams, set objectives, and communicate progress in strategy workshops or executive reviews.
Other Uses
Beyond showcasing team performance, repurpose this slide for KPI reporting, financial overviews, sales pipeline summaries, and project status reports. Adapt the illustration to display customer journey metrics, product launch timelines, or training progress. With its versatile layout, you can also use the slide for investor pitch decks, departmental presentations, or process improvement roadmaps.
Login to download this file


