Stages Process Template for PowerPoint & Google Slides
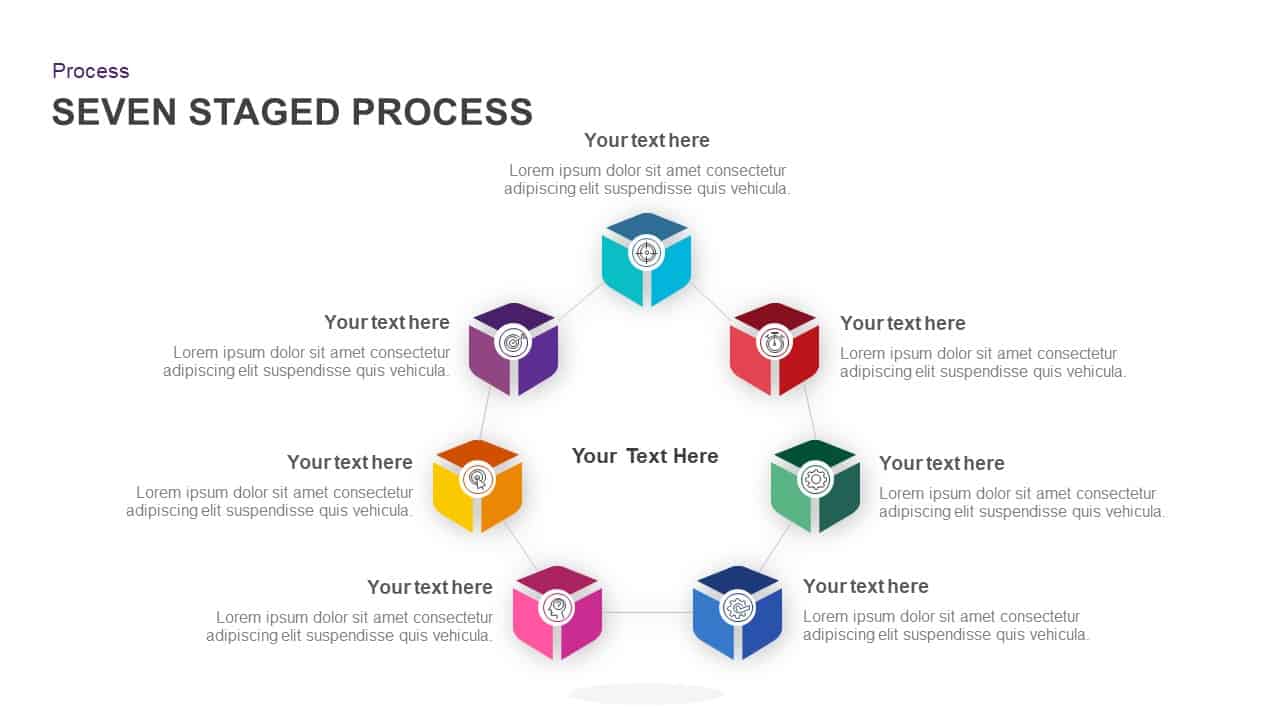
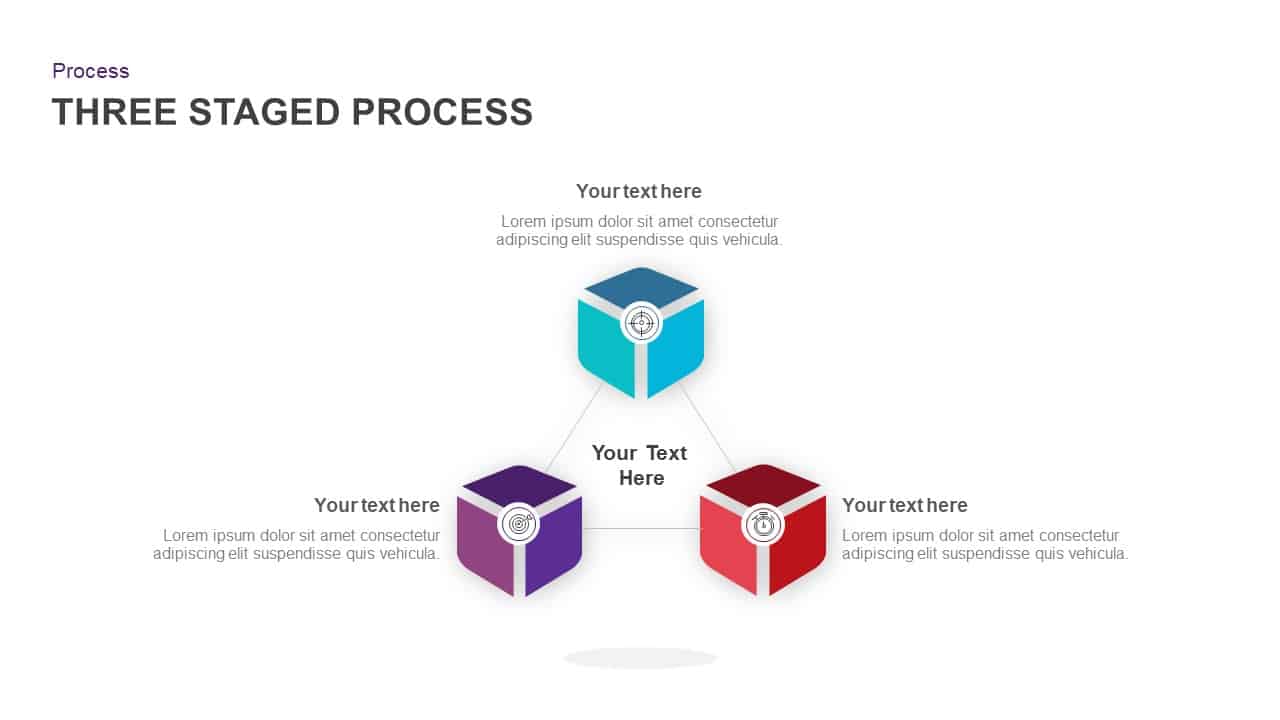


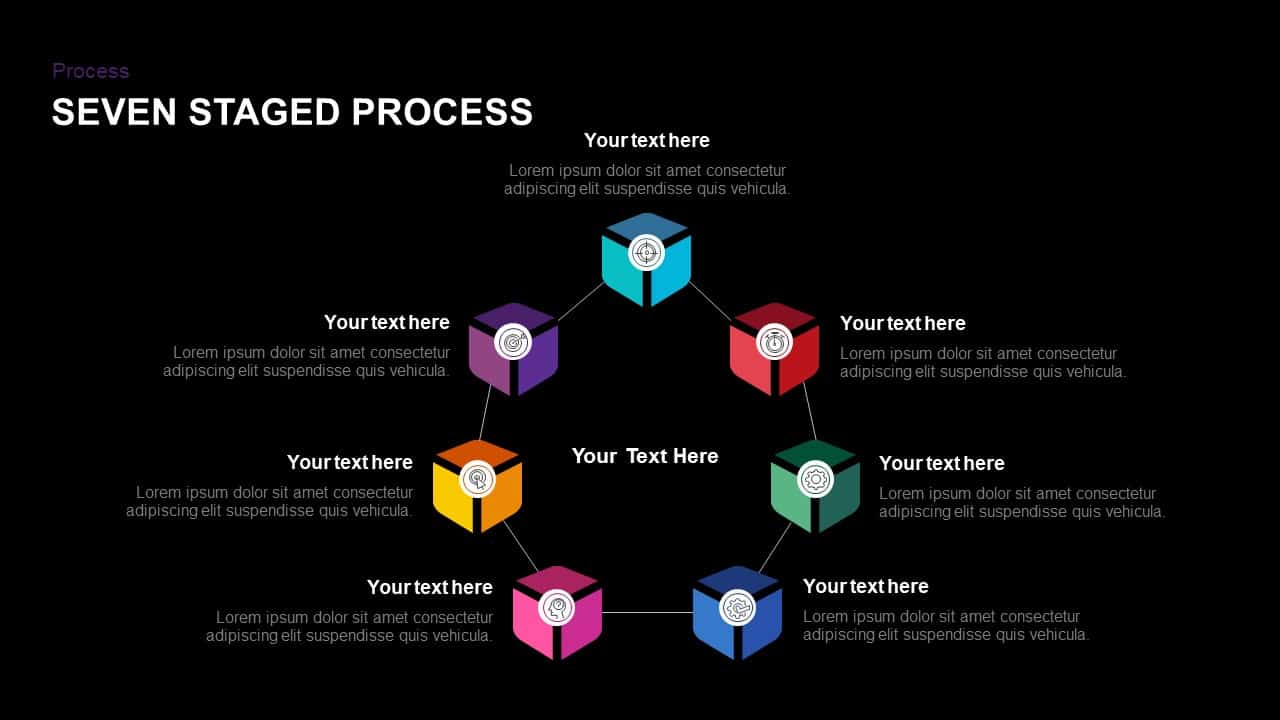

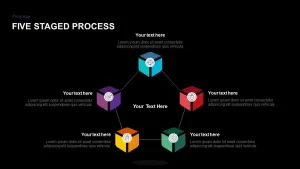
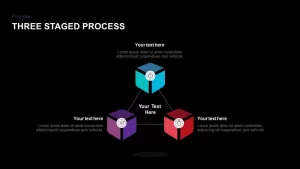
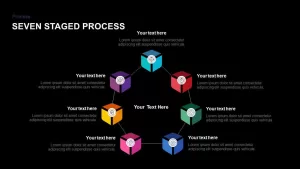
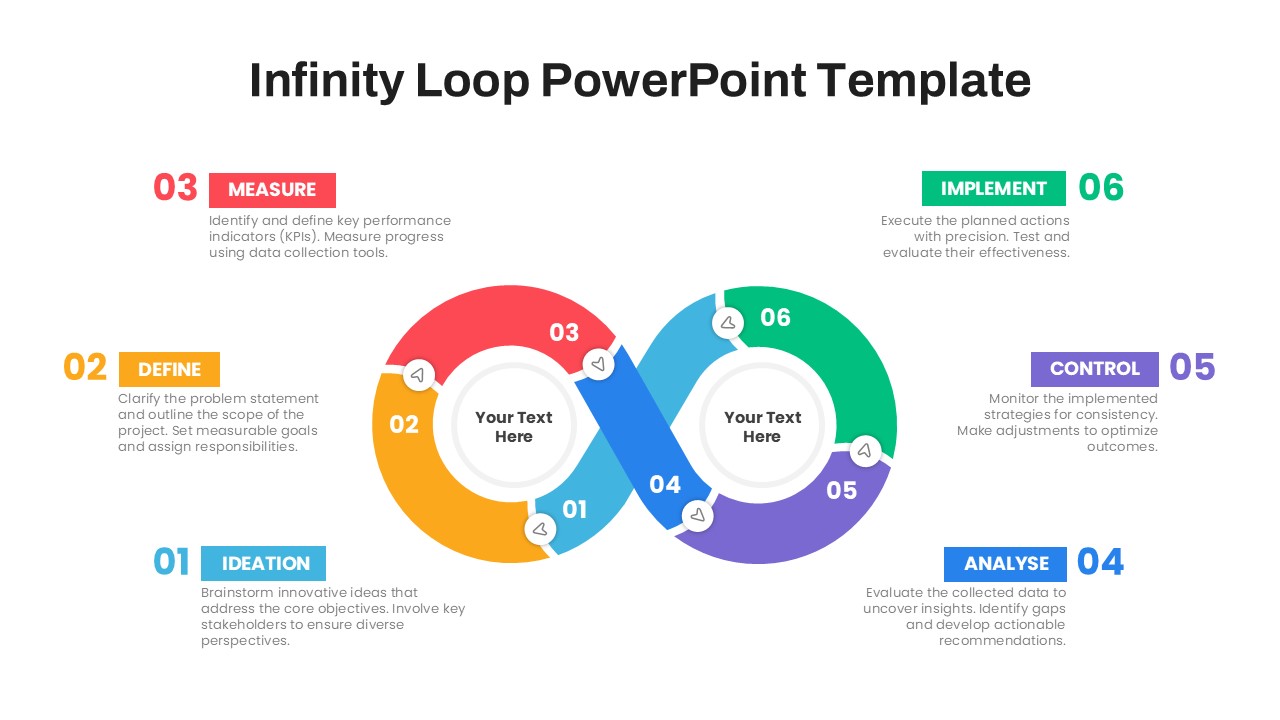
Visualize complex workflows with this seven-stage cyclic process infographic slide. Cyclic gradient-shaded 3D cubes form a seamless loop, each numbered 01 through 07 and topped with a crisp white icon to represent key phases—such as ideation, research, planning, execution, monitoring, optimization, and delivery. Fine connector lines link each cube to editable text callouts positioned around the cycle, allowing you to explain objectives, deliverables, or metrics with clarity. The clean white background and neutral gray typography ensure maximum readability, while the vibrant color transitions guide viewers’ eyes through the entire process.
Built on master slides with fully editable vector shapes, you can resize cubes, swap icons, adjust color gradients, and reposition callouts in seconds—maintaining perfect alignment across PowerPoint and Google Slides. Preconfigured animations reveal each stage sequentially, reinforcing the narrative flow and keeping audiences engaged. Whether you’re presenting project lifecycles, product development cycles, or strategic planning frameworks, this template turns multi-step processes into compelling visual stories that drive alignment and action.
Who is it for
Project managers, product owners, and strategy consultants will rely on this slide to break down iterative workflows, illustrate continuous improvement loops, and communicate end-to-end processes. Operations teams, marketing leads, and C-suite executives can leverage its clear progression to align stakeholders and benchmark performance.
Other Uses
Repurpose this layout for customer journey maps, service-delivery cycles, or risk-management frameworks. Simply rename stages, swap icons, or duplicate cubes to adapt the cycle for any seven-phase model.
Login to download this file

Item ID
SB01167
Related Templates

Six Hexagon Stages Process Flow Diagram Template for PowerPoint & Google Slides
Process

10 Stages Business Flow Process Diagram template for PowerPoint & Google Slides
Business
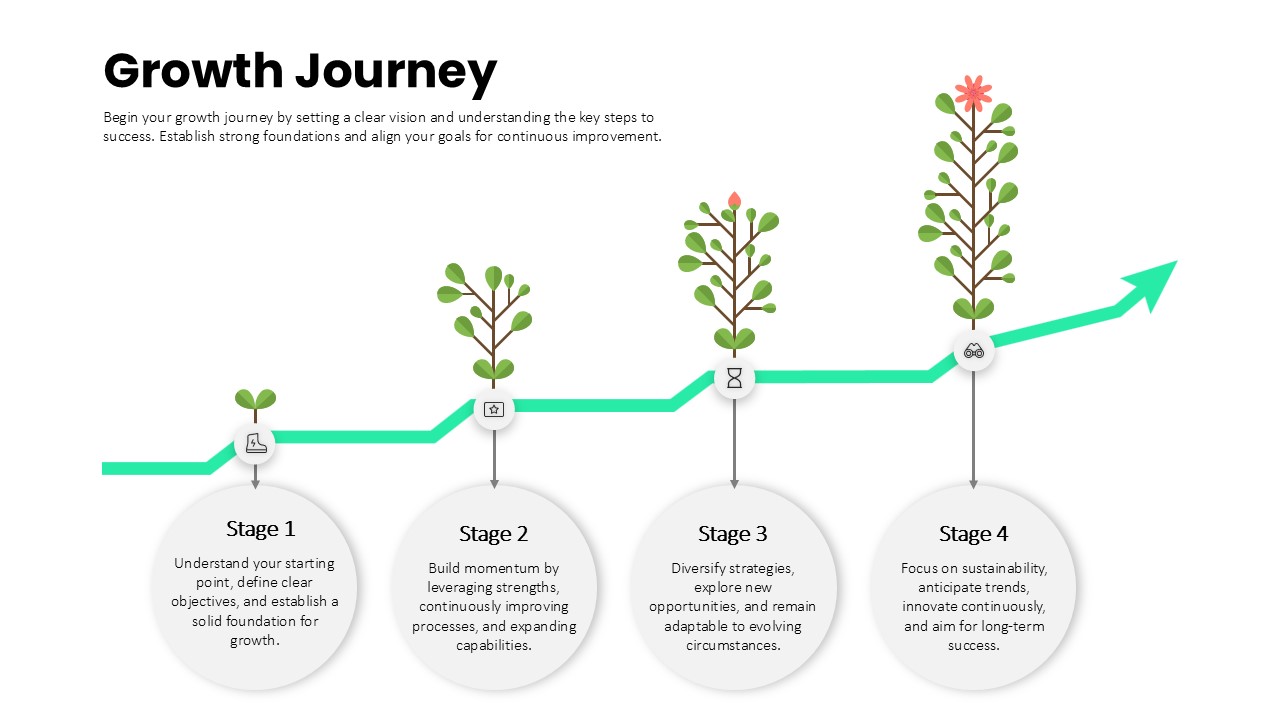
Growth Journey Stages Process template for PowerPoint & Google Slides
Business Strategy
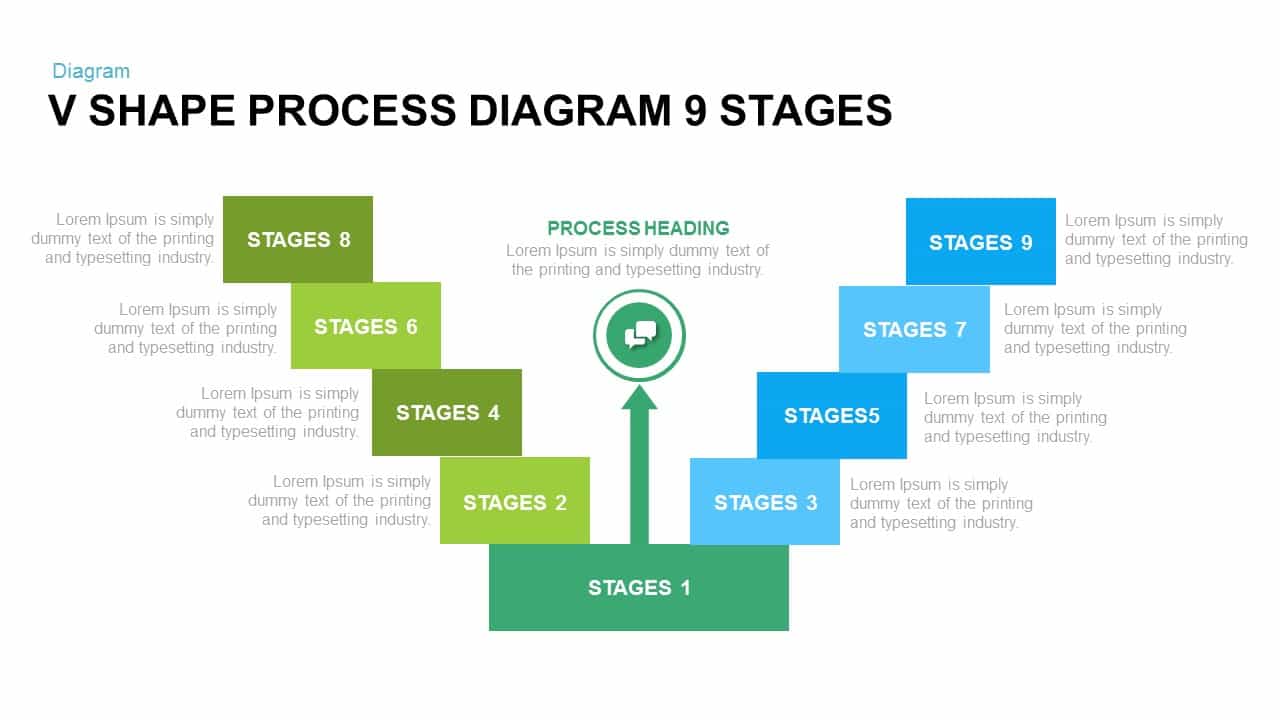
V Shape Process Diagram 9 Stages for PowerPoint & Google Slides
Infographics
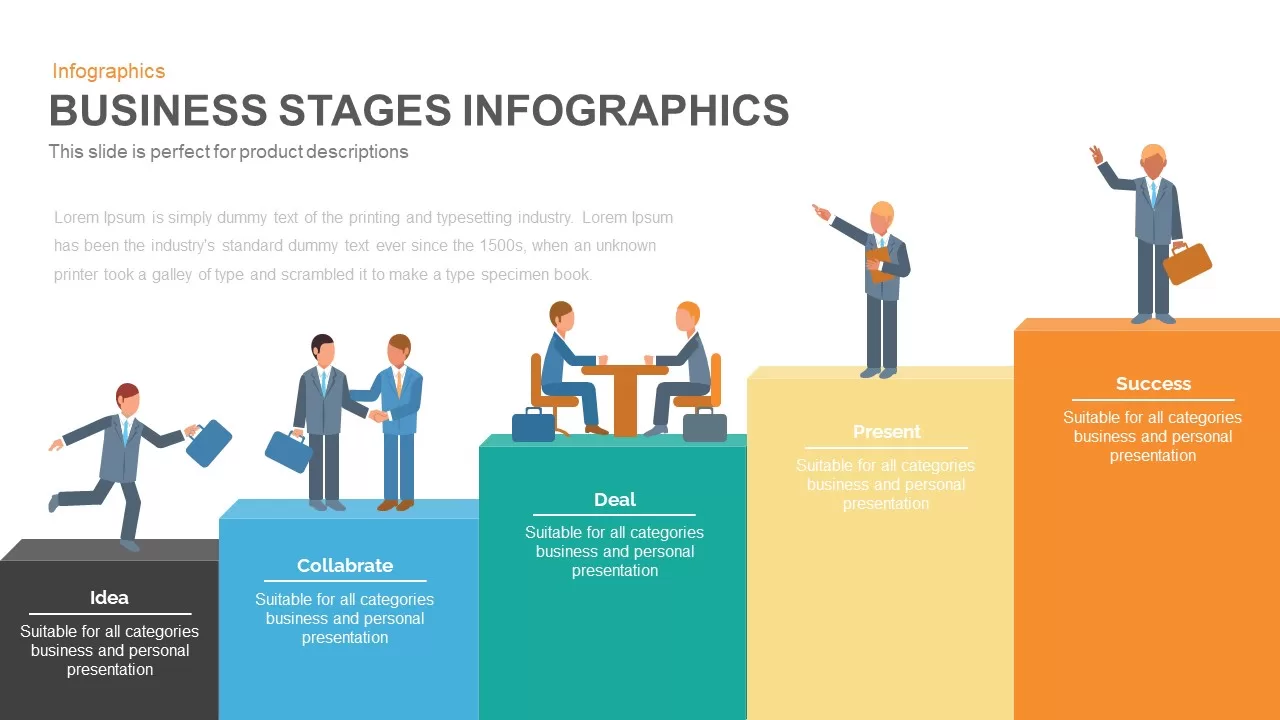
Business Stages Progression Infographic template for PowerPoint & Google Slides
Process
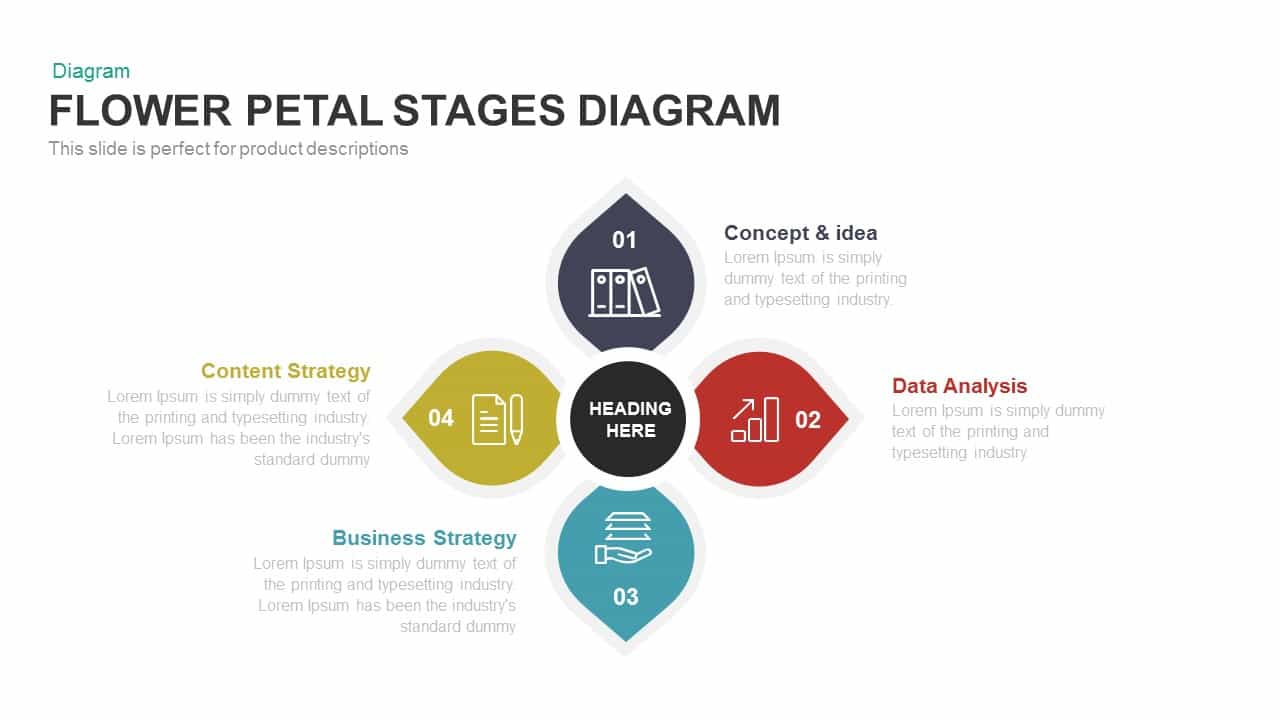
Modern Flower Petal Stages Diagram Template for PowerPoint & Google Slides
Circular

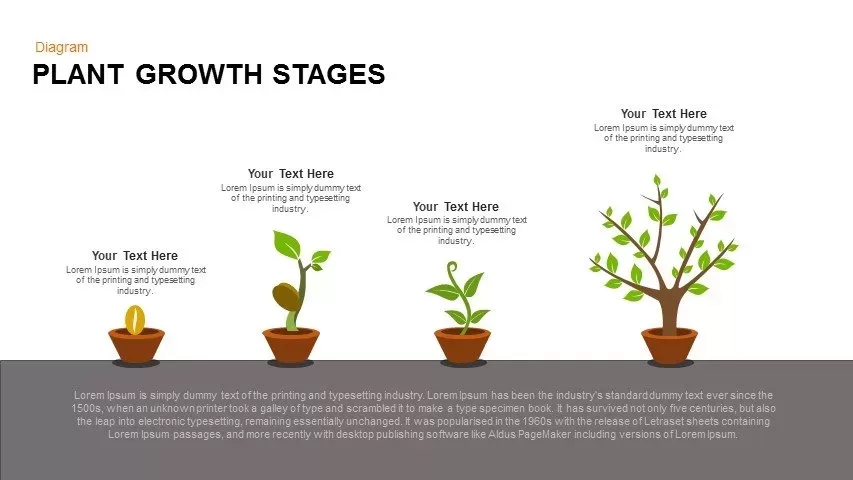
Editable Plant Growth Stages Diagram Template for PowerPoint & Google Slides
Process

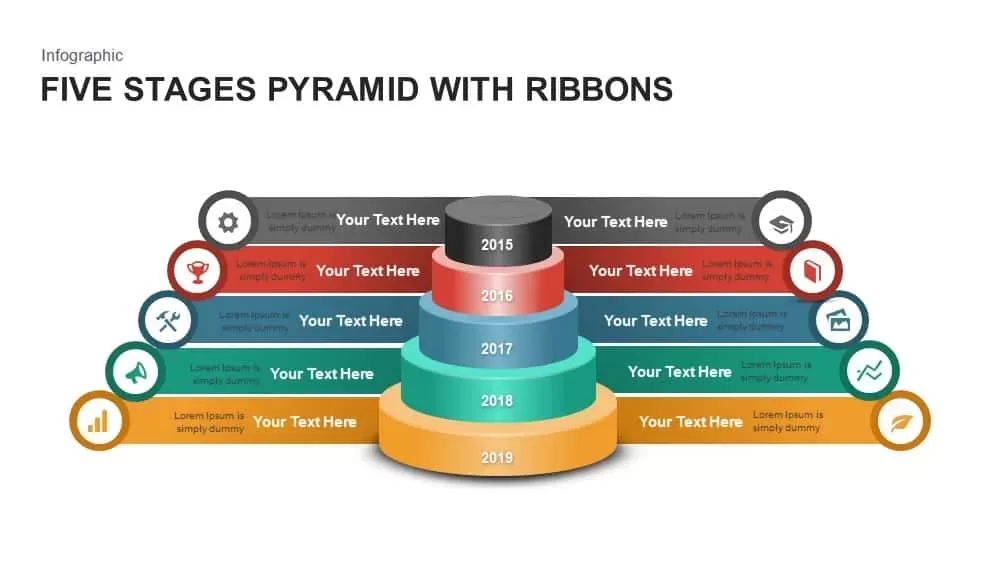
Five Stages Pyramid with Ribbons Diagram Template for PowerPoint & Google Slides
Pyramid
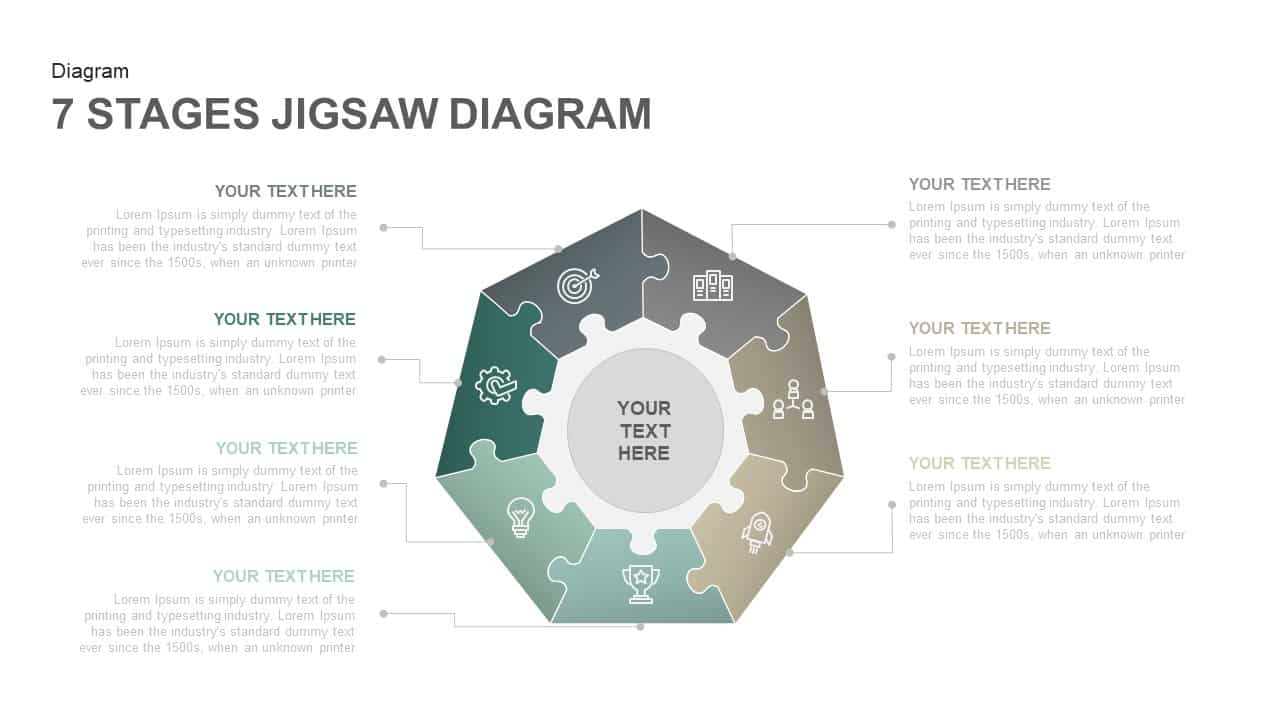
7 Stages Jigsaw Diagram template for PowerPoint & Google Slides
Process

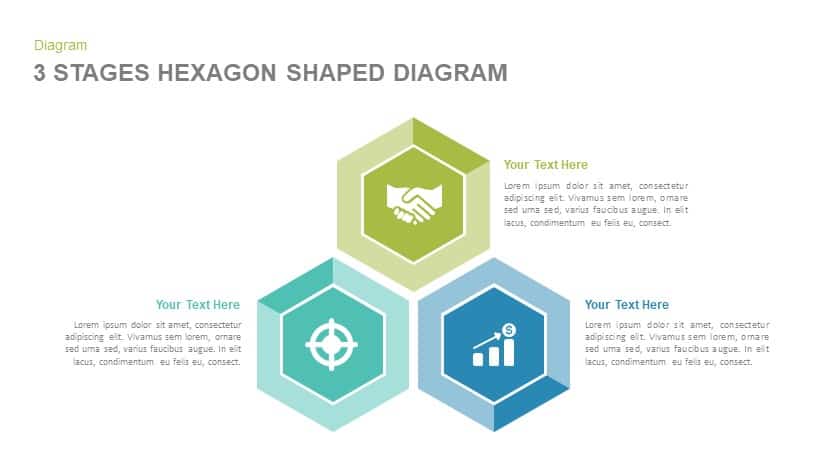
3 Stages Hexagon Shaped Diagram template for PowerPoint & Google Slides
Infographics
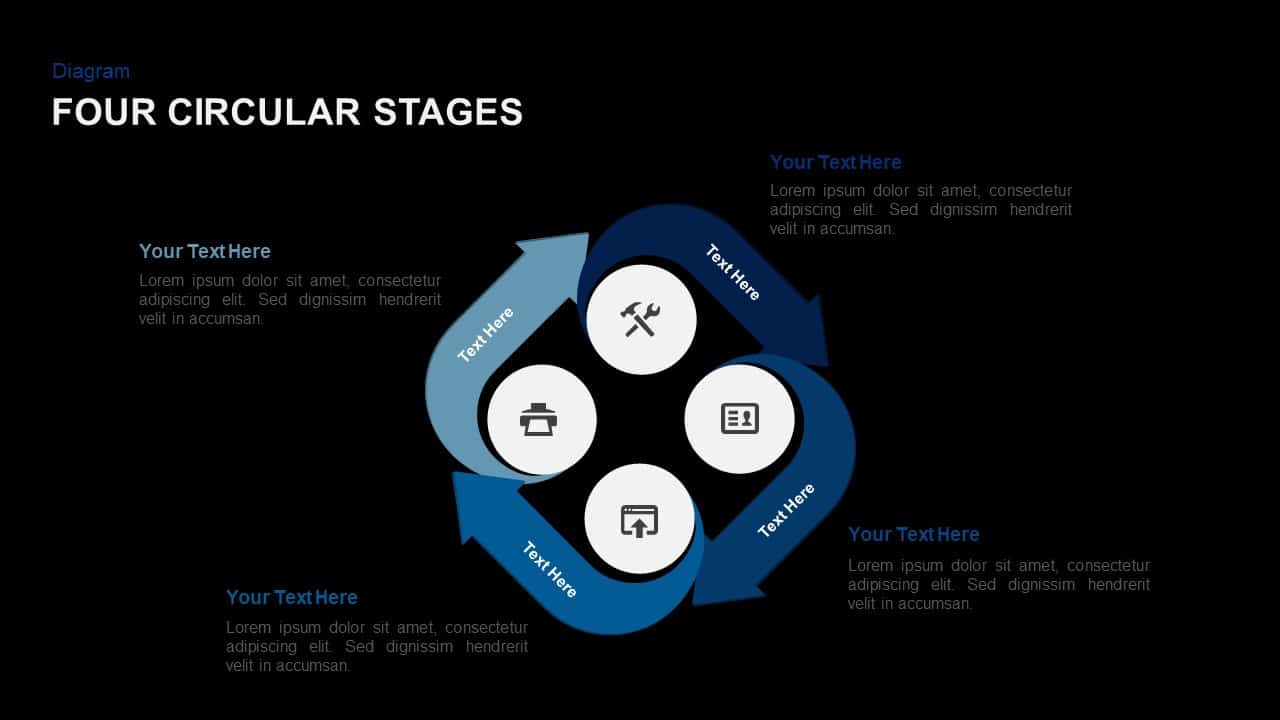
3, 4 & 5 Circular Stages Cycle Diagram Deck Template for PowerPoint & Google Slides
Circular
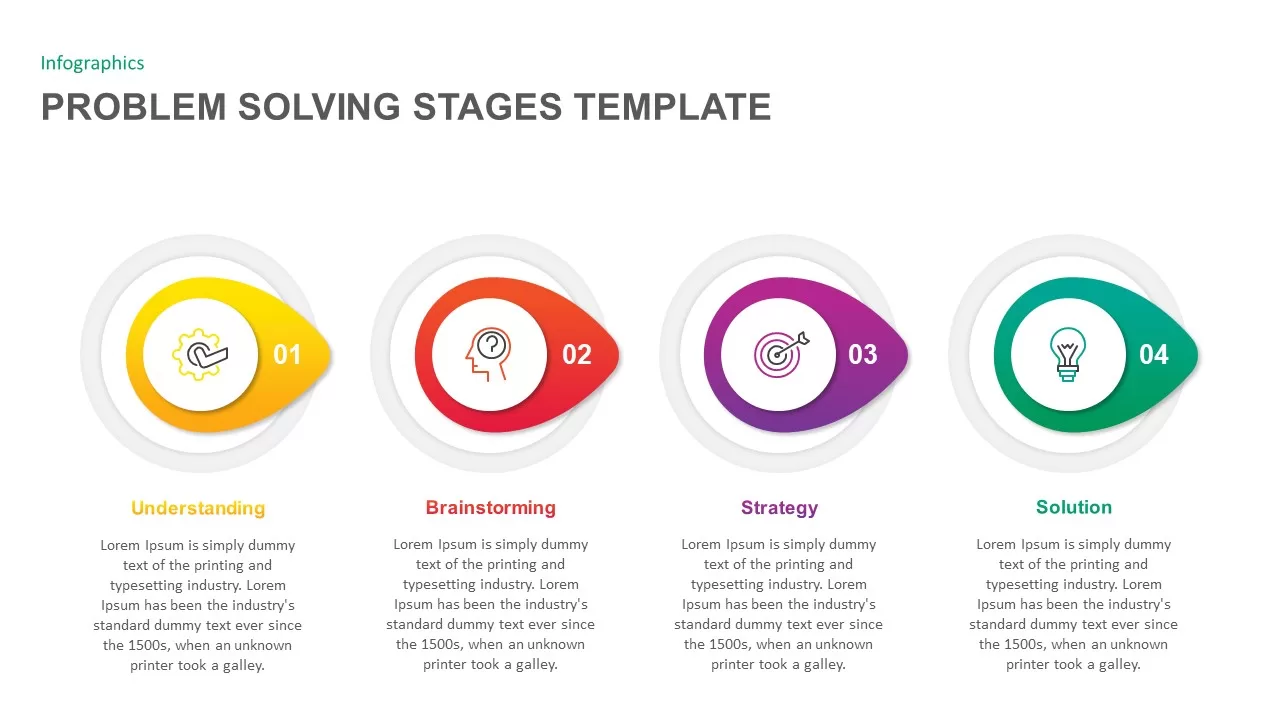
Problem Solving Stages Template for PowerPoint & Google Slides
Infographics
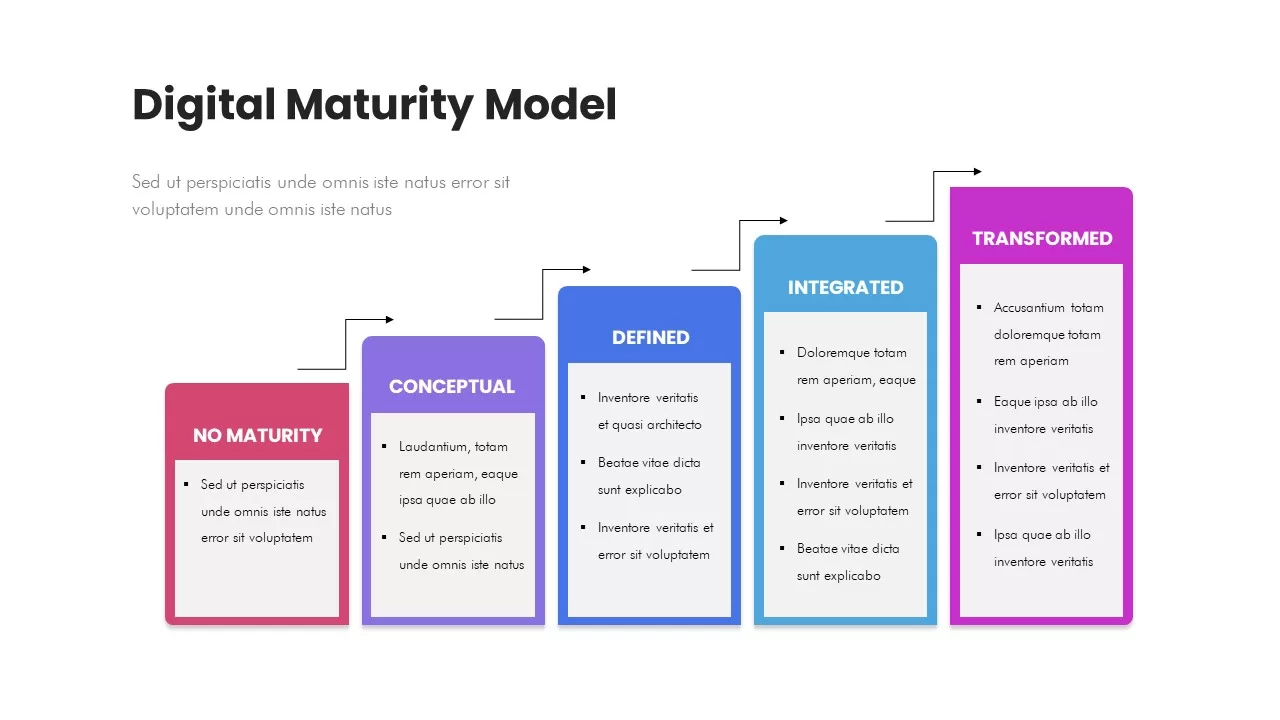
Digital Maturity Model Stages Diagram Template for PowerPoint & Google Slides
Process
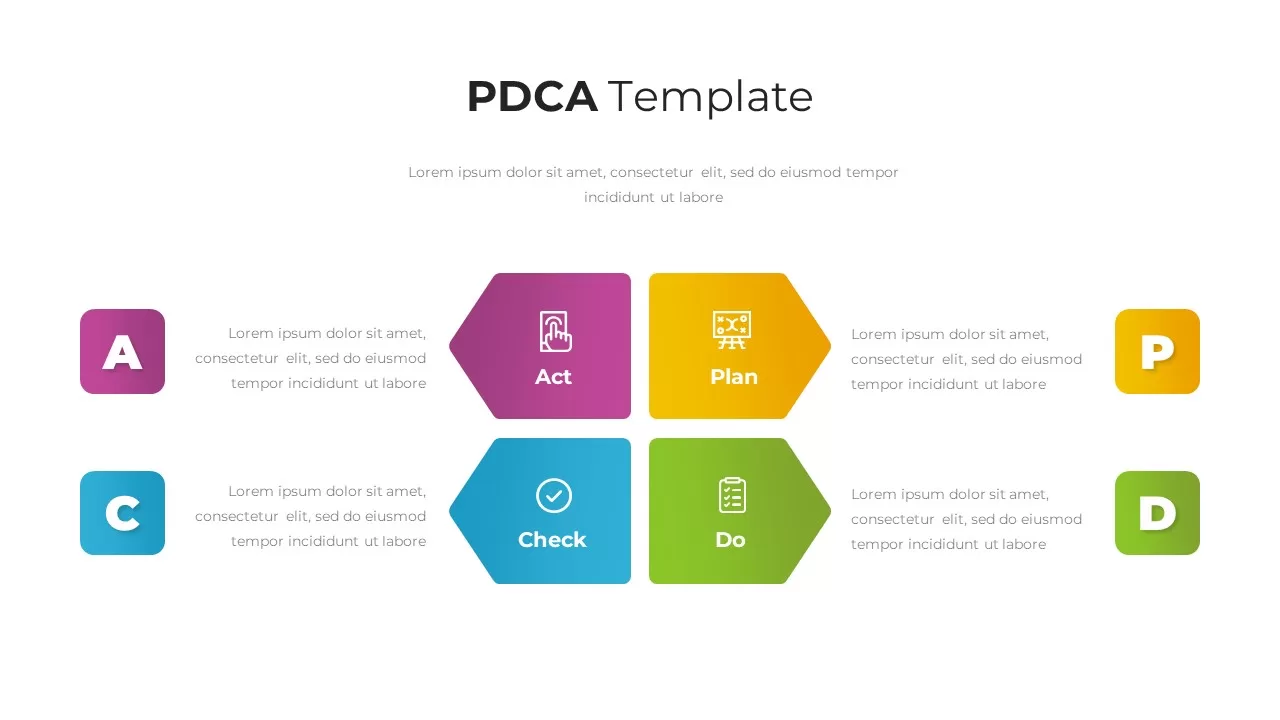
PDCA Cycle Infographic with Four Stages Template for PowerPoint & Google Slides
Process
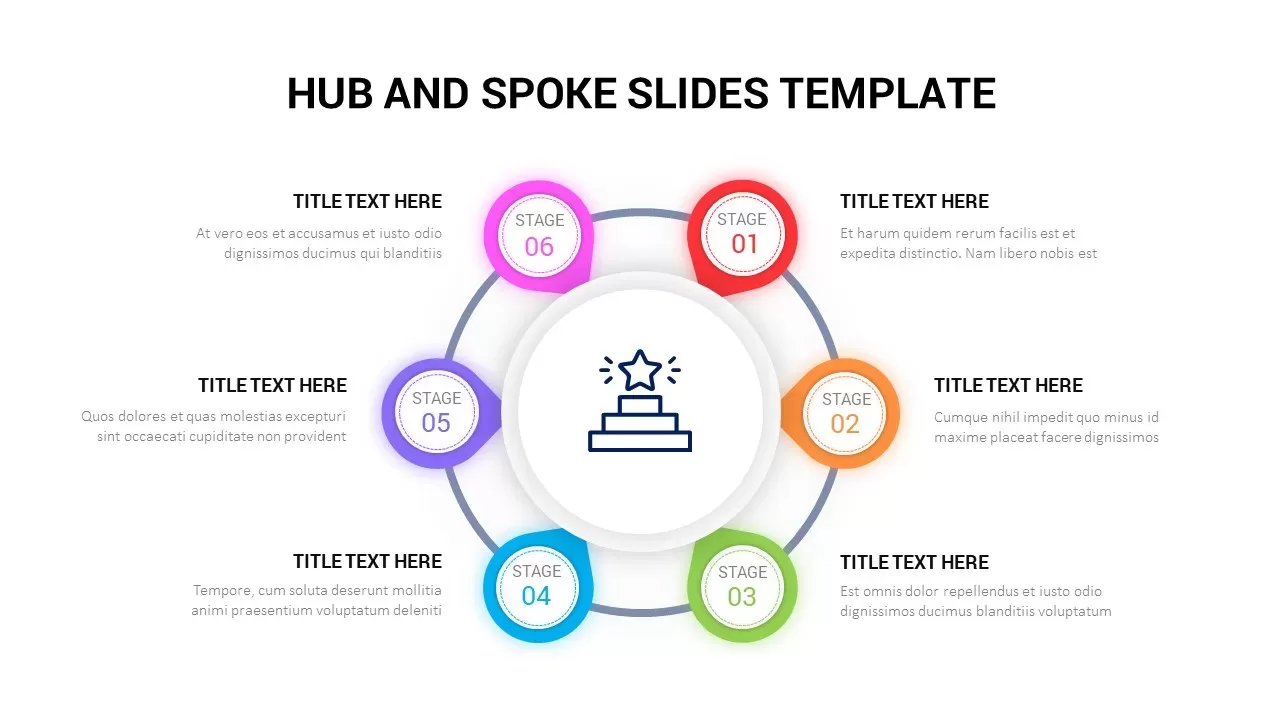
6 Stage Hub and Spoke Stages template for PowerPoint & Google Slides
Business Models
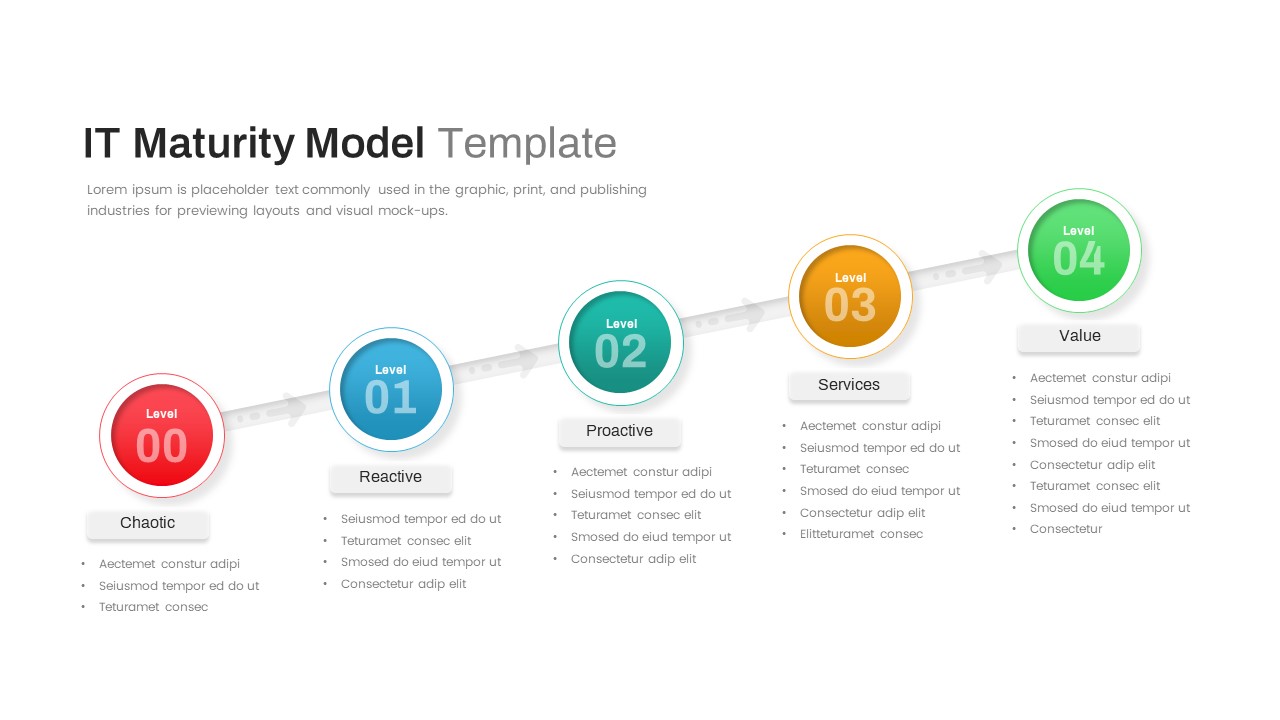
IT Maturity Model with Five Stages Template for PowerPoint & Google Slides
Timeline
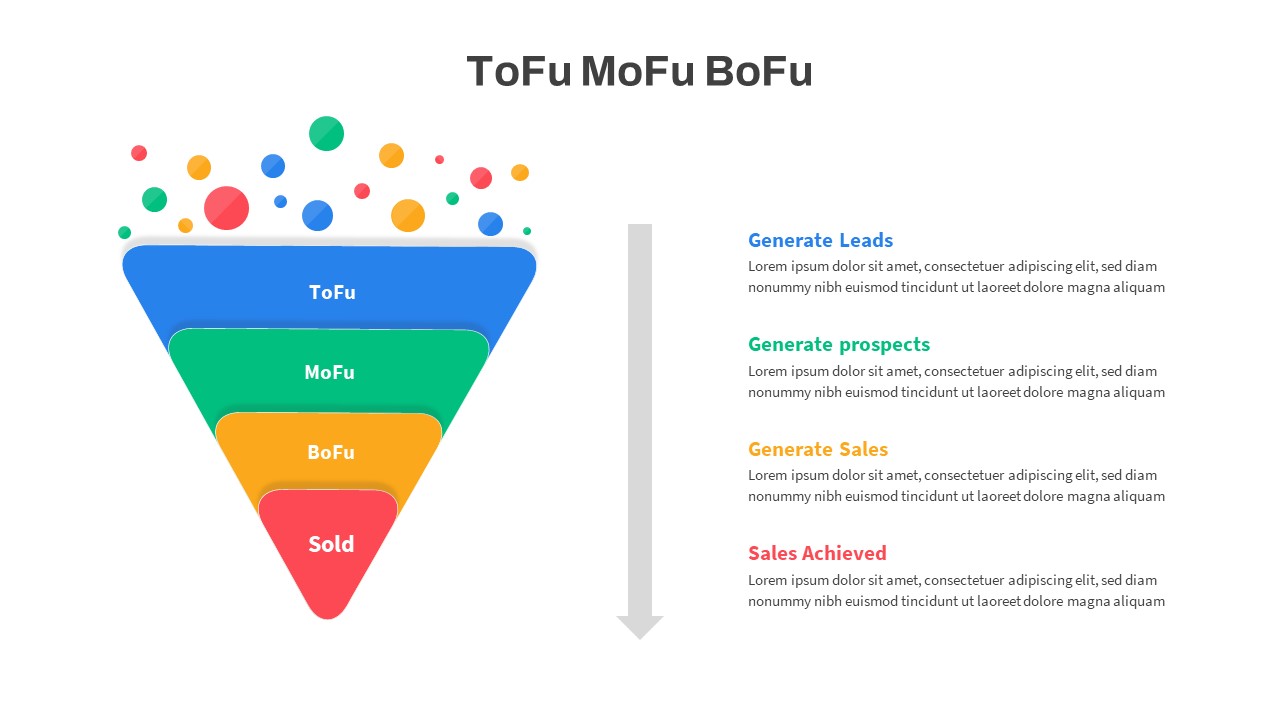
Inverted Sales Funnel Marketing Stages Template for PowerPoint & Google Slides
Marketing Funnel
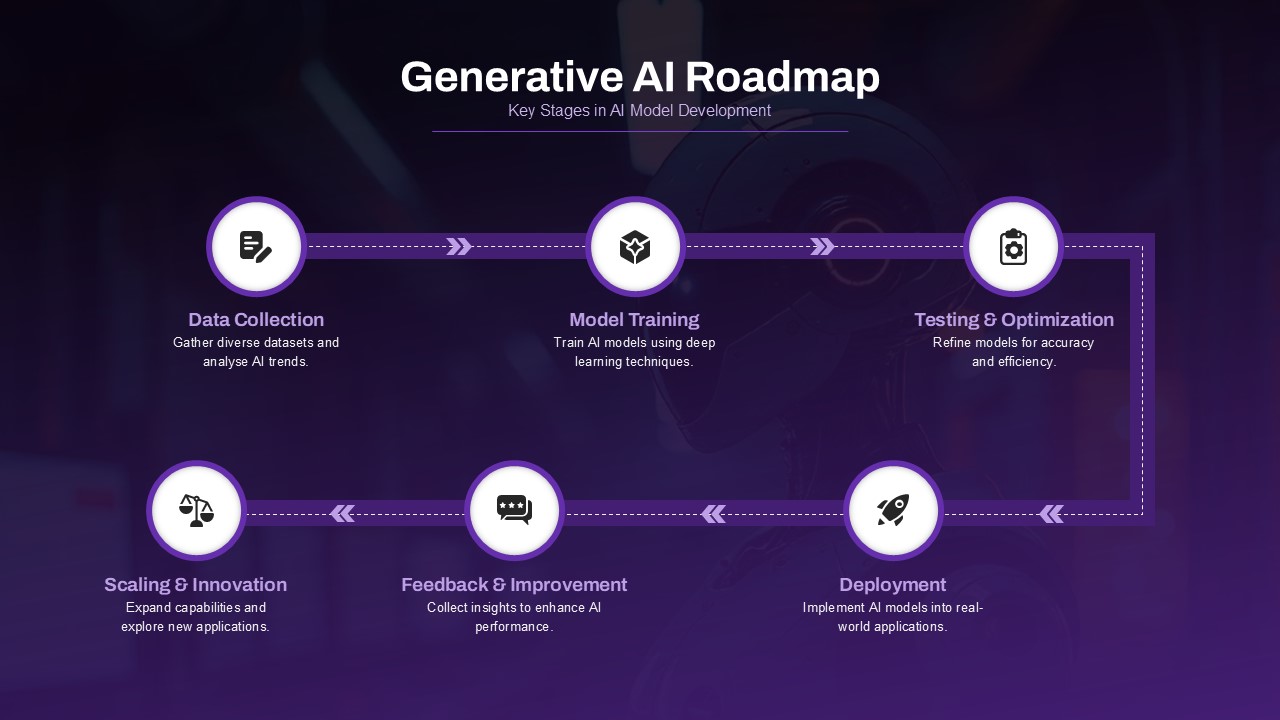
Generative AI Roadmap Key Stages Template for PowerPoint & Google Slides
Roadmap
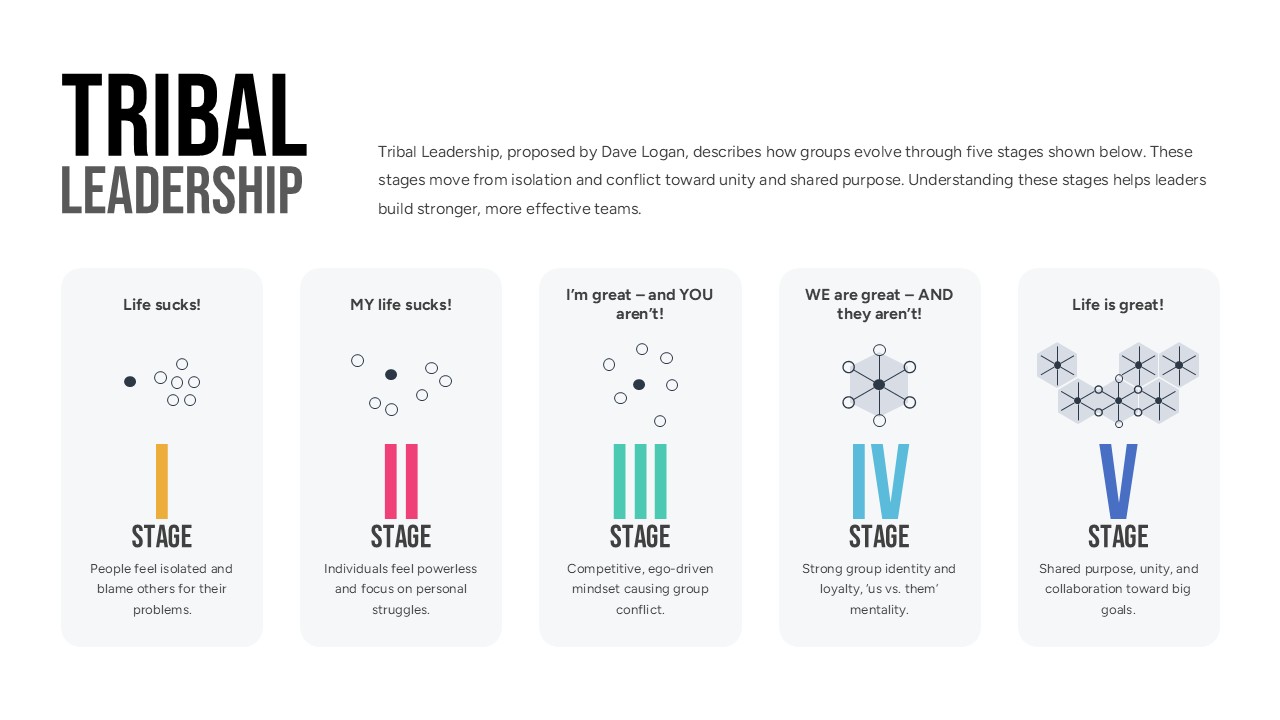
Tribal Leadership Stages Overview template for PowerPoint & Google Slides
Business
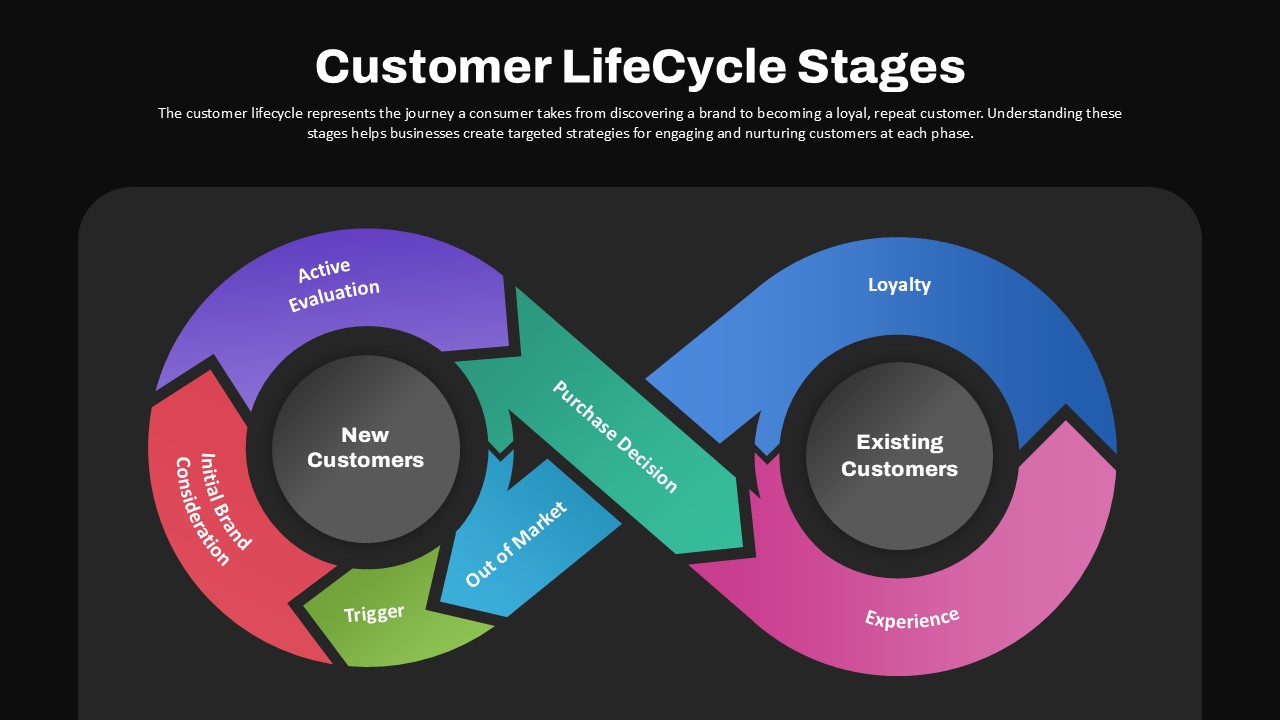
Customer Lifecycle Stages Infinity Loop Template for PowerPoint & Google Slides
Customer Journey
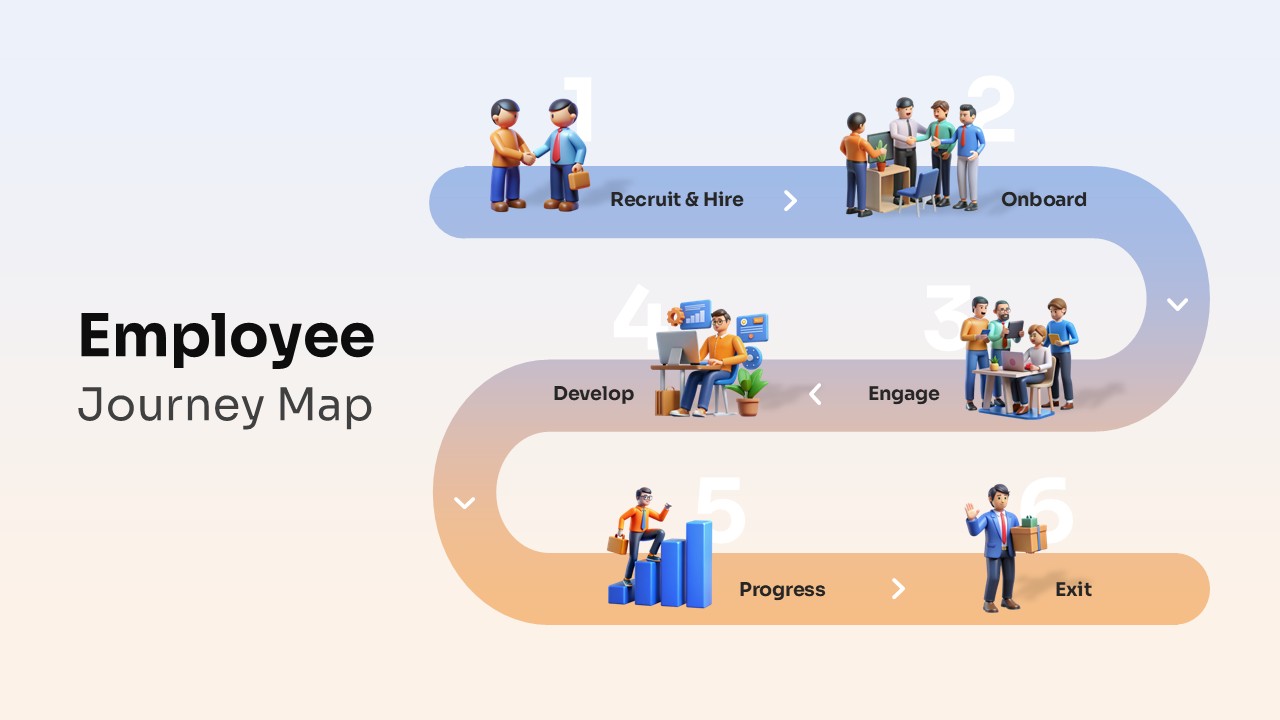
Employee Journey Map with Stages template for PowerPoint & Google Slides
Recruitment
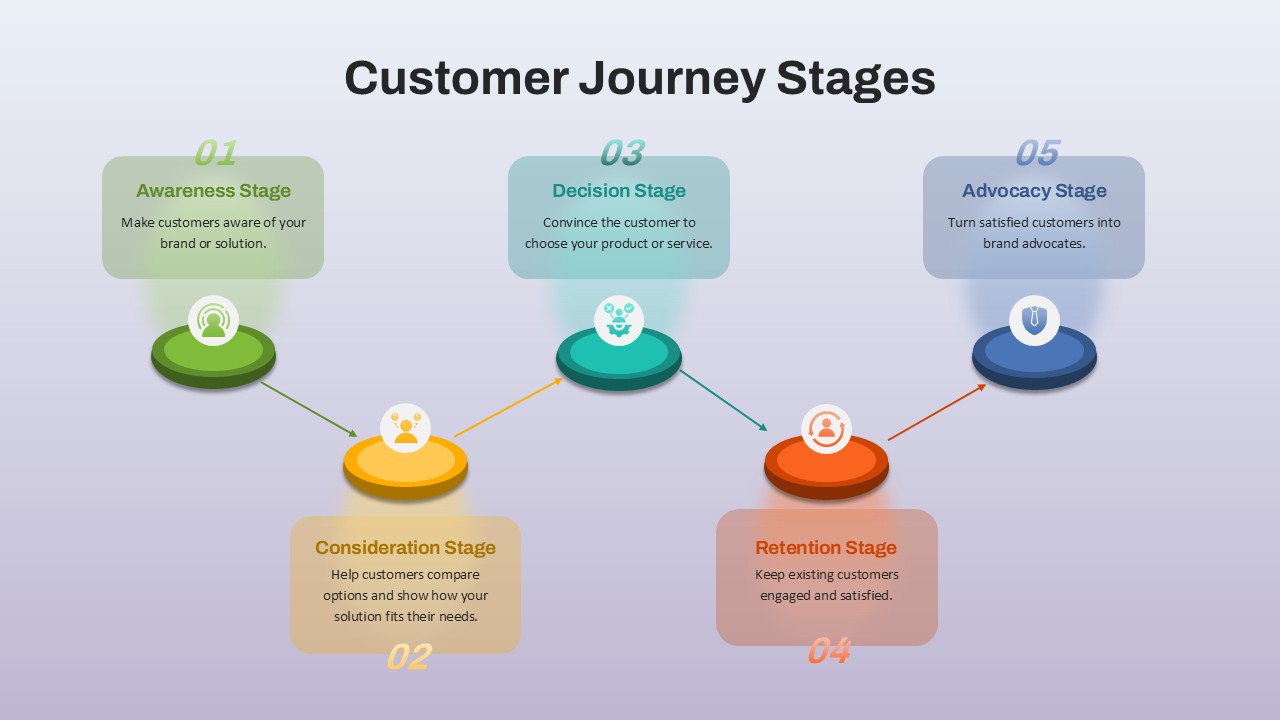
Customer Journey Stages template for PowerPoint & Google Slides
Business
4 Step Process PowerPoint & Google Slides Template for PowerPoint & Google Slides
Process

Sales Process Infographic Slides Pack Template for PowerPoint & Google Slides
Process
Gear Process Diagram PowerPoint Template for PowerPoint & Google Slides
Process
Sales Process Workflow Funnel Diagram PowerPoint Template for PowerPoint & Google Slides
Funnel
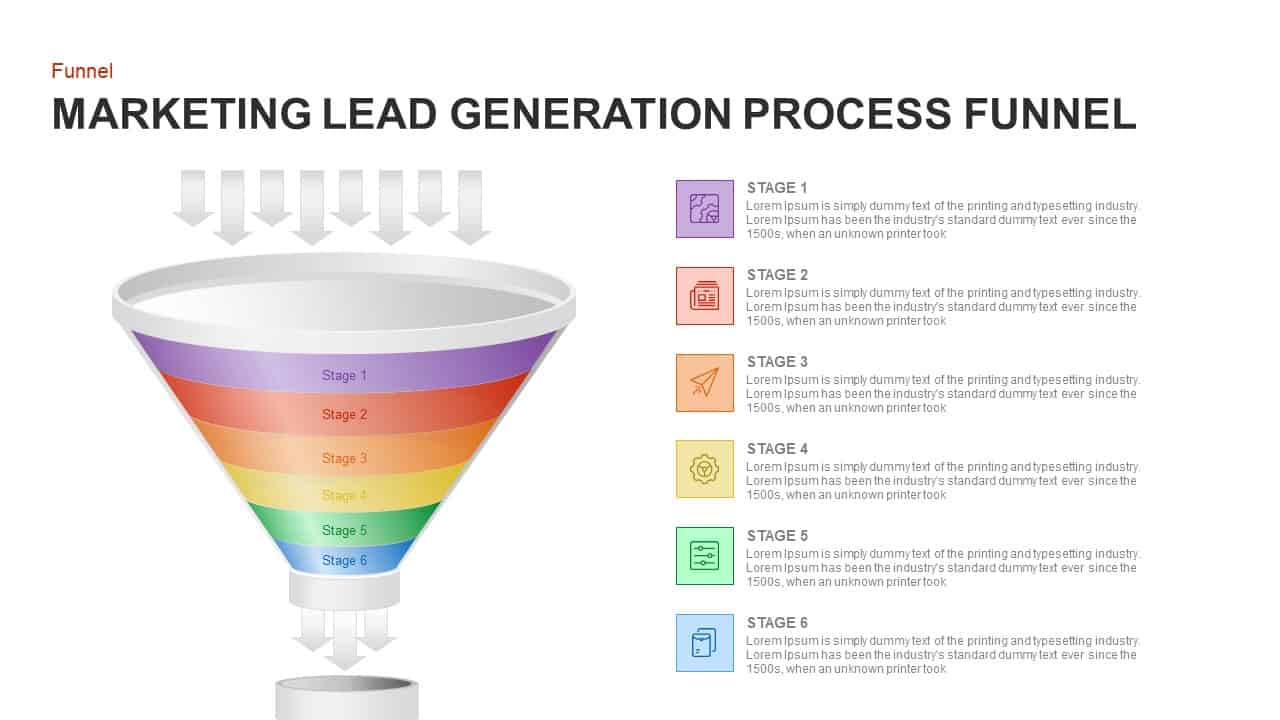
Marketing Lead Generation Process Funnel PowerPoint Template for PowerPoint & Google Slides
Funnel
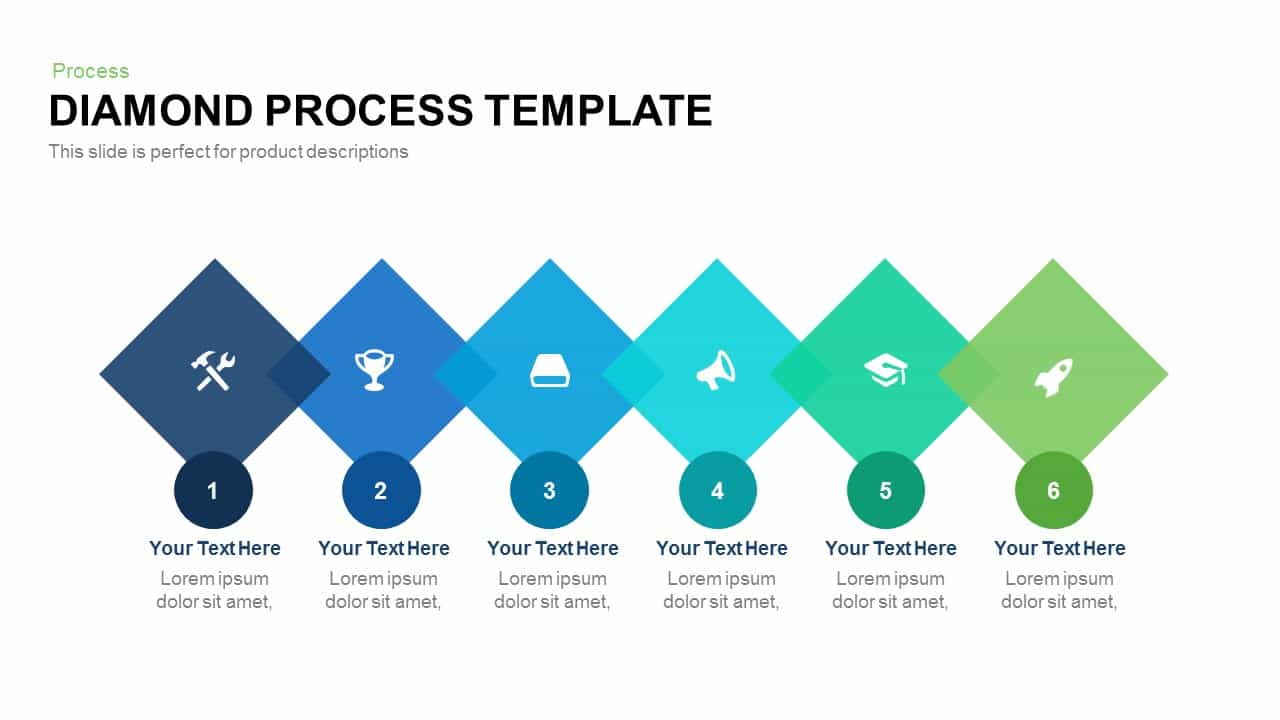
Diamond Process Template template for PowerPoint & Google Slides
Process
Workflow PowerPoint Process infographic for PowerPoint & Google Slides
Process
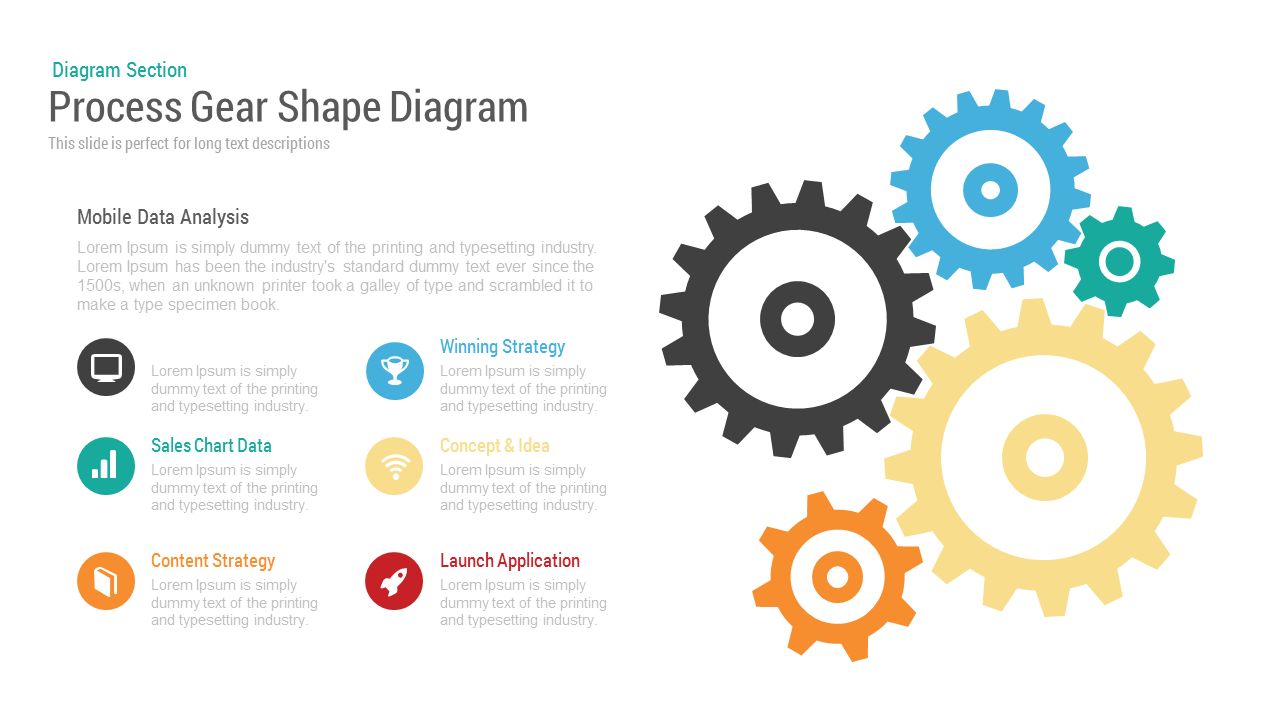
Gear Process Diagram template for PowerPoint & Google Slides
Process
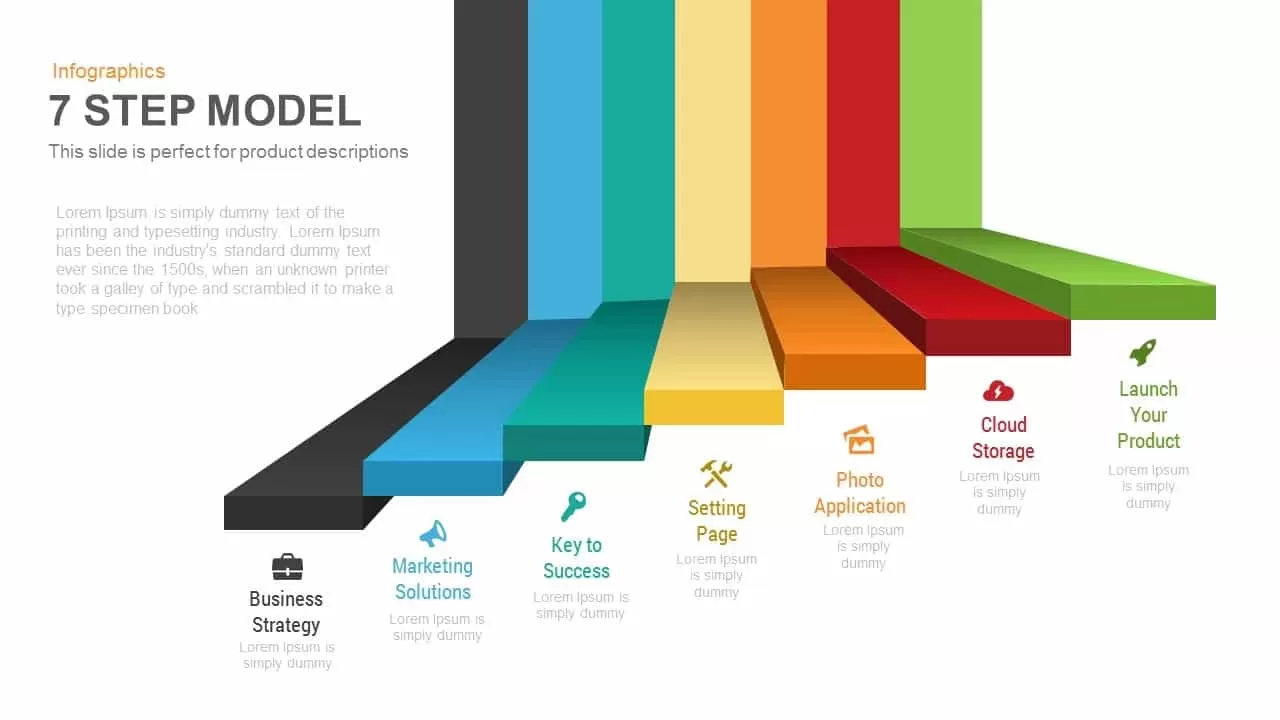
7-Step 3D Process Infographic Model template for PowerPoint & Google Slides
Process
Three Circle Arrow Process Diagram template for PowerPoint & Google Slides
Circular

Five-Step Gear Process Diagram Template for PowerPoint & Google Slides
Process
Arrow Stage Process Diagram template for PowerPoint & Google Slides
Arrow
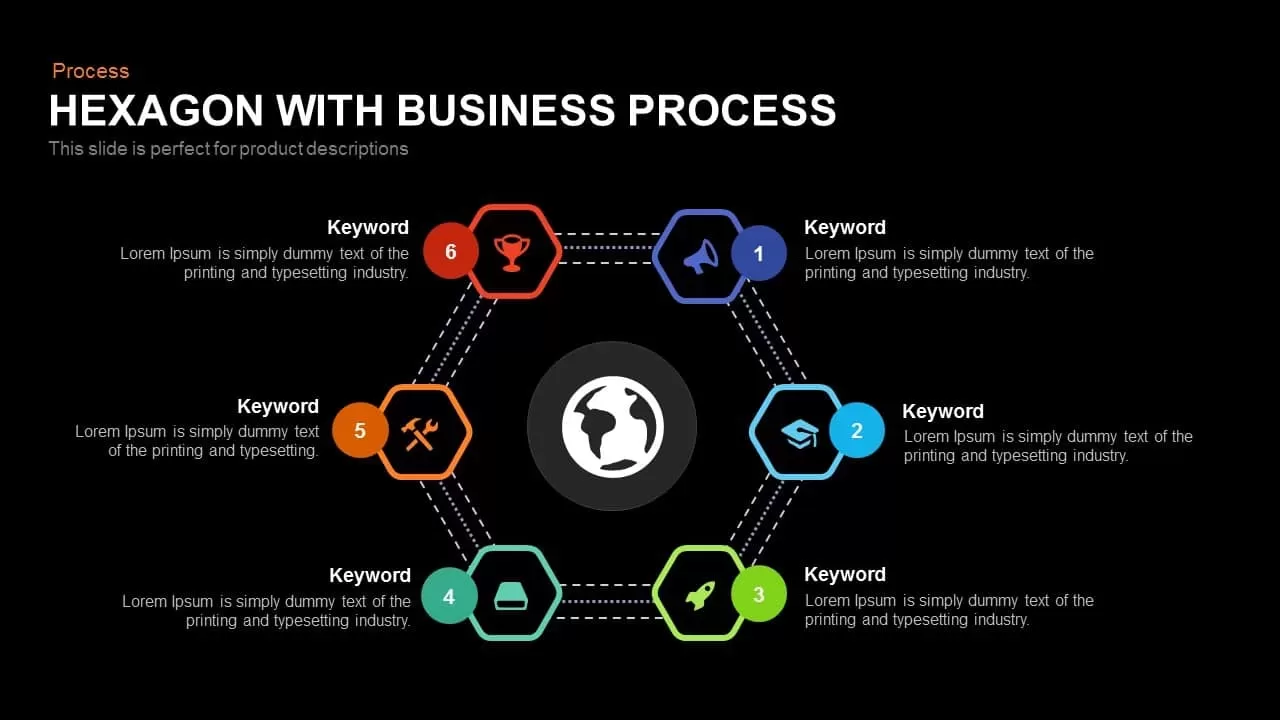
Global Hexagon Six-Step Business Process Template for PowerPoint & Google Slides
Process
Dynamic 4 Gear Process Diagram Template for PowerPoint & Google Slides
Process
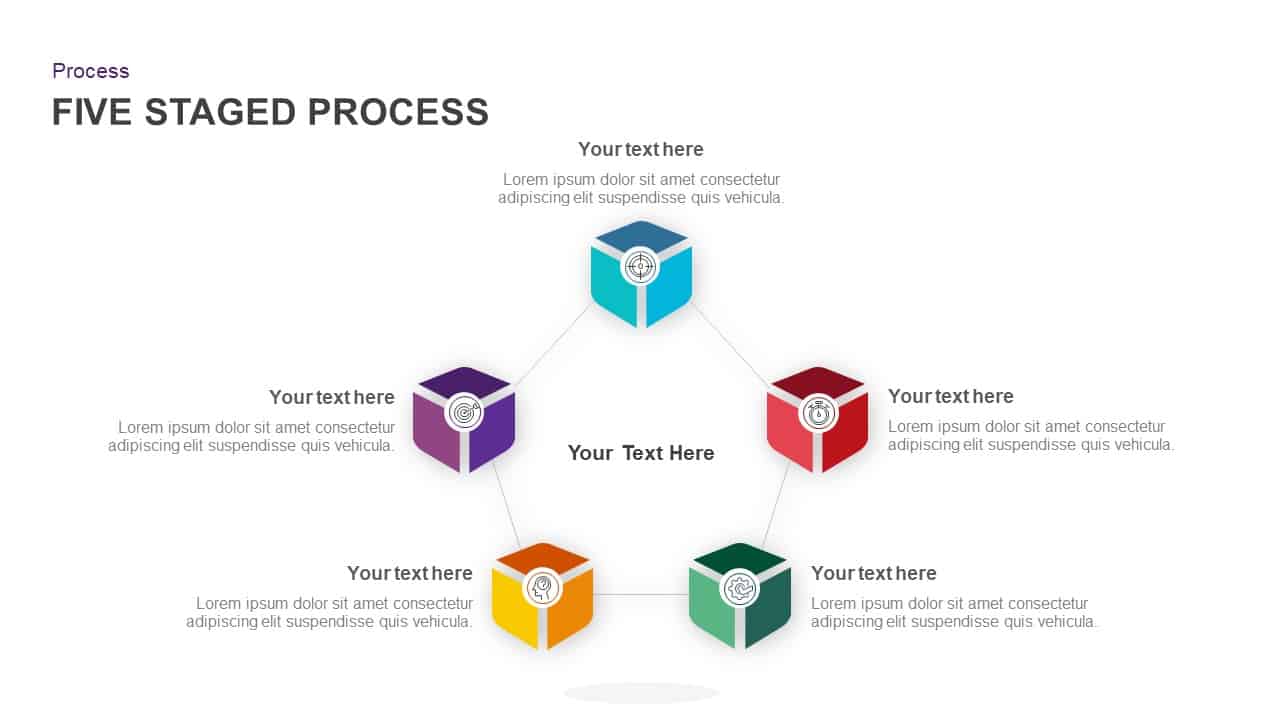
Modern Five-Stage Cycle Process Diagram Template for PowerPoint & Google Slides
Process
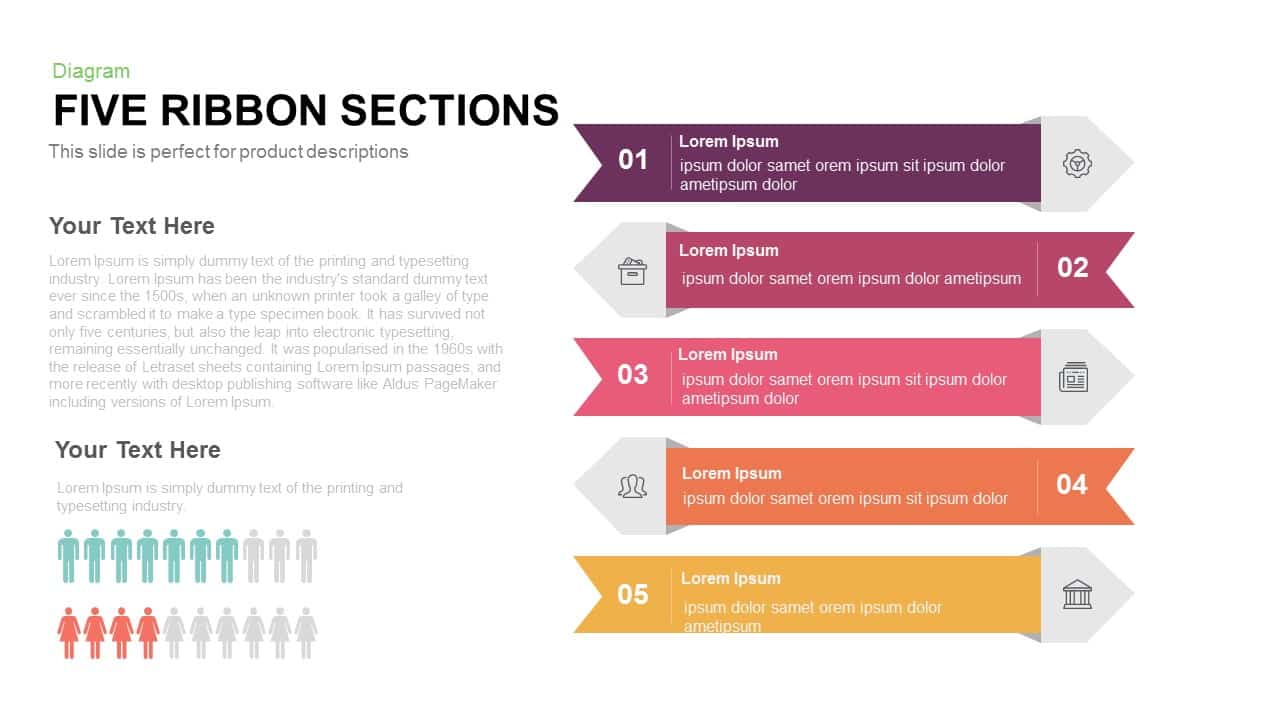
Five Ribbon Sections Process Diagram Template for PowerPoint & Google Slides
Process
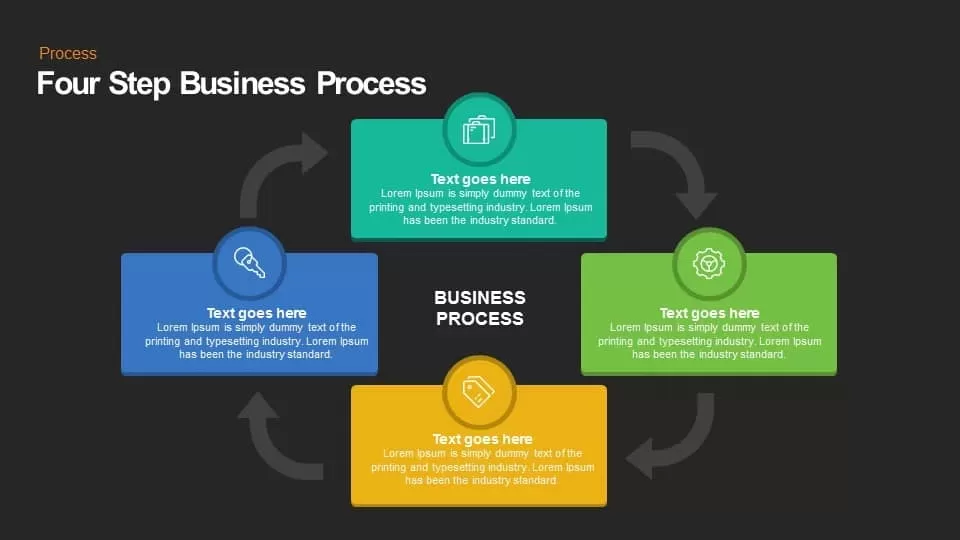
Four Step Business Process template for PowerPoint & Google Slides
Process
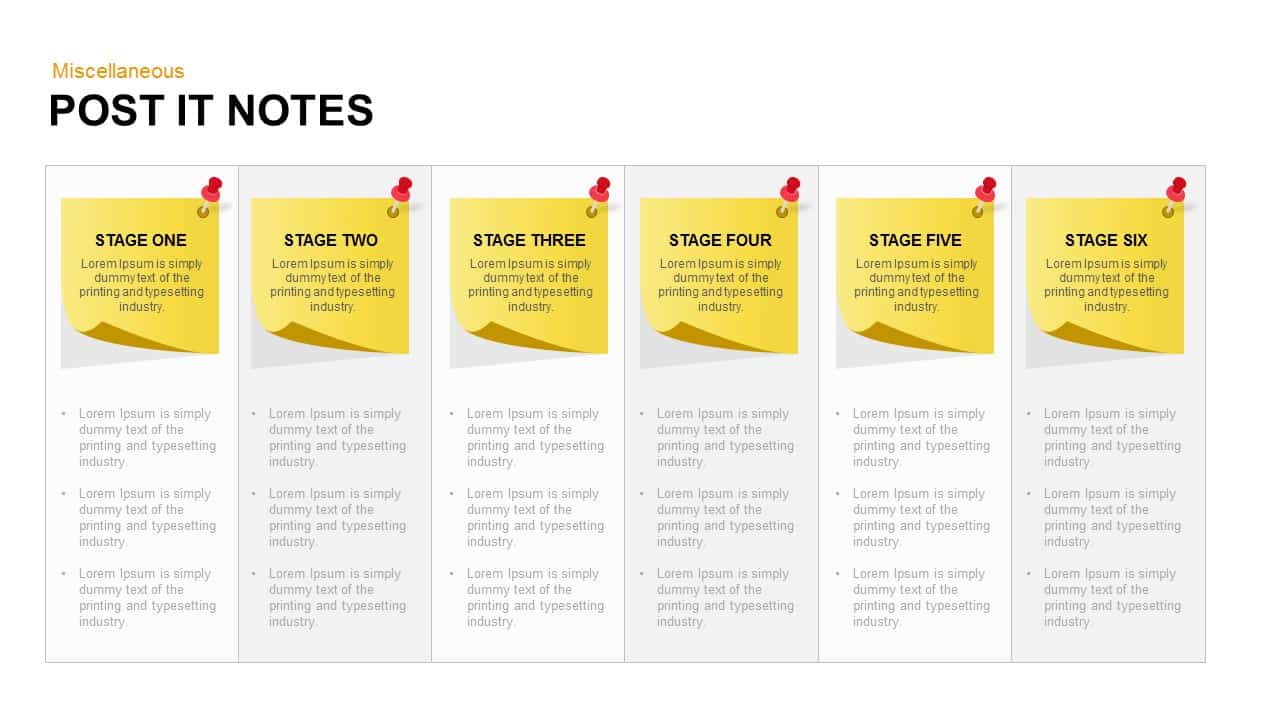
Post-it Notes Process template for PowerPoint & Google Slides
Process
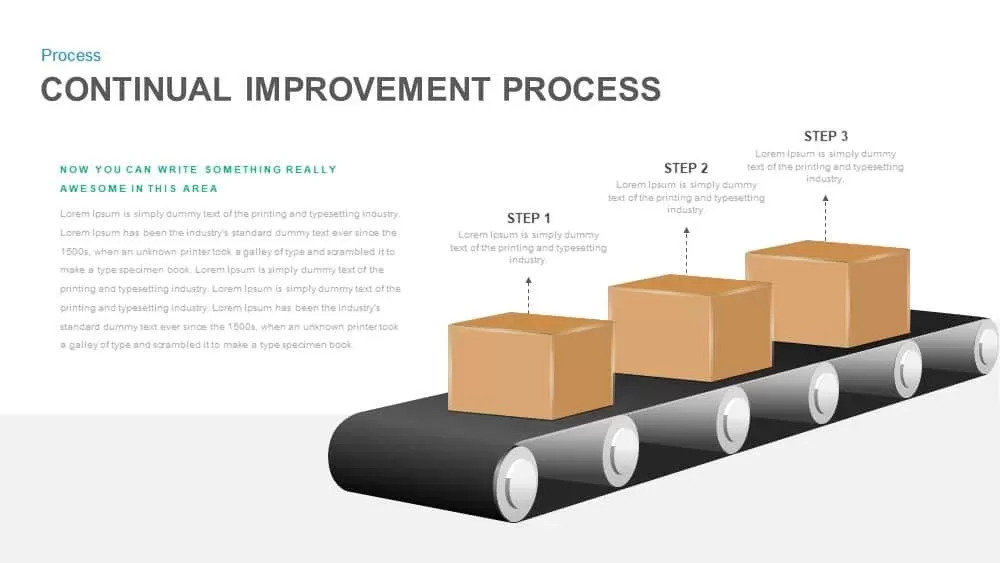
Continual Improvement Process Conveyor Template for PowerPoint & Google Slides
Process
Six-Stage Circle Process Diagram Template for PowerPoint & Google Slides
Process
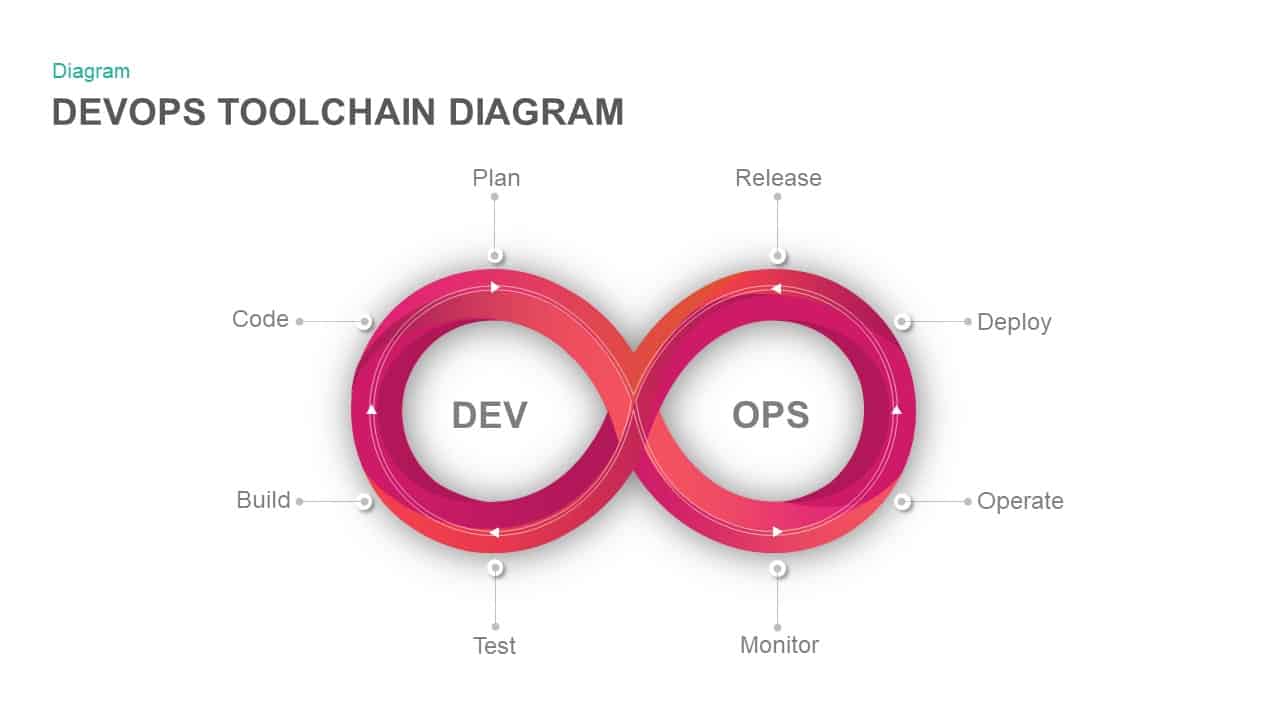
DevOps Infinity Loop Process Diagram Template for PowerPoint & Google Slides
Process
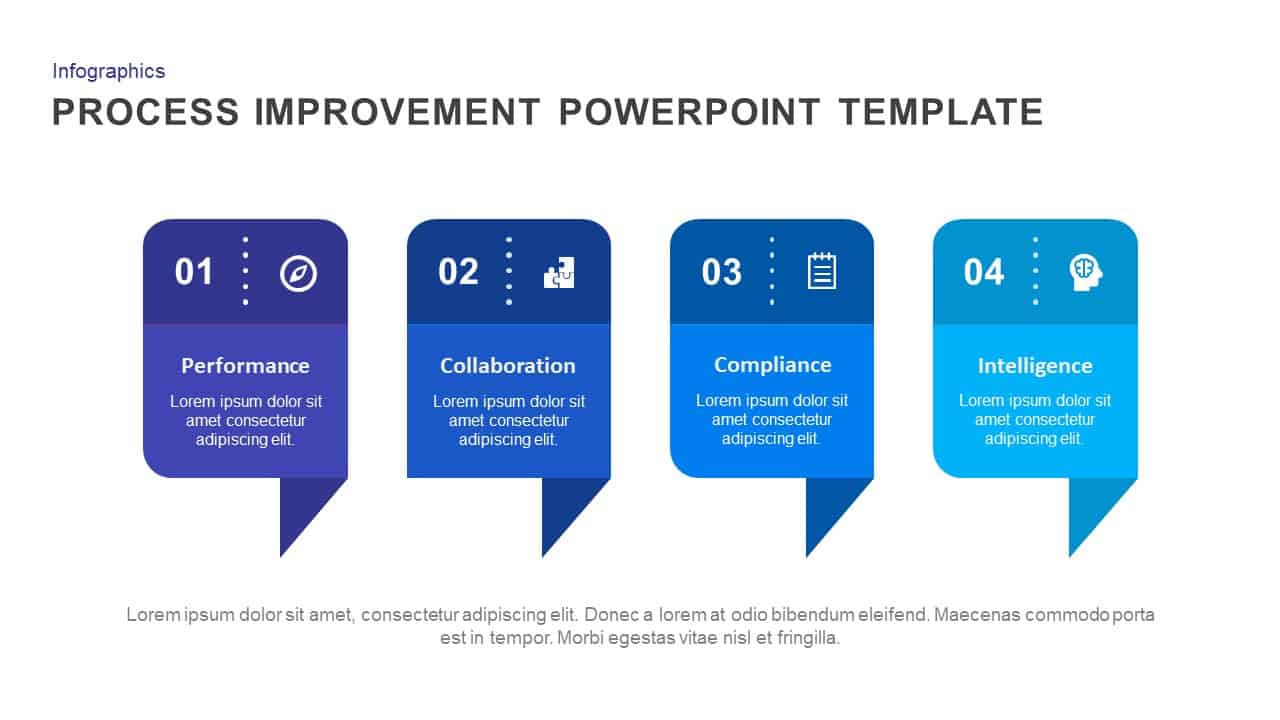
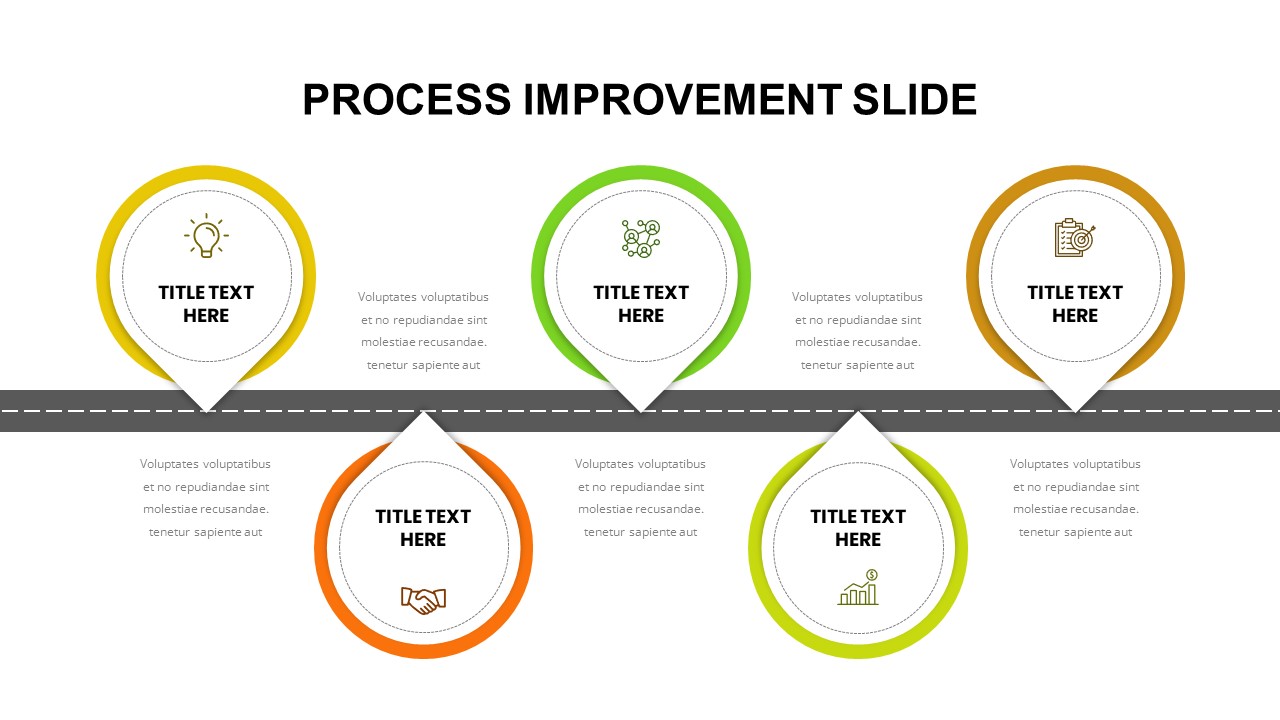
Process Improvement template for PowerPoint & Google Slides
Process
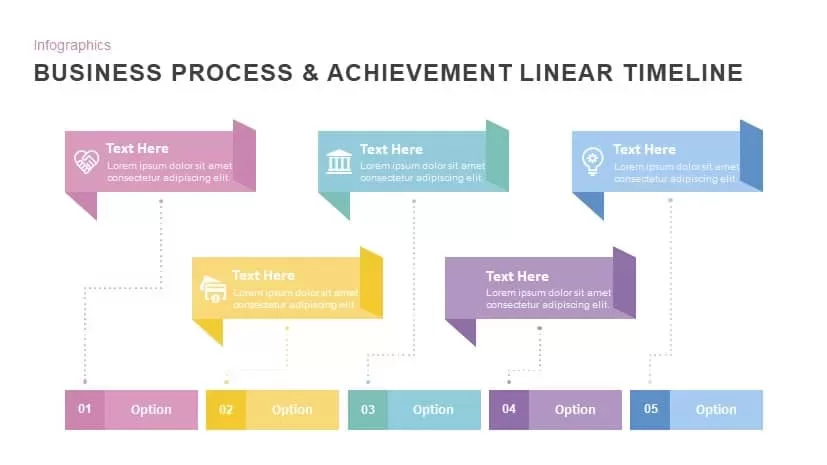
Business Process & Achievement Linear Timeline template for PowerPoint & Google Slides
Timeline
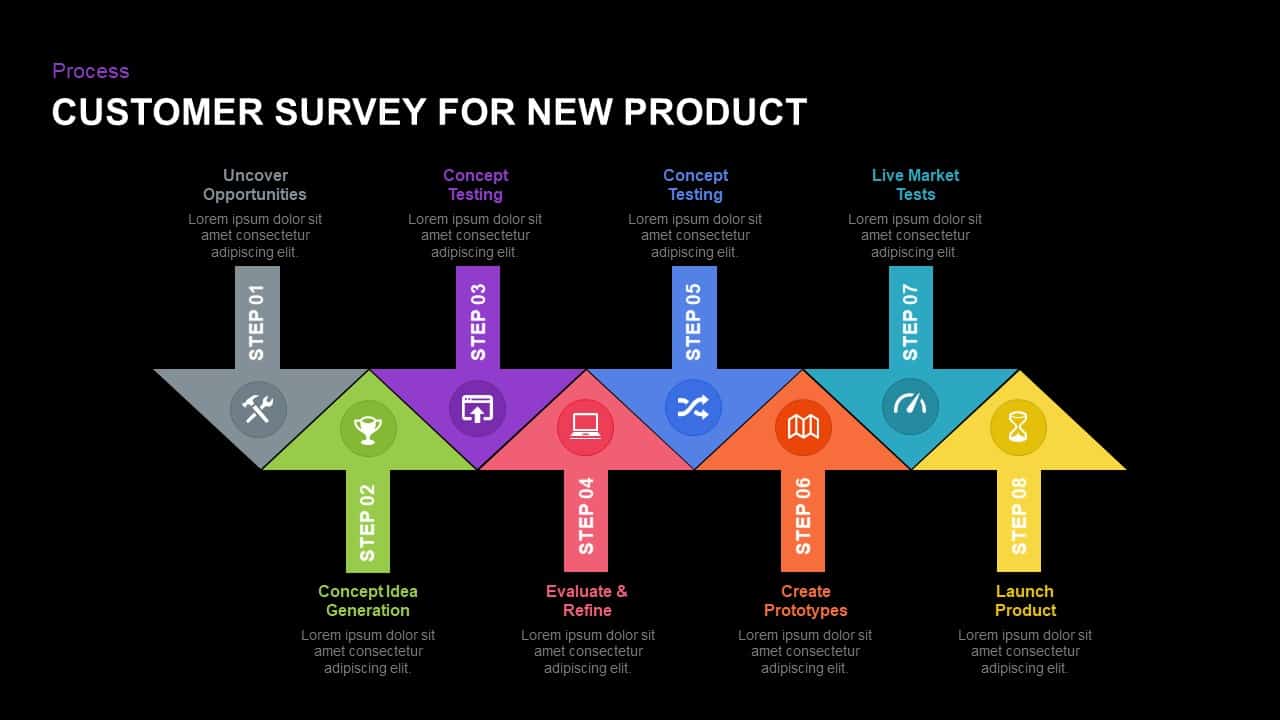
Eight-Step New Product Survey Process Template for PowerPoint & Google Slides
Process
Modern Recruiting Process Cover Slide Template for PowerPoint & Google Slides
Pitch Deck
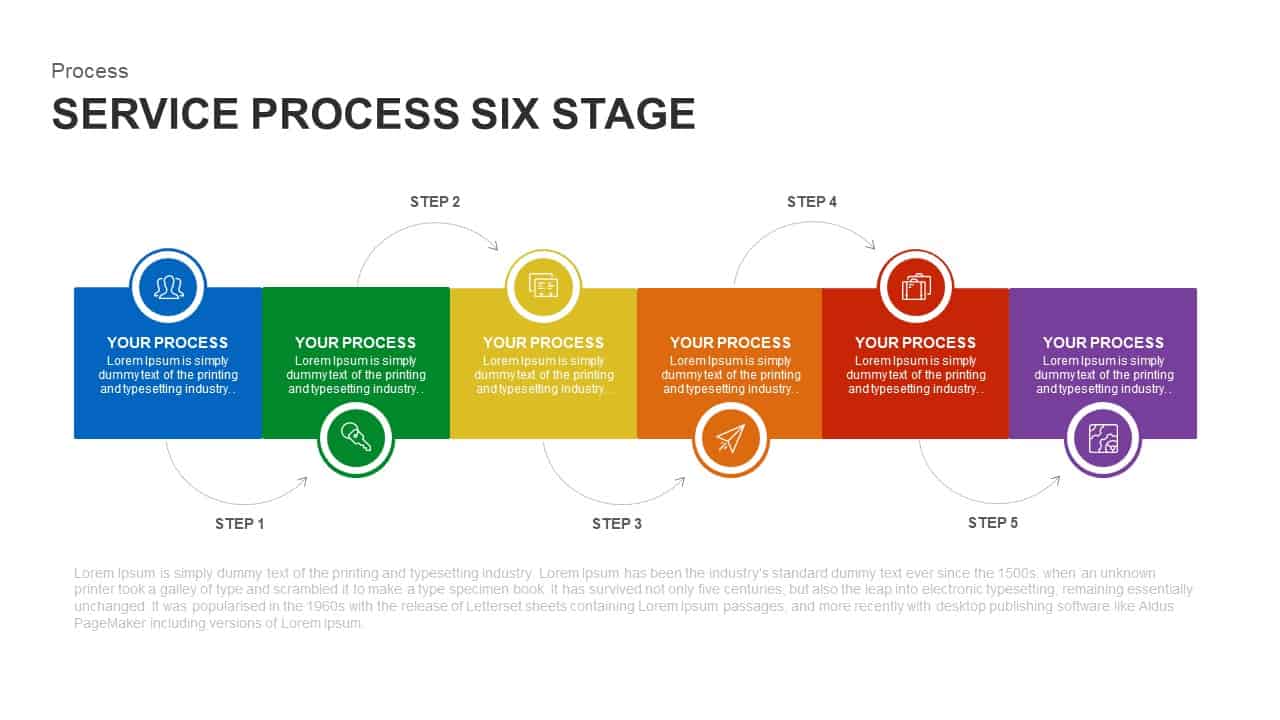
Six-Stage Service Process Workflow Template for PowerPoint & Google Slides
Process
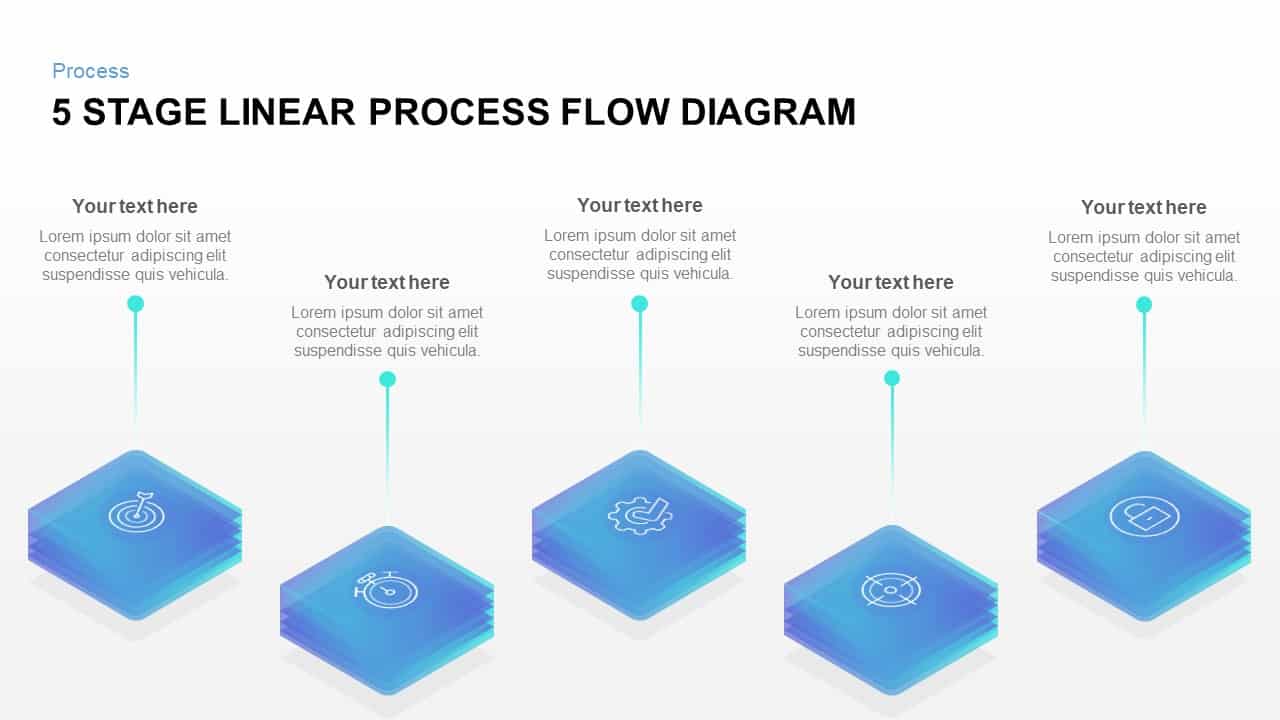
Isometric Five-Stage Process Flow Template for PowerPoint & Google Slides
Process
Five-Stage Pyramid Infographics Process Template for PowerPoint & Google Slides
Pyramid
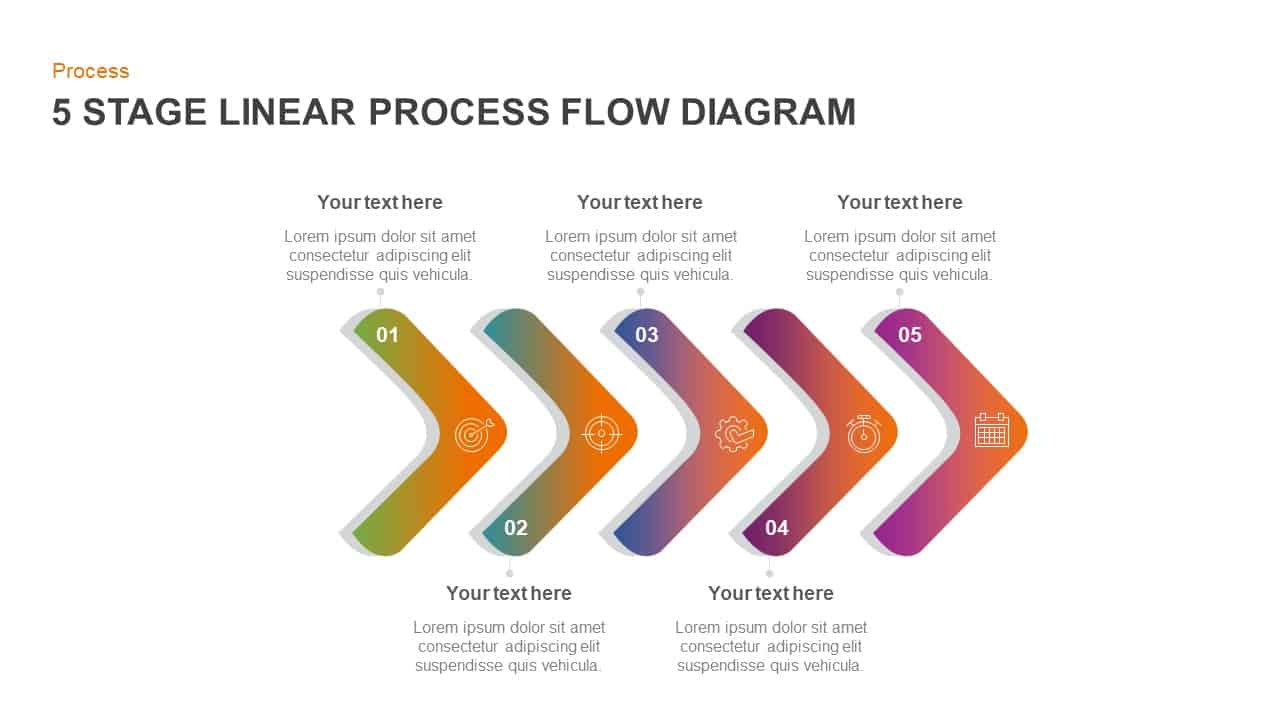
Gradient Chevron Five-Stage Process Flow Template for PowerPoint & Google Slides
Arrow
Tree Diagram with Gears Process Template for PowerPoint & Google Slides
Process
3D 6-Step Infographics Process Diagram Template for PowerPoint & Google Slides
Infographics
Hand-Held Four-Step Process Diagram Template for PowerPoint & Google Slides
Process
Business System Five-Step Process Template for PowerPoint & Google Slides
Process
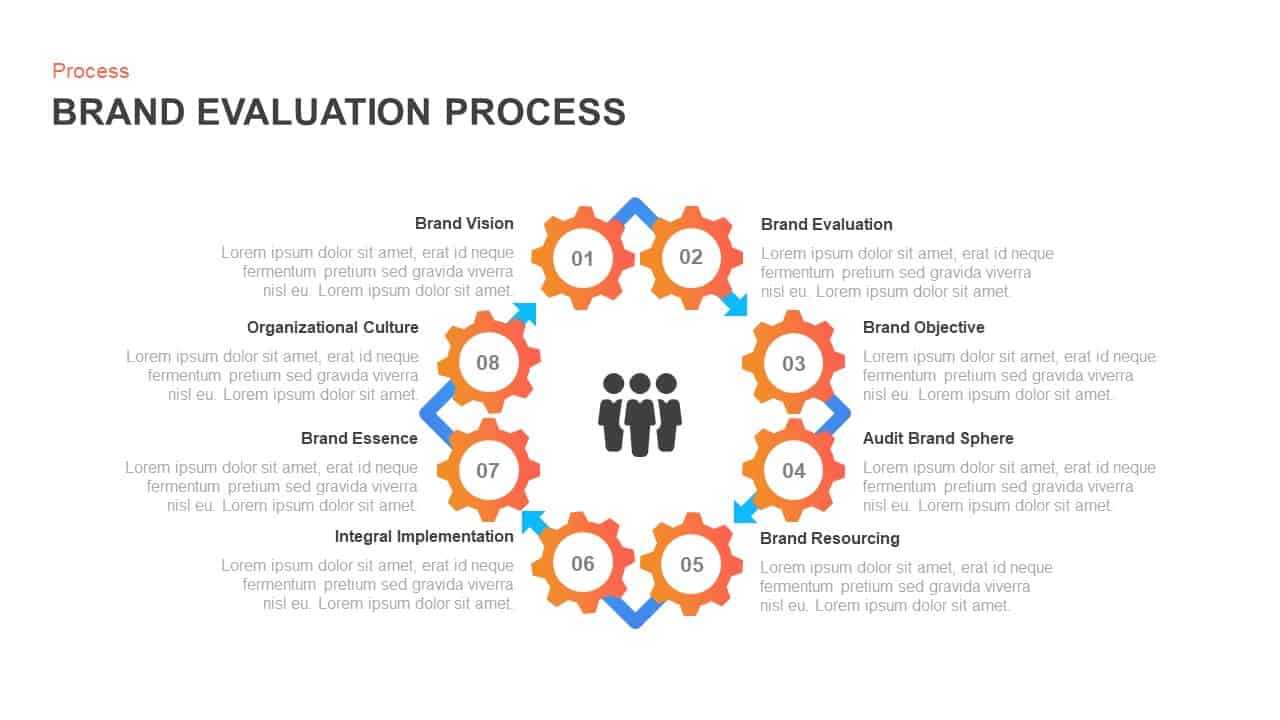
8-Stage Brand Evaluation Process Diagram Template for PowerPoint & Google Slides
Process
8 Step Circular Process Flow Diagram Template for PowerPoint & Google Slides
Process
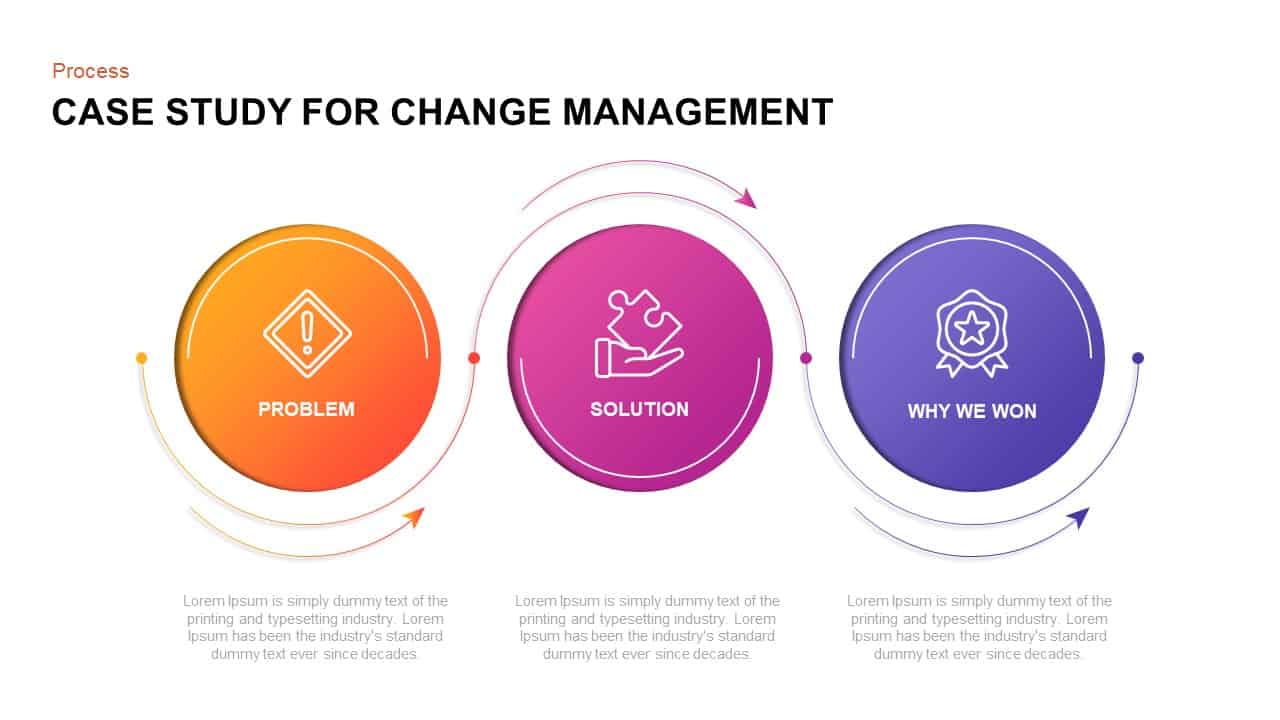
Case Study for Change Management Process Template for PowerPoint & Google Slides
Process
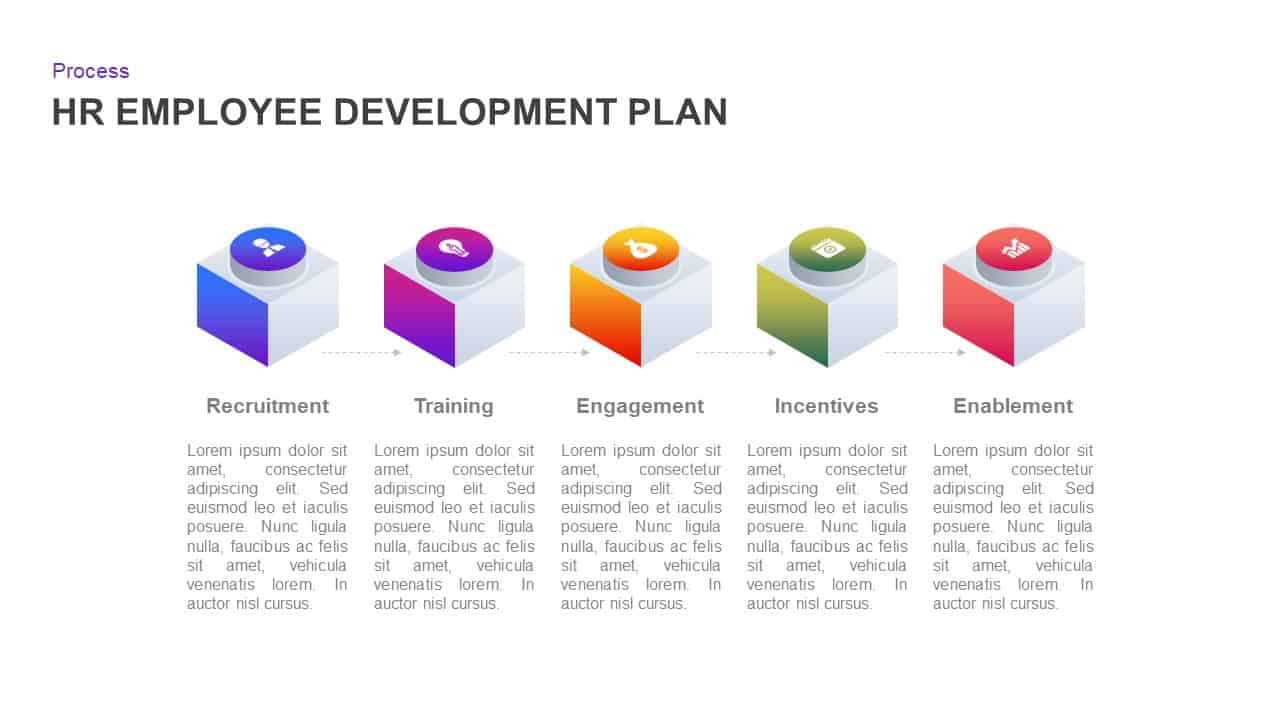
HR Employee Development Plan Process Template for PowerPoint & Google Slides
Employee Performance
6-Step Circular Process Flow Diagram Template for PowerPoint & Google Slides
Process
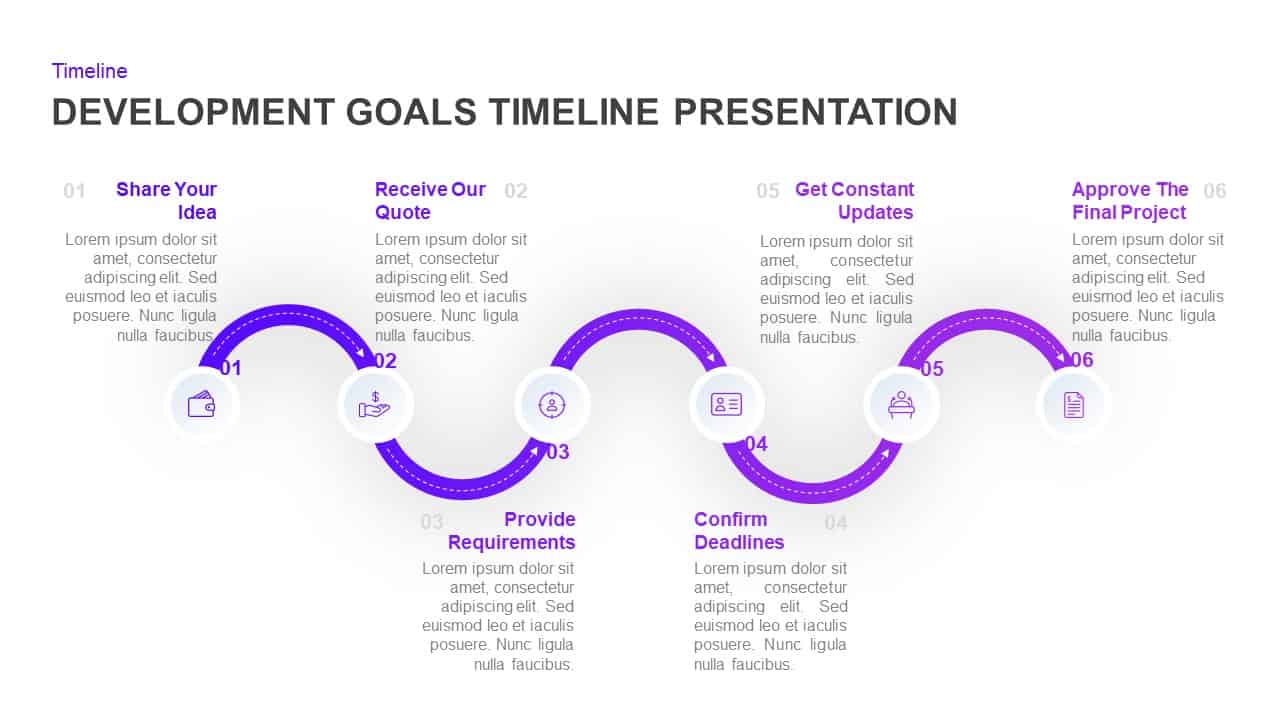
Development Goals Timeline Process Template for PowerPoint & Google Slides
Goals
Six-Step Infinity Loop Process Diagram Template for PowerPoint & Google Slides
Process
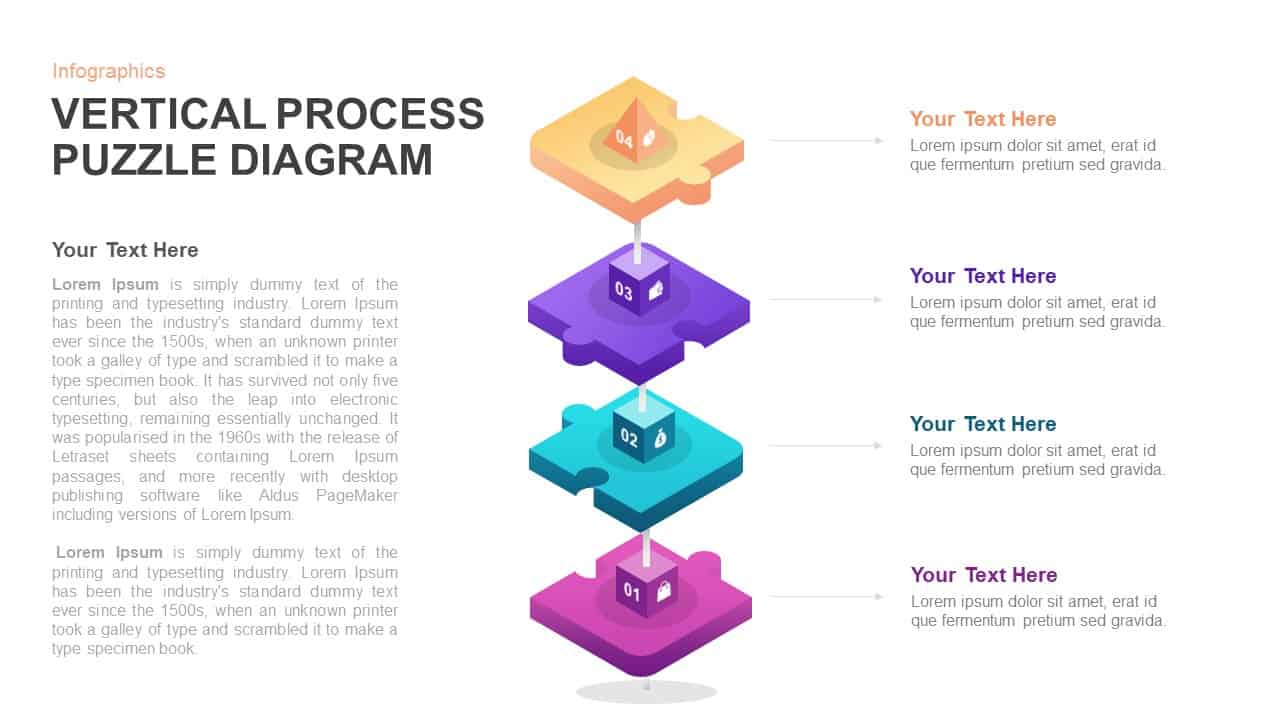
Vertical 4-Step Puzzle Process Diagram Template for PowerPoint & Google Slides
Process
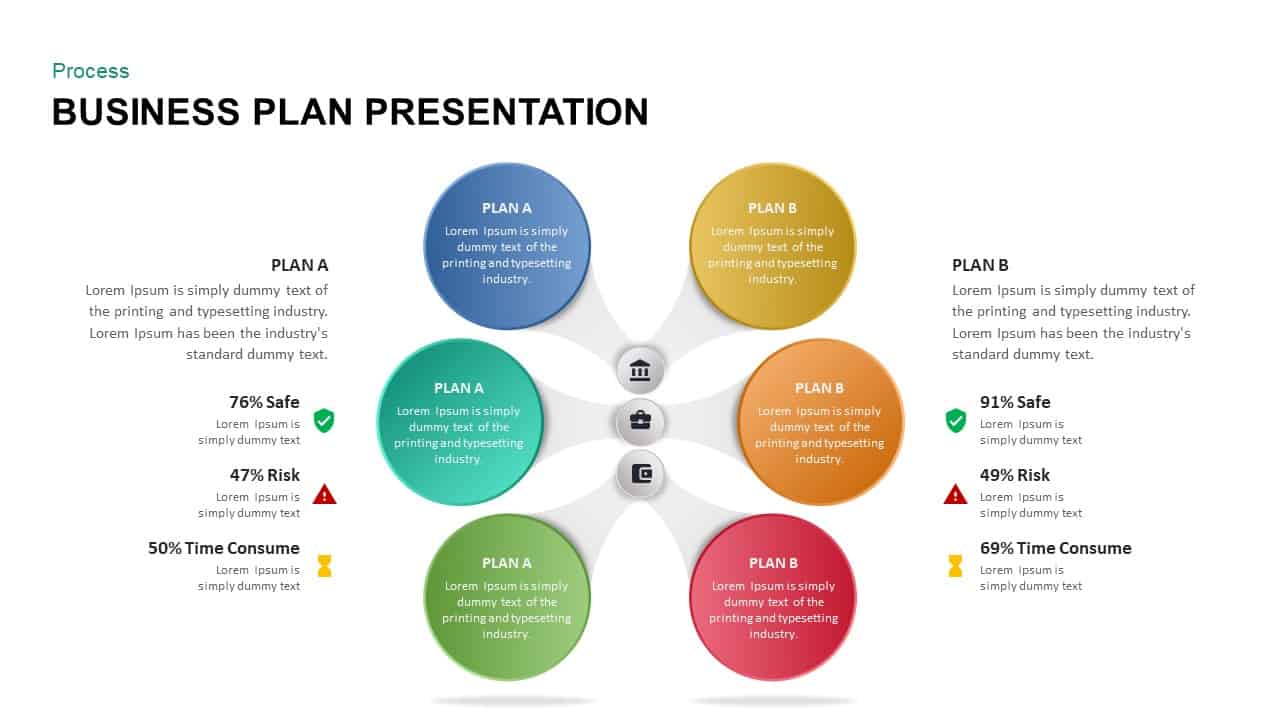
Business Plan Presentation Process template for PowerPoint & Google Slides
Business Plan

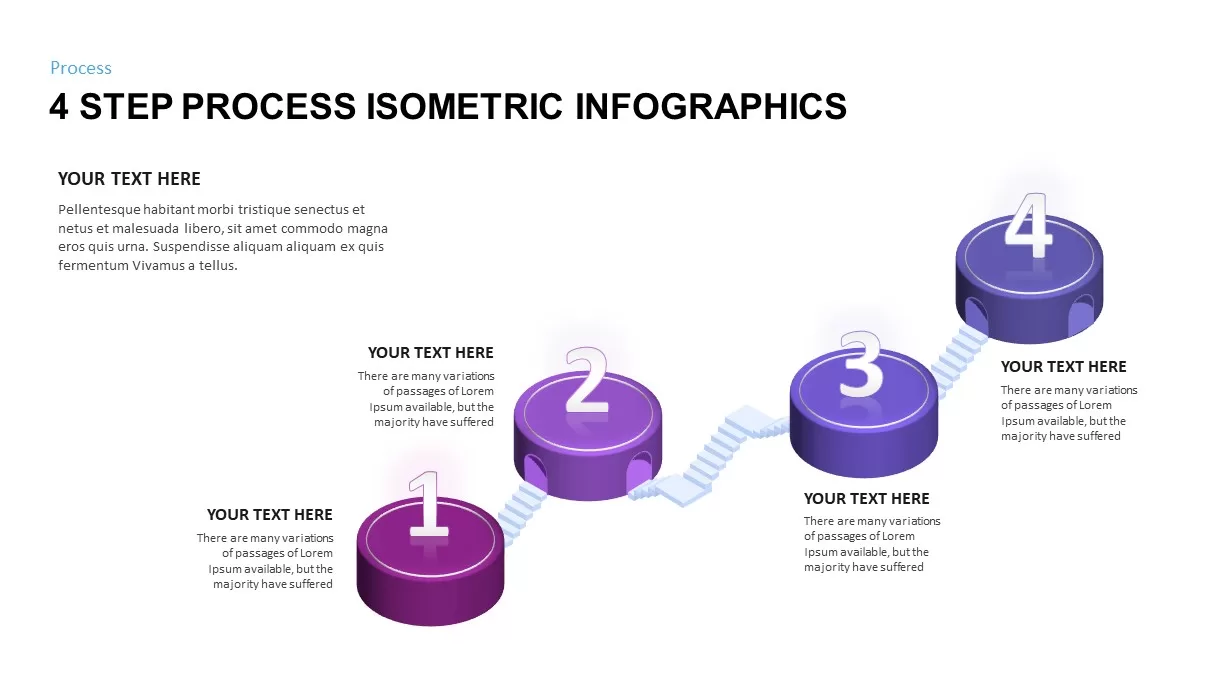
Four-Step Isometric Process Infographic Template for PowerPoint & Google Slides
Process
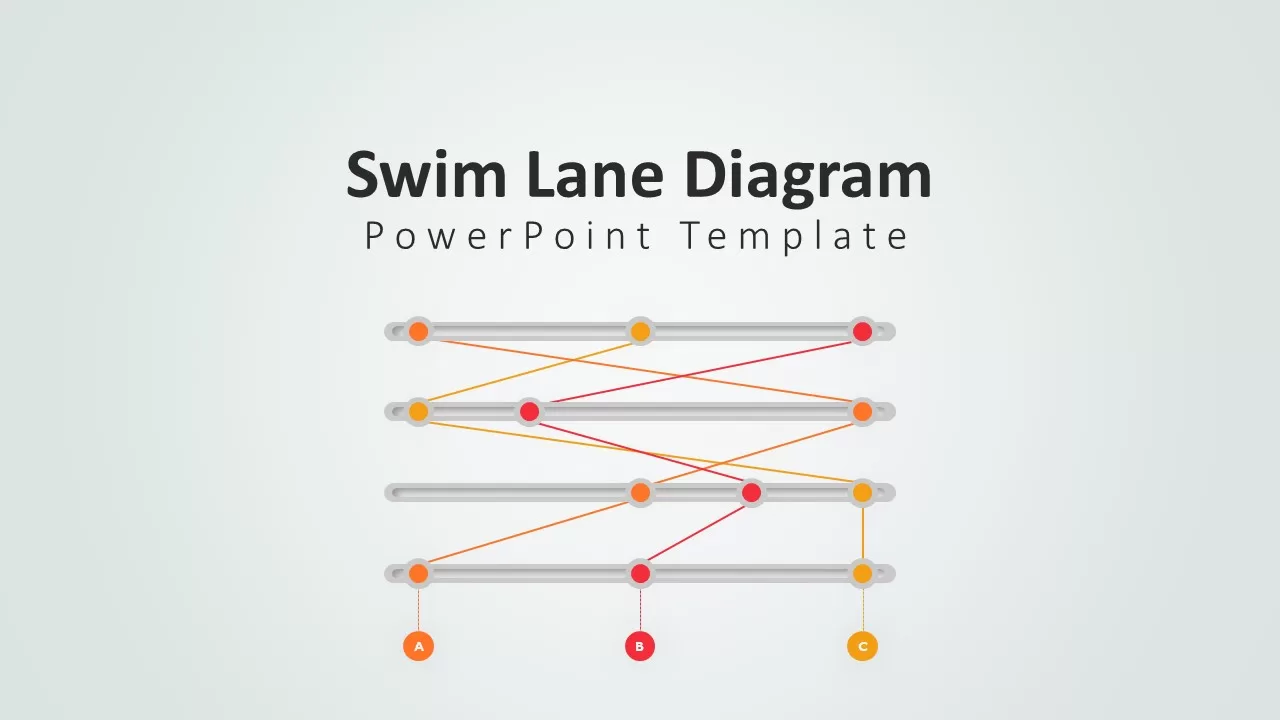
Swim Lane Diagram PowerPoint & Google Slides Template for Process Mapping
Business Strategy
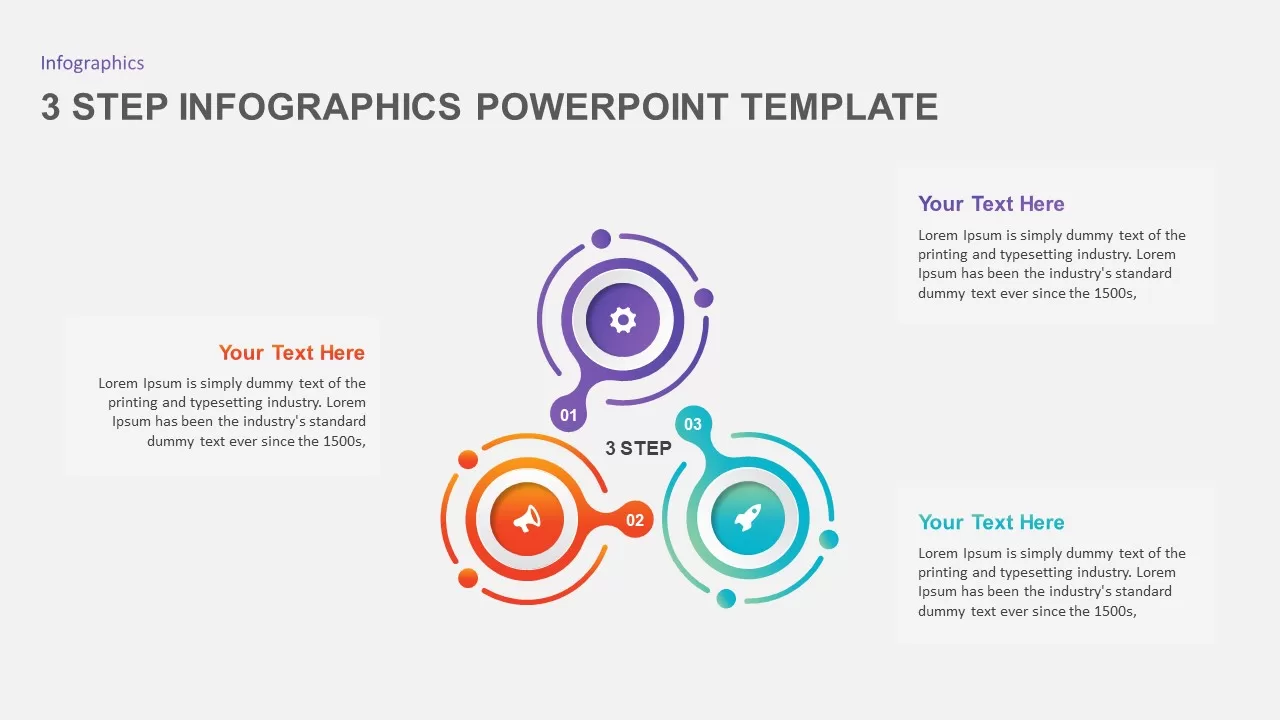
3 & 4 Step Circular Process Infographic Template for PowerPoint & Google Slides
Process
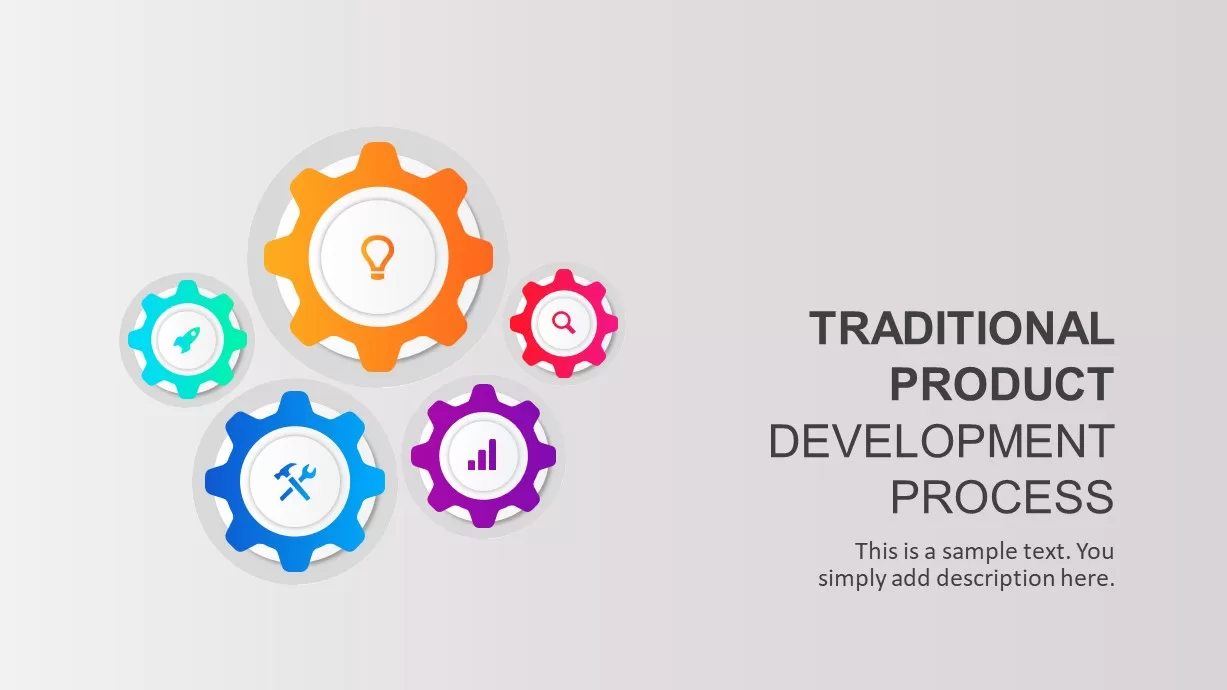
Traditional Product Development Process Template for PowerPoint & Google Slides
Process
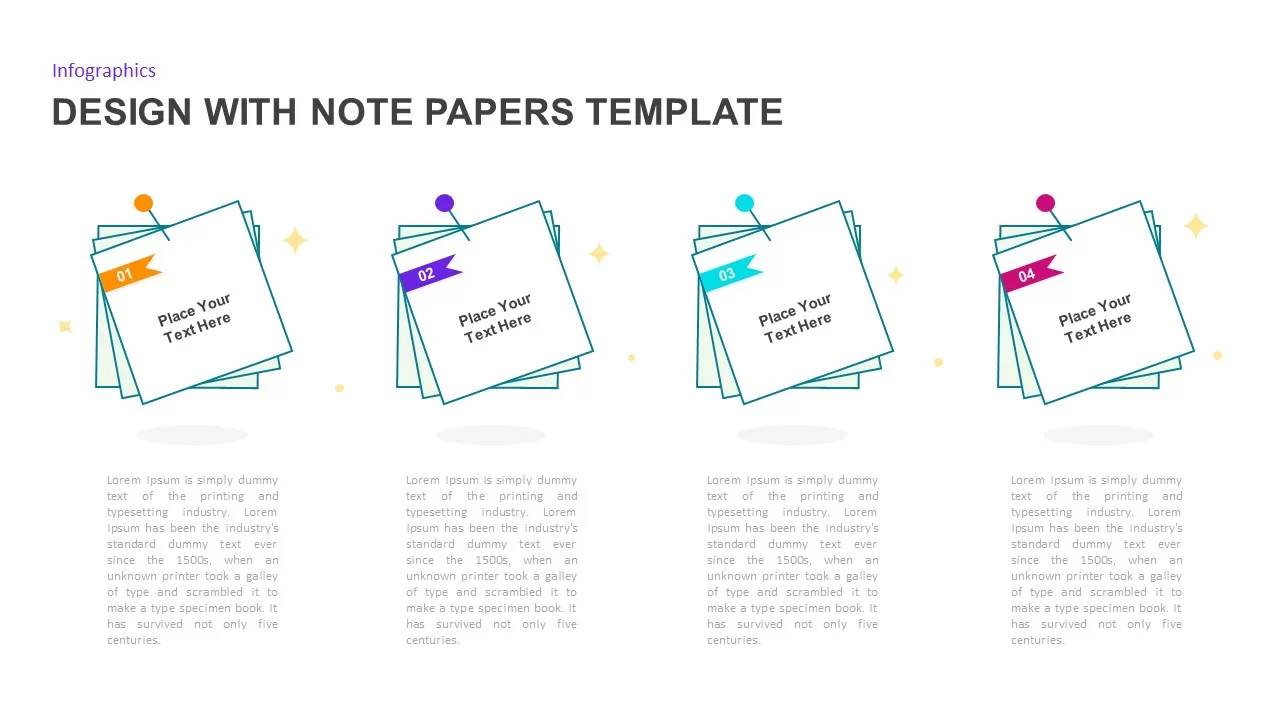
Pinnable Note-Paper Process Infographic Template for PowerPoint & Google Slides
Process
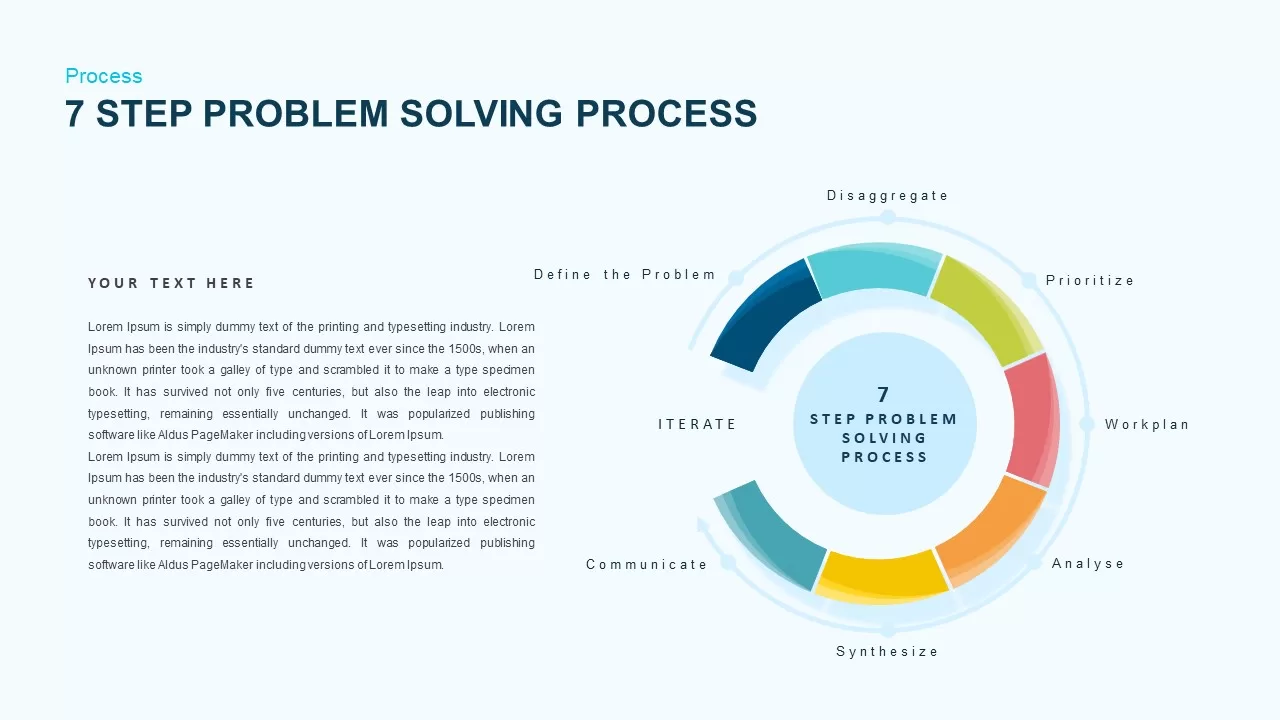
Problem Solving Process Diagram Template for PowerPoint & Google Slides
Process
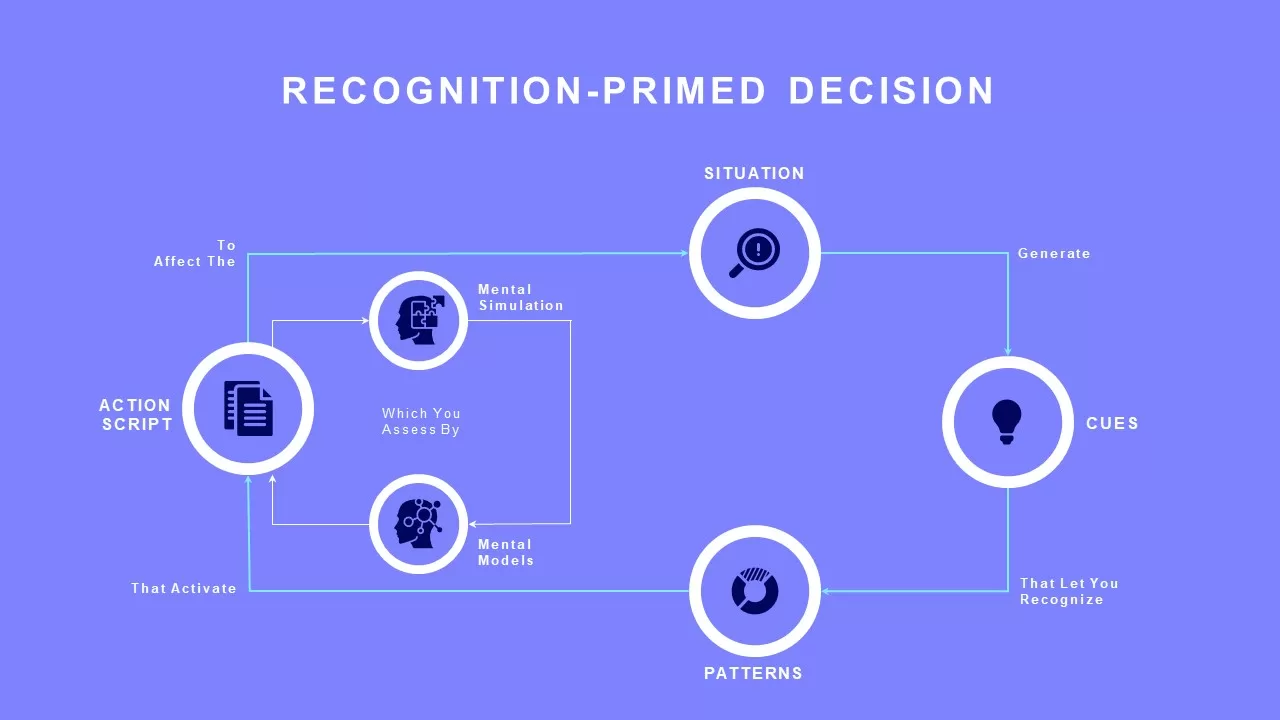
Recognition-Primed Decision Process Flow Template for PowerPoint & Google Slides
Flow Charts
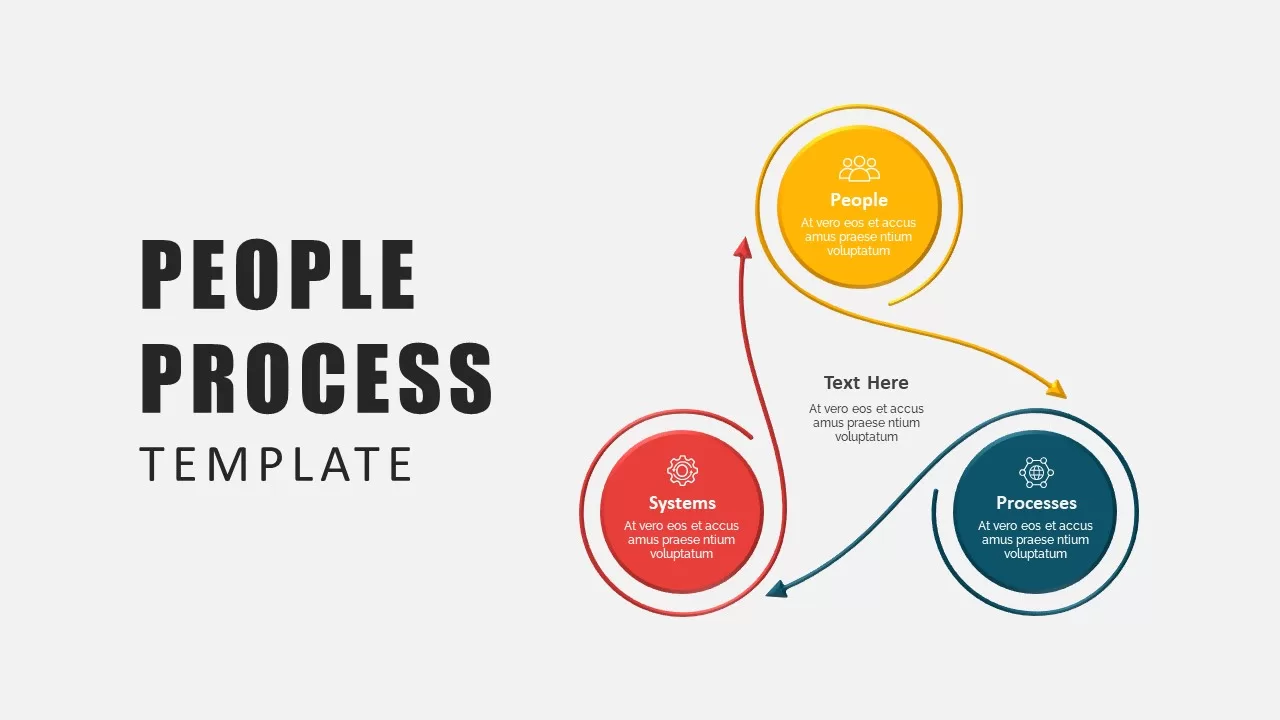
People-Process-Technology Infographic Template for PowerPoint & Google Slides
Process
5 Stage Process Flow Overview template for PowerPoint & Google Slides
Process
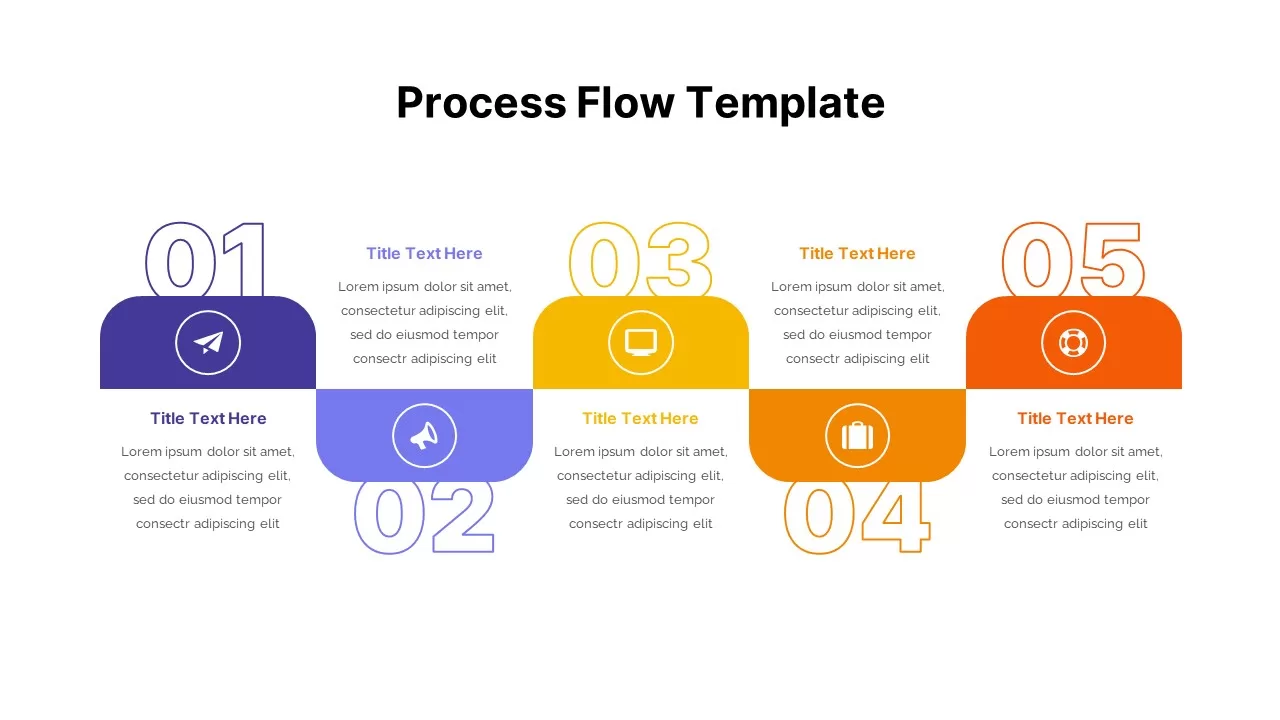
Multi-Step Infographic Process Layout Template for PowerPoint & Google Slides
Process
Chain Link Process Infographic Diagram Template for PowerPoint & Google Slides
Process
Ten-Step Circular Process Infographic Template for PowerPoint & Google Slides
Circular
Dynamic Conveyor Belt Process Flow Template for PowerPoint & Google Slides
Process
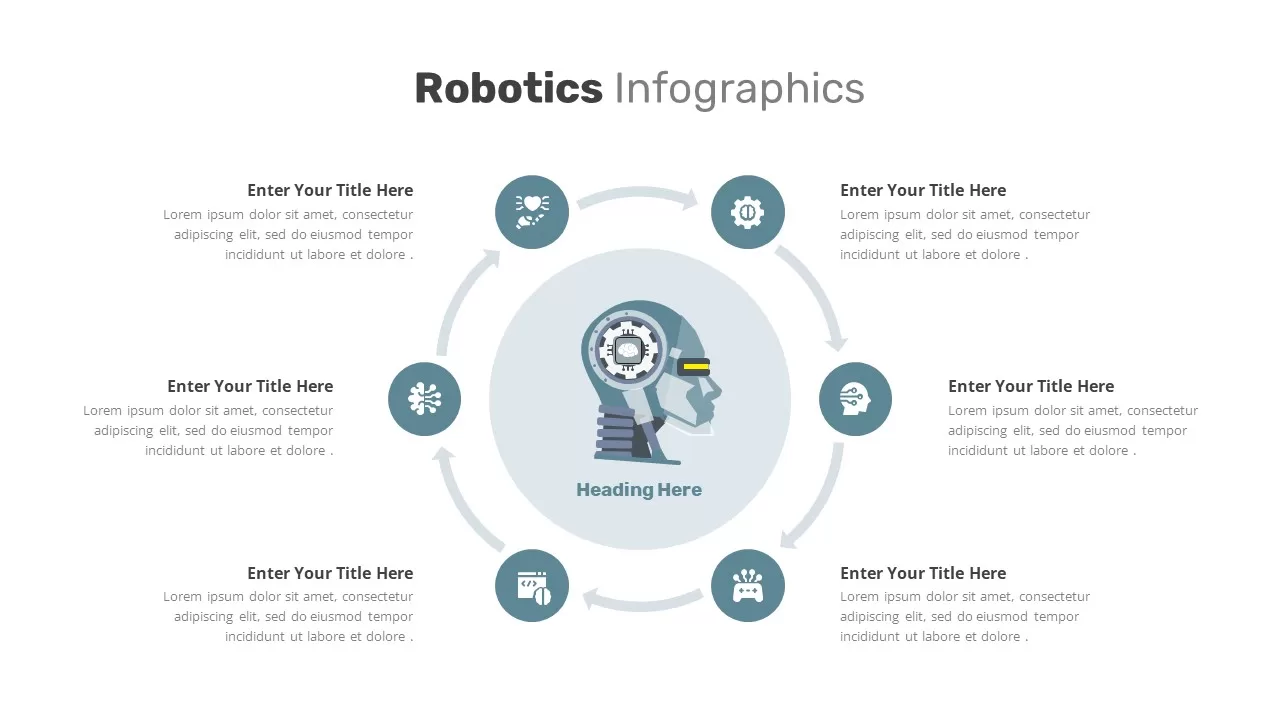
Robotics Process Cycle Infographic Template for PowerPoint & Google Slides
Process
Process improvement roadmap template for PowerPoint & Google Slides
Process
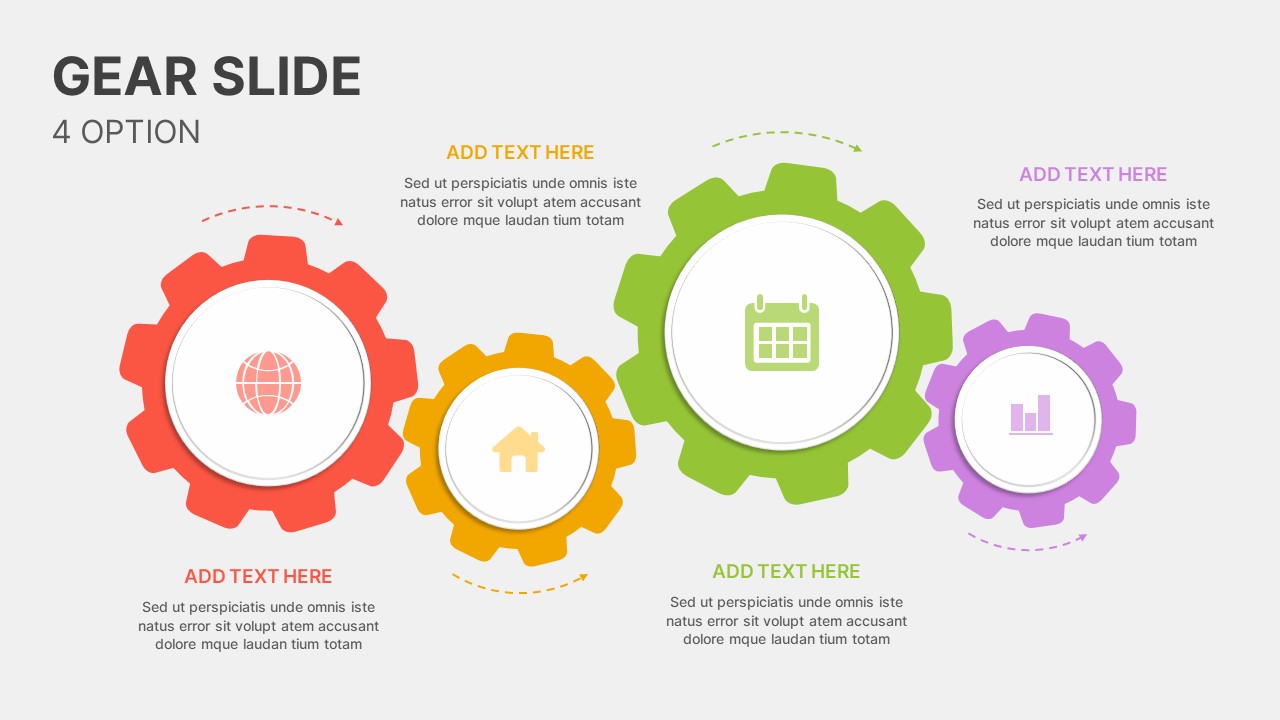
Dynamic Four-Step Gear Process Template for PowerPoint & Google Slides
Process
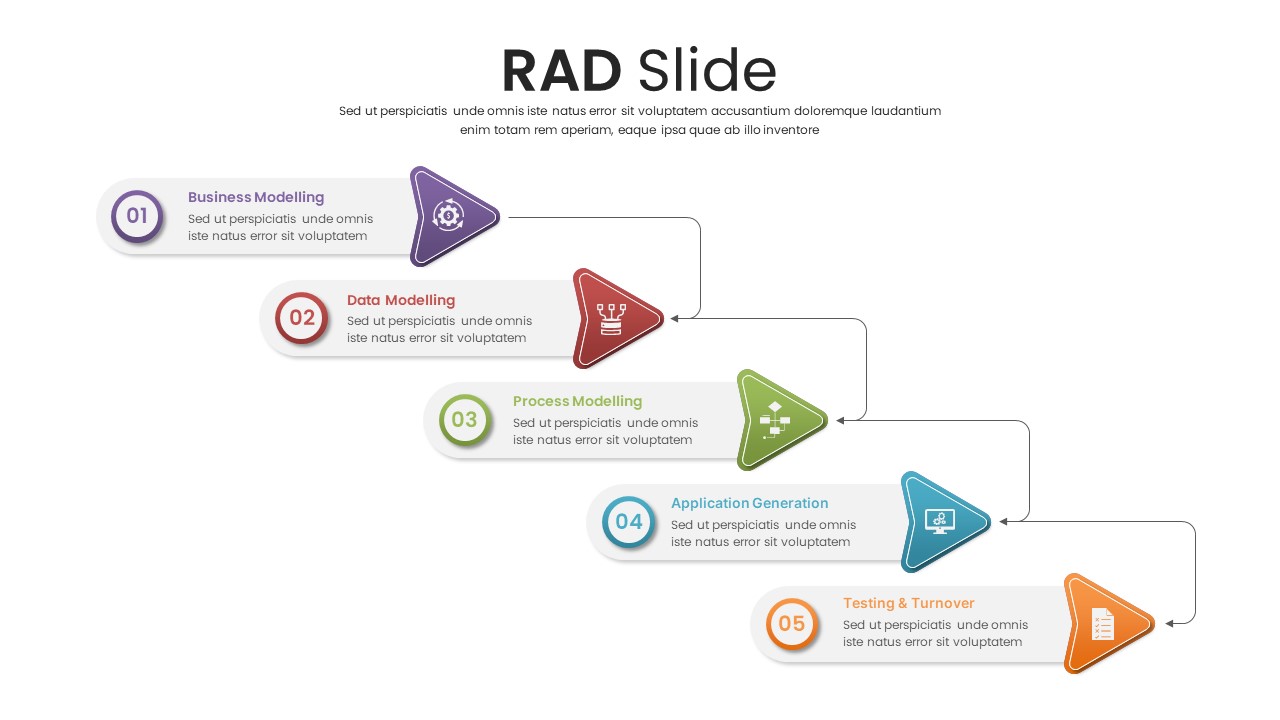
Professional Five-Step RAD Process Slide Template for PowerPoint & Google Slides
Process
E-Waste Management Process Flow Diagram Template for PowerPoint & Google Slides
Process
Cloud Kitchen Business Process Diagram Template for PowerPoint & Google Slides
Process
Training Needs Analysis Process Template for PowerPoint & Google Slides
Employee Performance

DevOps Infographics & Process Flow Template for PowerPoint & Google Slides
Information Technology
Quality Control Process Presentation Template for PowerPoint & Google Slides
Process
Free Next Steps Process Timeline Template for PowerPoint & Google Slides
Project
Client Onboarding Milestones Process Template for PowerPoint & Google Slides
Process
Employee Promotion Process Infographic Template for PowerPoint & Google Slides
Employee Performance
Culture Change Circular Process Diagram Template for PowerPoint & Google Slides
Process
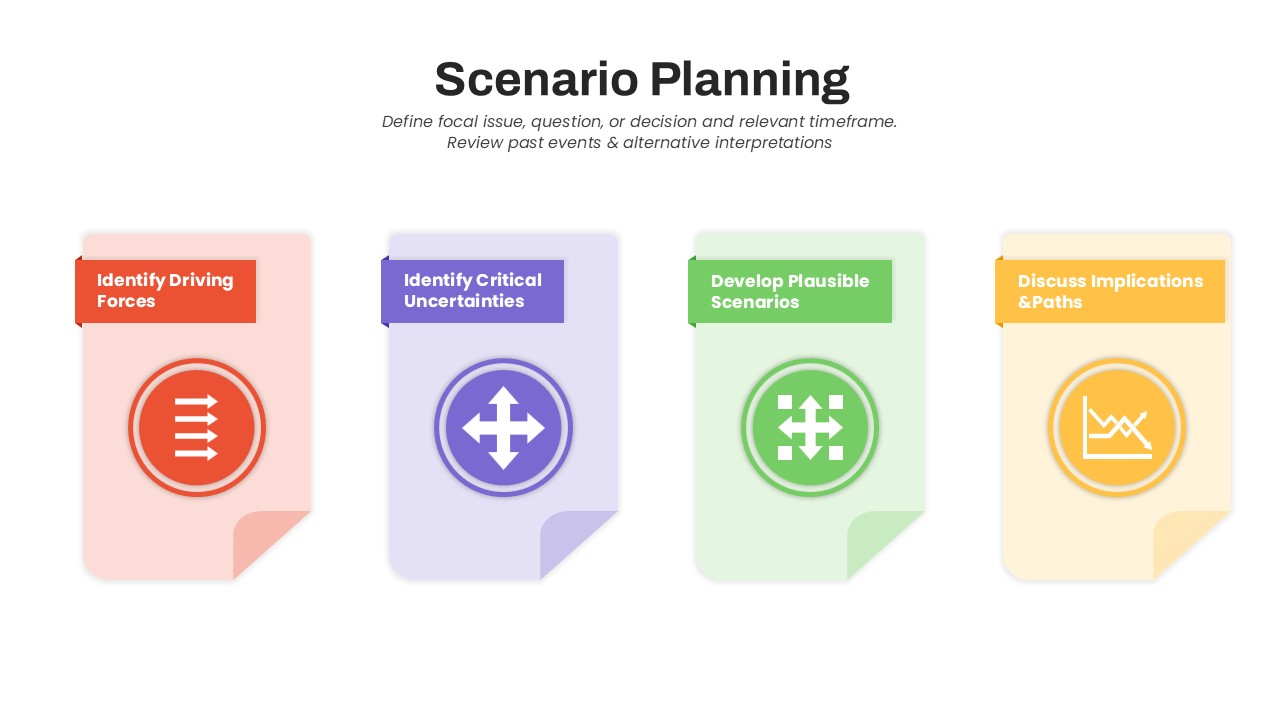
Scenario Planning Process Diagram Template for PowerPoint & Google Slides
Process
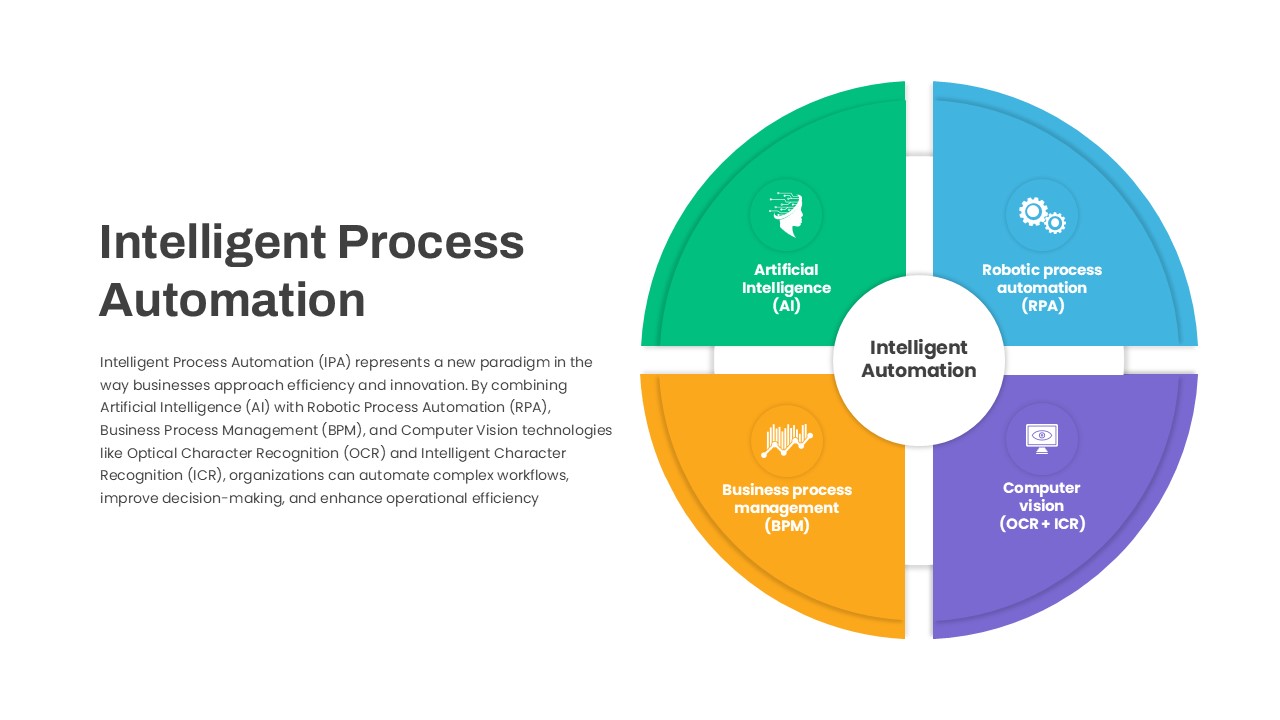
Intelligent Process Automation Diagram Template for PowerPoint & Google Slides
Circular
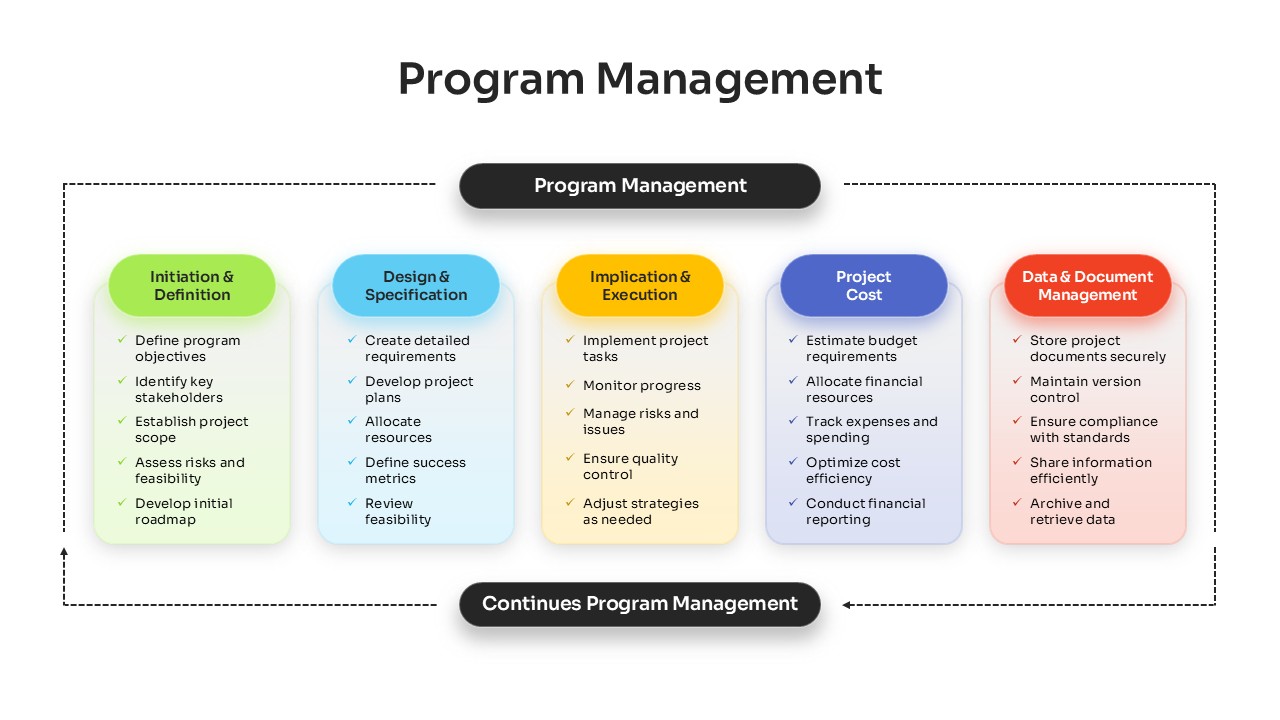
Comprehensive Program Management Process Template for PowerPoint & Google Slides
Process
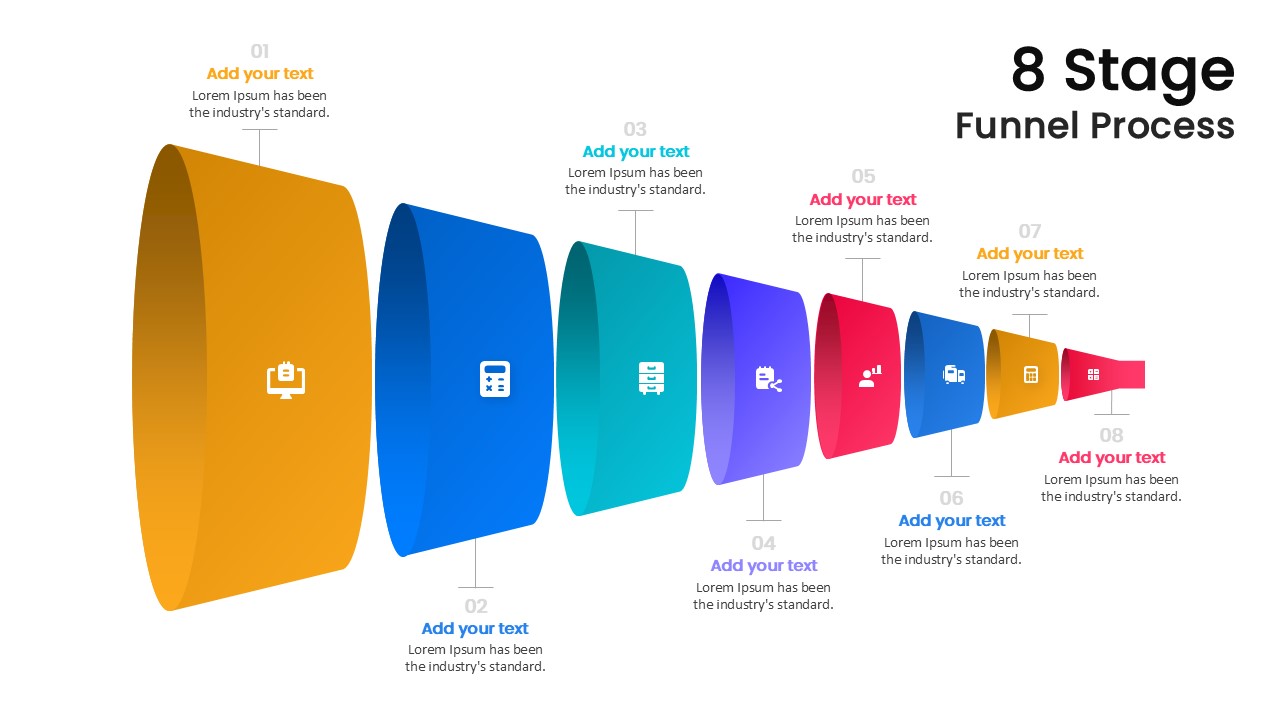
8 Stage Funnel Process template for PowerPoint & Google Slides
Funnel
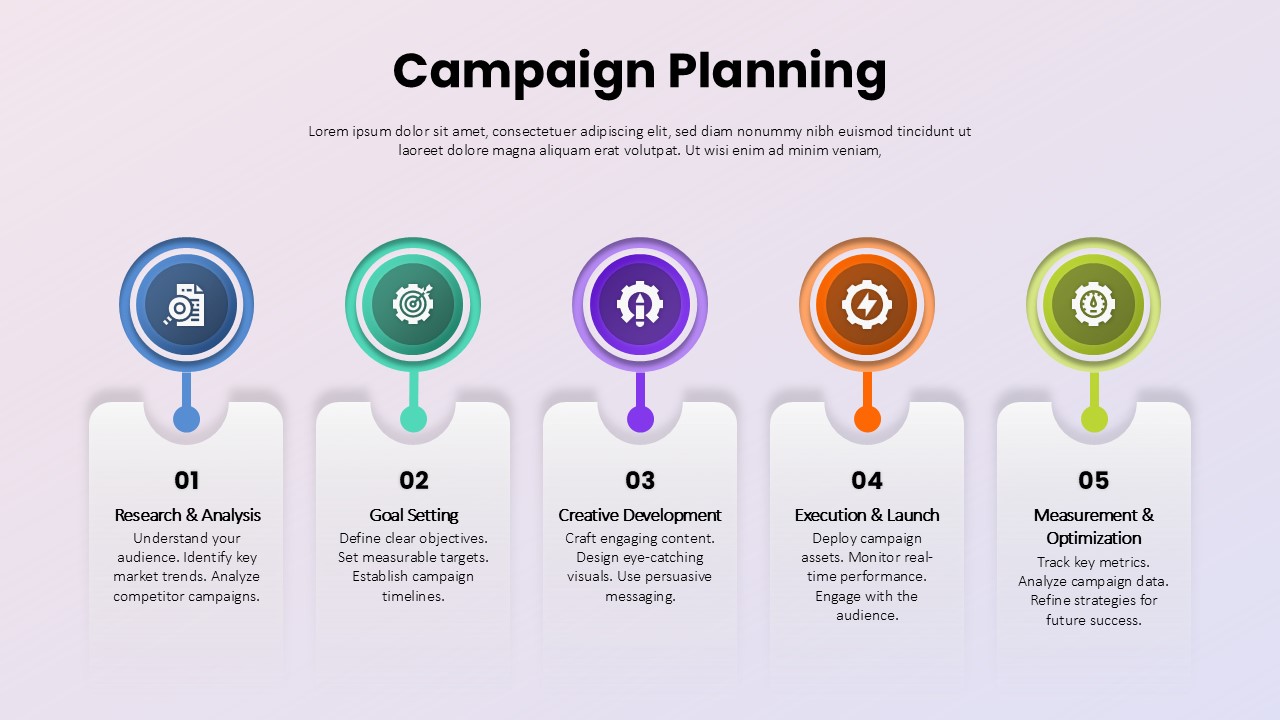
Campaign Planning Process template for PowerPoint & Google Slides
Process
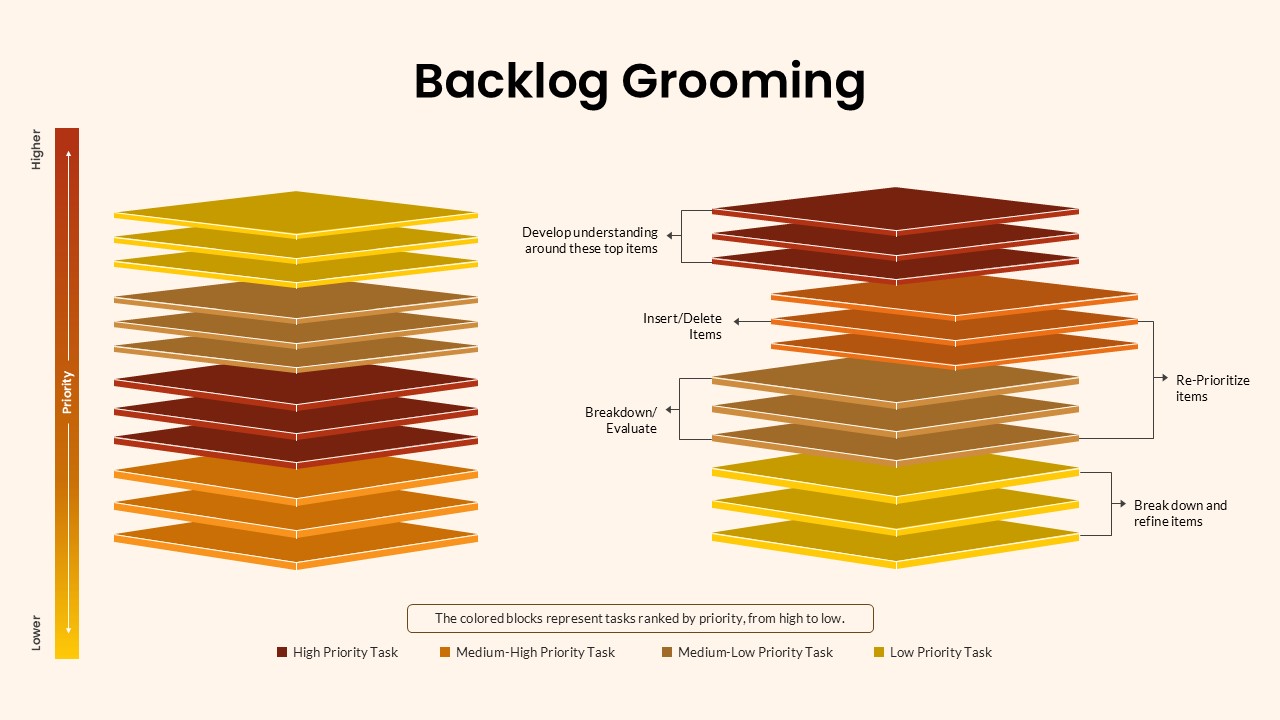
Backlog Grooming Process template for PowerPoint & Google Slides
Process
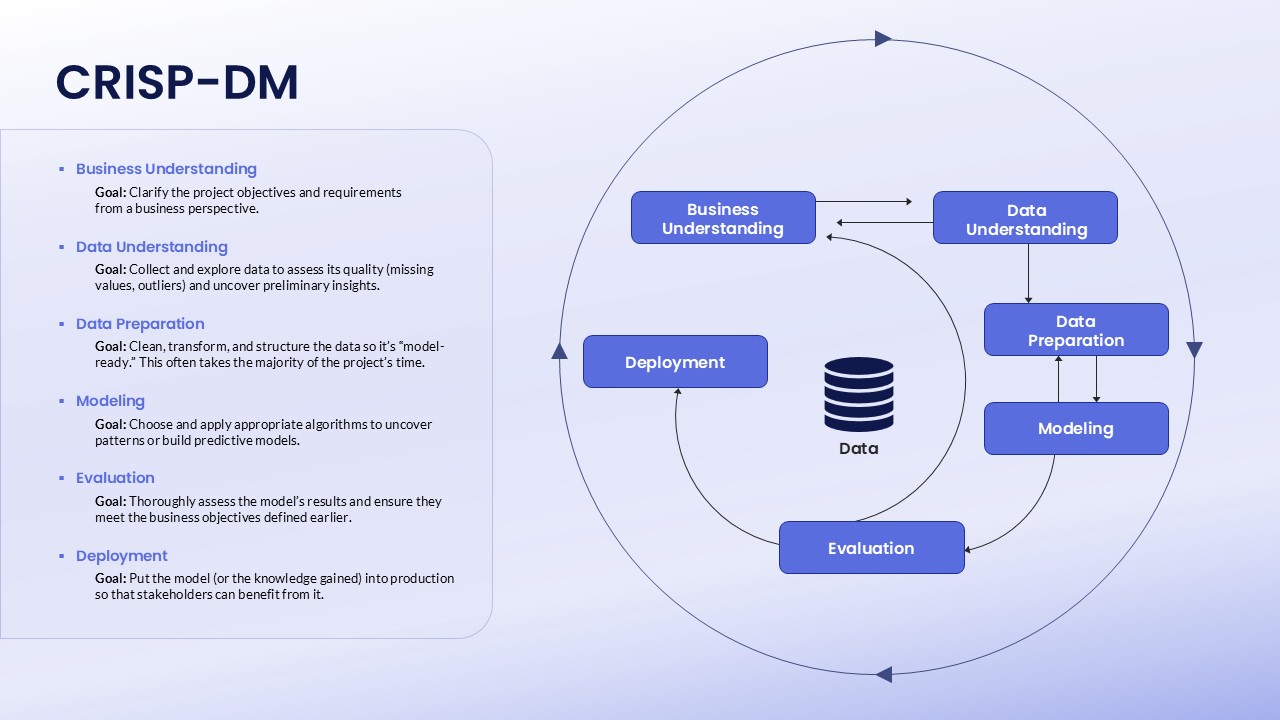
CRISP-DM Process Framework template for PowerPoint & Google Slides
Technology
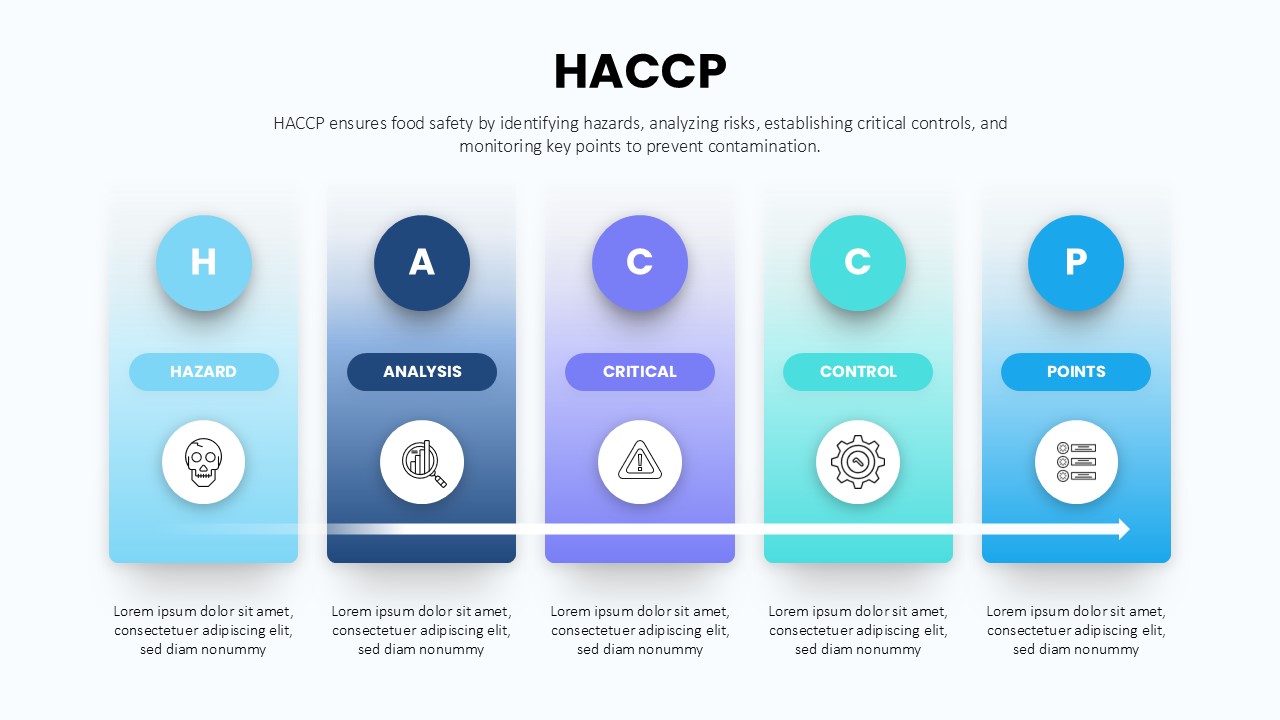
HACCP 5-Step Food Safety Process Diagram Template for PowerPoint & Google Slides
Process
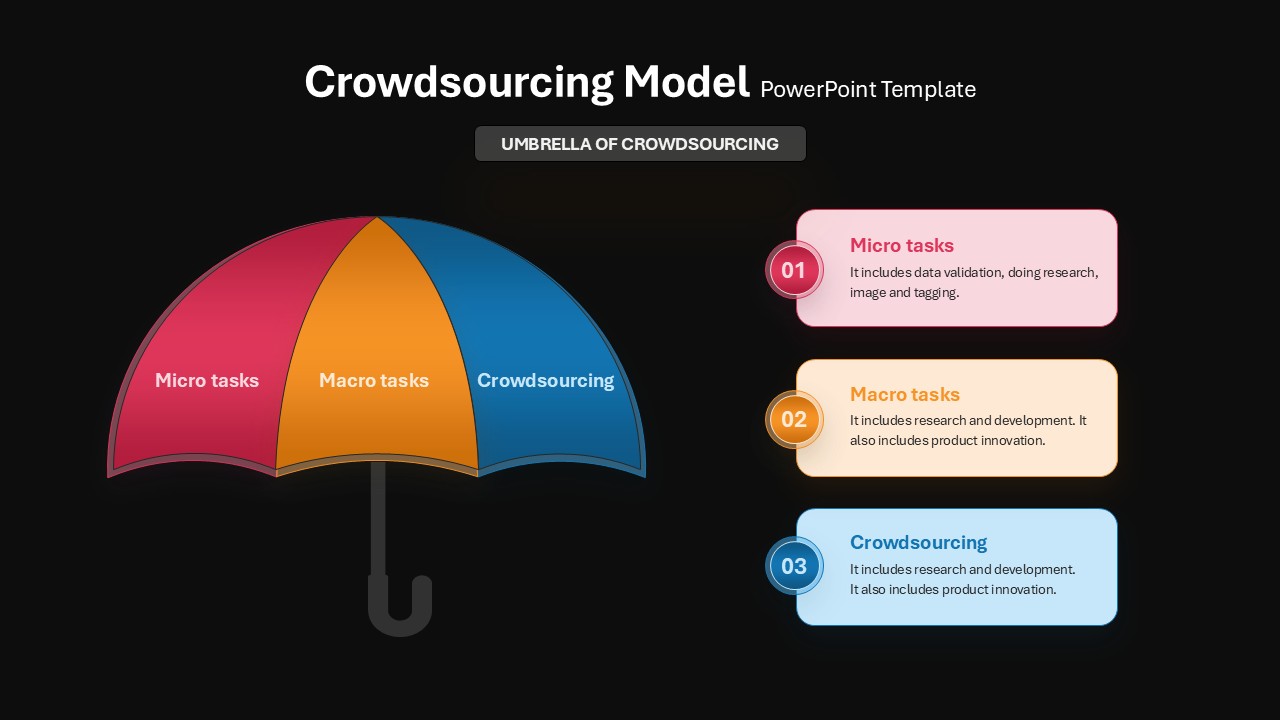
Crowdsourcing Model Umbrella & Process Template for PowerPoint & Google Slides
Infographics
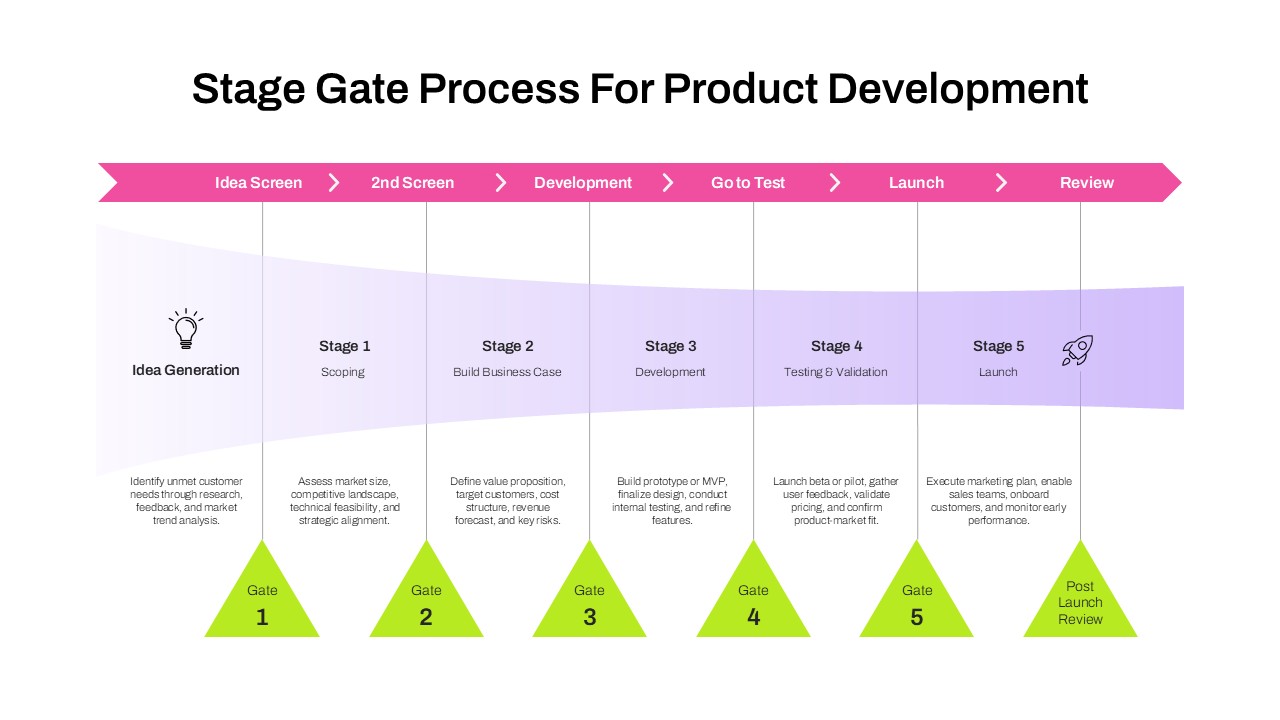
Stage Gate Process for Product Development Template for PowerPoint & Google Slides
Process