Seven Stage Machine Learning Pipeline Template for PowerPoint & Google Slides
Description
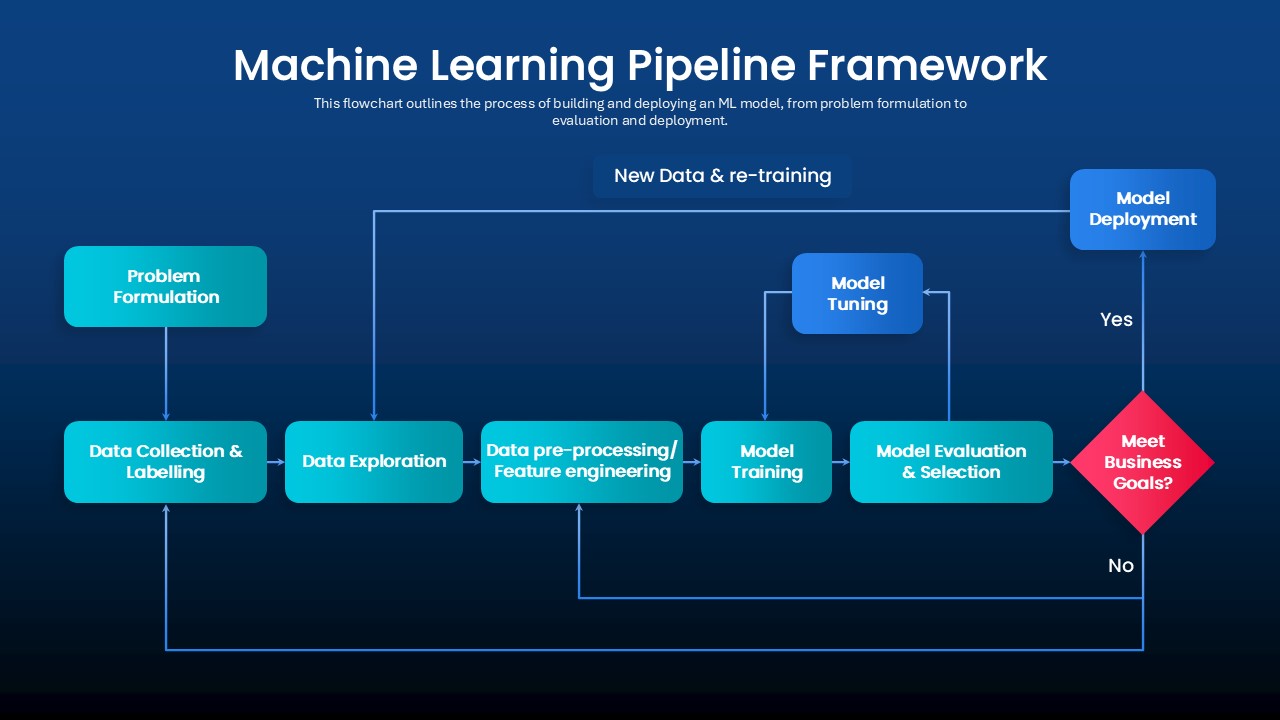
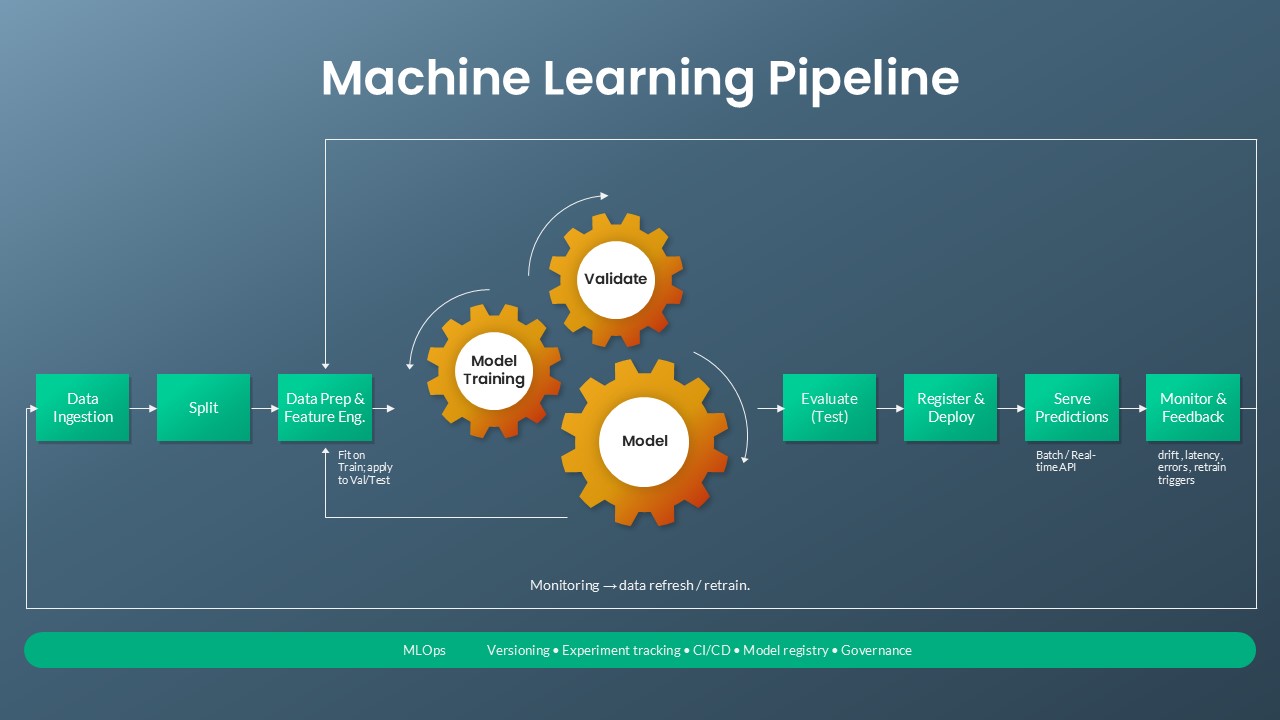
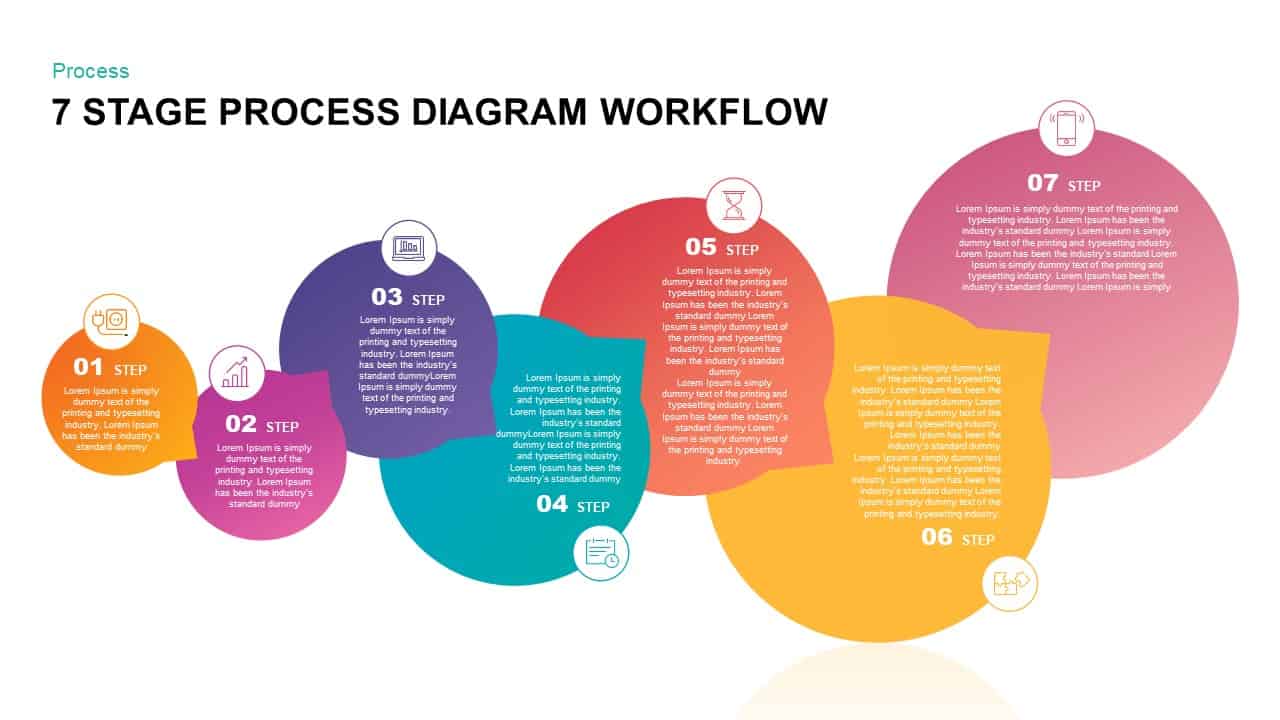
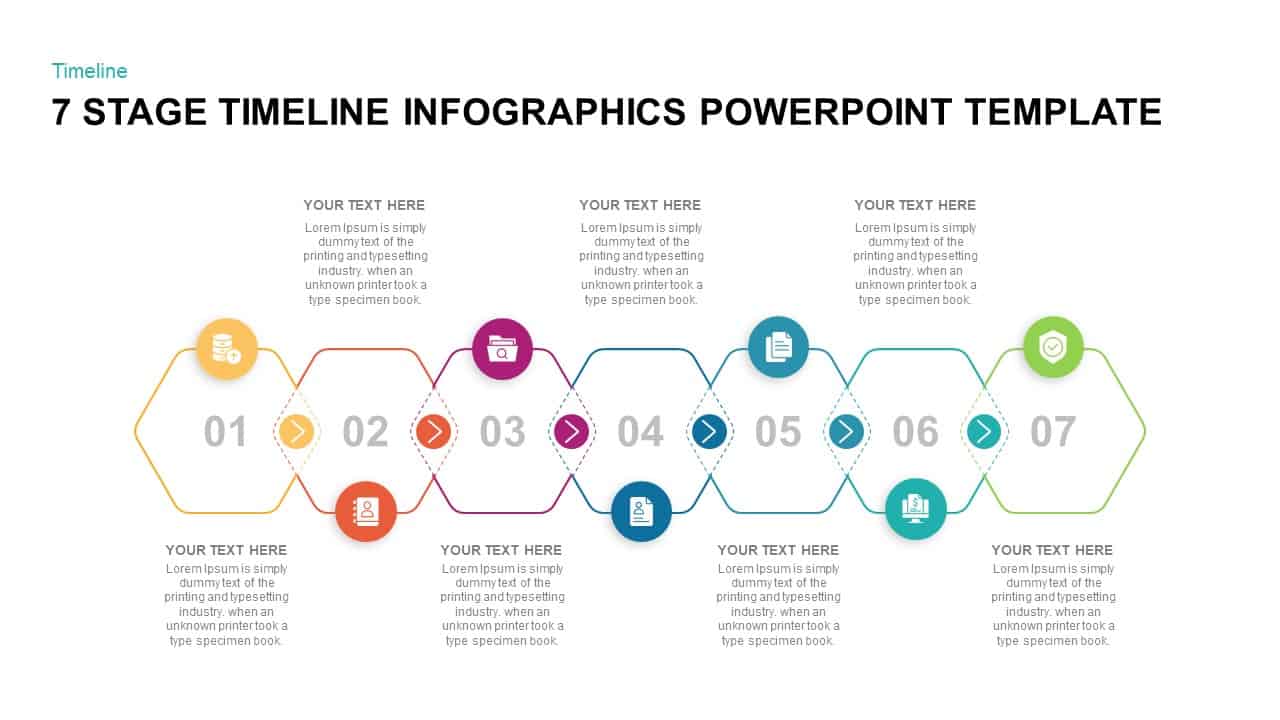
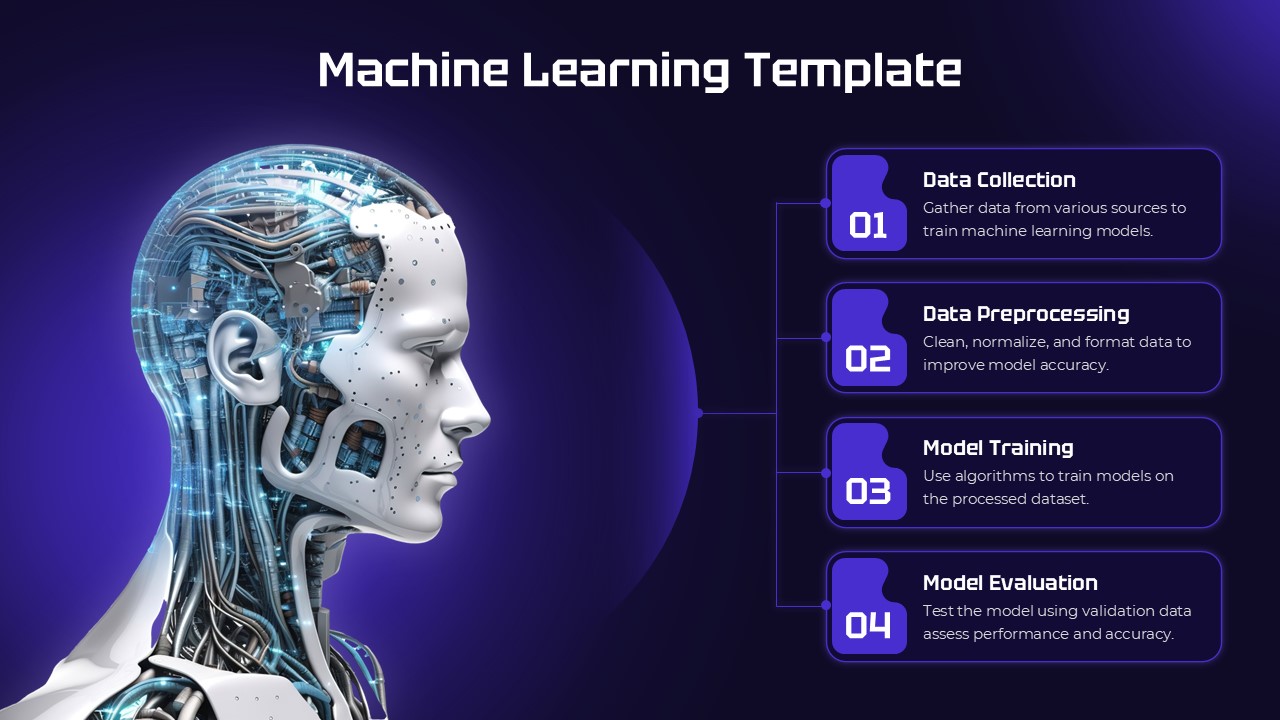
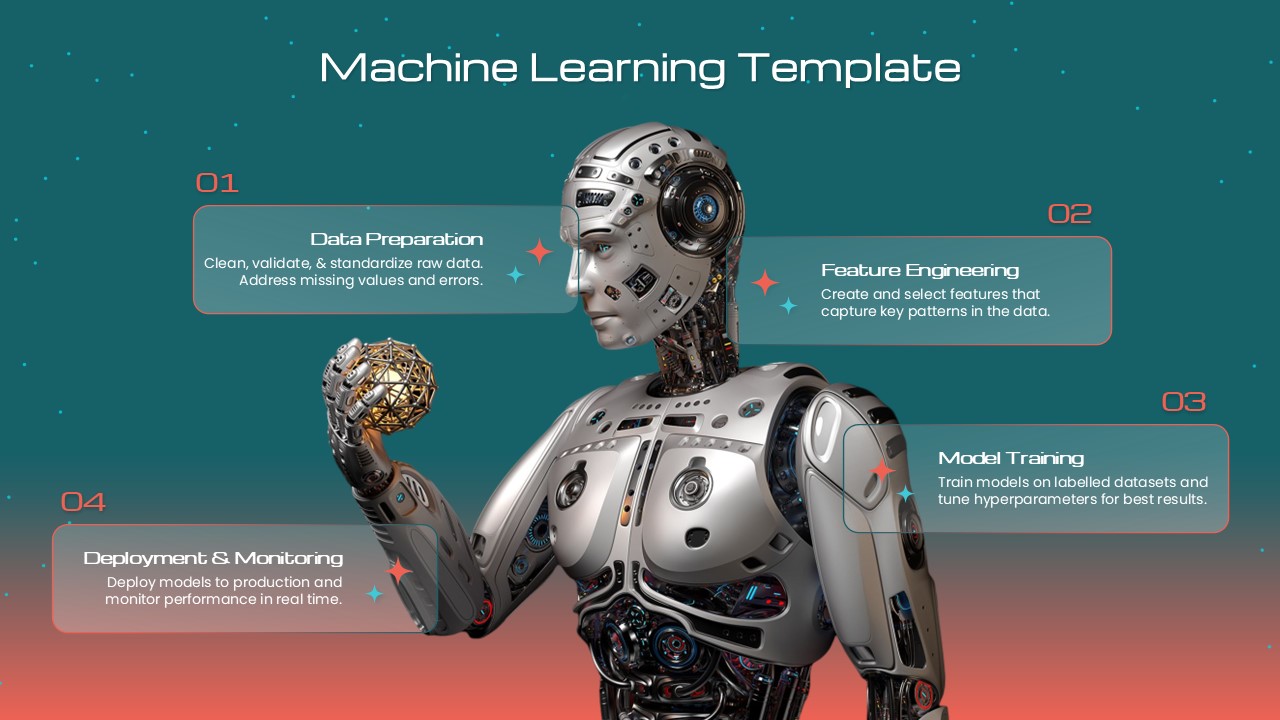
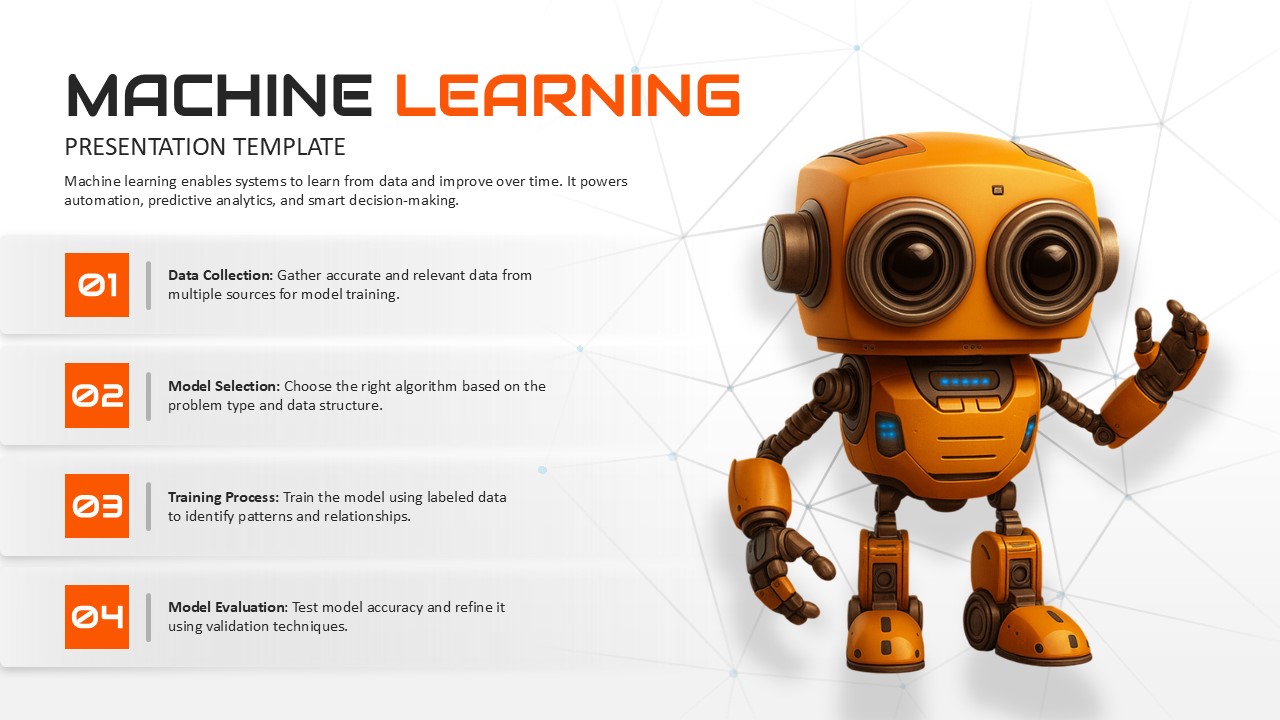
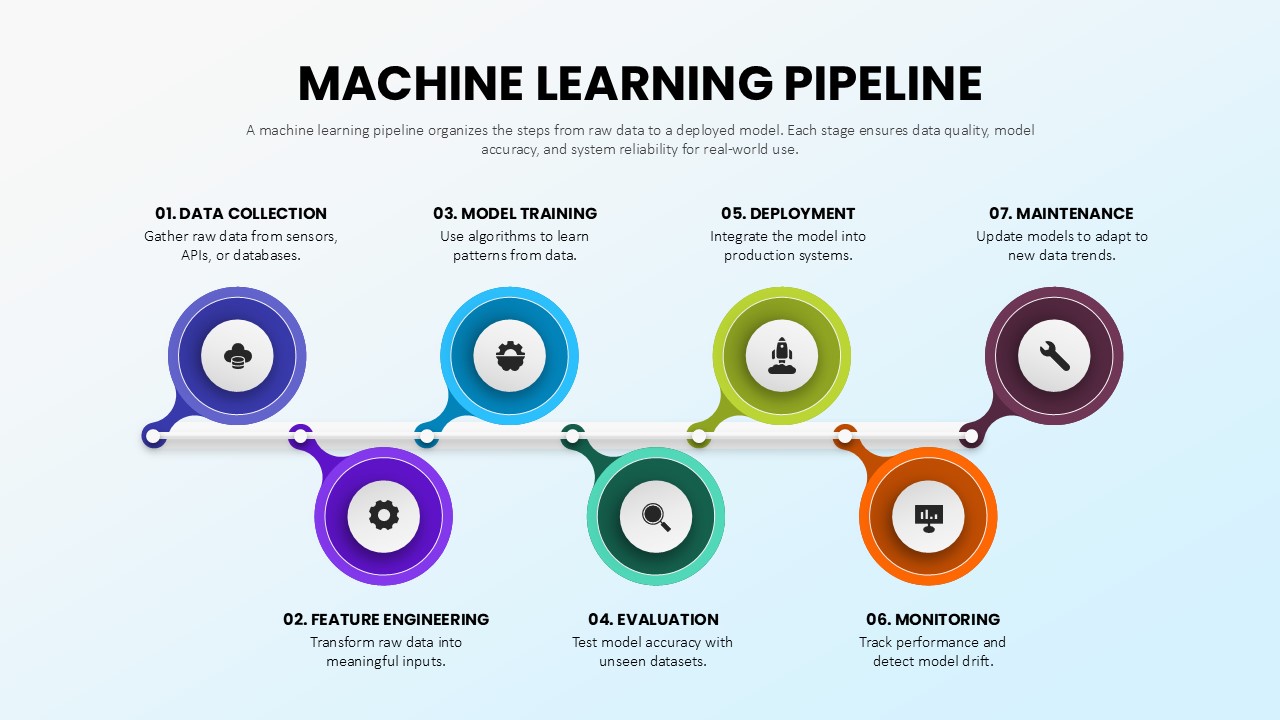
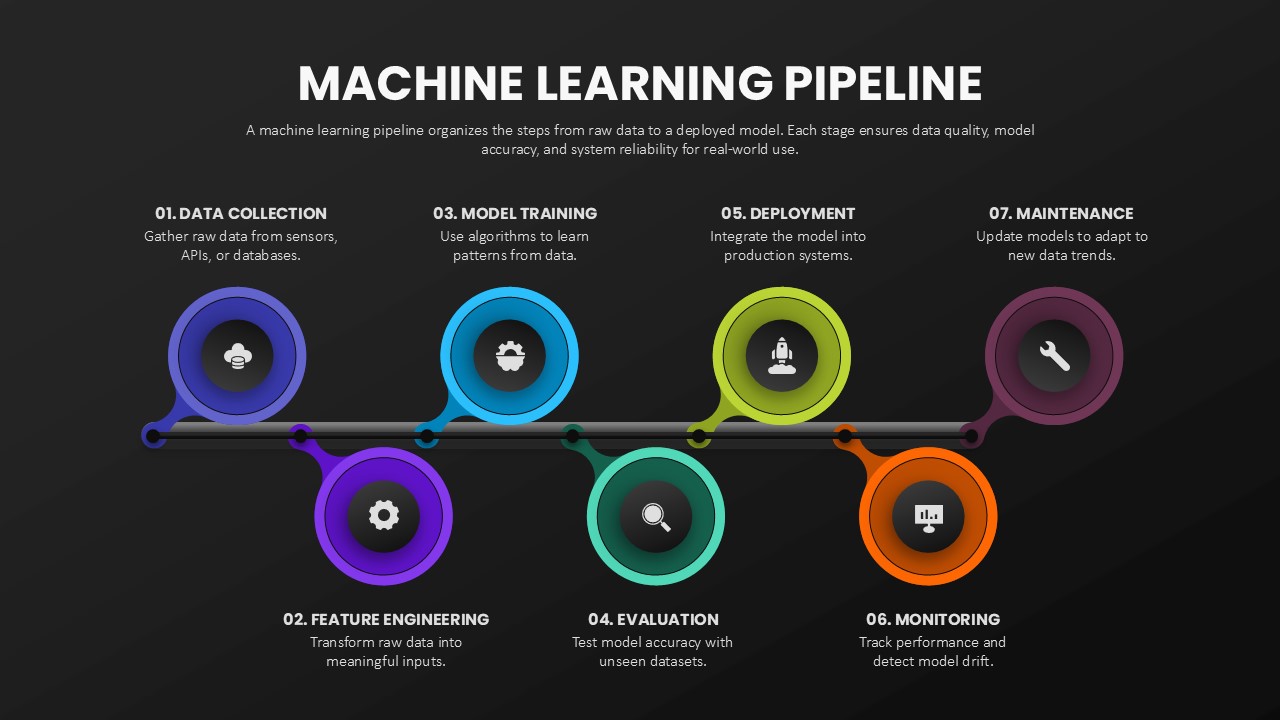
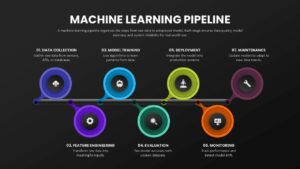
The Seven Stage Machine Learning Pipeline Template for PowerPoint and Google Slides offers a complete visual representation of the end-to-end process used in building, deploying, and maintaining machine learning models. This clean, horizontal timeline flow highlights seven sequential stages—Data Collection, Feature Engineering, Model Training, Evaluation, Deployment, Monitoring, and Maintenance—to help audiences understand how raw data transforms into actionable AI insights.
Each stage is marked by a distinct circular icon with vivid colors and clear numbering for easy tracking. The gradient palette ranging from blue to green to orange ensures visual progression while maintaining a professional and modern appearance. Supporting captions under each stage briefly describe critical tasks such as data gathering, preprocessing, algorithm training, accuracy testing, and model optimization.
Perfect for technical presentations, data science education, and corporate AI briefings, this template simplifies complex workflows into digestible visuals. Fully editable in both PowerPoint and Google Slides, users can modify icons, color schemes, or descriptions to fit specific models or business applications. The layout’s clarity and structured design make it ideal for communicating technical processes to both expert and non-technical stakeholders.
Who is it for
Designed for data scientists, AI researchers, technology consultants, and IT managers who need to present machine learning workflows, project lifecycles, or AI strategy roadmaps.
Other Uses
This pipeline visual can also be adapted for data analytics workflows, software development lifecycles, research methodologies, or process automation overviews. It’s a powerful tool for training sessions, academic lectures, and business innovation meetings.
Login to download this file

Item ID
SB05608Designed By
Anand
Related Templates

Machine Learning Pipeline Framework Template for PowerPoint & Google Slides
Charts
Machine Learning Pipeline Overview Template for PowerPoint & Google Slides
Machine Learning
Machine Learning Pipeline & MLOps Flow Template for PowerPoint & Google Slides
Machine Learning
Four-Stage Development Pipeline Template for PowerPoint & Google Slides
Process
Seven-Stage Arrow Process Diagram Template for PowerPoint & Google Slides
Process
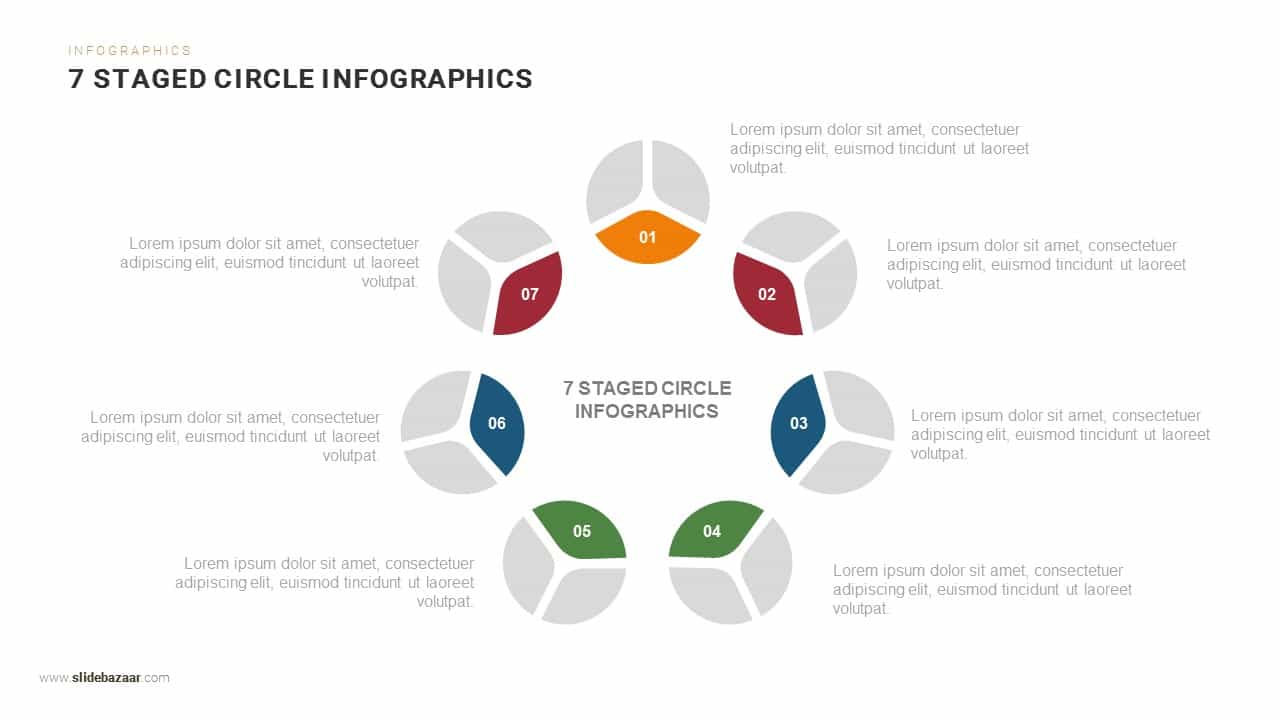
Seven-Stage Circular Infographic Template for PowerPoint & Google Slides
Circular

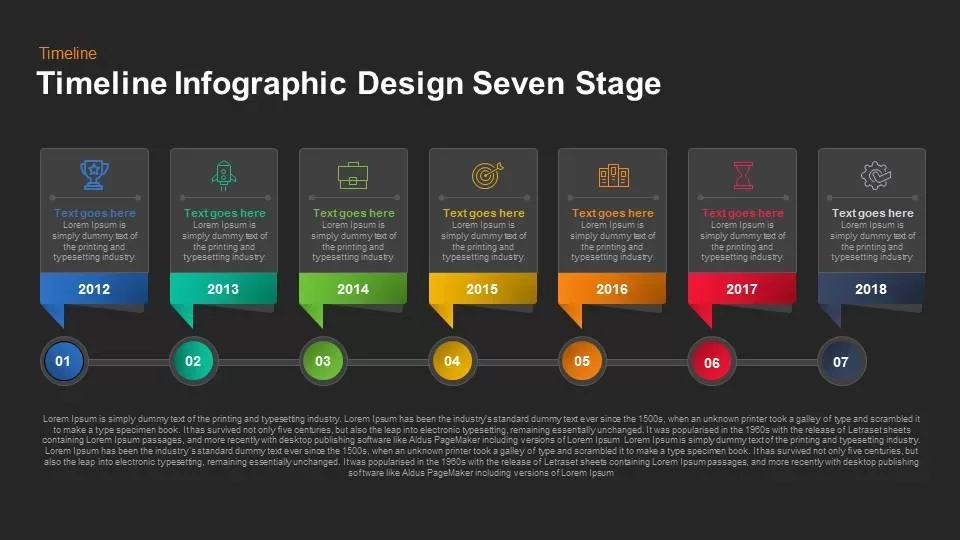
Timeline Infographic Design Seven Stage template for PowerPoint & Google Slides
Timeline
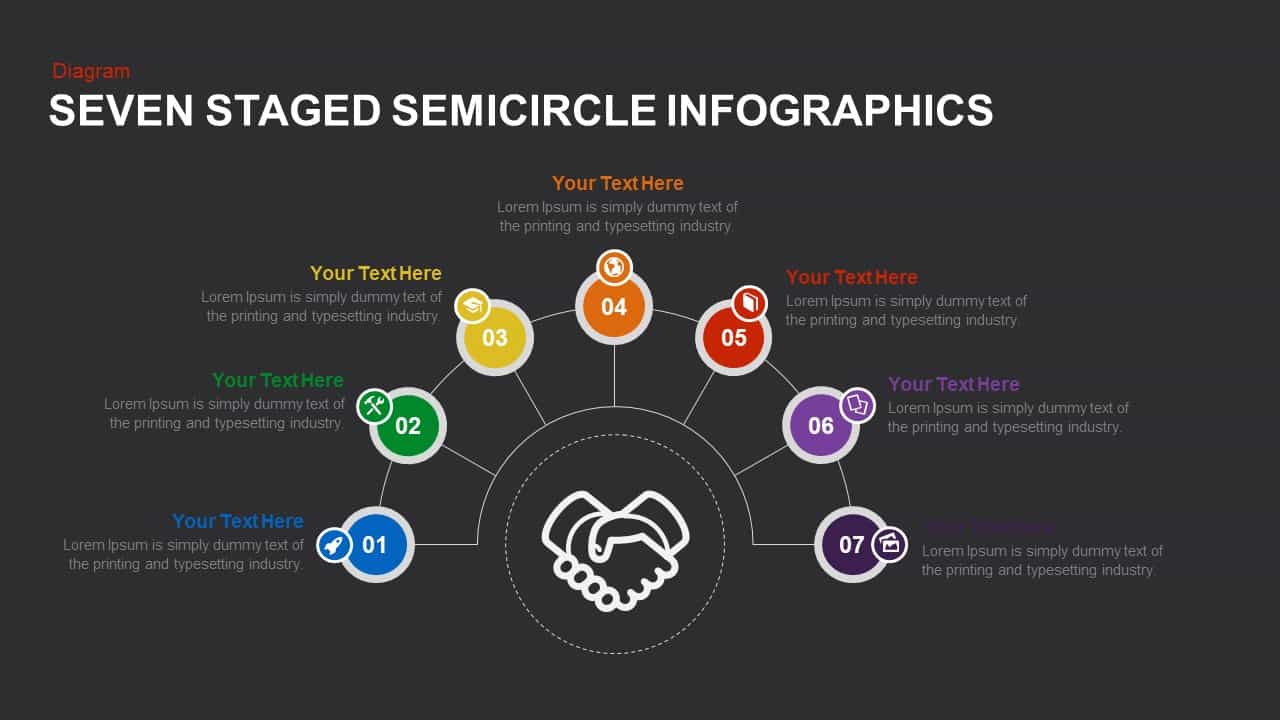
Seven Stage Semicircle Infographic Template for PowerPoint & Google Slides
Process

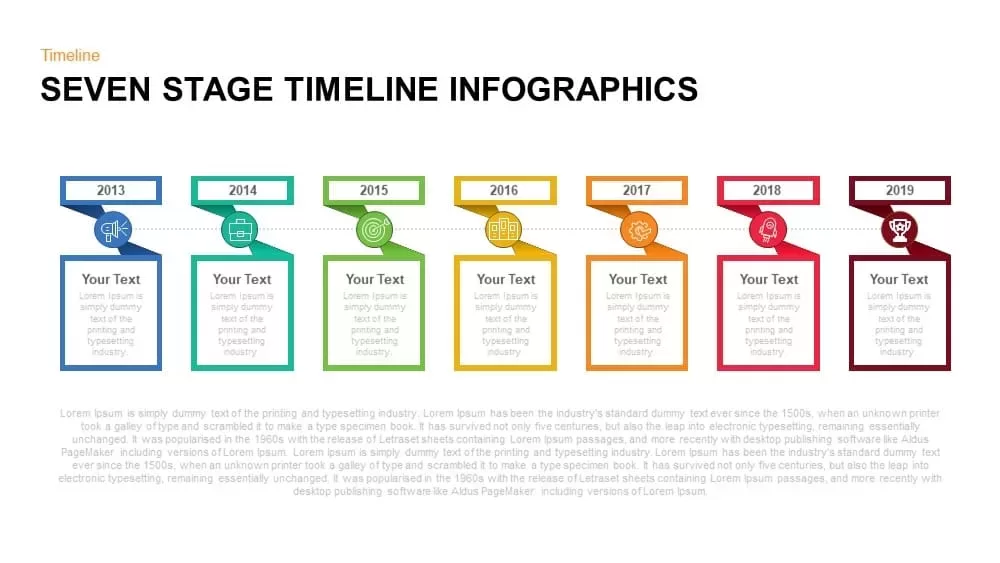
Seven-Stage Timeline Infographics Template for PowerPoint & Google Slides
Timeline
Gradient Seven-Stage Bubble Workflow Template for PowerPoint & Google Slides
Process
3D Seven-Stage Process Flow Diagram Template for PowerPoint & Google Slides
Process
Seven-Stage Hexagon Timeline Infographic Template for PowerPoint & Google Slides
Timeline
Machine Learning Diagram Template for PowerPoint & Google Slides
Process
Machine Learning Innovation Overview template for PowerPoint & Google Slides
AI
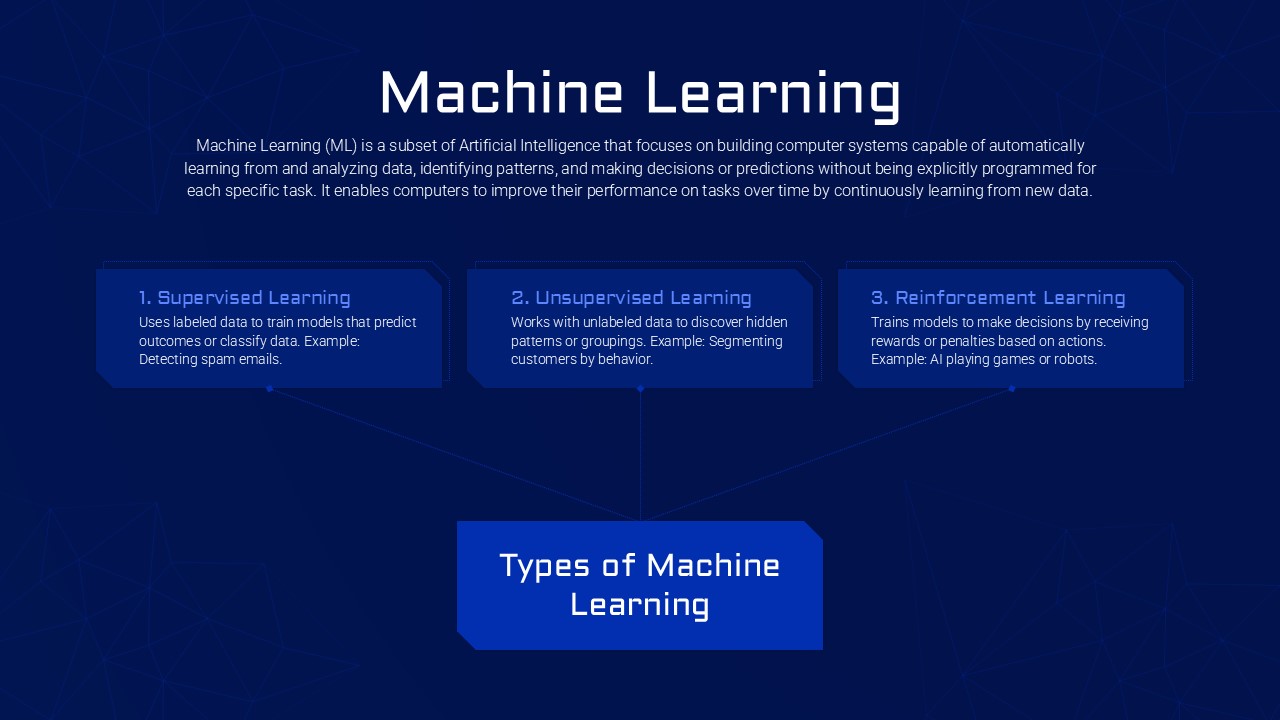
Machine Learning Types template for PowerPoint & Google Slides
Technology
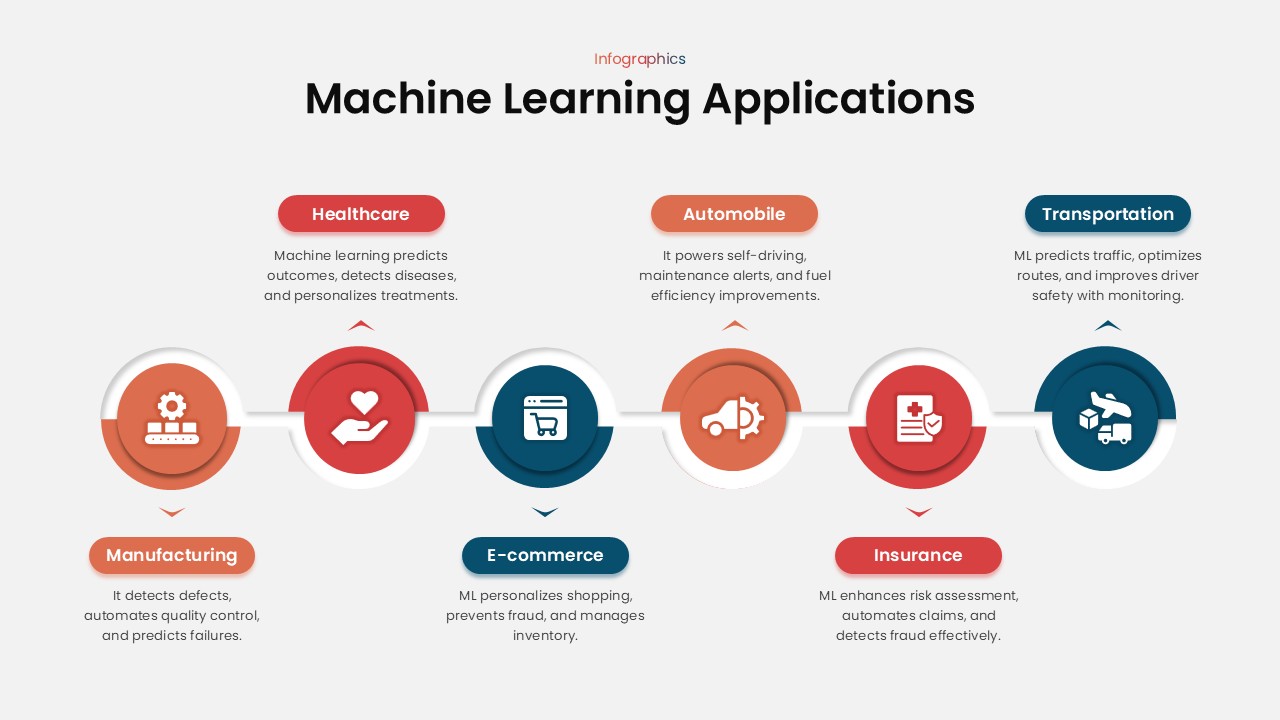
Machine Learning Applications template for PowerPoint & Google Slides
Technology
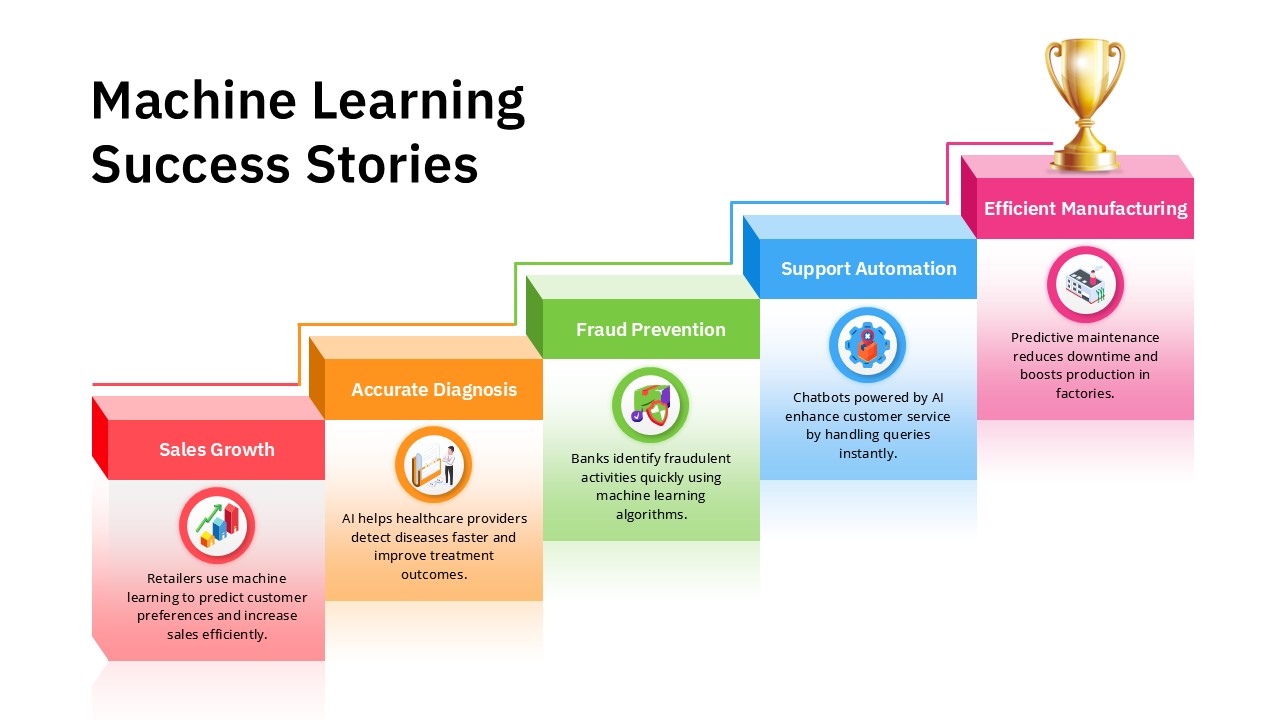
Machine Learning Success Stories Infographic Template for PowerPoint & Google Slides
Process
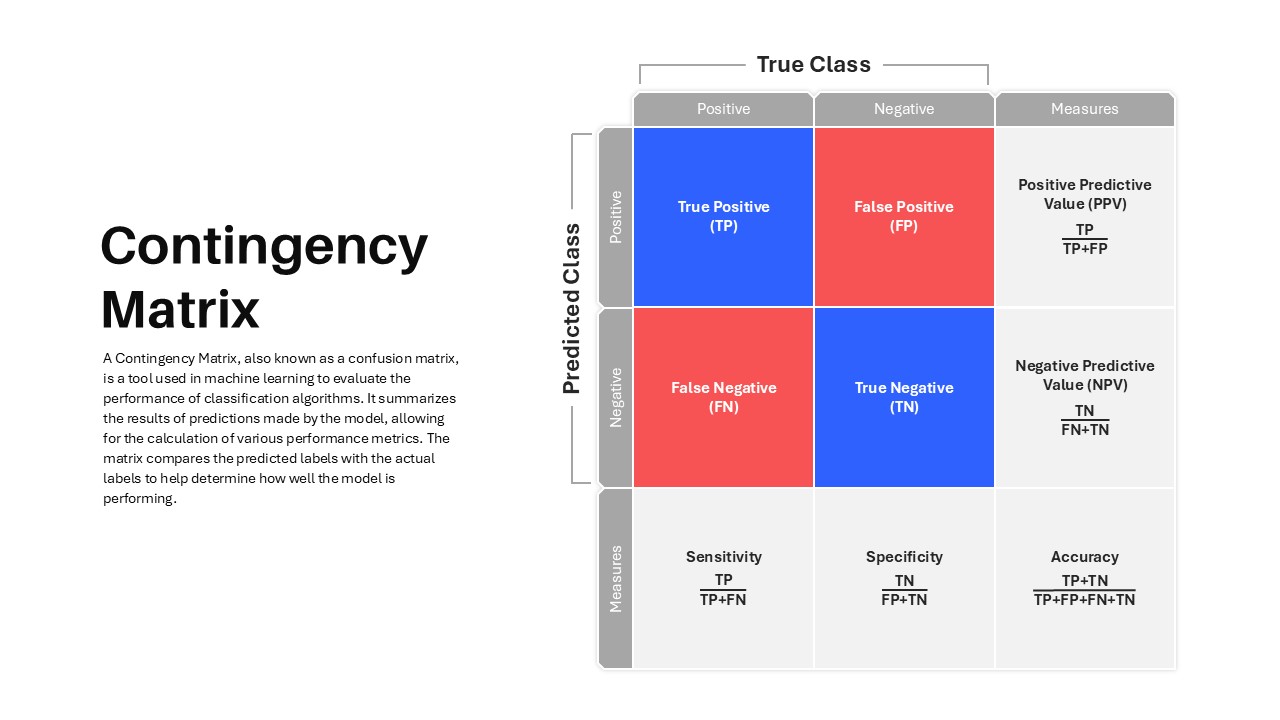
Contingency Matrix in Machine Learning template for PowerPoint & Google Slides
Technology
Machine Learning Overview Slide Template for PowerPoint & Google Slides
Machine Learning
Machine Learning Four-Step Process Template for PowerPoint & Google Slides
Machine Learning
Machine Learning Three-Step Process Template for PowerPoint & Google Slides
Machine Learning
Free Machine Learning Concept Slide Template for PowerPoint & Google Slides
Machine Learning
Free
Futuristic Machine Learning Workflow Template for PowerPoint & Google Slides
Machine Learning
Futuristic Machine Learning Types Overview Template for PowerPoint & Google Slides
AI
Machine Learning Presentation Use Cases Template for PowerPoint & Google Slides
Machine Learning
Machine Learning 4-Step Workflow Template for PowerPoint & Google Slides
Machine Learning
Machine Learning Model Management Template for PowerPoint & Google Slides
Machine Learning
Machine Learning Process Template for PowerPoint & Google Slides
Machine Learning
Machine Learning Model Training Template for PowerPoint & Google Slides
Machine Learning
Biases and Fairness in Machine Learning for PowerPoint & Google Slides
Information Technology
Machine Learning Strategy Flowchart
Machine Learning
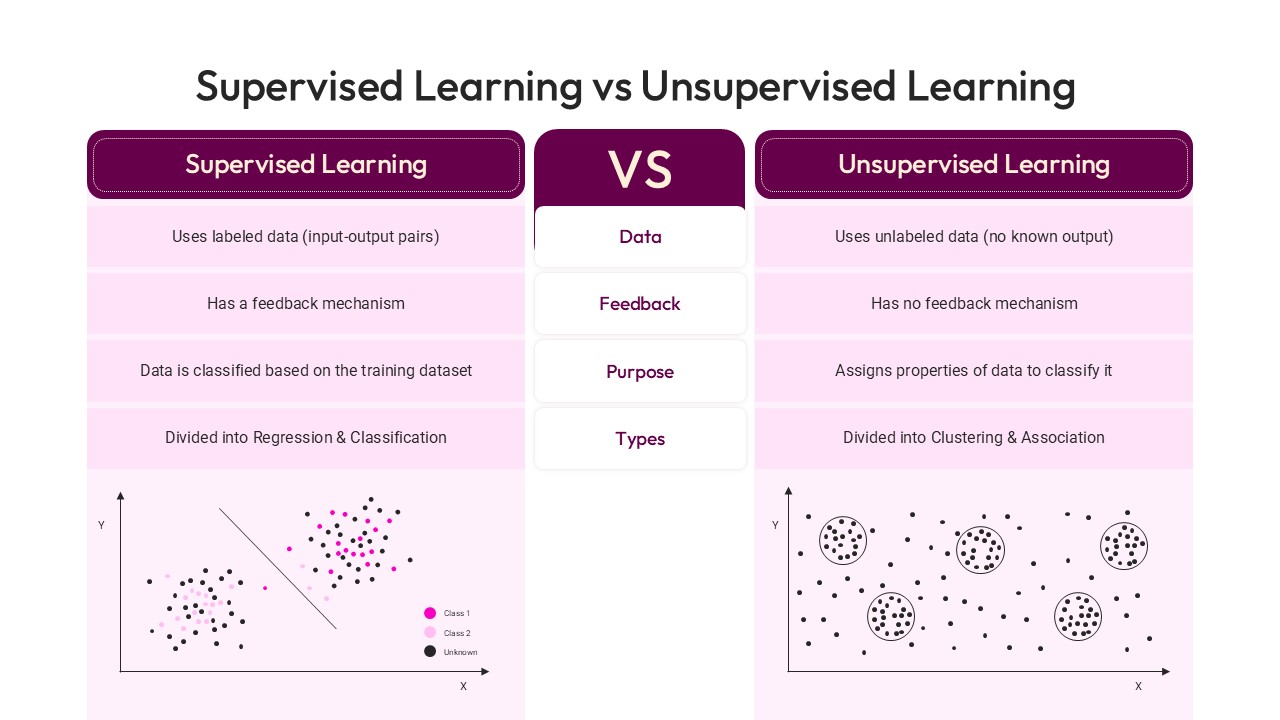
Supervised Learning vs Unsupervised Learning template for PowerPoint & Google Slides
Technology
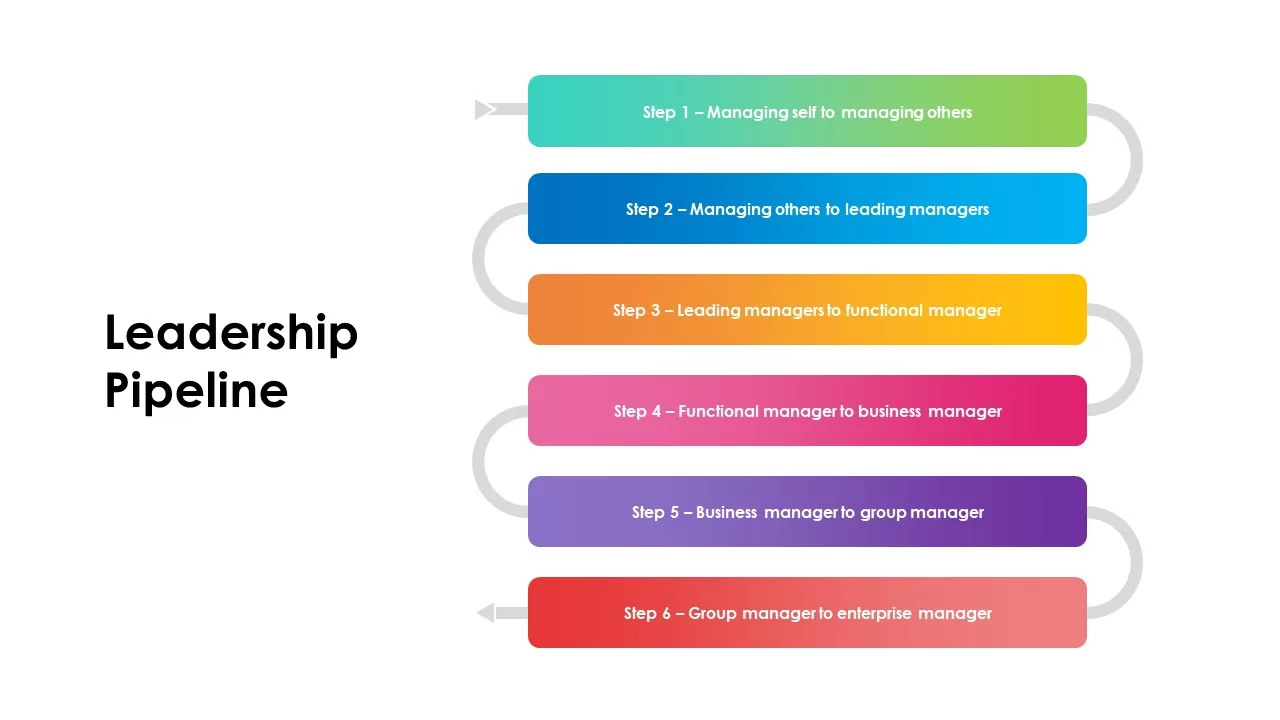
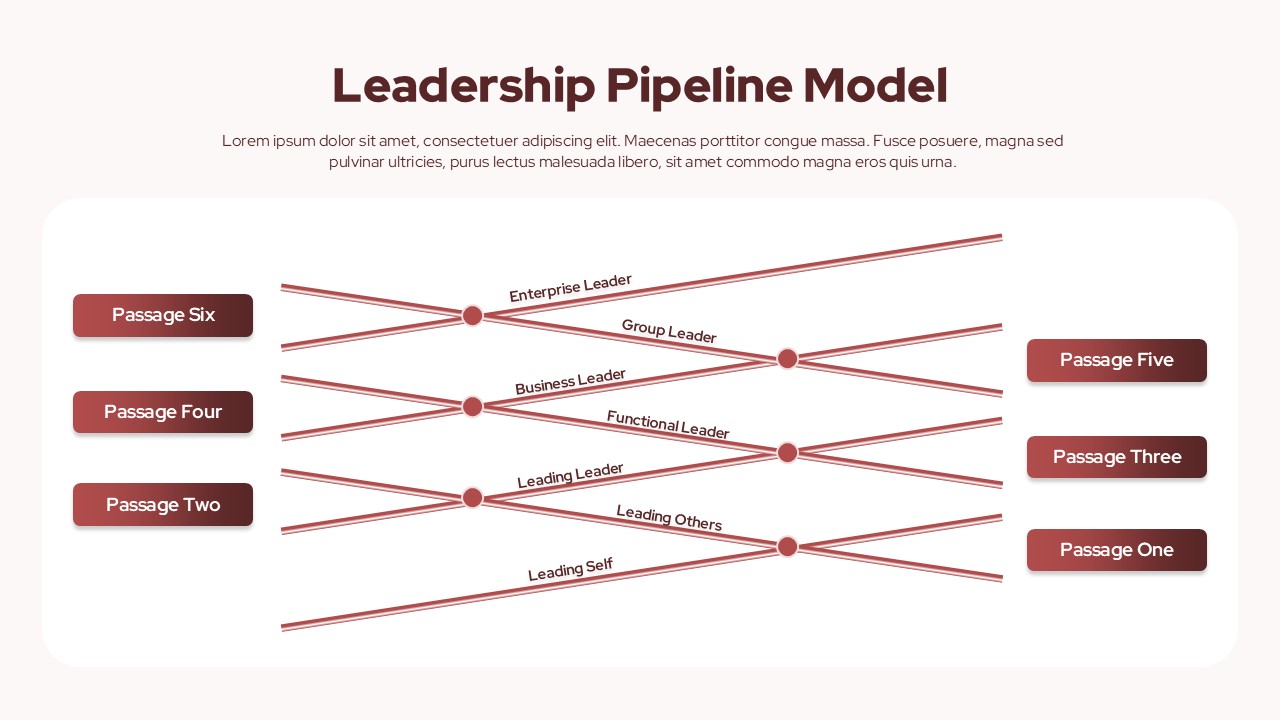
Leadership Pipeline Model Template for PowerPoint & Google Slides
Business Strategy
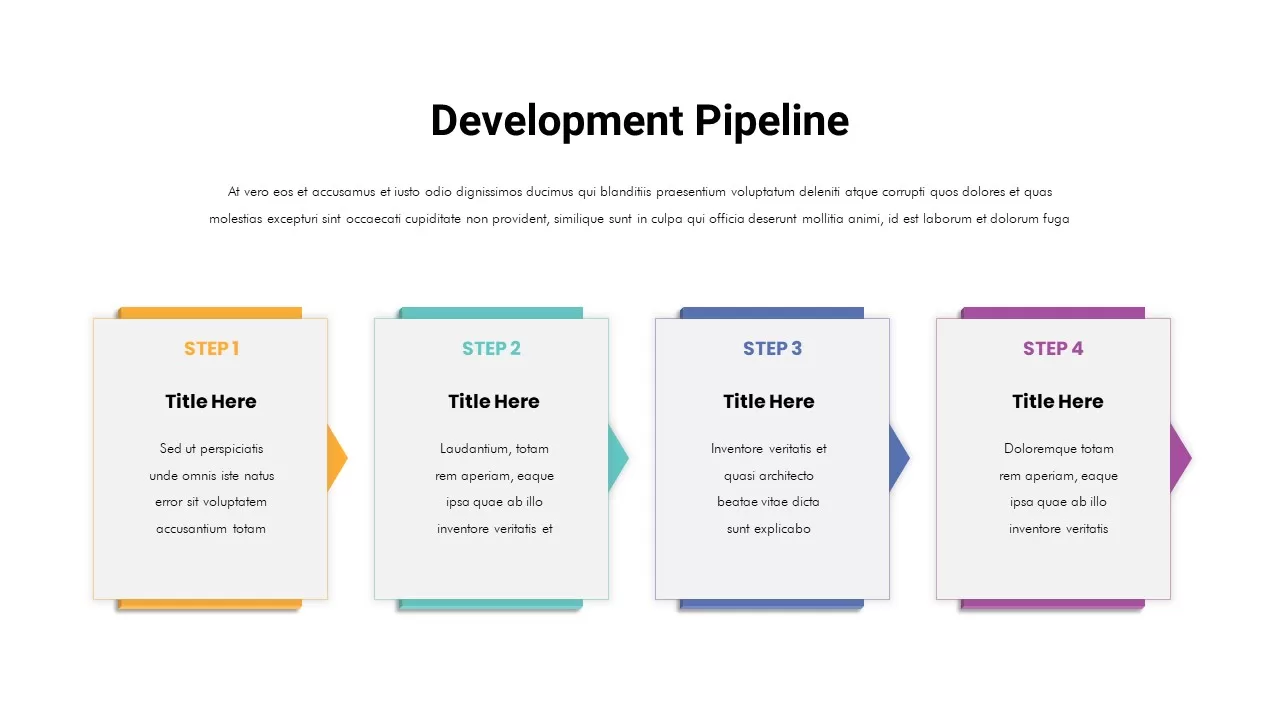
Development Pipeline Process template for PowerPoint & Google Slides
Process
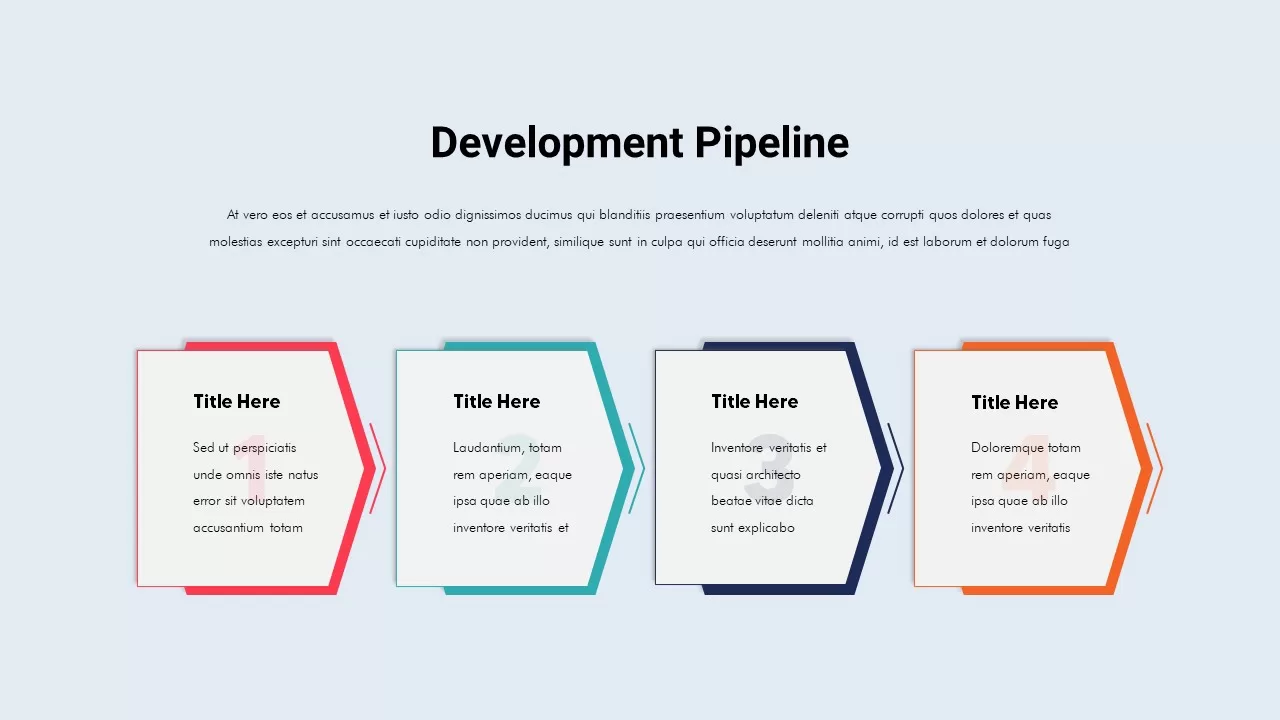
Development Pipeline Process Infographic Template for PowerPoint & Google Slides
Process
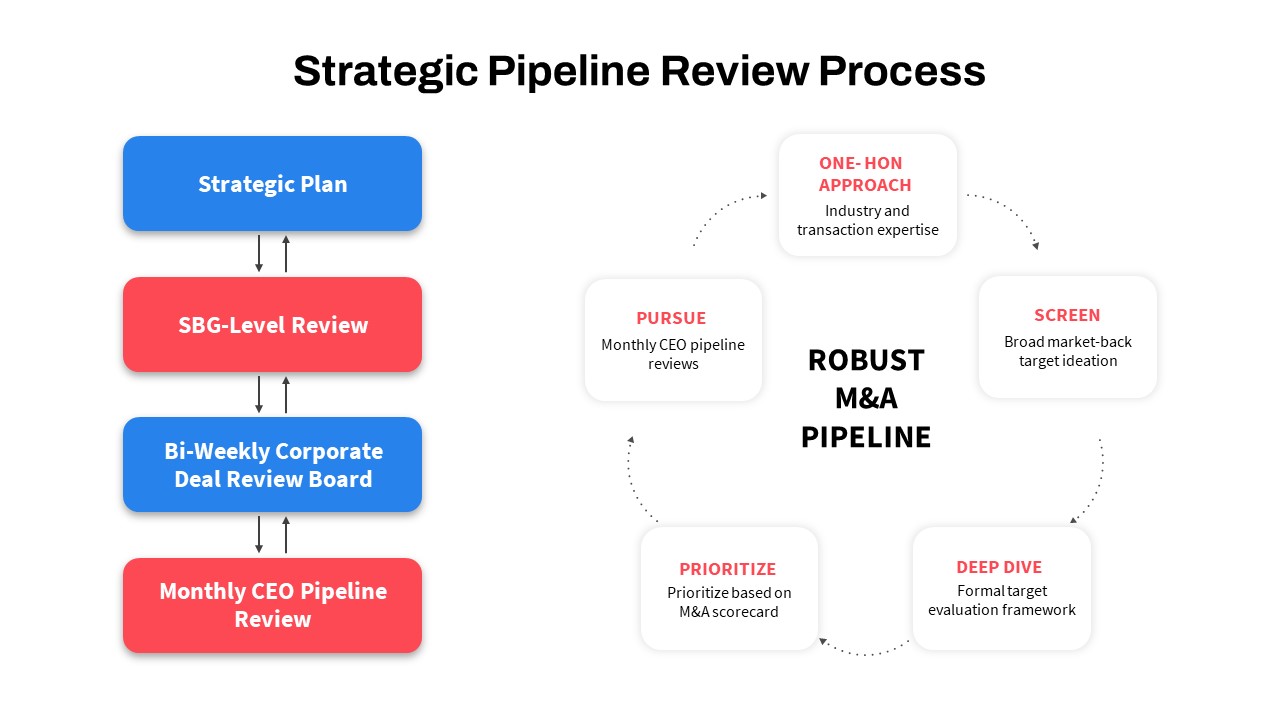
Strategic Pipeline Review Diagram Template for PowerPoint & Google Slides
Business Strategy
ETL Data Pipeline Workflow Diagram Template for PowerPoint & Google Slides
Process
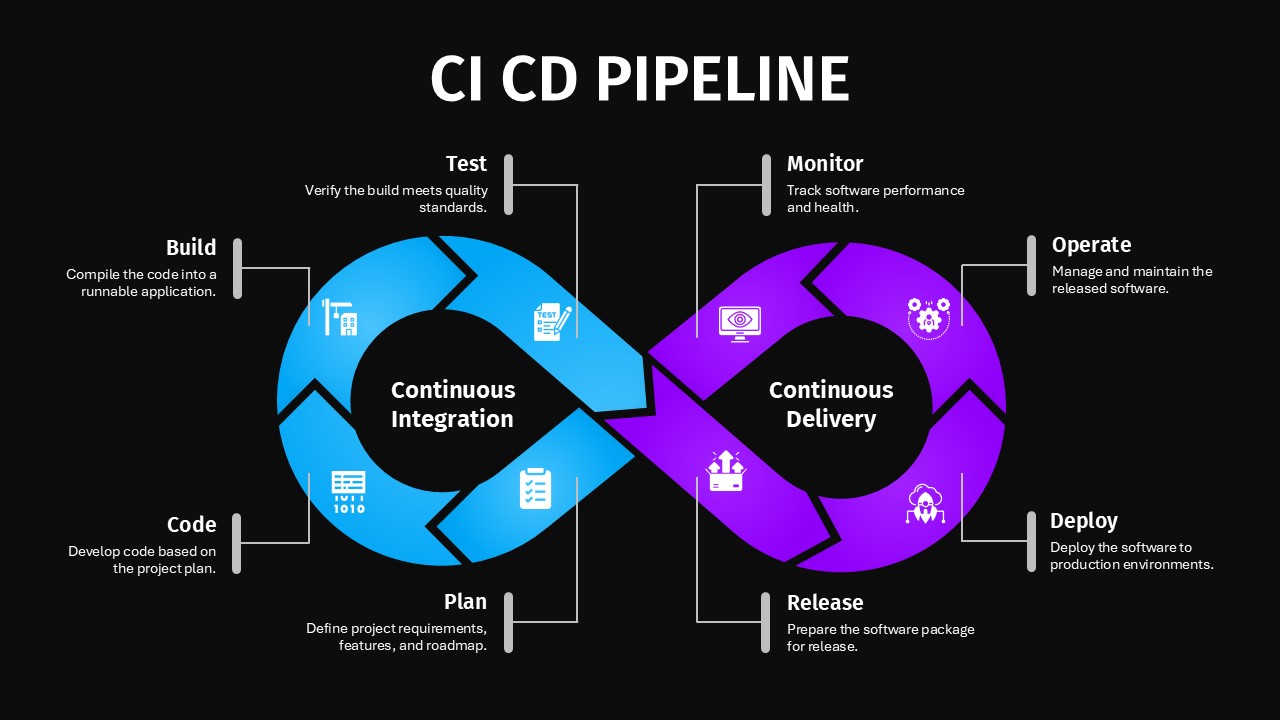
CI/CD Pipeline Infographic Template for PowerPoint & Google Slides
Flow Charts
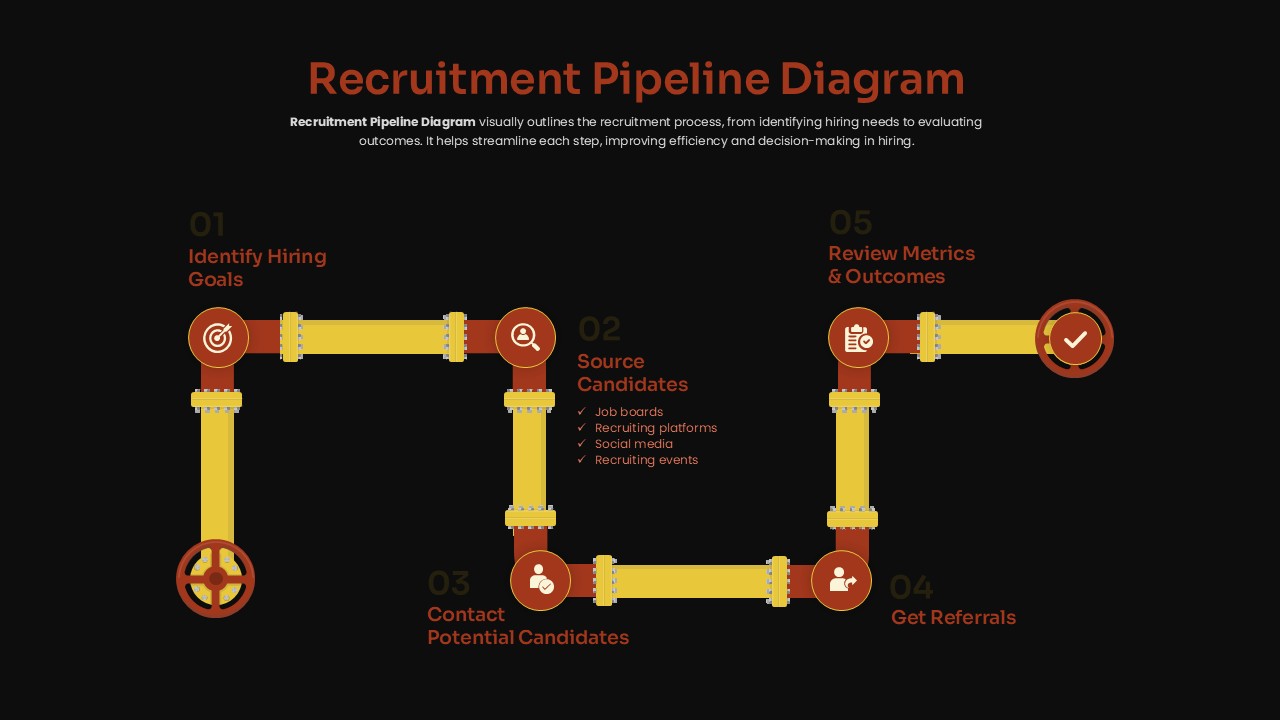
Recruitment Pipeline Flowchart Diagram Template for PowerPoint & Google Slides
Process
Leadership Pipeline Model Overview template for PowerPoint & Google Slides
Leadership
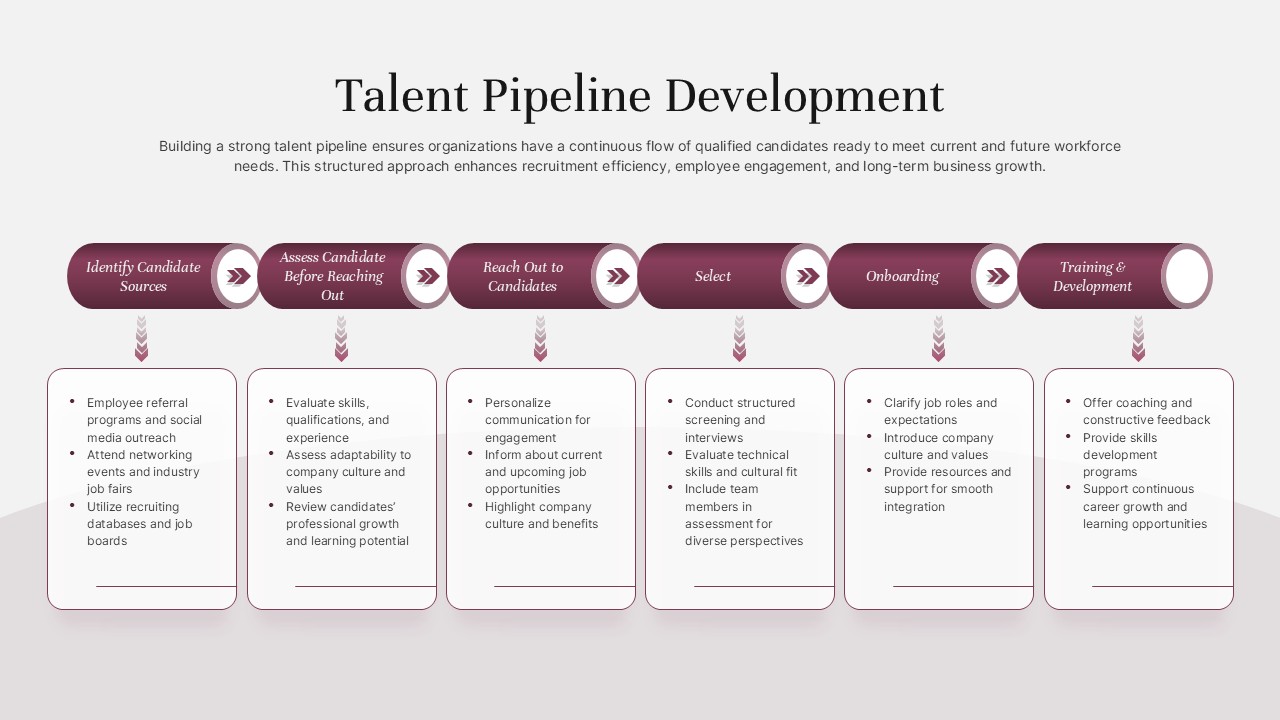
Talent Pipeline Development template for PowerPoint & Google Slides
Business
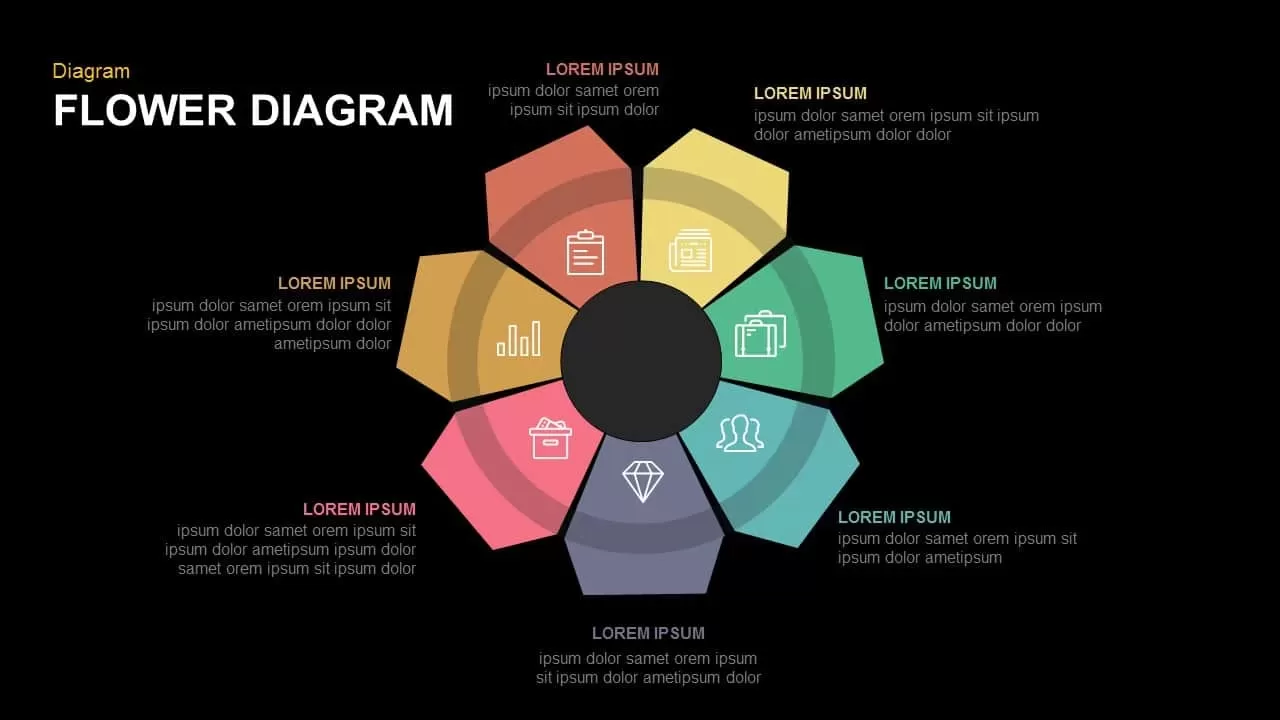
Seven-Step Flower Diagram Template for PowerPoint & Google Slides
Circular
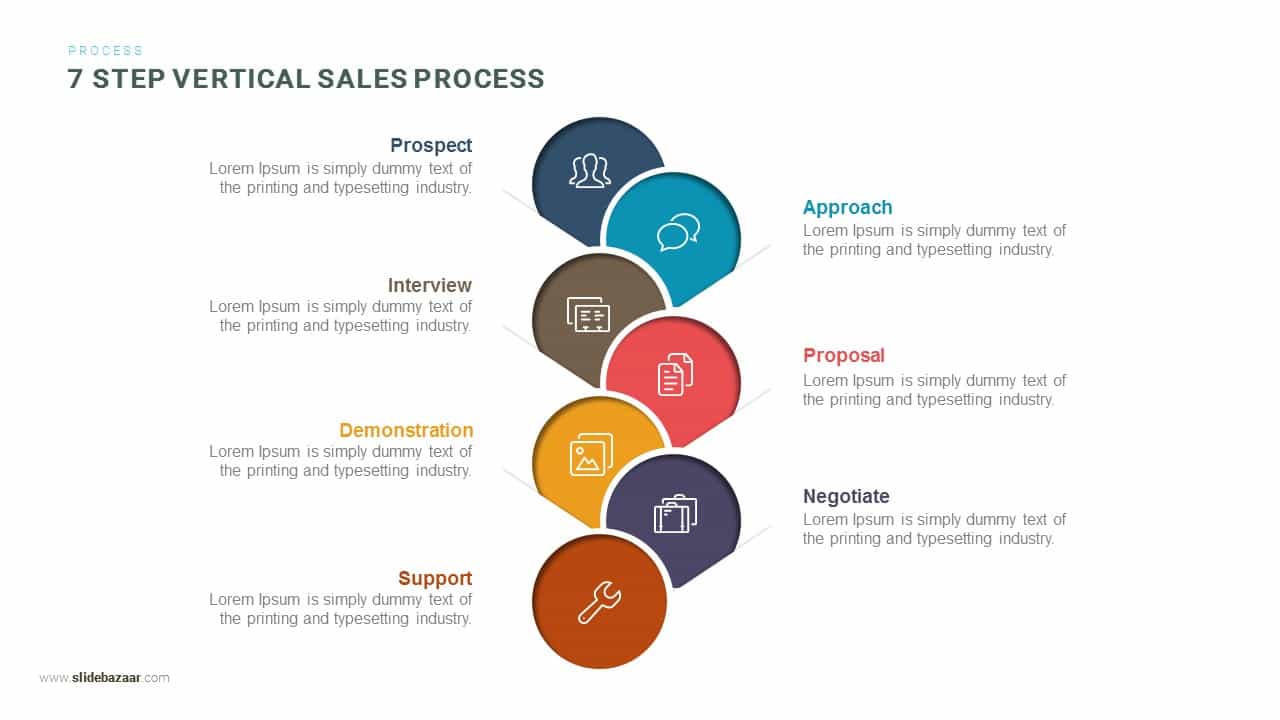
Seven-Step Vertical Sales Process Template for PowerPoint & Google Slides
Process
Seven-Segment Circular Arrow Diagram Template for PowerPoint & Google Slides
Arrow
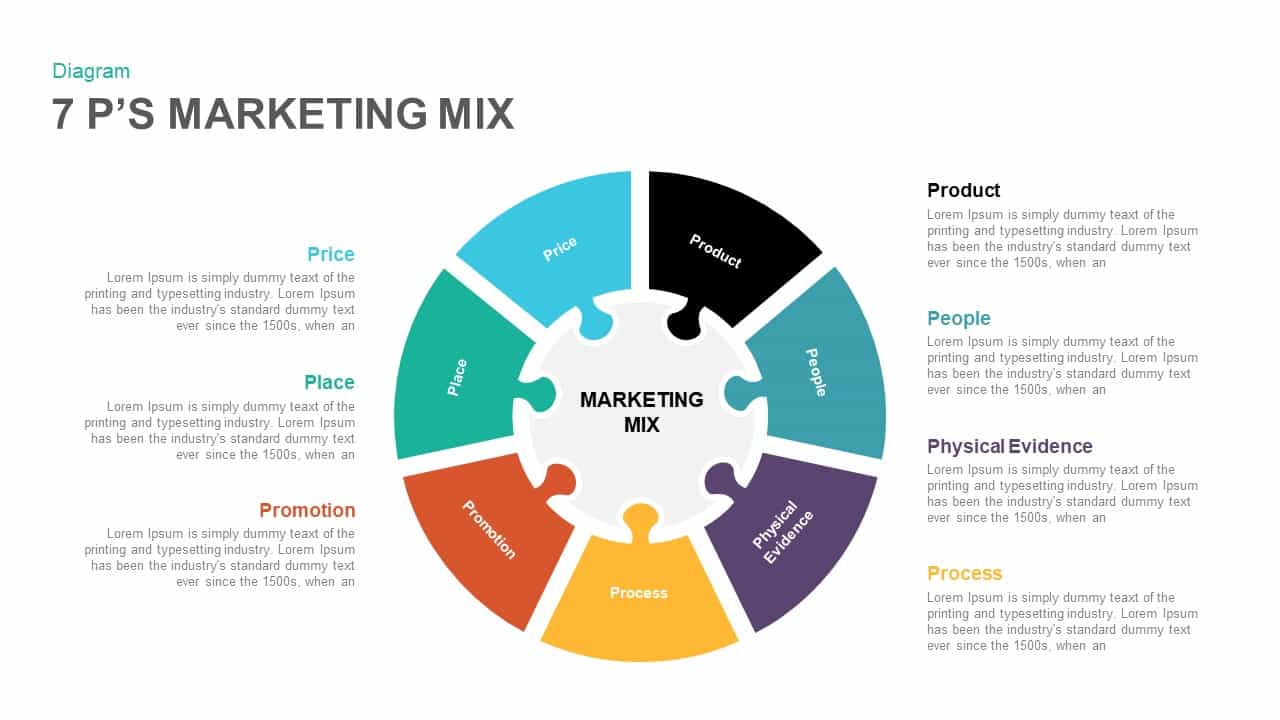
Seven-Part Marketing Mix Diagram Template for PowerPoint & Google Slides
Marketing
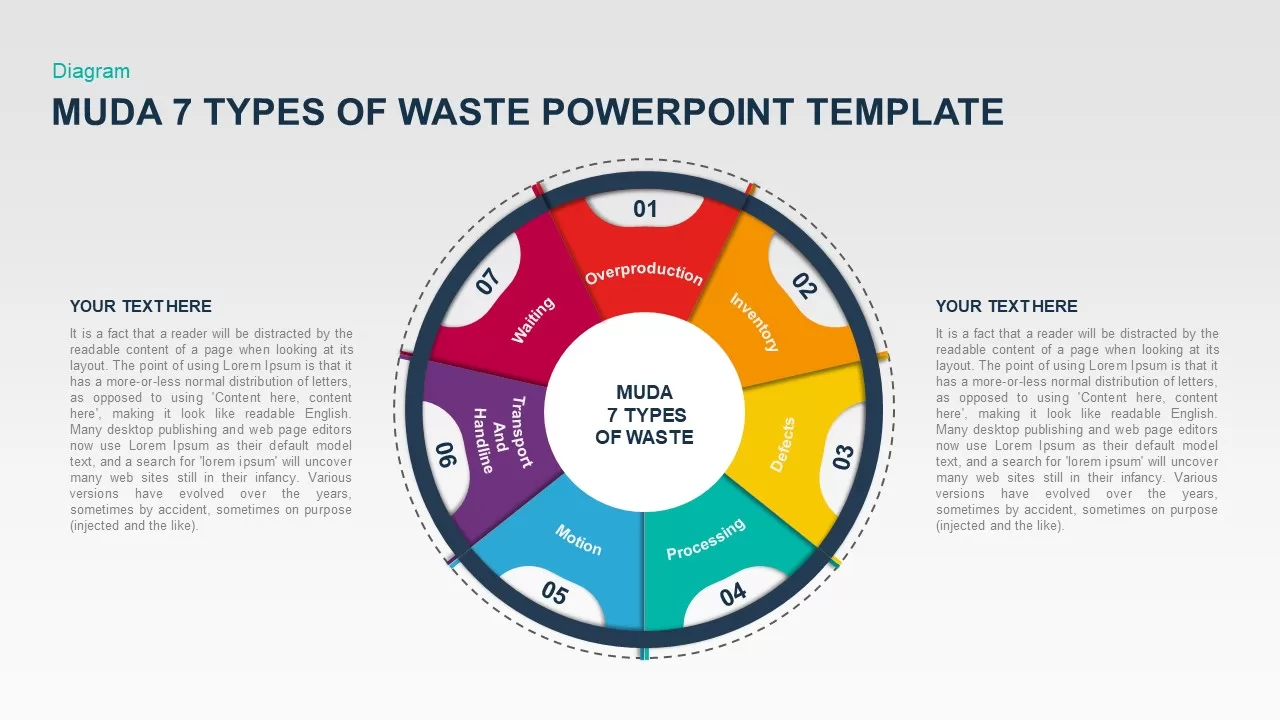
MUDA Seven Types of Waste Diagram Template for PowerPoint & Google Slides
Circular
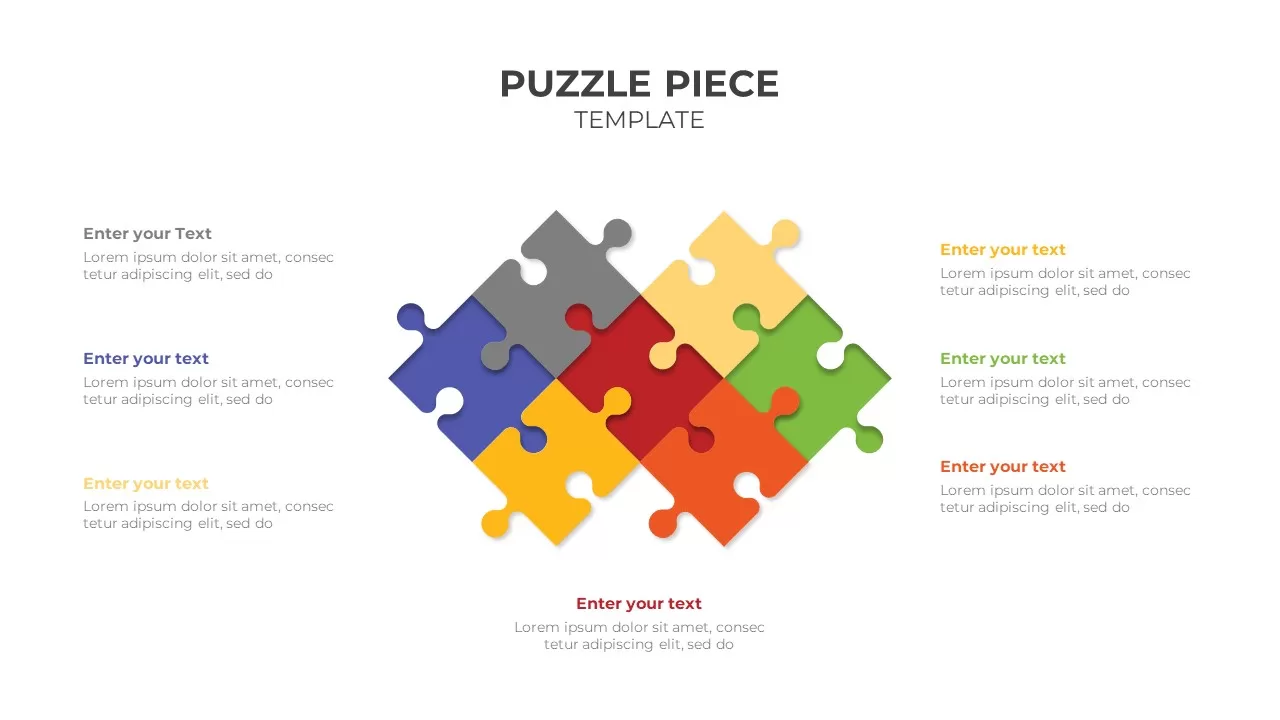
Colorful Seven-Piece Puzzle Diagram Template for PowerPoint & Google Slides
Process
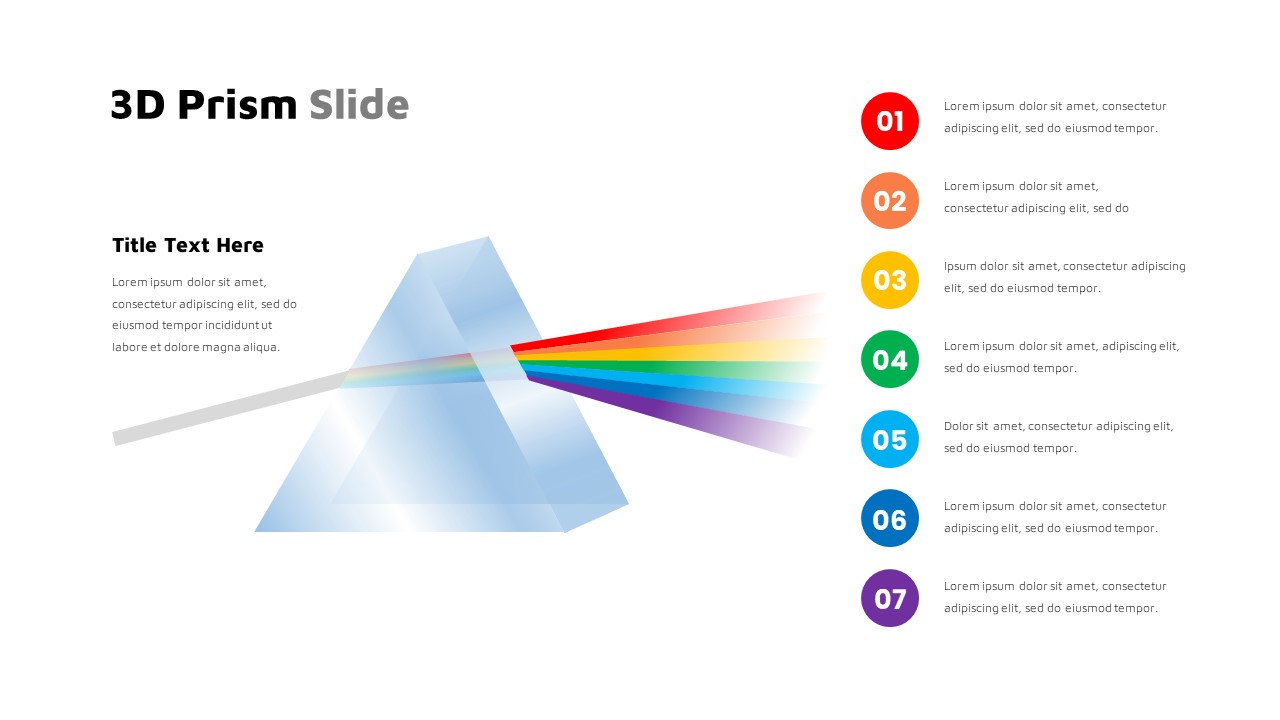
Modern Seven-Step 3D Prism Diagram Template for PowerPoint & Google Slides
Process
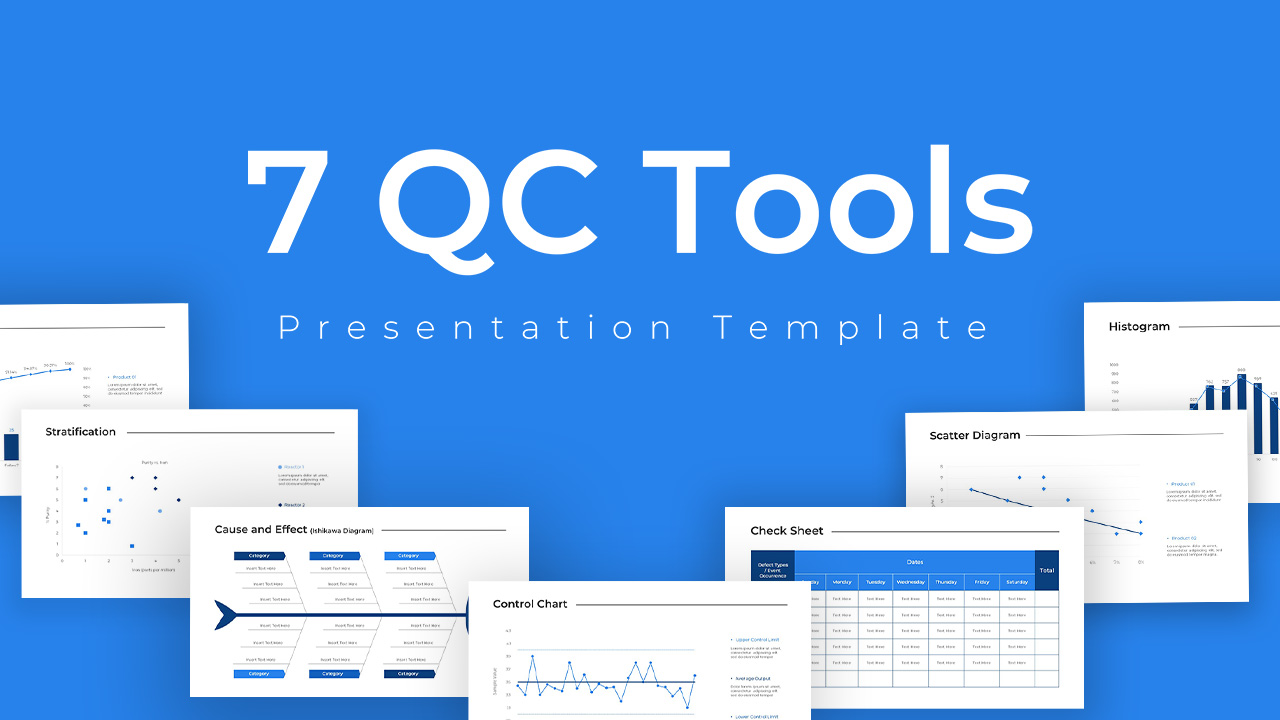
Seven Quality Control Tools Diagram Template for PowerPoint & Google Slides
Decks
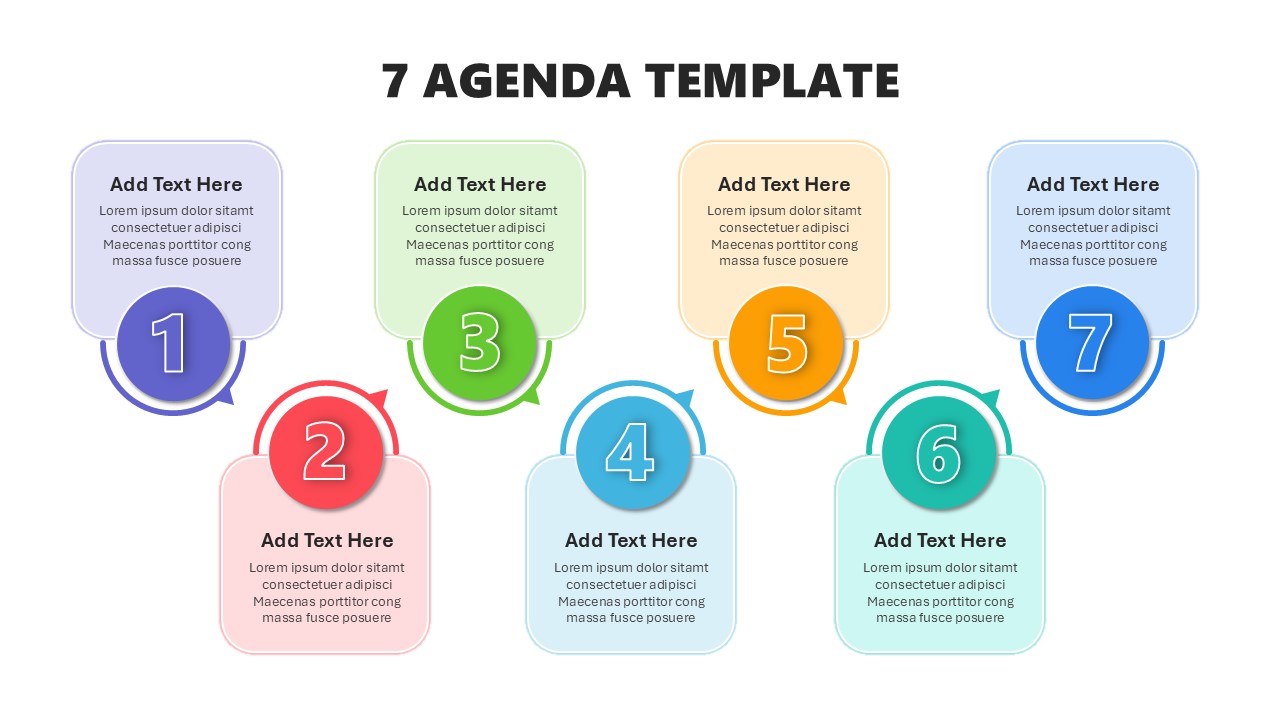
Colorful Seven-Item Agenda Slide Template for PowerPoint & Google Slides
Agenda
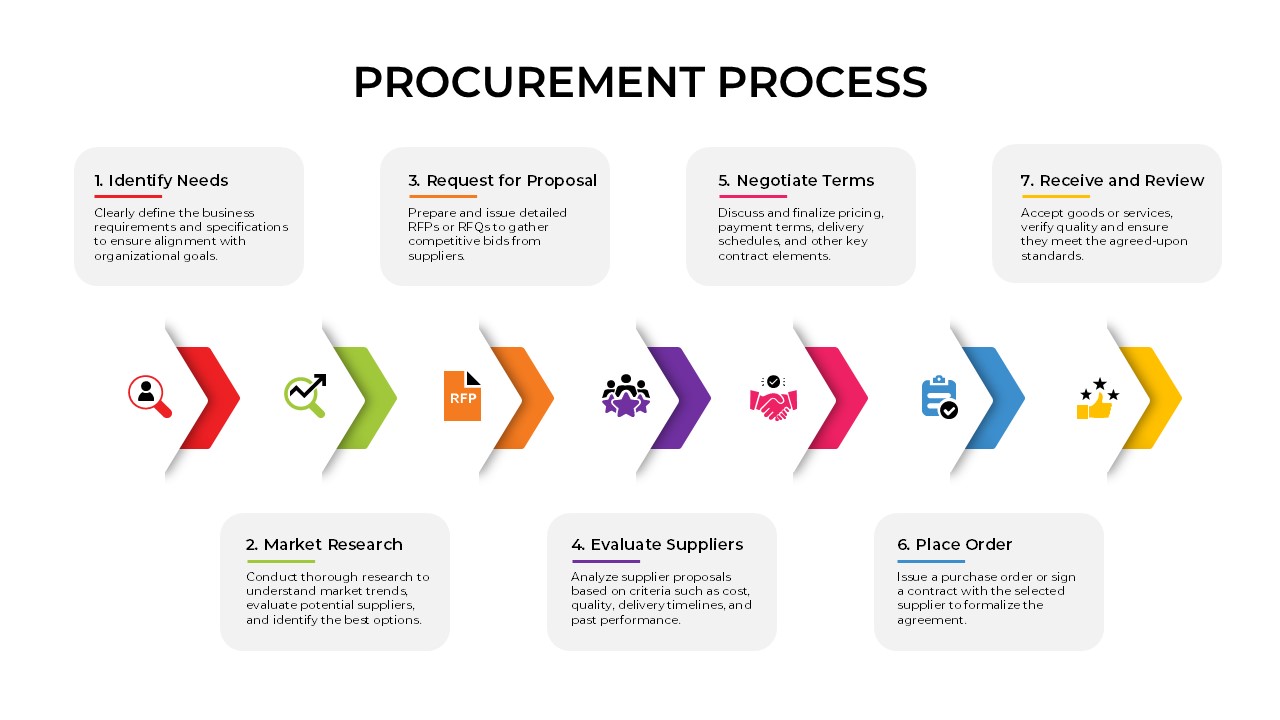
Seven-Step Procurement Process Diagram Template for PowerPoint & Google Slides
Process
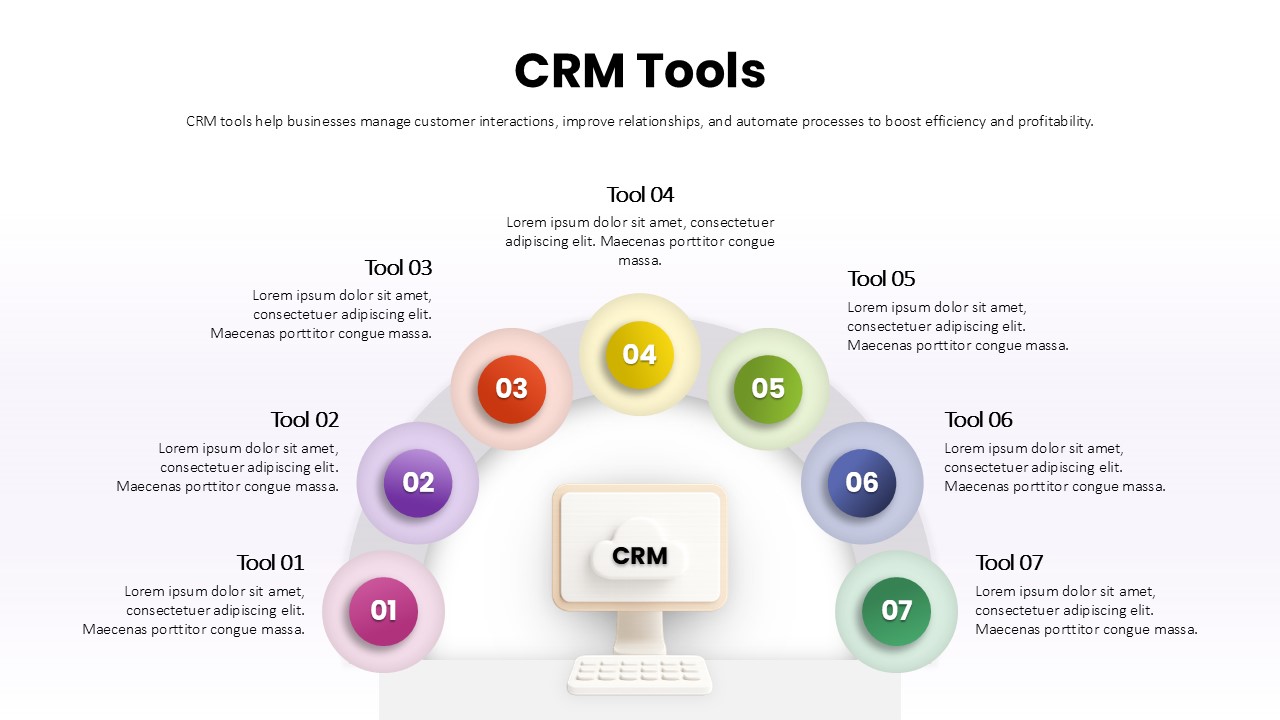
Seven-Part CRM Tools Arc Diagram Template for PowerPoint & Google Slides
Digital Marketing
Online Learning PowerPoint Template for PowerPoint & Google Slides
Customer Journey
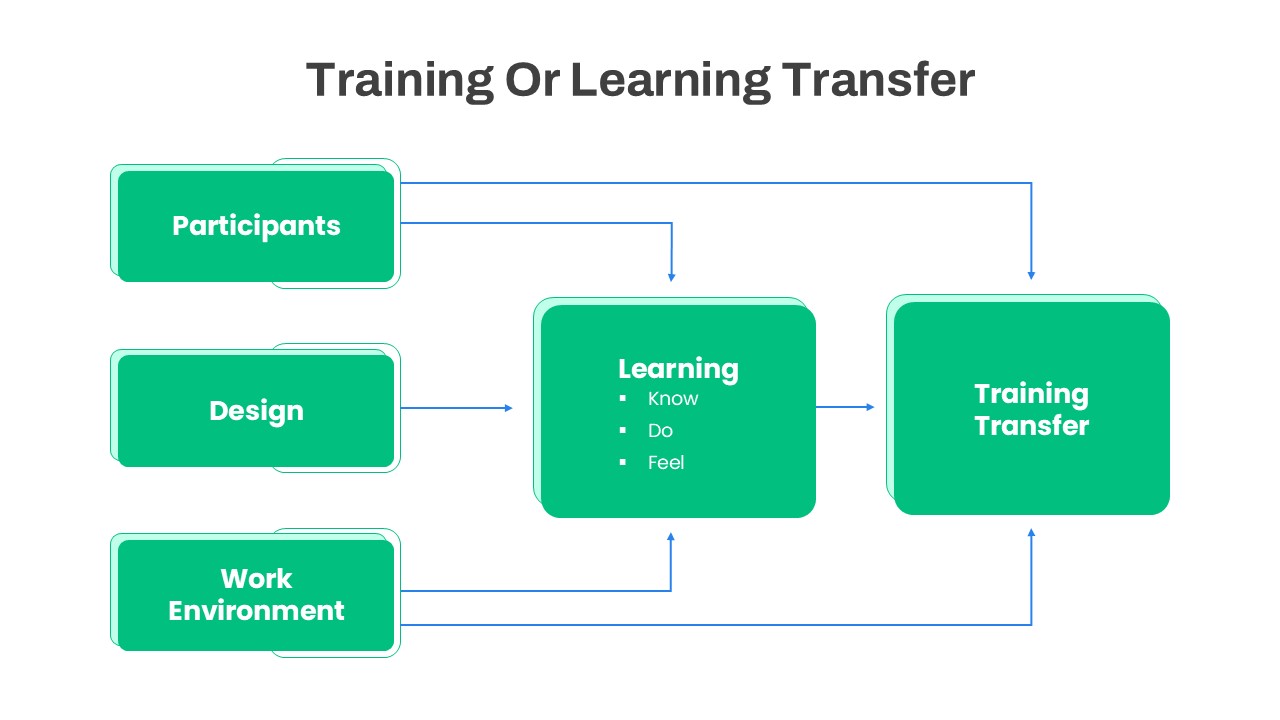
Training or Learning Transfer PowerPoint Template for PowerPoint & Google Slides
Business Proposal
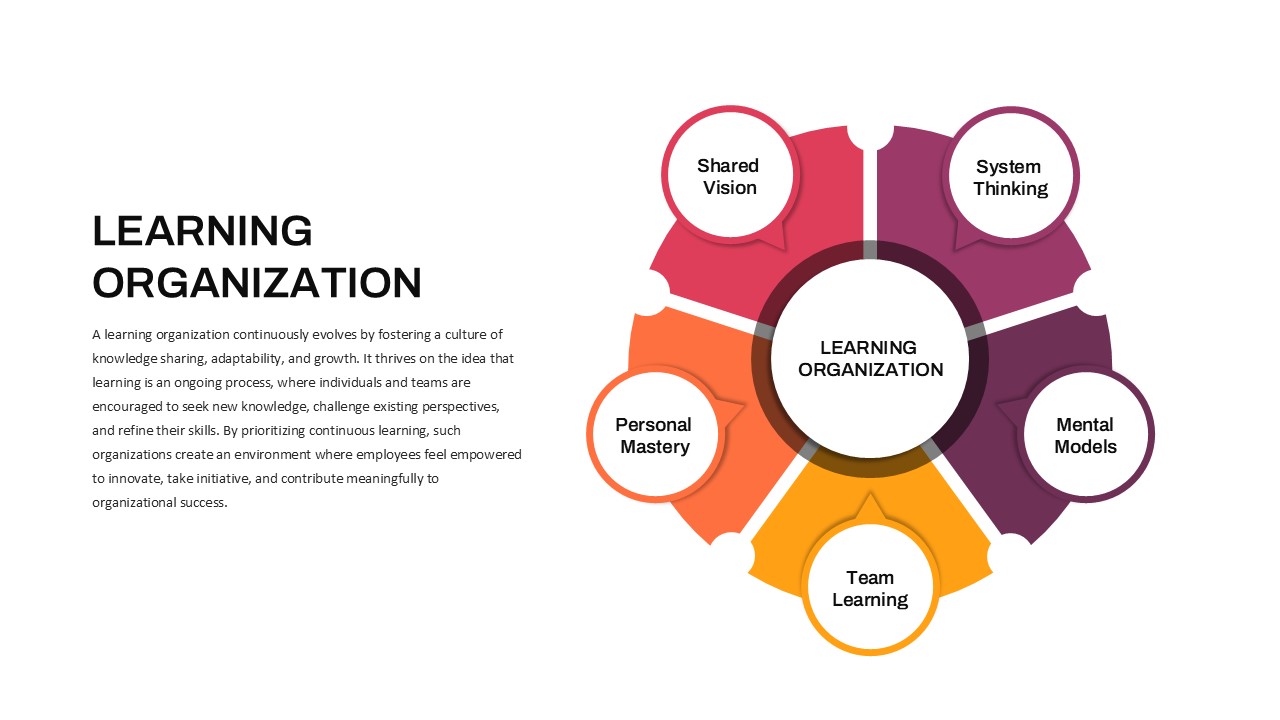
Learning Organization PowerPoint Template for PowerPoint & Google Slides
Business Strategy
E-Learning Report Analysis Template for PowerPoint & Google Slides
Infographics
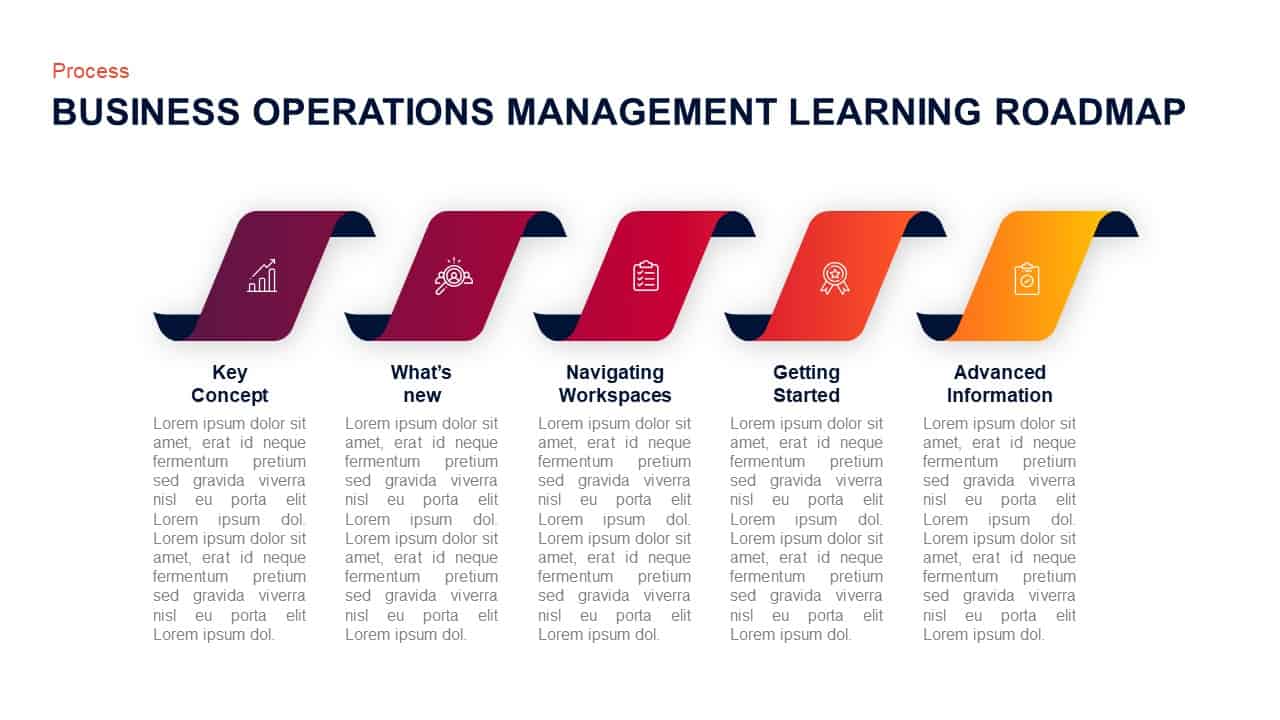
Operations Management Learning Roadmap Template for PowerPoint & Google Slides
Roadmap
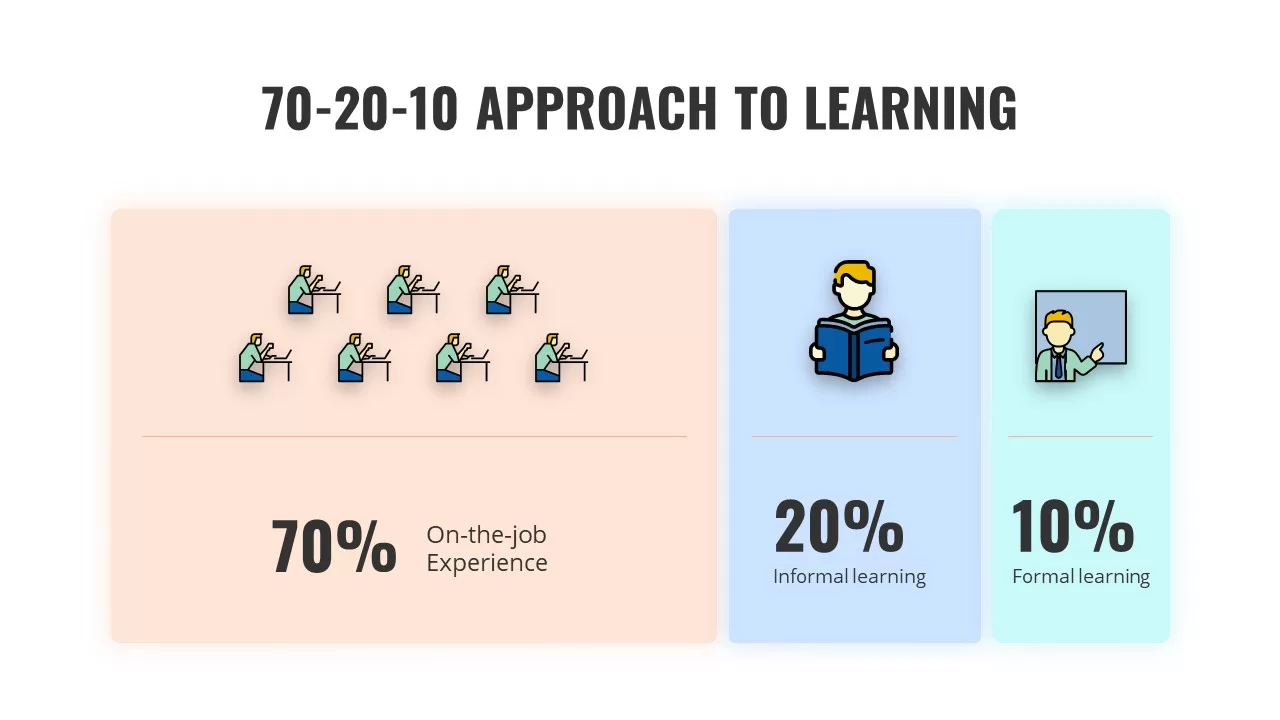
70-20-10 Learning Approach Infographic Template for PowerPoint & Google Slides
Process

4MAT Learning Cycle Circular Diagram Template for PowerPoint & Google Slides
Circular
Free Stylish E-Learning Presentation Template for PowerPoint & Google Slides
Pitch Deck
Free
E-Learning Education Presentation Deck Template for PowerPoint & Google Slides
Decks
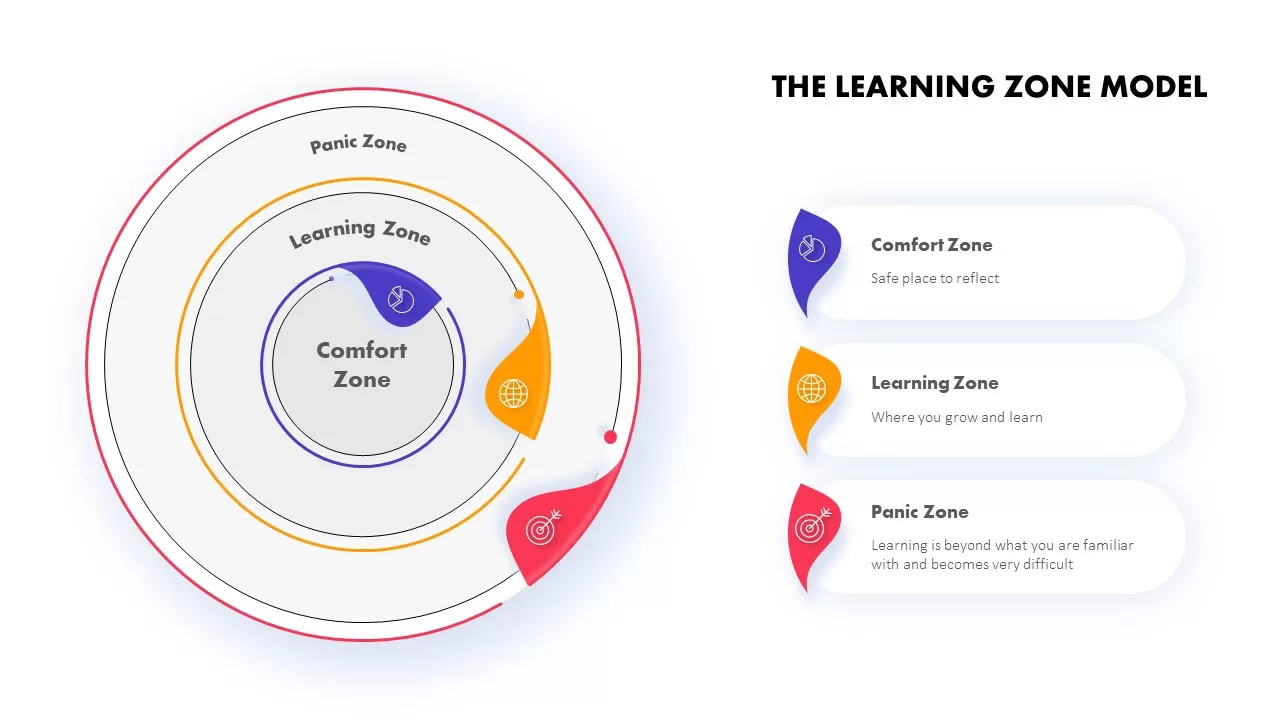
The Learning Zone Model Template for PowerPoint & Google Slides
Process
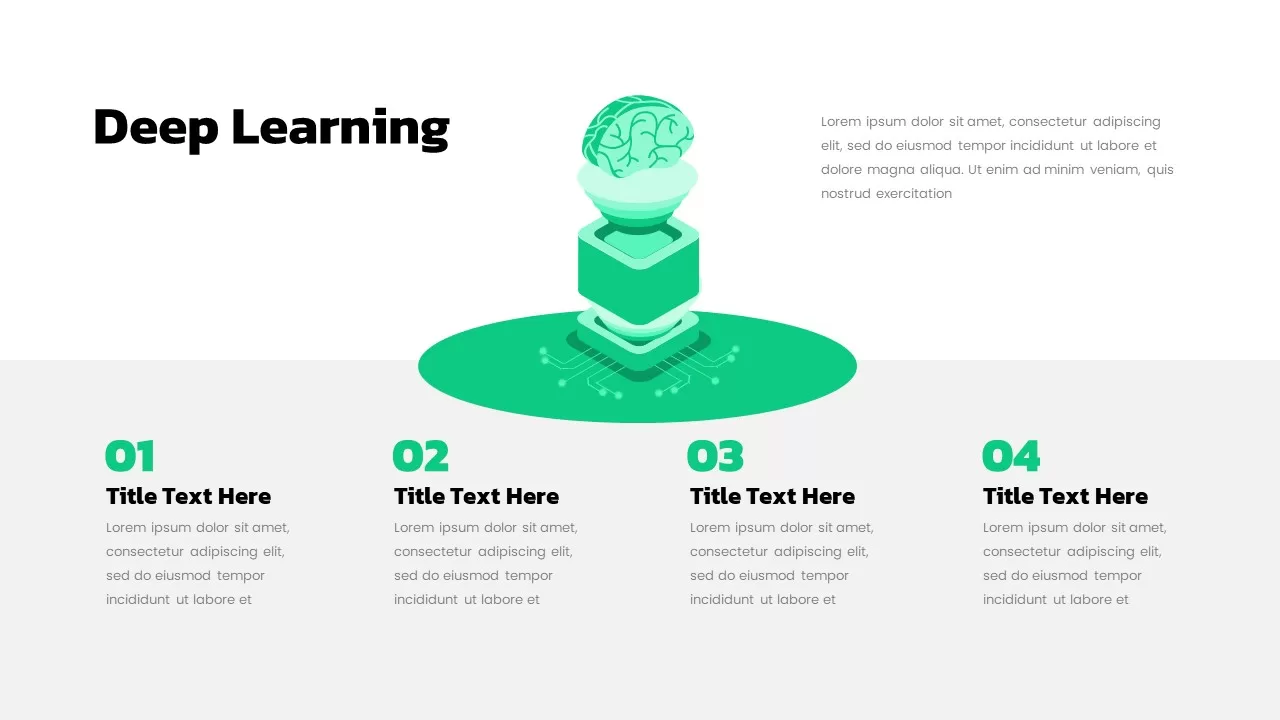
Deep Learning Concept Illustration Template for PowerPoint & Google Slides
Machine Learning
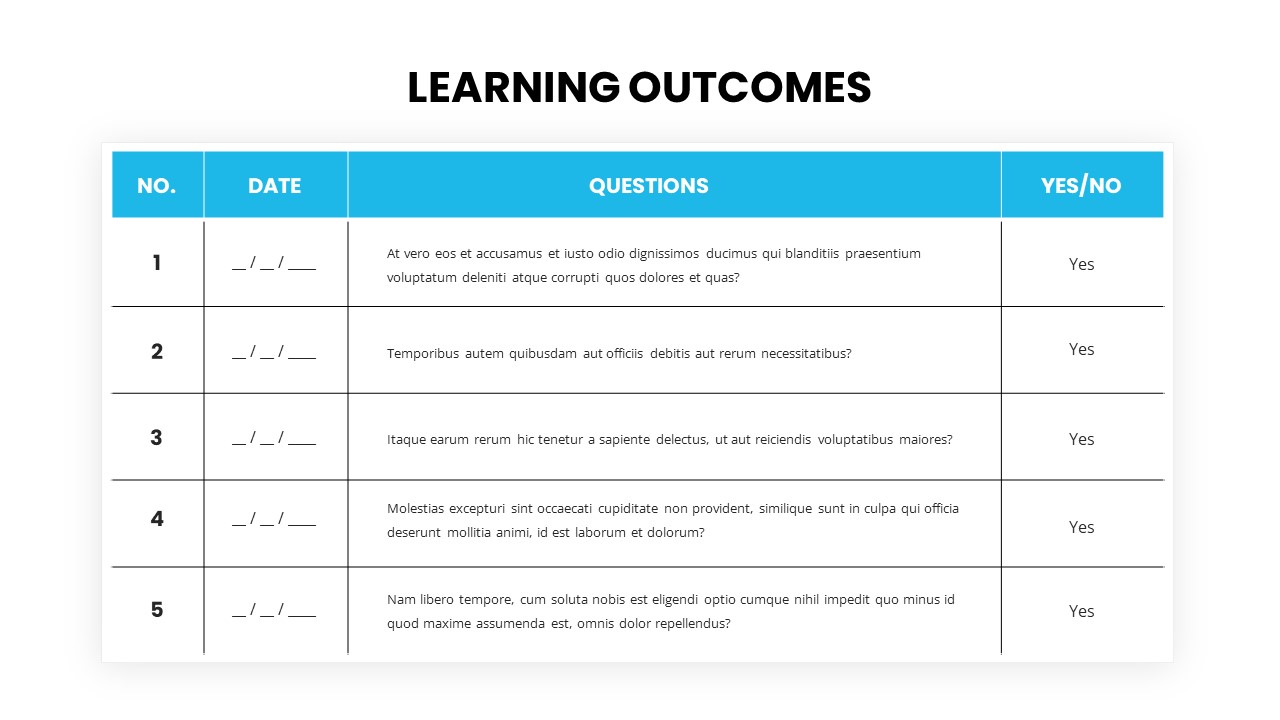
Learning Outcomes table template for PowerPoint & Google Slides
Charts

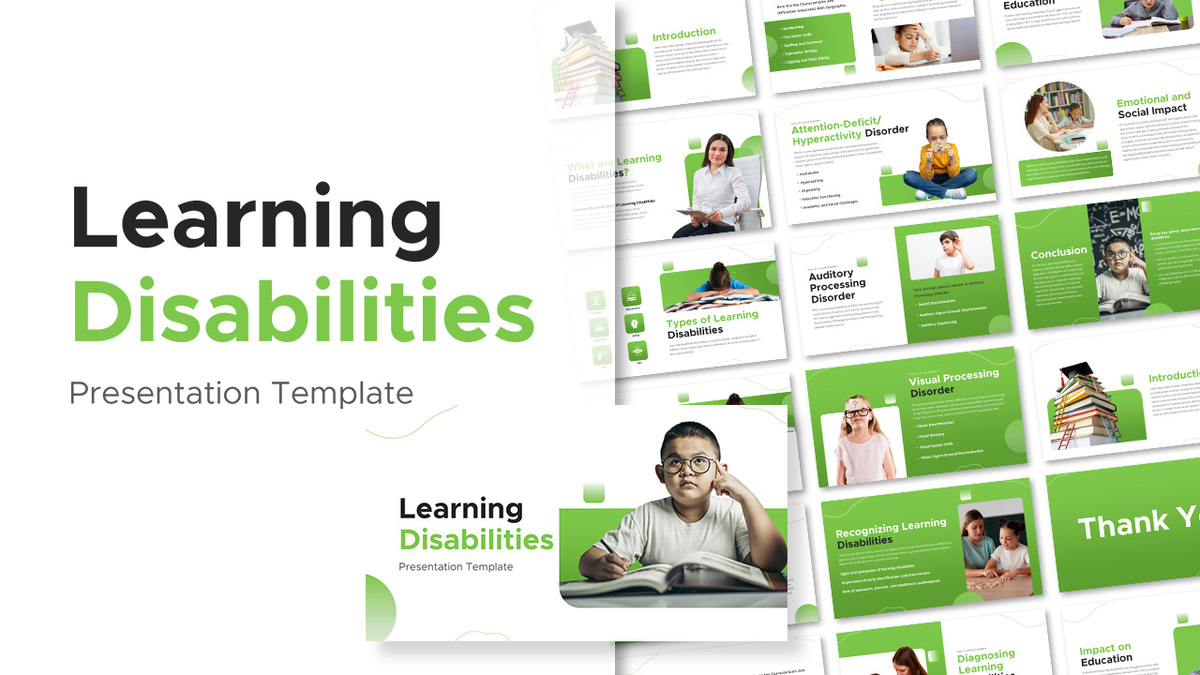
Learning Disabilities Presentation Template for PowerPoint & Google Slides
Company Profile
Free Learning Retention Pyramid Chart Template for PowerPoint & Google Slides
Pyramid
Free
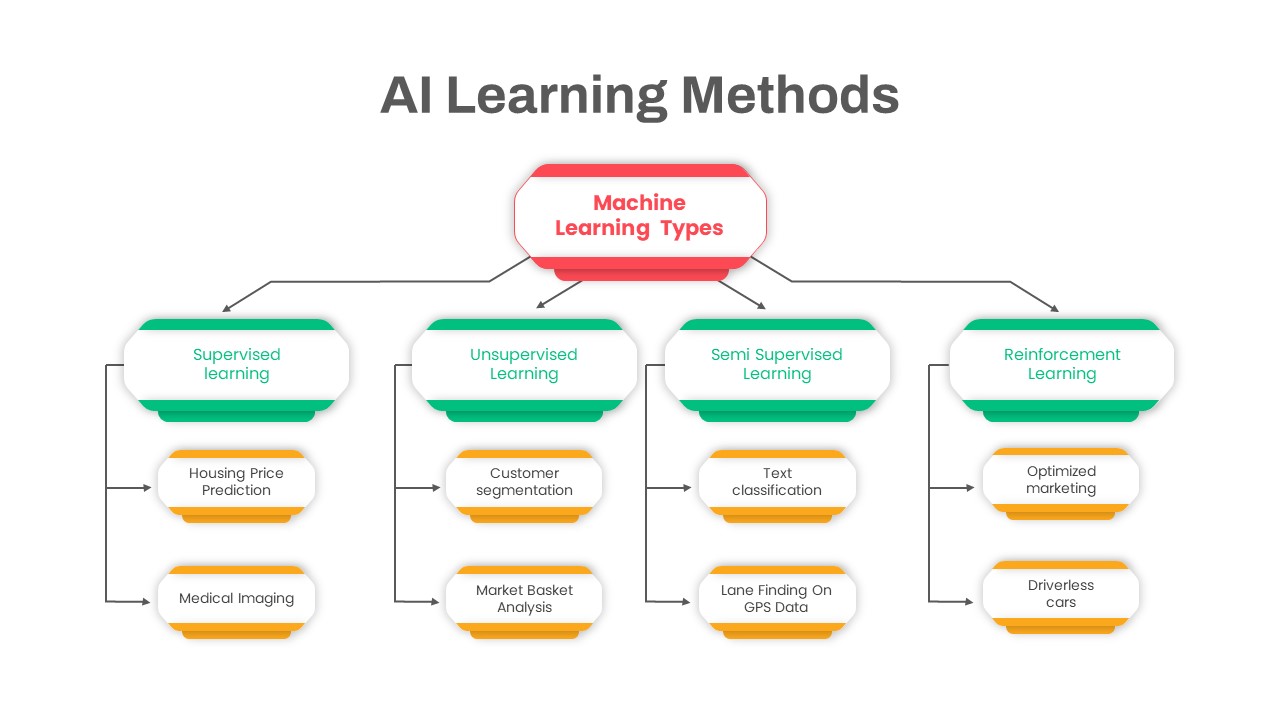
AI Learning Methods Flowchart Diagram Template for PowerPoint & Google Slides
Flow Charts
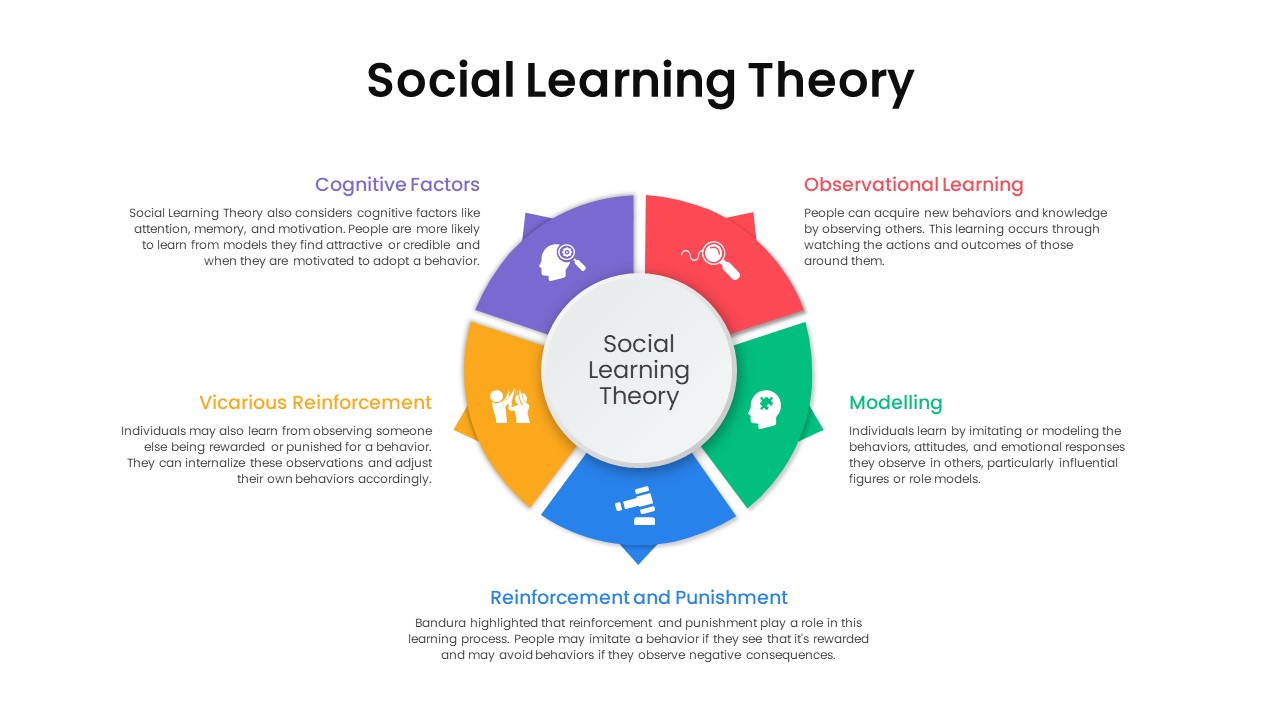
Social Learning Theory Infographic Template for PowerPoint & Google Slides
Circular
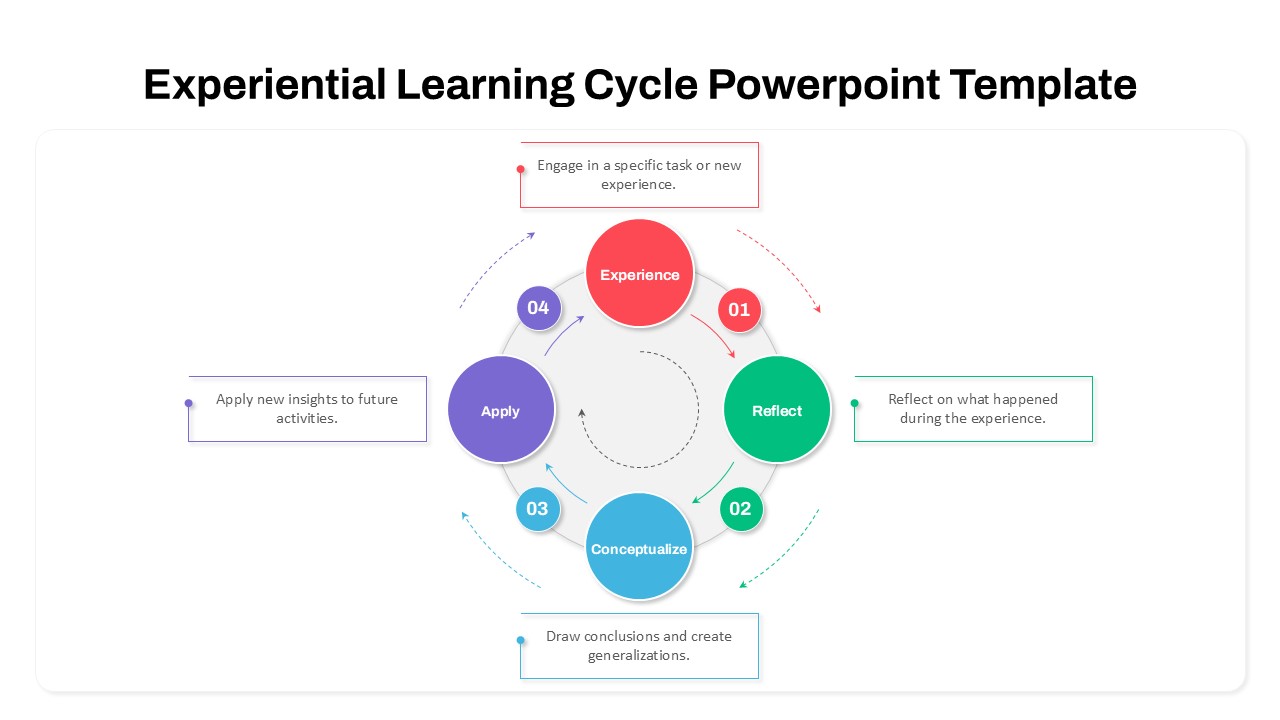
Experiential Learning Cycle Diagram Template for PowerPoint & Google Slides
Circular
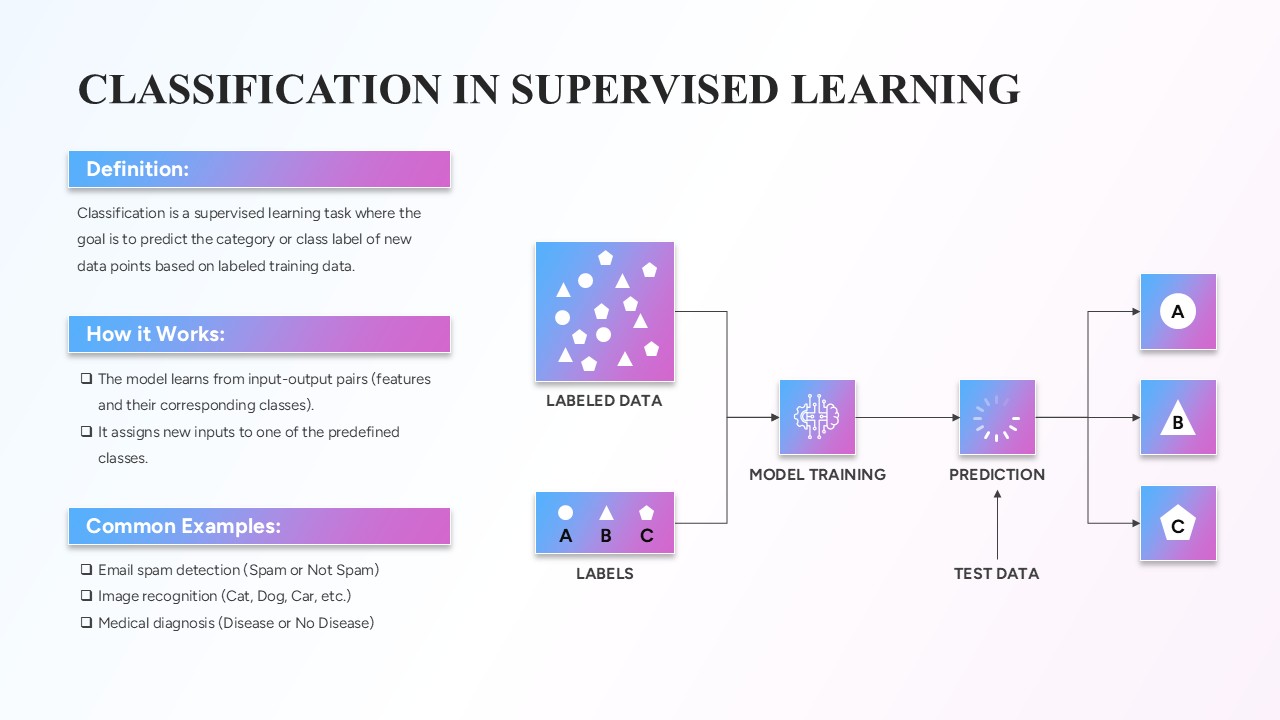
Classification in Supervised Learning template for PowerPoint & Google Slides
Infographics
Supervised Learning Overview template for PowerPoint & Google Slides
Technology
Transfer Learning Process template for PowerPoint & Google Slides
Technology
Self-supervised Learning Process template for PowerPoint & Google Slides
Technology
Reinforcement Learning Diagram Dark Template for PowerPoint & Google Slides
Machine Learning
Semi-Supervised Learning Flow Diagram Template for PowerPoint & Google Slides
Machine Learning
Deep Q Networks in Reinforcement Learning template for PowerPoint & Google Slides
Technology
Learning Agility template for PowerPoint & Google Slides
Business
Regression in Supervised Learning Overview template for PowerPoint & Google Slides
Process
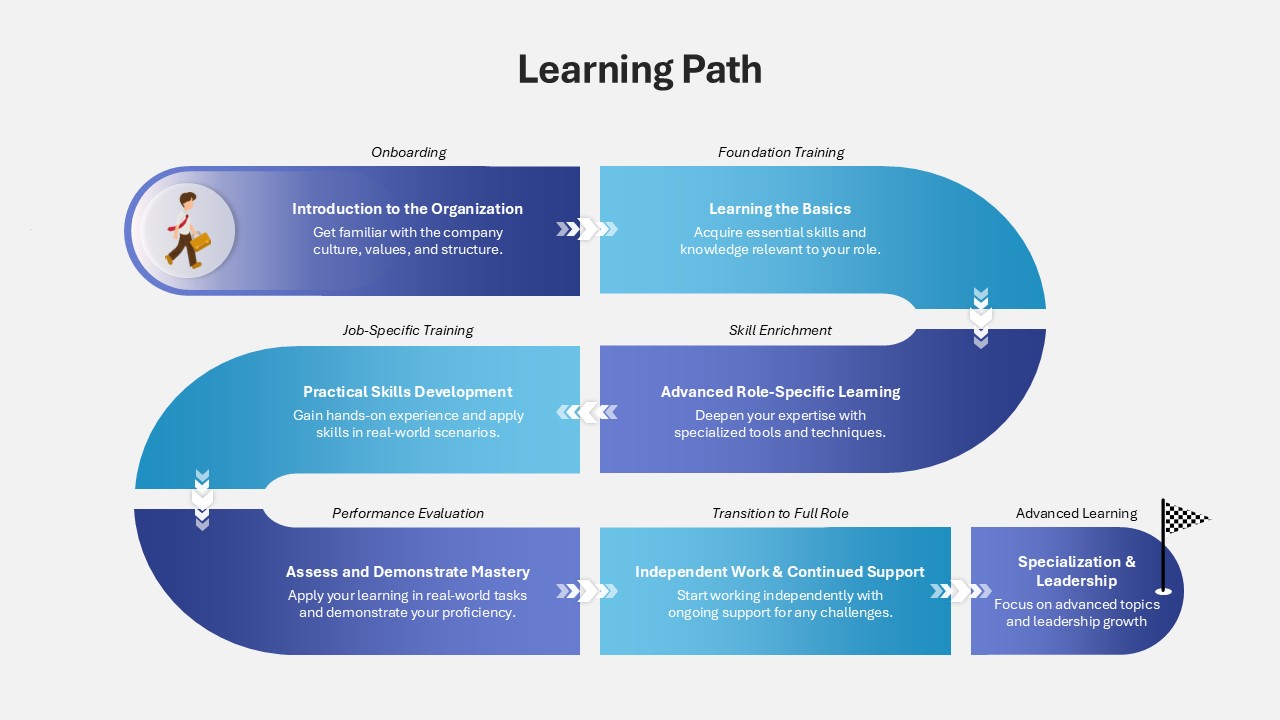
Learning Path Infographic Template for PowerPoint & Google Slides
Process
Q-Learning Process Flow Diagram Template for PowerPoint & Google Slides
Process
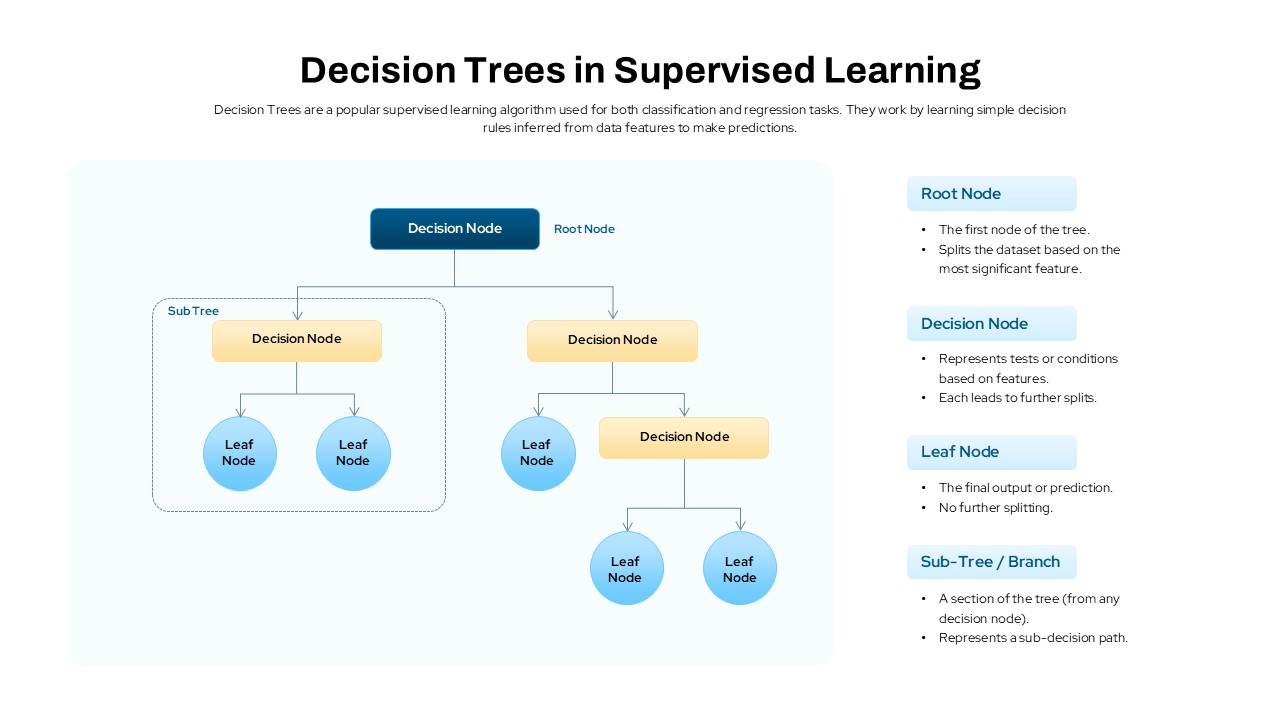
Decision Trees in Supervised Learning Template for PowerPoint & Google Slides
Machine Learning
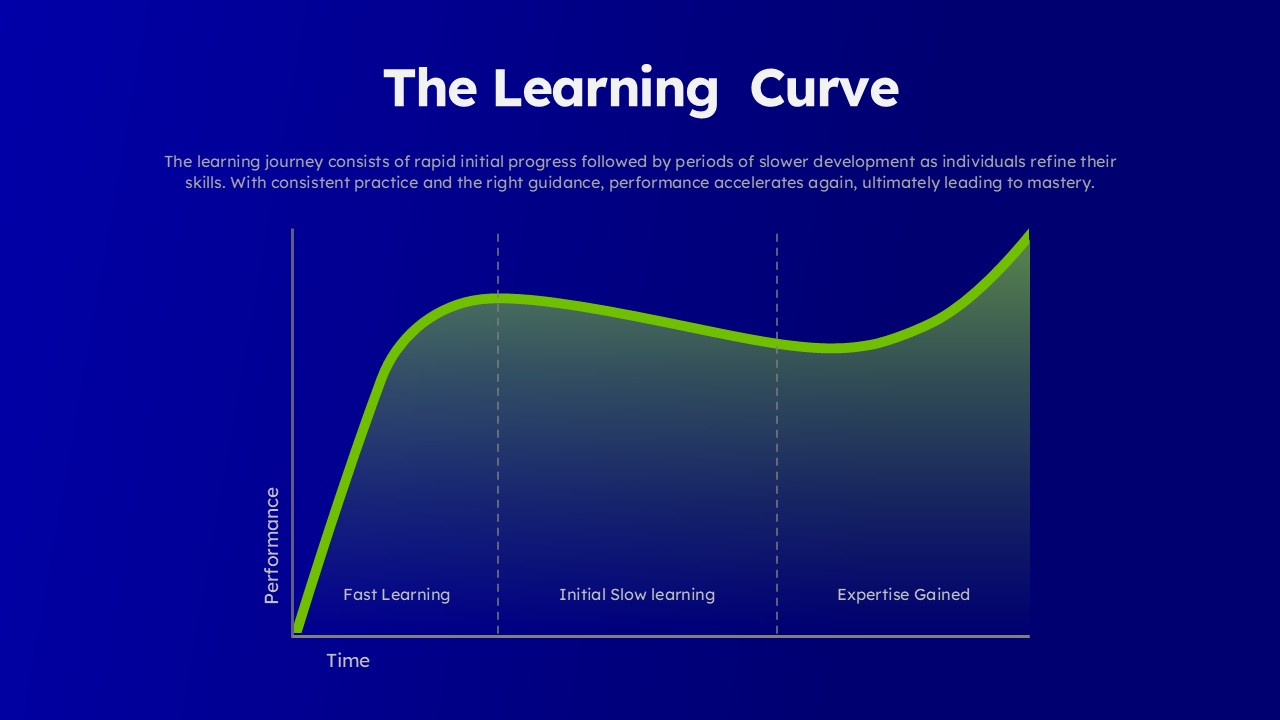
Learning Curve Performance Growth Chart Template for PowerPoint & Google Slides
Employee Performance
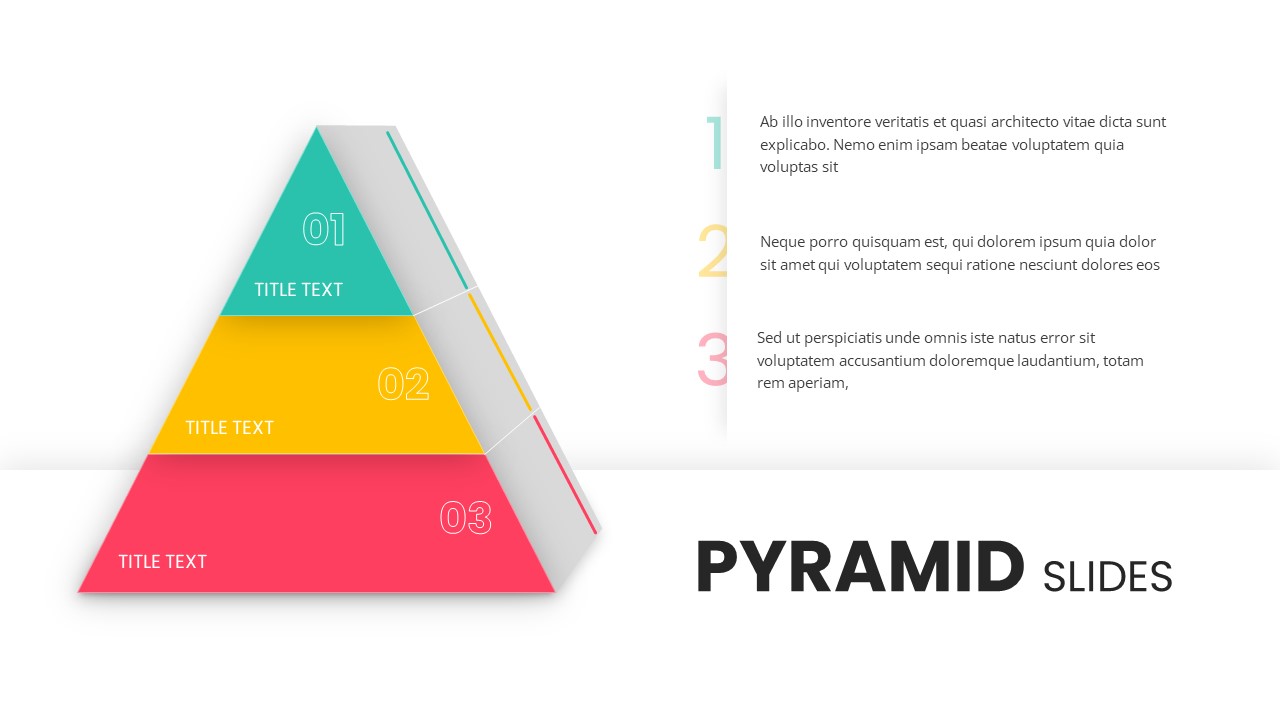
3 Stage Pyramid Slides for PowerPoint & Google Slides
Pyramid
10 Stage Business Milestone Timeline PowerPoint Template for PowerPoint & Google Slides
Timeline
Stage Infographic template for PowerPoint & Google Slides
Process

Tree Growth Stage Infographic Template for PowerPoint & Google Slides
Timeline
Five-Stage Arrow Infographics Timeline Template for PowerPoint & Google Slides
Arrow
Five-Stage Pyramid Infographics Diagram Template for PowerPoint & Google Slides
Pyramid
Engaging Five-Stage Process Diagram Template for PowerPoint & Google Slides
Process
Five Stage Process Diagram template for PowerPoint & Google Slides
Process
Free
6-Stage Funnel Diagram Infographic Template for PowerPoint & Google Slides
Funnel
7-Stage Zig-Zag Business Process Template for PowerPoint & Google Slides
Process
Five-Stage Process Flow Diagram Template for PowerPoint & Google Slides
Process
Five-Stage Marketing Funnel Infographic Template for PowerPoint & Google Slides
Funnel
Six-Stage Star Diagram Infographic Template for PowerPoint & Google Slides
Process
Six-Stage Timeline Infographics Slide Template for PowerPoint & Google Slides
Timeline
4 stage Process Flow template for PowerPoint & Google Slides
Process
6 Stage Hub and Spoke Stages template for PowerPoint & Google Slides
Business Models
3D Product Spotlight Stage Design Template for PowerPoint & Google Slides
Graphics
5 Stage Sales Funnel Diagram Template for PowerPoint & Google Slides
Funnel