














Service Quality Heatmap Template for PowerPoint & Google Slides
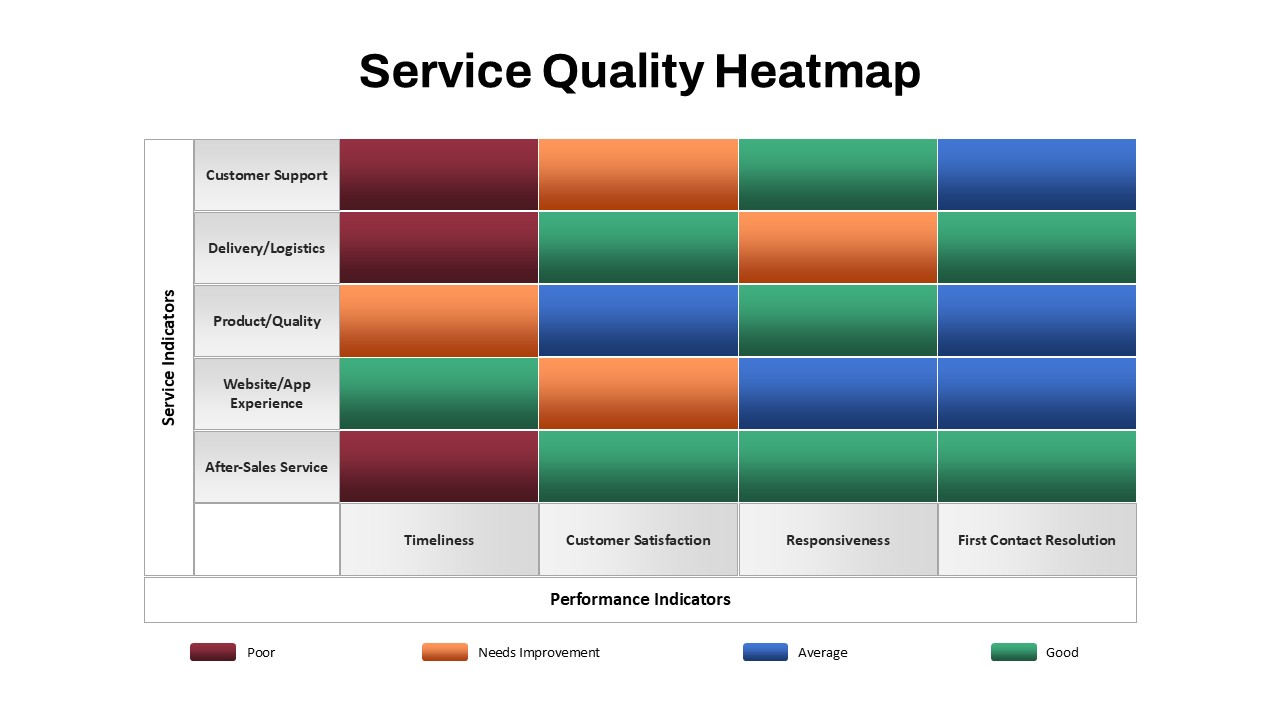
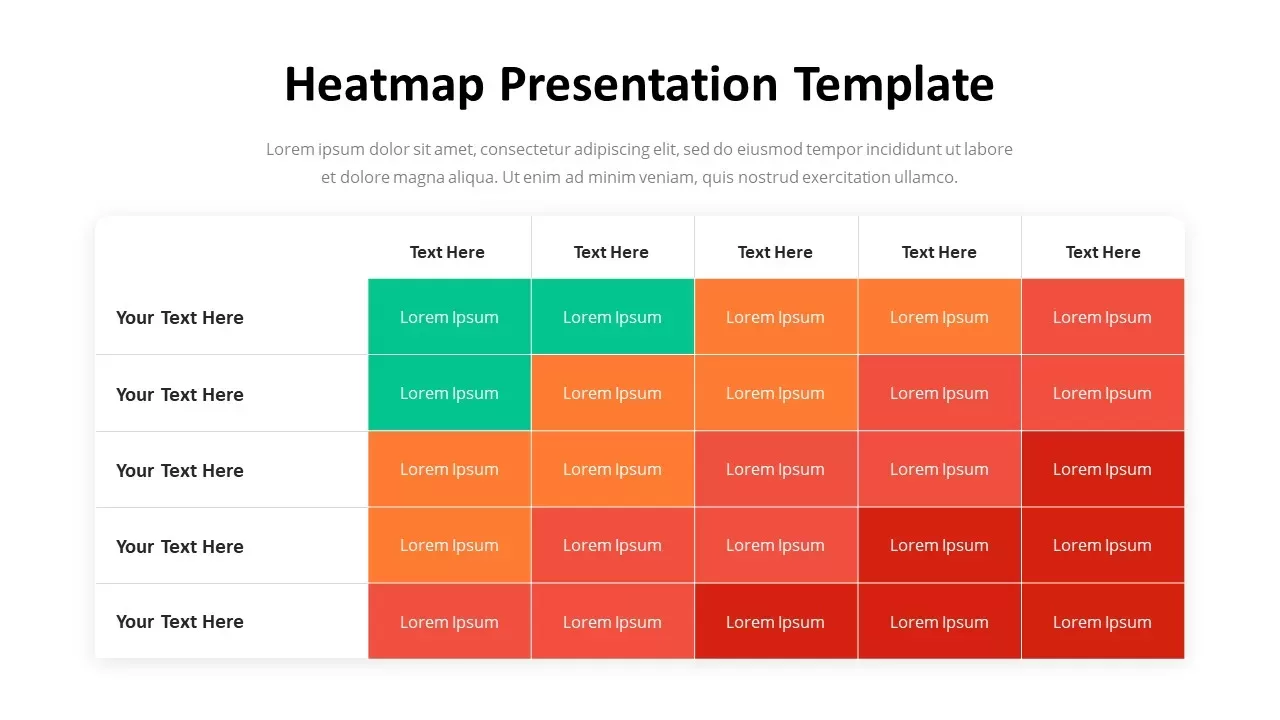
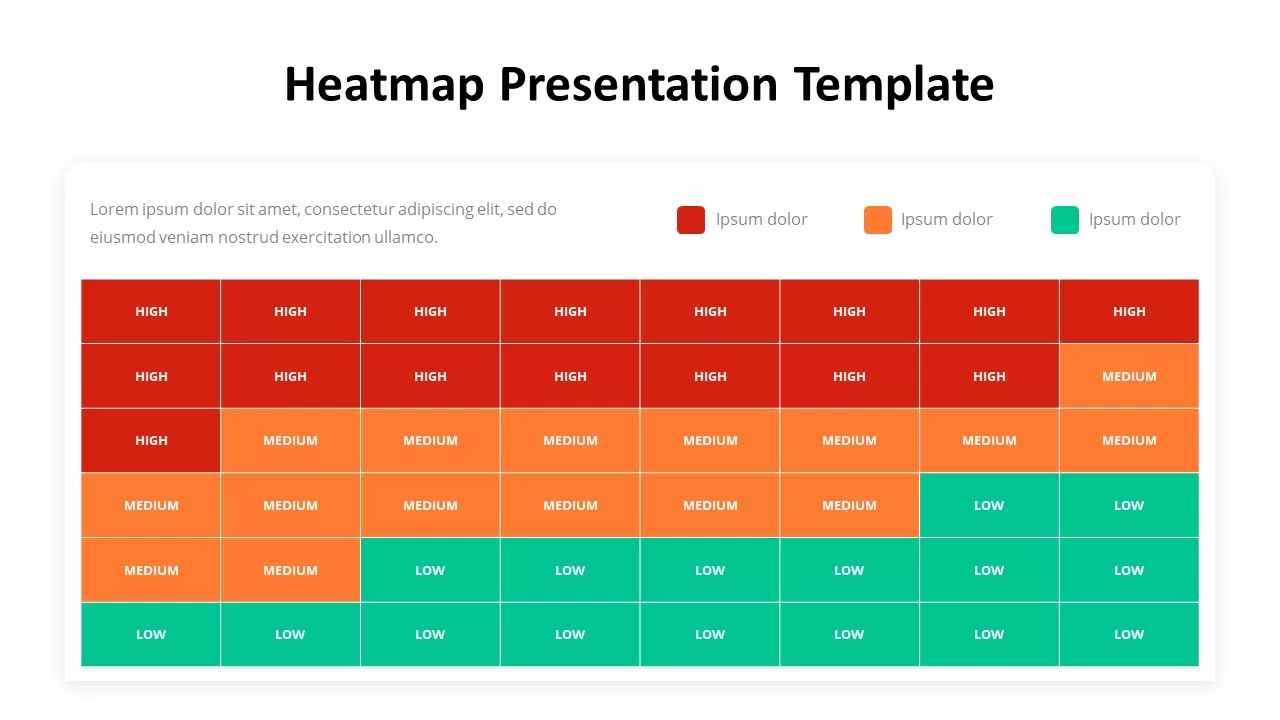
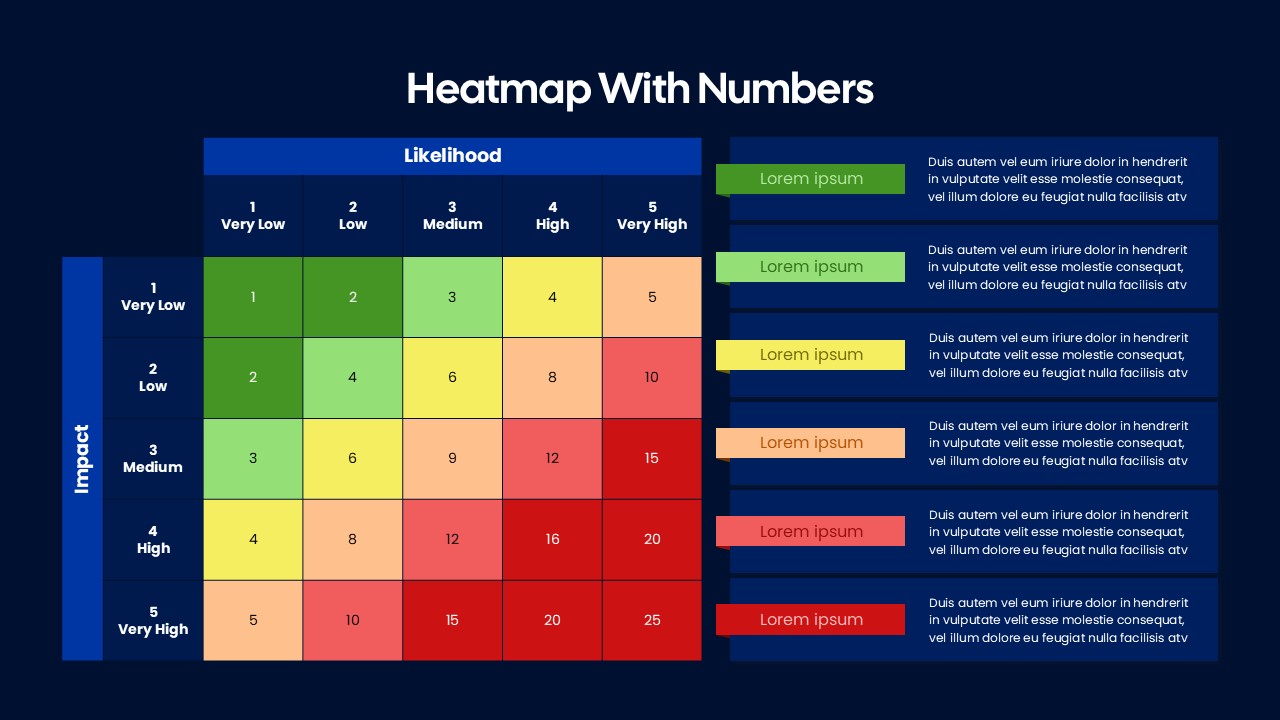
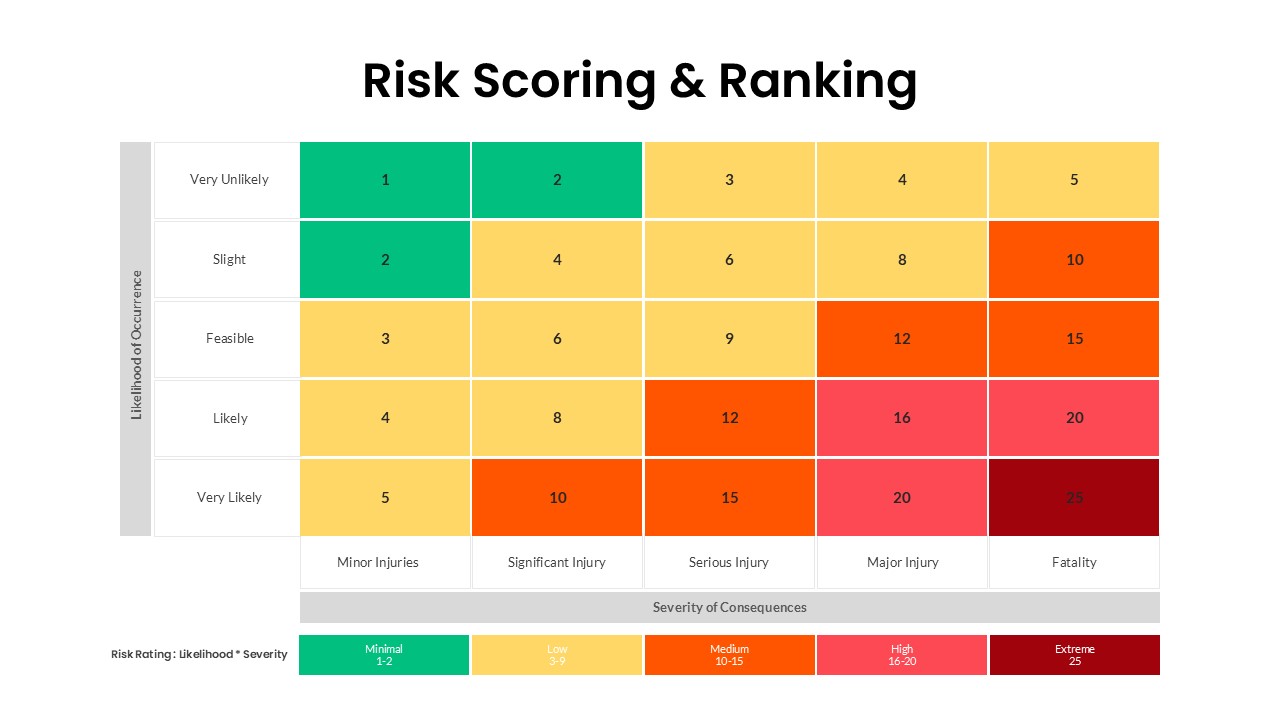
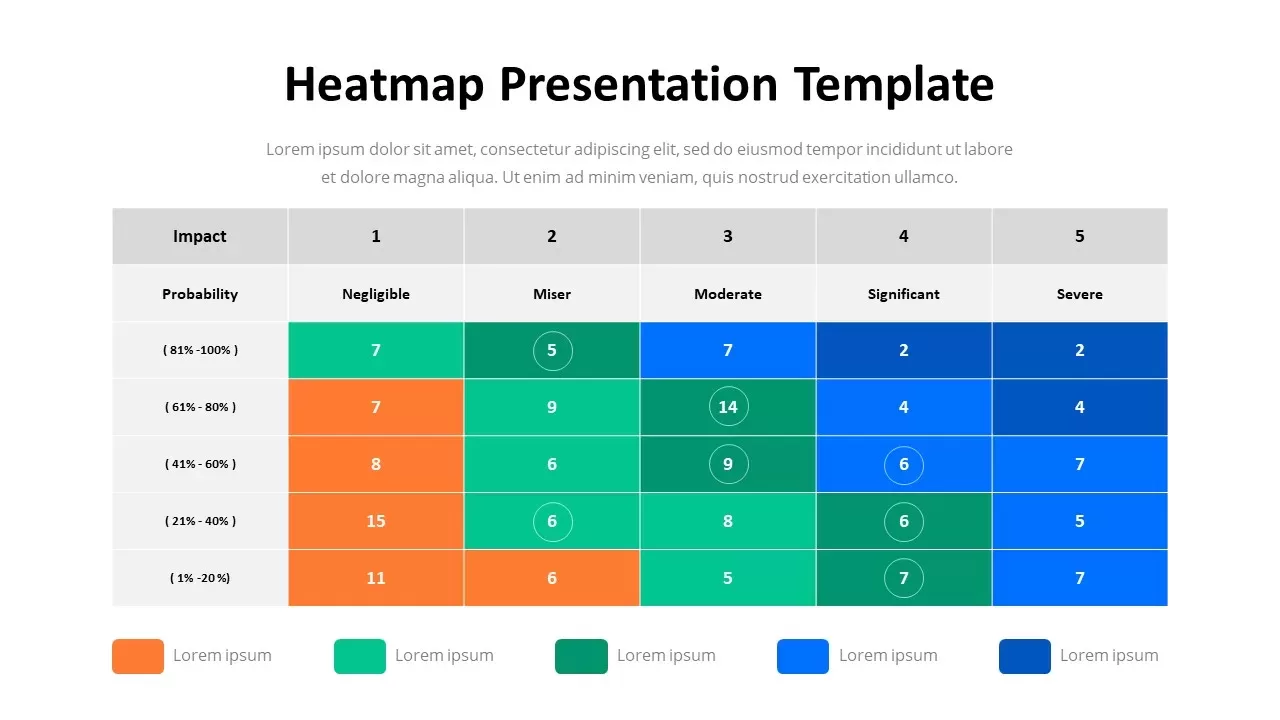
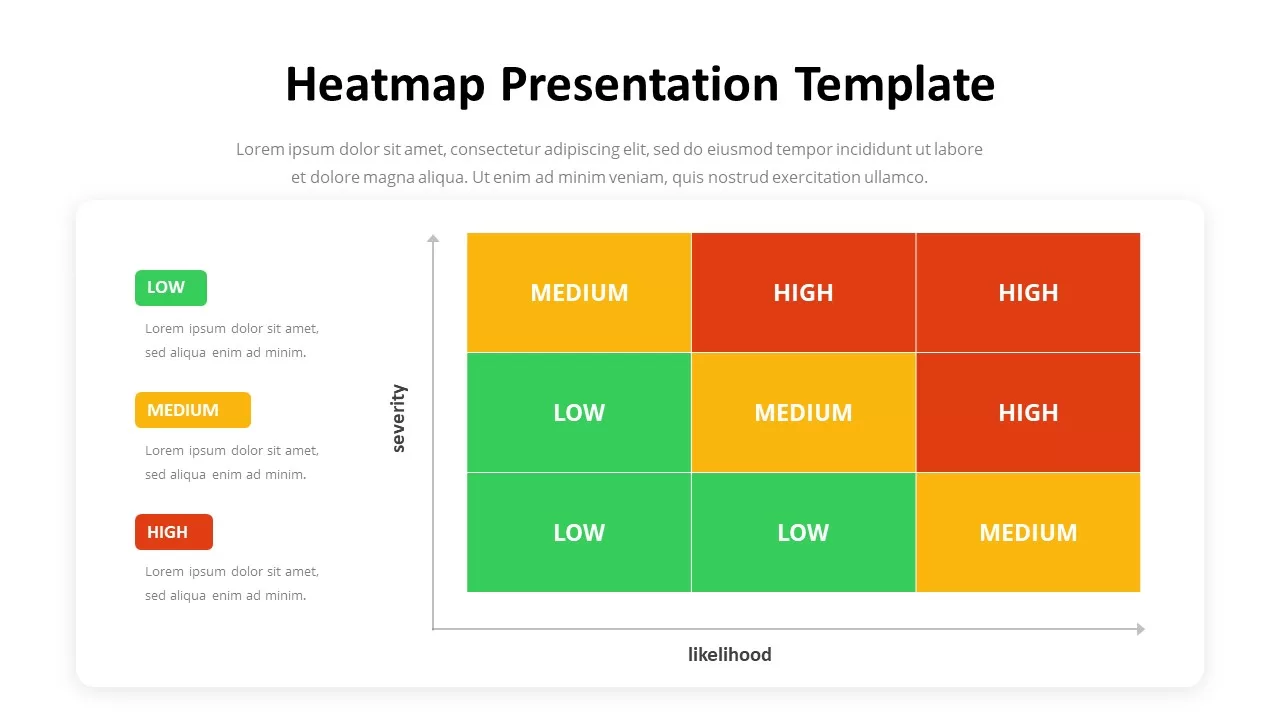
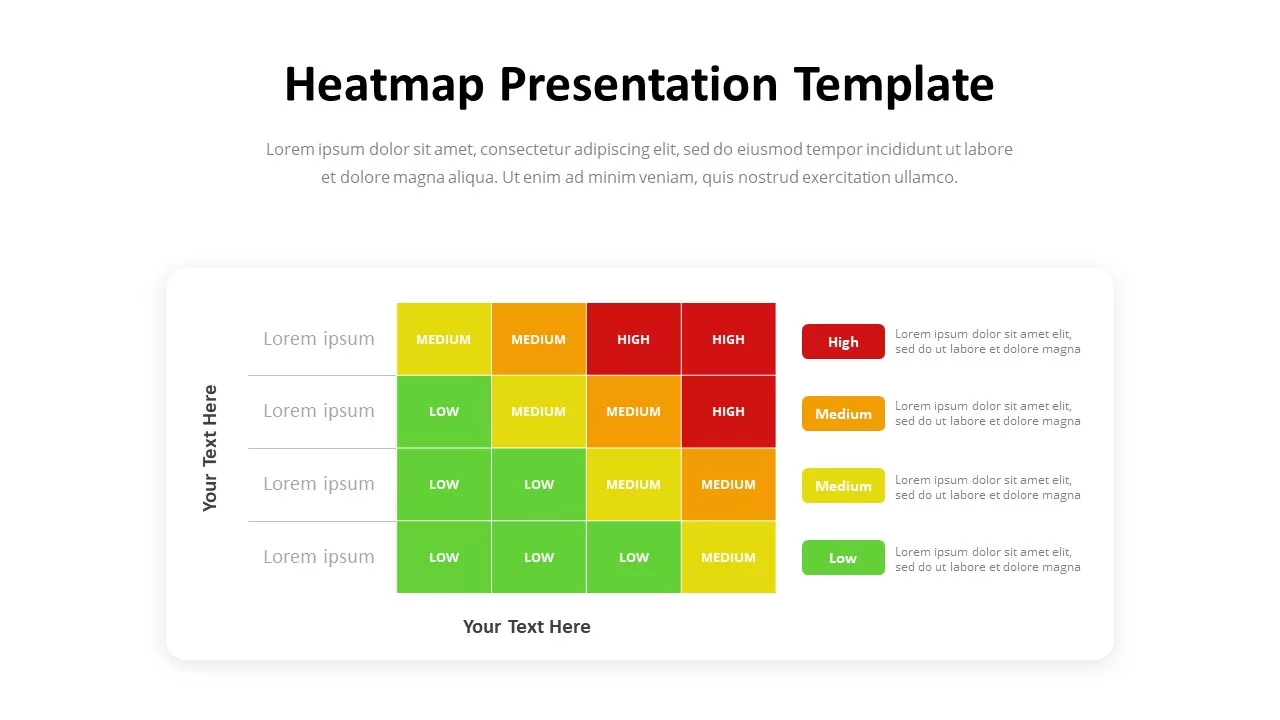
Download this Service Quality Heatmap template to present service performance data in a simple, color-coded format. Ideal for customer experience reviews, quality assessments, operational reporting, and performance tracking, this slide helps teams quickly identify strengths and improvement areas across multiple service functions. Whether you’re preparing a management review, stakeholder presentation, or customer service audit, this heatmap makes complex data easy to interpret. Heatmaps are widely used to visualize performance trends and highlight areas requiring attention, making them valuable for data-driven decision-making.
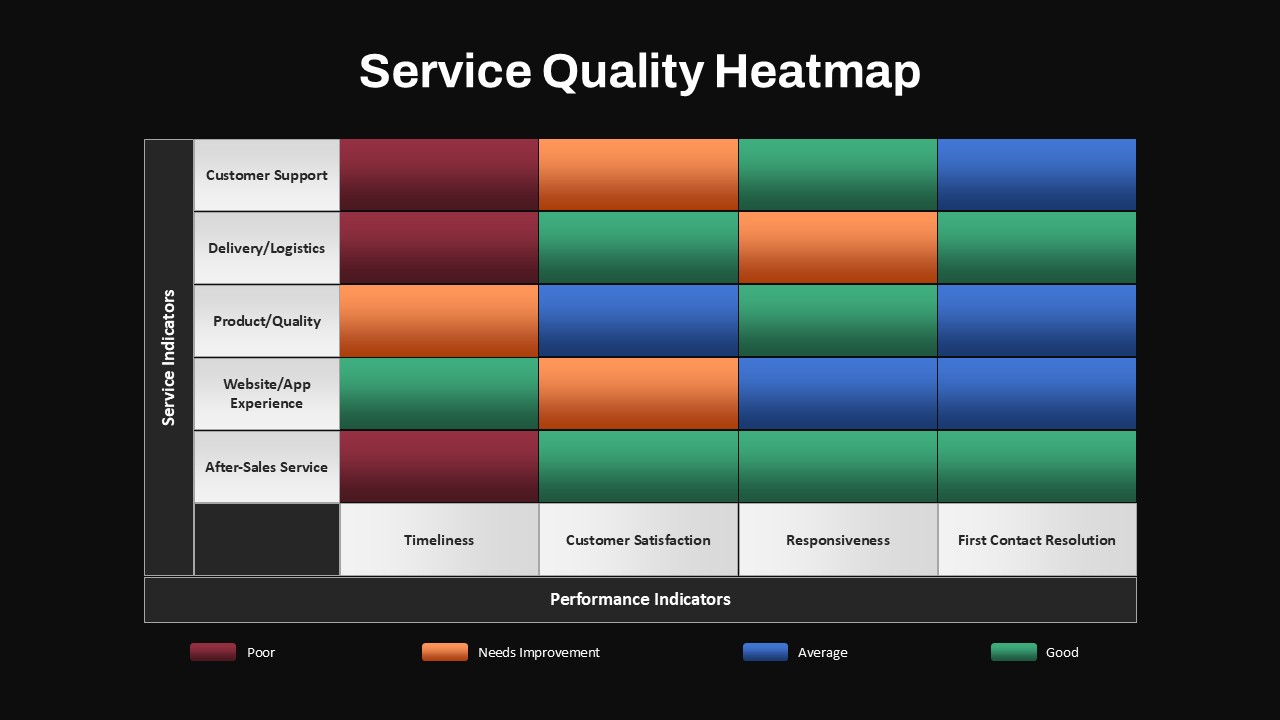
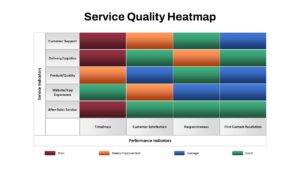
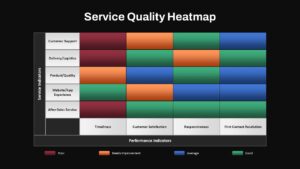
A Service Quality Heatmap is a visual assessment tool used to measure and compare service performance across multiple business functions and evaluation criteria. This template displays Service Indicators such as Customer Support, Delivery & Logistics, Product Quality, Website/App Experience, and After-Sales Service against key Performance Indicators like Timeliness, Customer Satisfaction, Responsiveness, and First Contact Resolution. Using a color-coded scale from poor to good performance, the heatmap helps users quickly spot strengths, weaknesses, and service gaps. It is particularly useful for service managers, customer experience teams, operations leaders, quality assurance professionals, and business analysts who need to evaluate service effectiveness and communicate findings in a clear, data-driven format.
Key Features of this Heatmap
- Fully editable heatmap layout
- Color-coded performance rating system
- Clear comparison of service and performance metrics
- Professional design for executive reporting
- Available in PowerPoint and Google Slides
- Easy customization of labels, categories, and colors
Use this Service Quality Heatmap to transform performance data into actionable insights. From customer service reviews and operational audits to KPI tracking and process improvement discussions, this template helps teams focus on what matters most and present results with clarity and confidence.
Login to download this file

Item ID
SB05429Designed By
Filda


Related Templates

Professional Heatmap Data Visualization Template for PowerPoint & Google Slides
Infographics
Heatmap Comparison Template for PowerPoint & Google Slides
Maps
Heatmap Matrix with Numbers for PowerPoint and Google Slides
Project
Risk Scoring & Ranking Heatmap PowerPoint Template
Risk Management
Risk Assessment Heatmap Matrix Template
Comparison Chart
Heatmap Template
Maps
Risk Heatmap Comparison Template
Maps

Manufacturing Quality Process PowerPoint Template and Google Slides
Process
Quality Management System Circular Diagram template for PowerPoint & Google Slides
Process
House of Quality template for PowerPoint & Google Slides
Marketing
Total Quality Management (TQM) Slide for PowerPoint & Google Slides
Business Strategy
Critical To Quality Slides Template
Process
Quality Control Presentation Template and QA Framework Slides
Process

Quality Assurance PowerPoint Deck Template
Company Profile
Critical To Quality Slide Template
Process
Critical To Quality Slide
Business Strategy
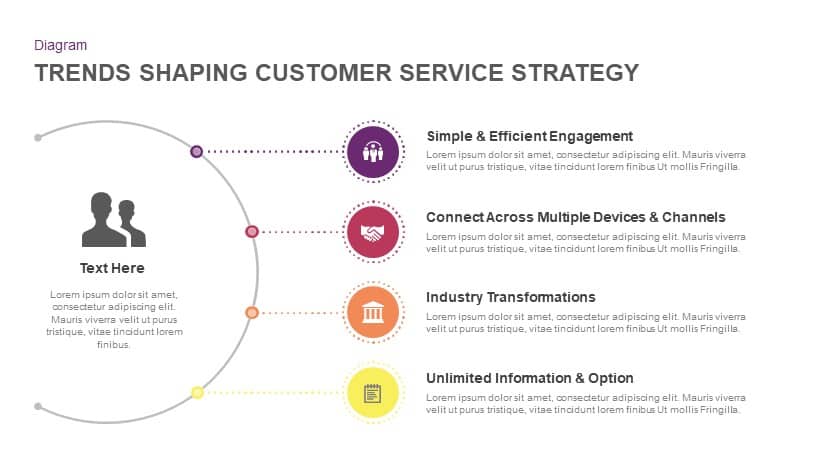
Trends Shaping Customer Service Strategy template for PowerPoint & Google Slides
Marketing
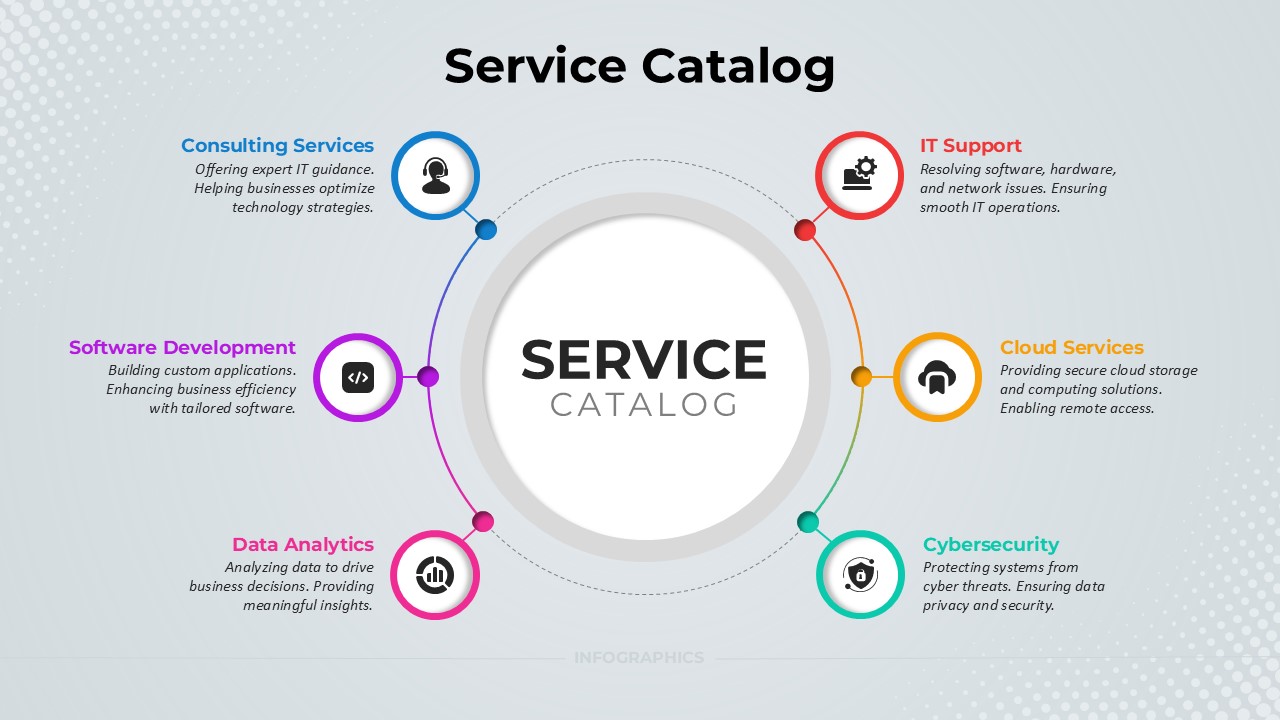
Service Catalog Circular Infographic Template for PowerPoint & Google Slides
Circular
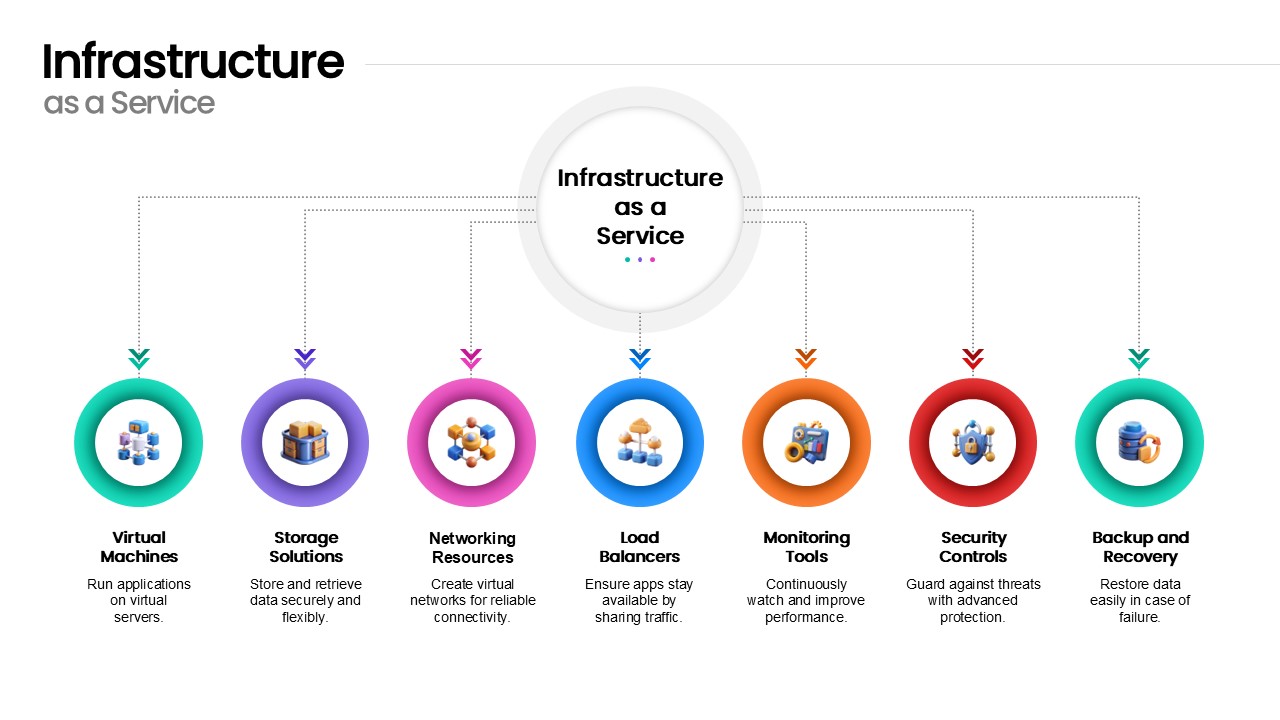
Infrastructure as a Service Diagram Template for PowerPoint & Google Slides
Cloud Computing
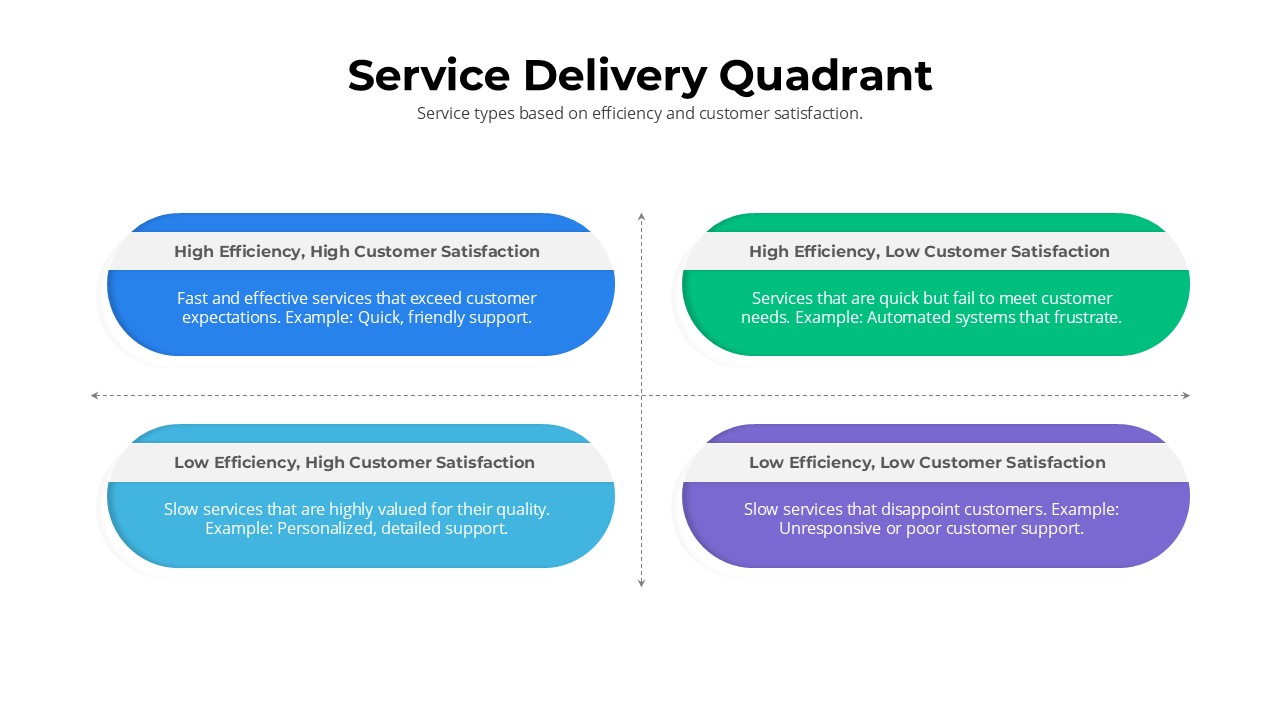
Service Delivery Quadrant Slide Template for PowerPoint & Google Slides
Comparison