Semi-Supervised Learning Flow Diagram Template for PowerPoint & Google Slides
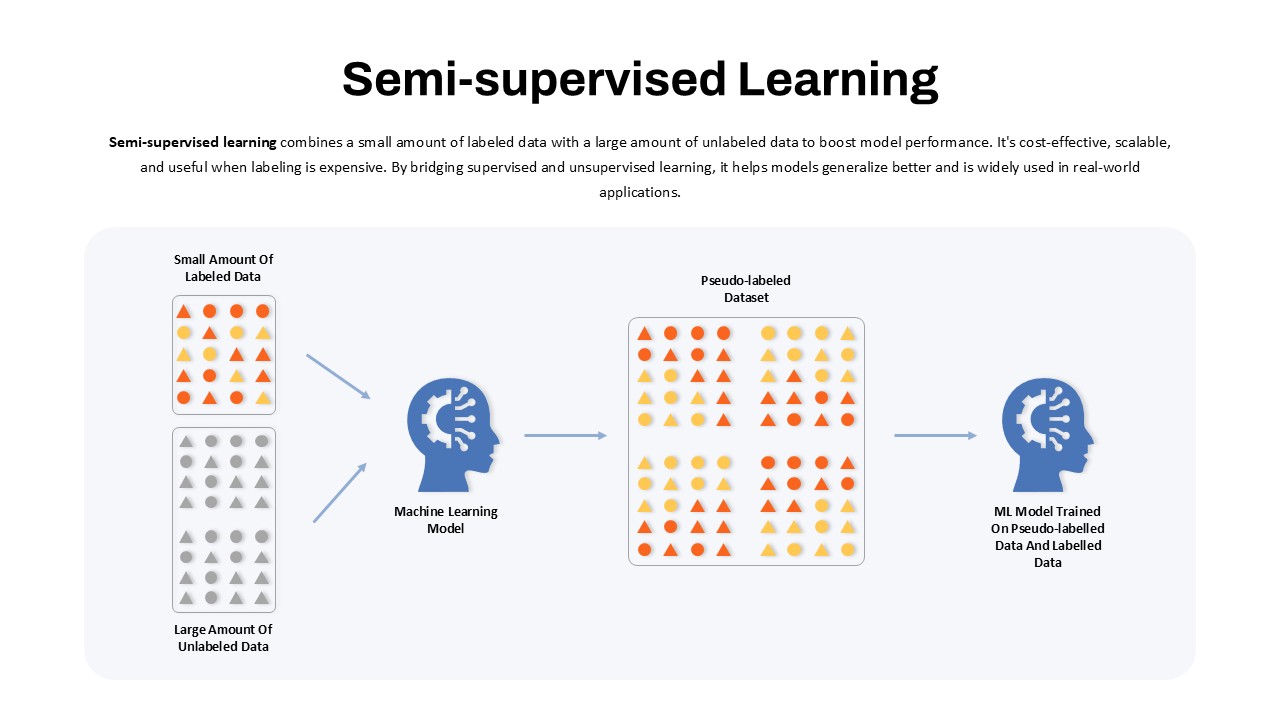
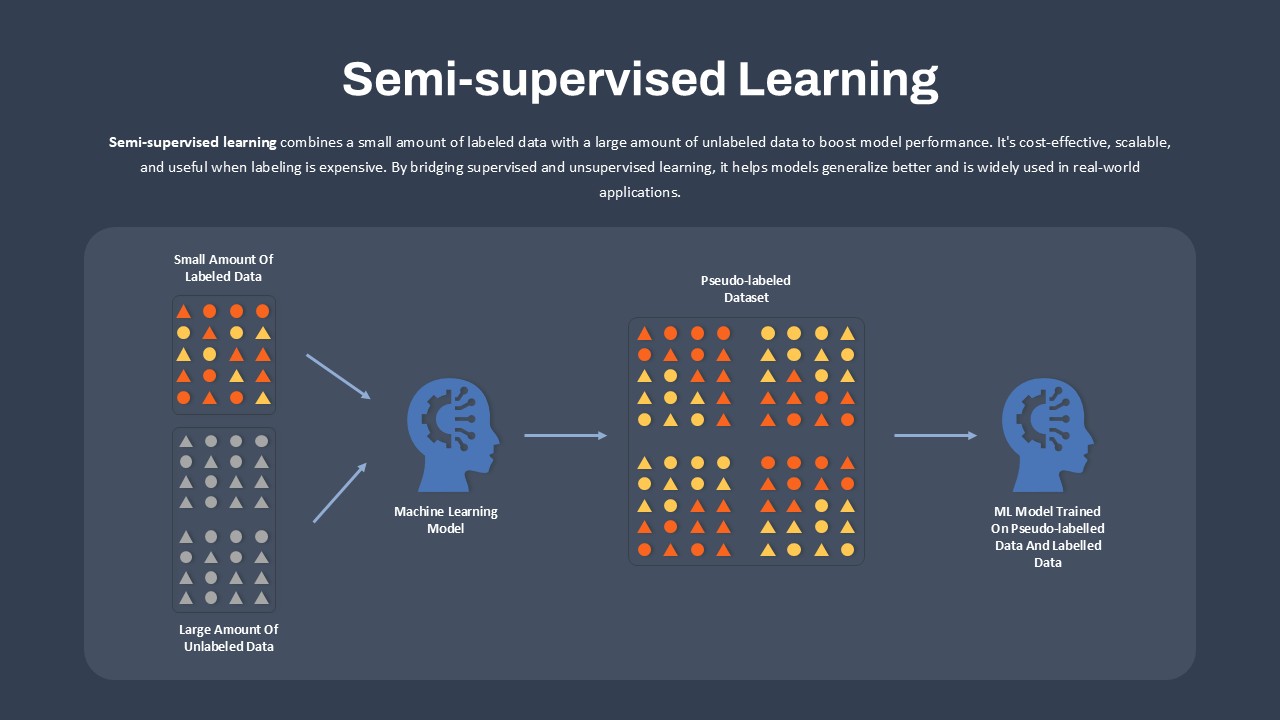

Leverage this semi-supervised learning flow diagram slide to illustrate how combining a small labeled dataset with abundant unlabeled data can boost model performance. The design arranges two input panels—one showcasing a collection of colored, labeled data points and the other featuring grayscale, unlabeled observations—converging into a central machine learning model icon. A directional arrow points to a unified pseudo-labeled dataset, where the model’s predictions assign color-coded labels to previously unlabeled points. A final arrow leads to an enhanced ML model icon, symbolizing the refined model trained on both labeled and pseudo-labeled data. This intuitive visual narrative clearly communicates the iterative process of error propagation and improved generalization associated with semi-supervised techniques.
Fully editable and built on master slides, this template supports vector shapes, adjustable color schemes, and customizable icons to align with any brand palette or presentation theme. You can swap data-point icons to represent different feature types—circles, triangles, or squares—or adjust the color gradient to reflect confidence thresholds or class probabilities. The rounded background container, ample white space, and modern typography ensure readability across devices. Editing placeholders for labels, captions, and arrows allows quick updates to dataset sizes, algorithm names, or experiment results. Whether you need to introduce semi-supervised concepts in a technical workshop, report model improvements to stakeholders, or compare supervised versus semi-supervised approaches, this slide adapts to diverse data-science communication needs. The balanced composition, consistent line weights, and clear directional cues guide audiences through each stage of the workflow without cognitive overload. This diagram elevates complex machine-learning processes into an accessible visual story, making it easier to convey the value of leveraging unlabeled data for scalable, cost-effective model development without sacrificing rigor or depth.
Who is it for
Data scientists, machine learning engineers, data analysts, and AI educators will benefit from this slide when explaining semi-supervised workflows, model training pipelines, or research findings. Product managers, project leads, and technical trainers can also leverage it to illustrate data-labeling strategies.
Other Uses
Repurpose this flow diagram to illustrate active learning workflows, hybrid labeling strategies, iterative algorithm development, or model retraining processes. It’s also ideal for comparing supervised vs. unsupervised approaches, showcasing transfer learning stages, or mapping generative modeling pipelines.
Login to download this file

Item ID
SB05018
Related Templates

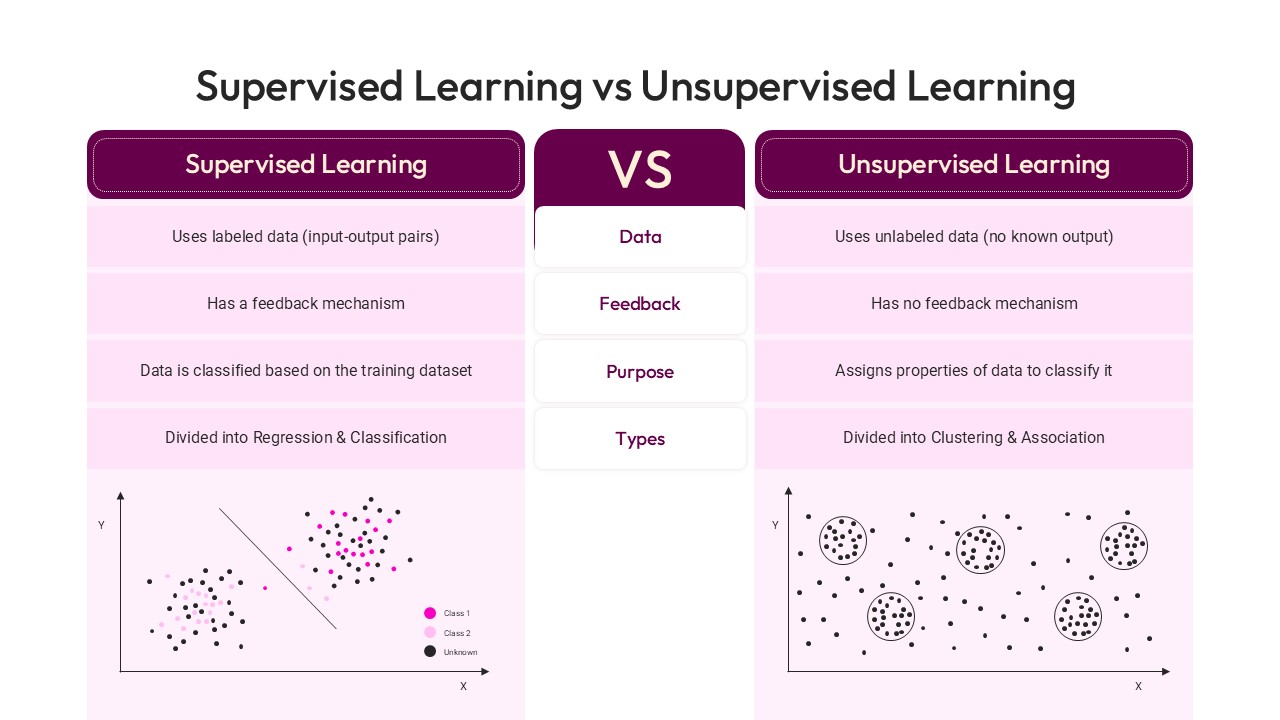
Supervised Learning vs Unsupervised Learning template for PowerPoint & Google Slides
Technology
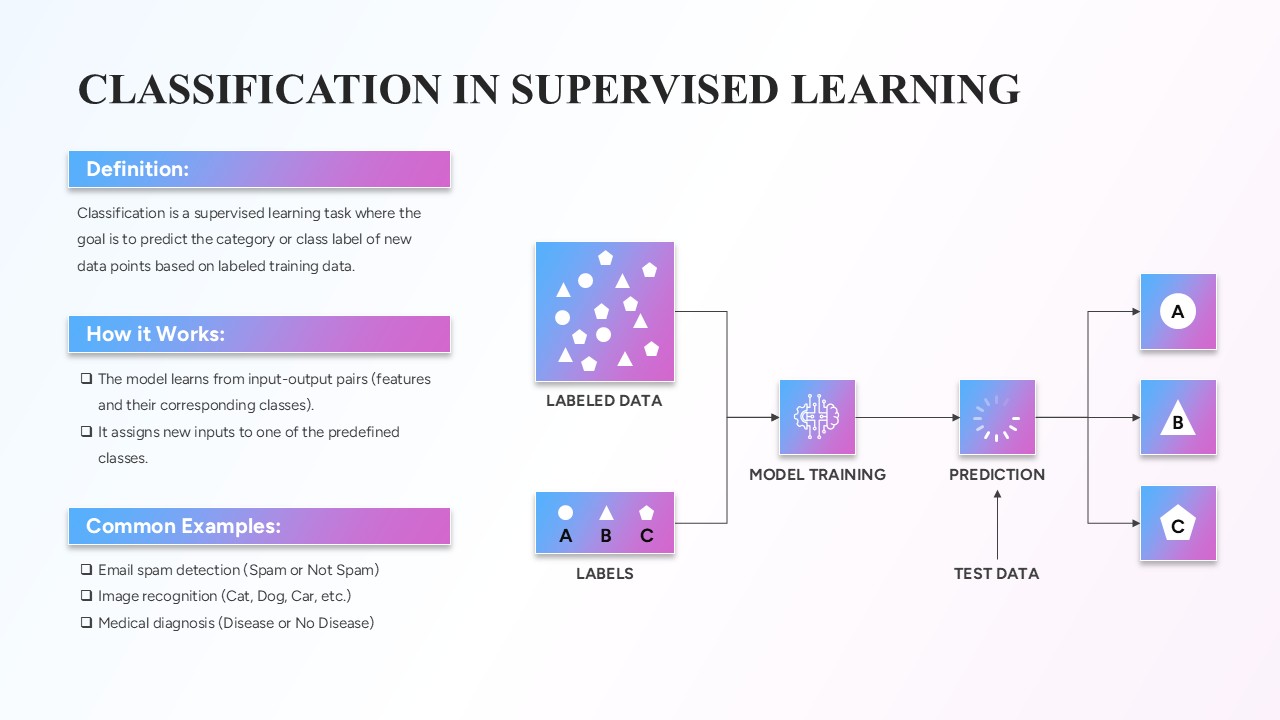
Classification in Supervised Learning template for PowerPoint & Google Slides
Infographics
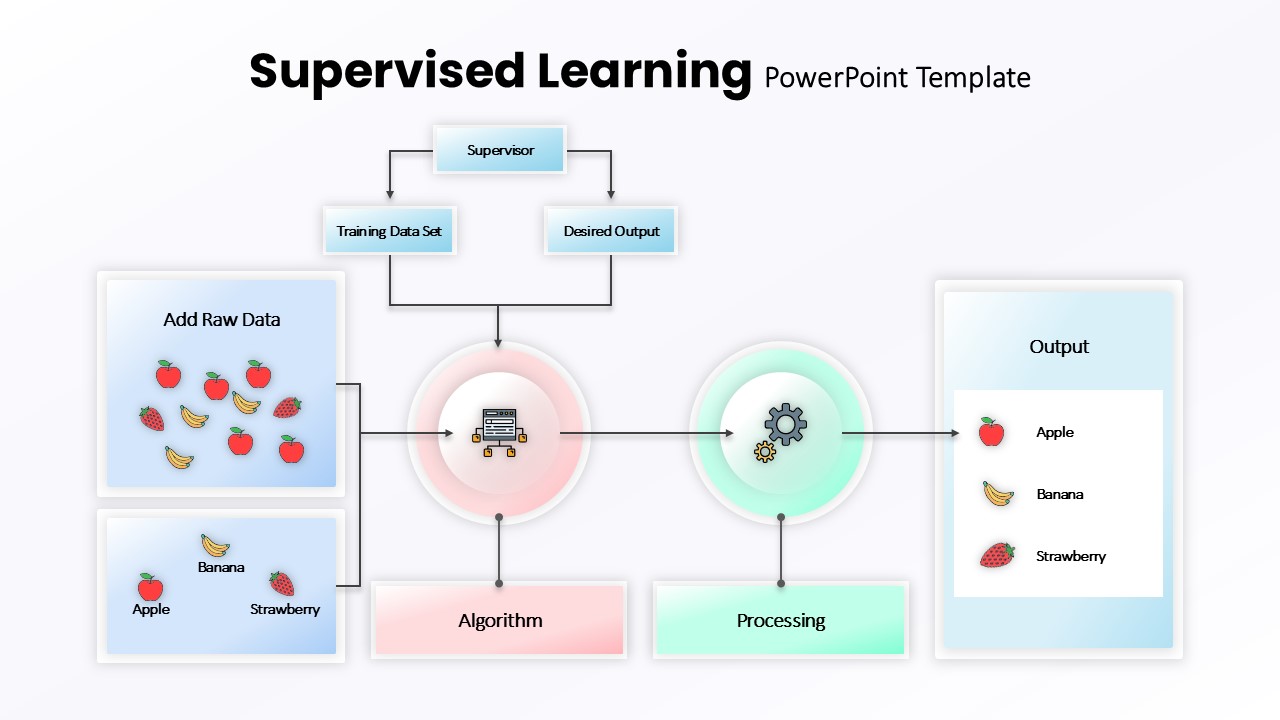
Supervised Learning Overview template for PowerPoint & Google Slides
Technology
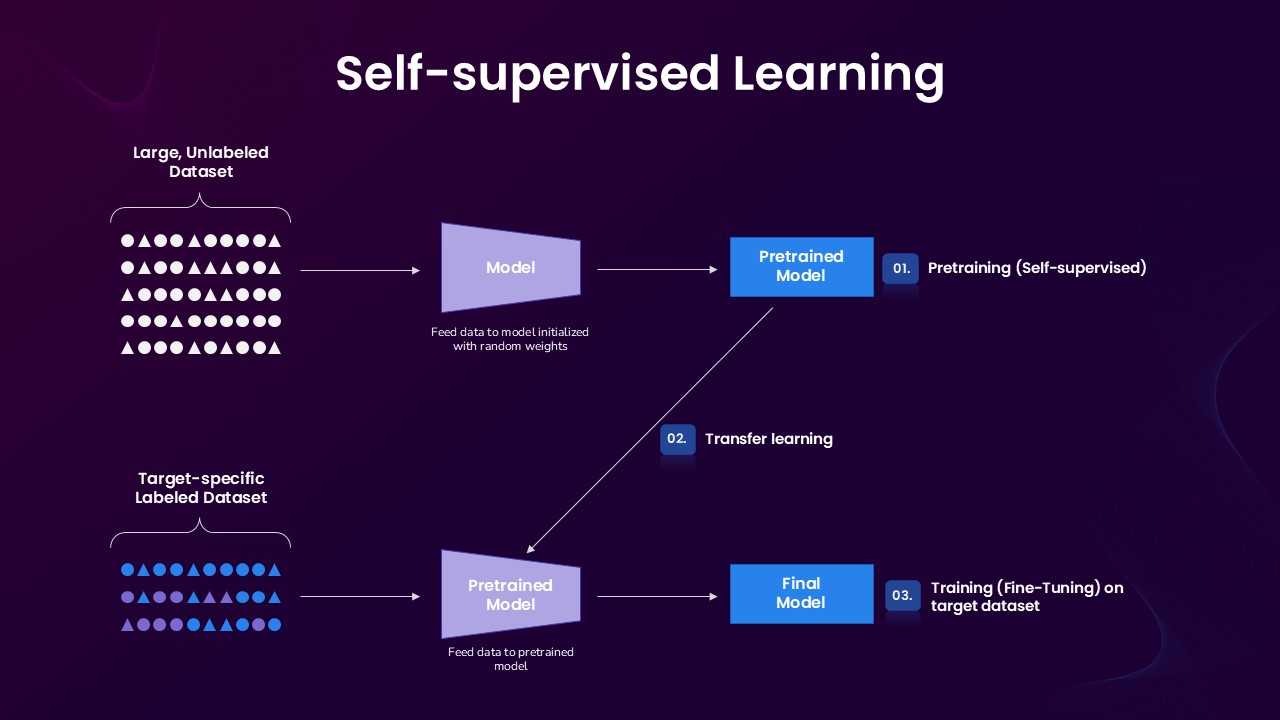
Self-supervised Learning Process template for PowerPoint & Google Slides
Technology
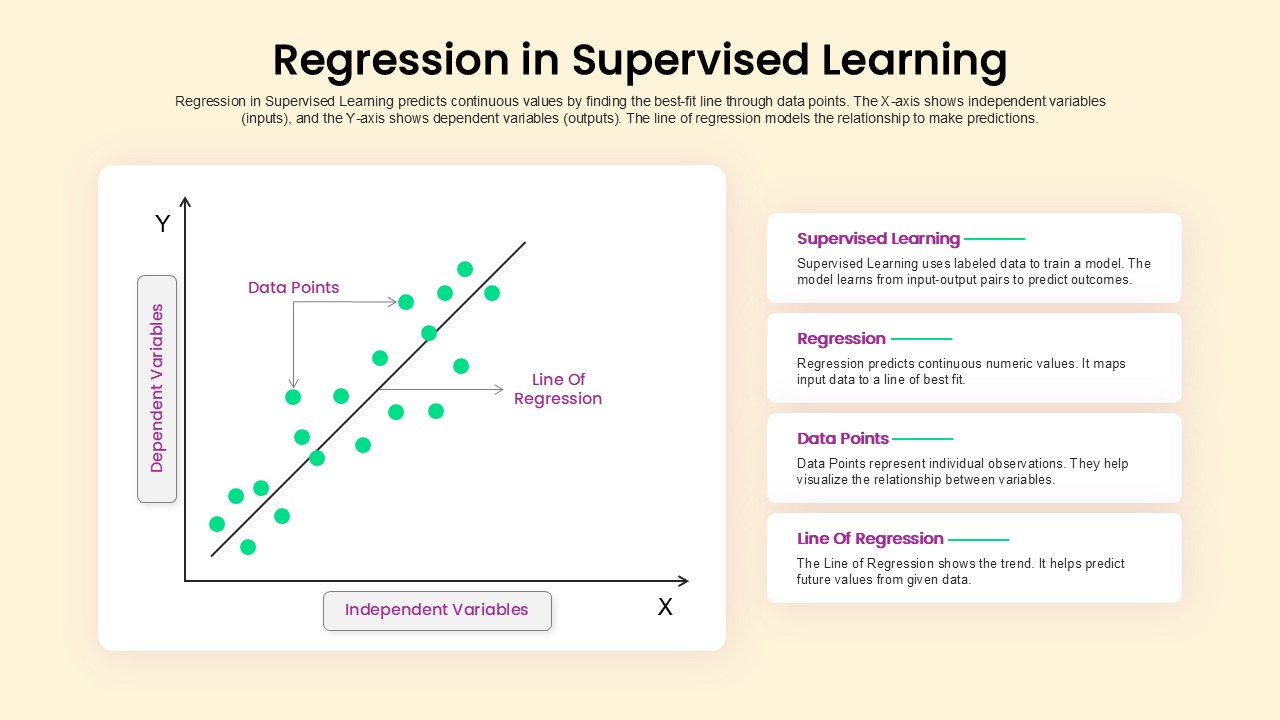
Regression in Supervised Learning Overview template for PowerPoint & Google Slides
Process
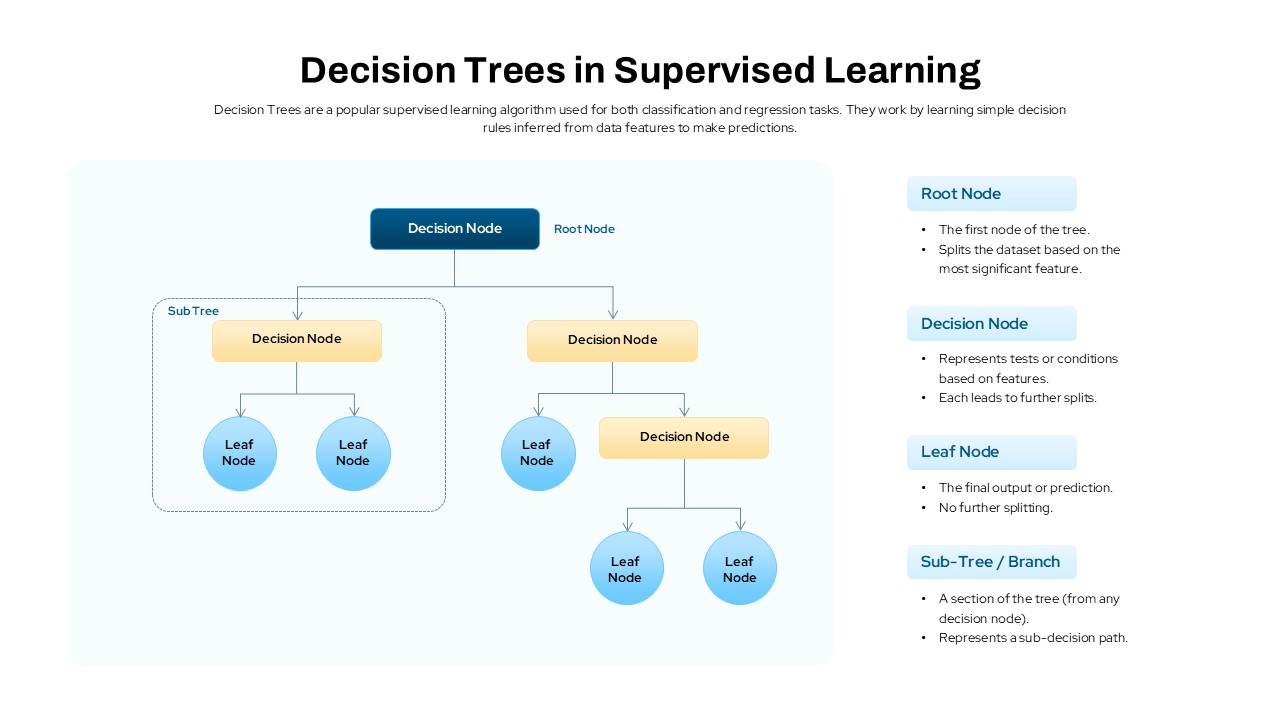
Decision Trees in Supervised Learning Template for PowerPoint & Google Slides
Machine Learning
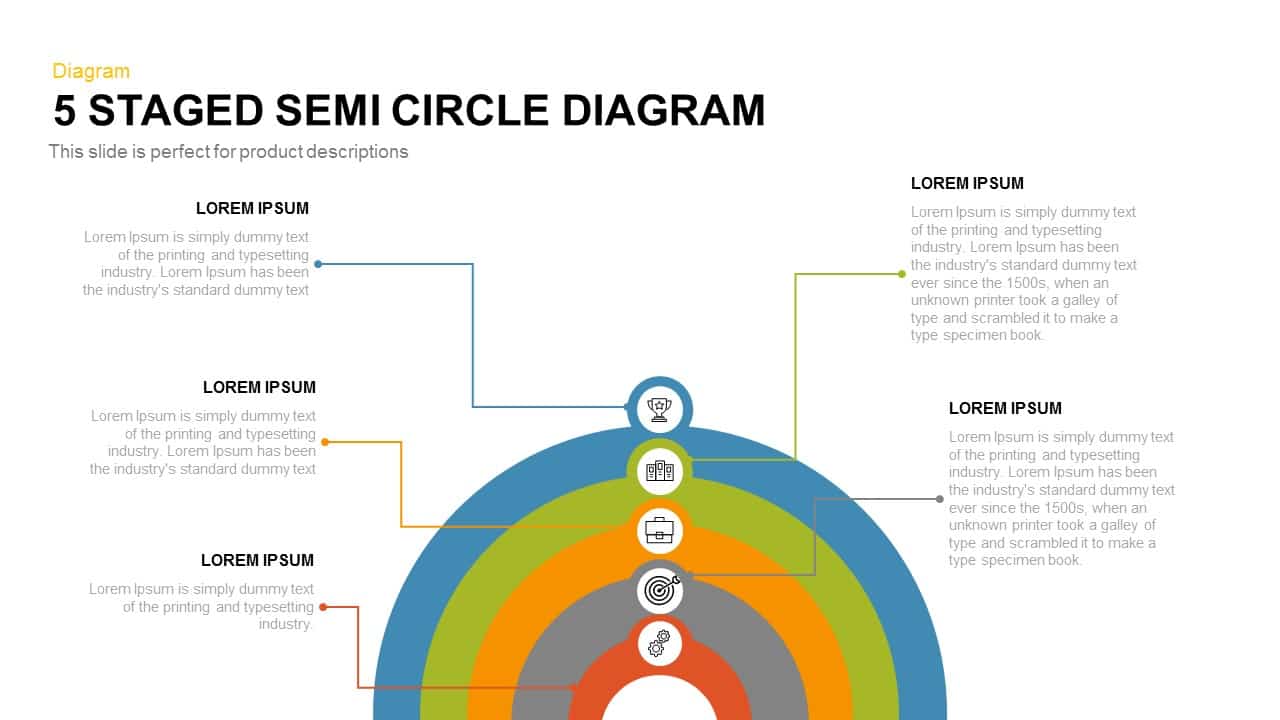
Five-Stage Semi-Circle Diagram Template for PowerPoint & Google Slides
Process
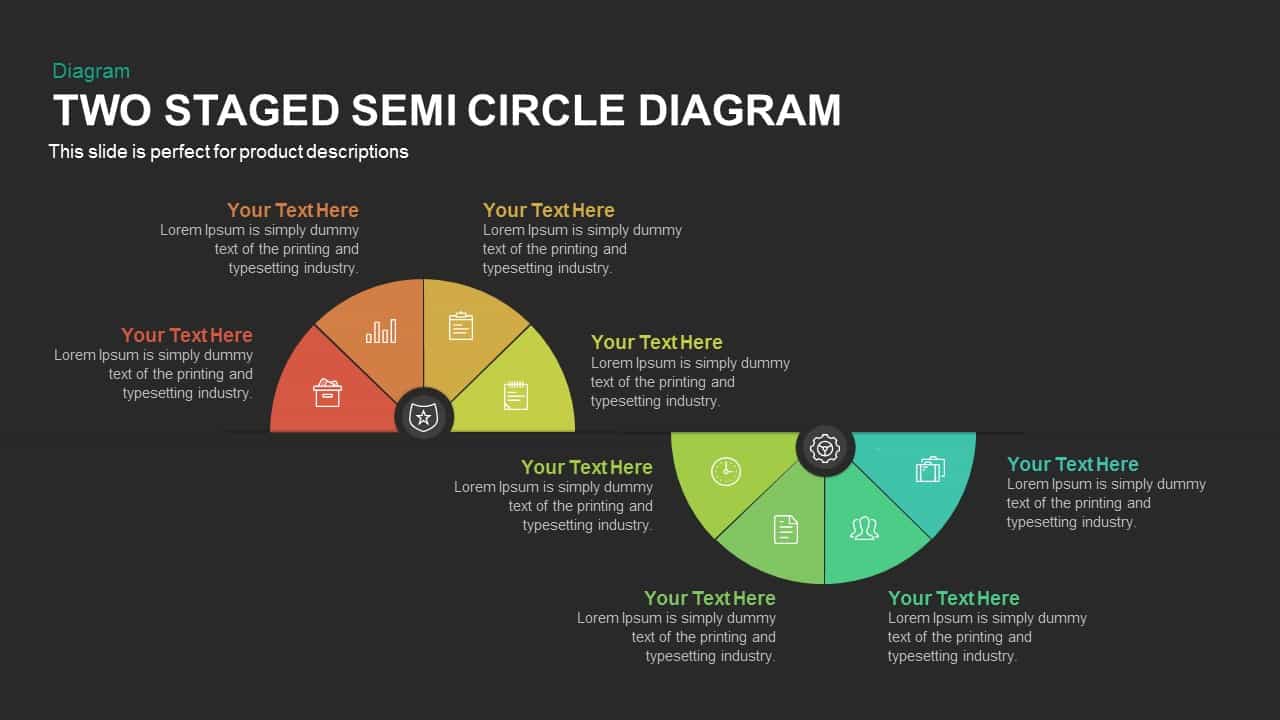
Two-Stage Semi-Circle Diagram Overview Template for PowerPoint & Google Slides
Circular
Six-Stage Semi-Circle Diagram with Icons Template for PowerPoint & Google Slides
Circular
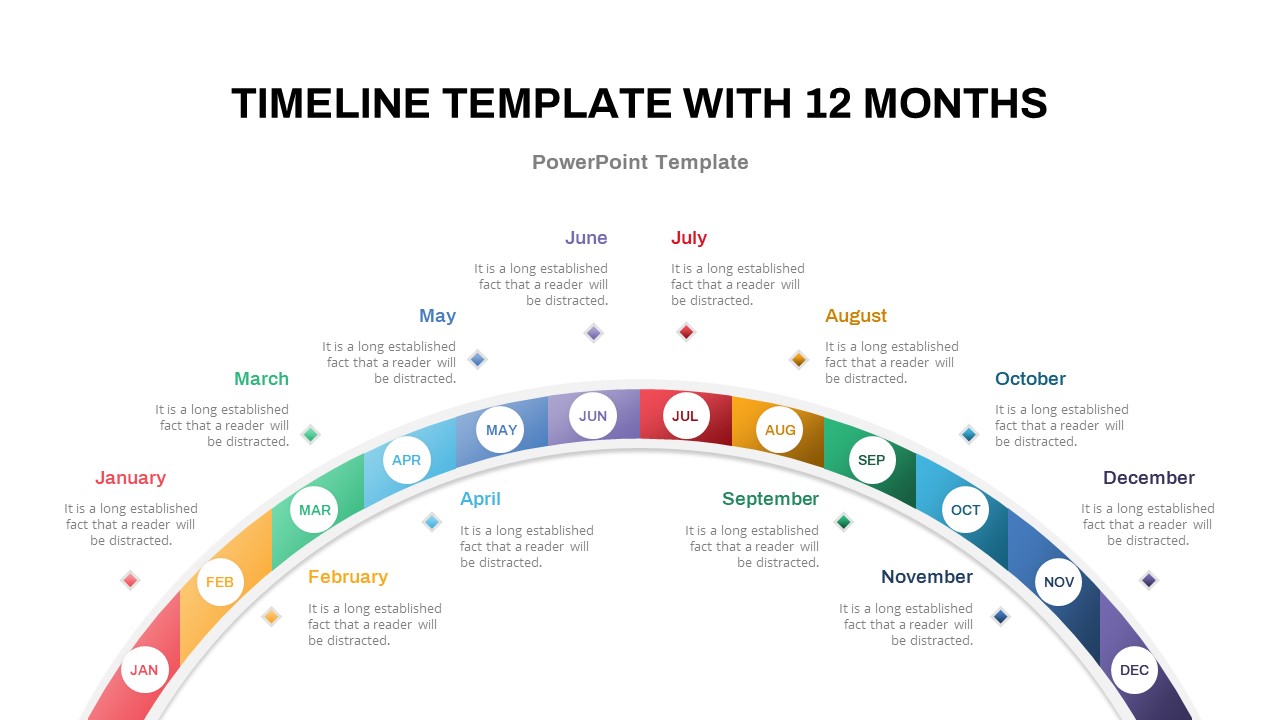
12-Month Semi-Circular Timeline Diagram Template for PowerPoint & Google Slides
Timeline
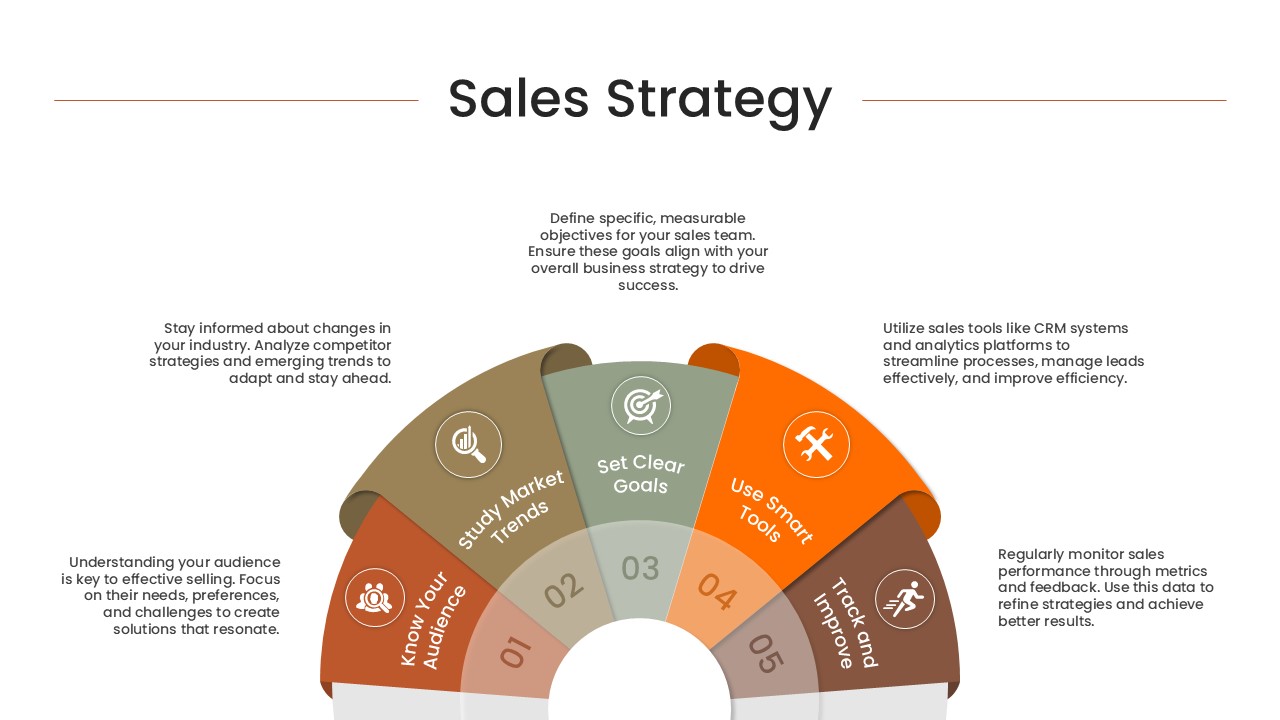
Semi-Circular Sales Strategy Roadmap Template for PowerPoint & Google Slides
Circular
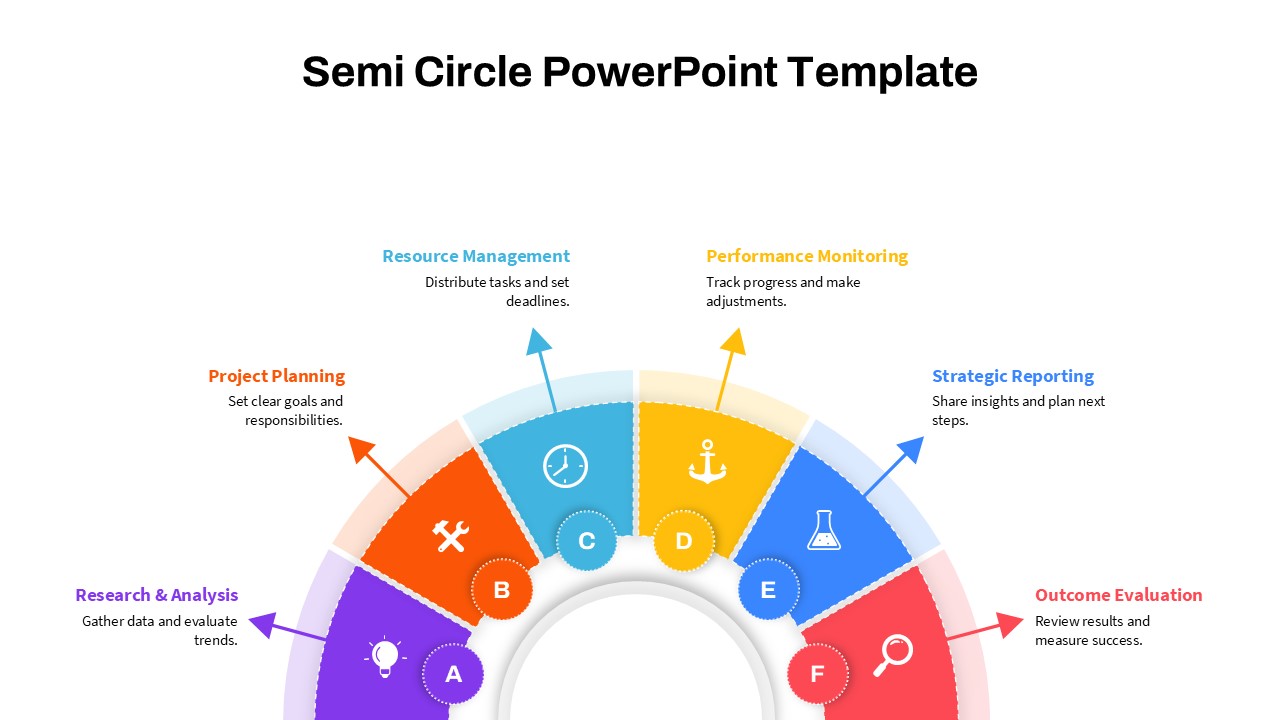
Modern Semi Circle Infographic Template for PowerPoint & Google Slides
Circular
Q-Learning Process Flow Diagram Template for PowerPoint & Google Slides
Process
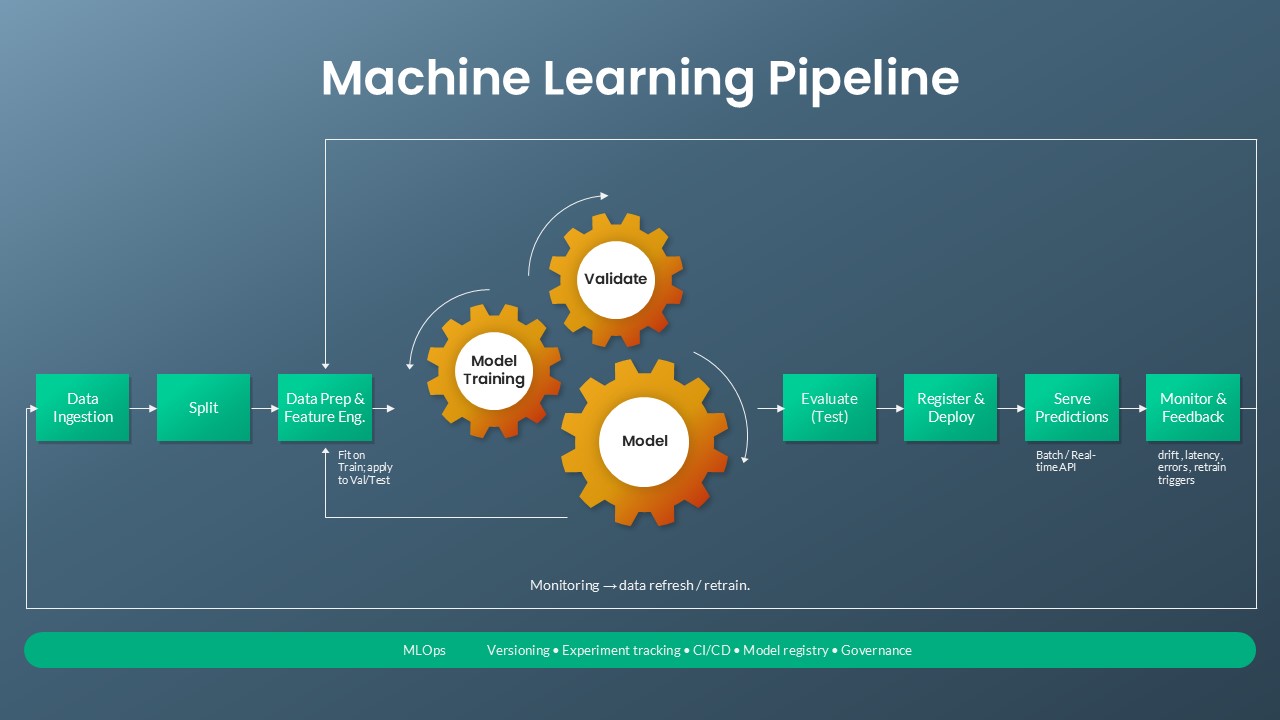
Machine Learning Pipeline & MLOps Flow Template for PowerPoint & Google Slides
Machine Learning

4MAT Learning Cycle Circular Diagram Template for PowerPoint & Google Slides
Circular
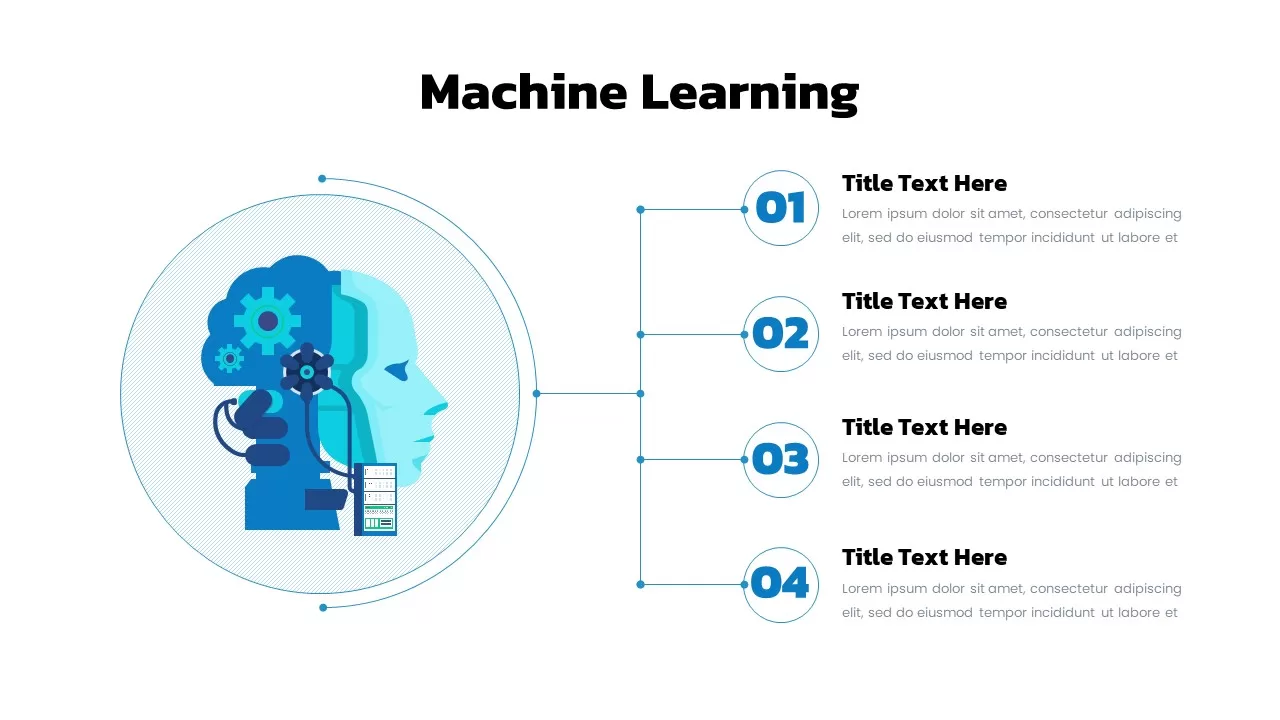
Machine Learning Diagram Template for PowerPoint & Google Slides
Process
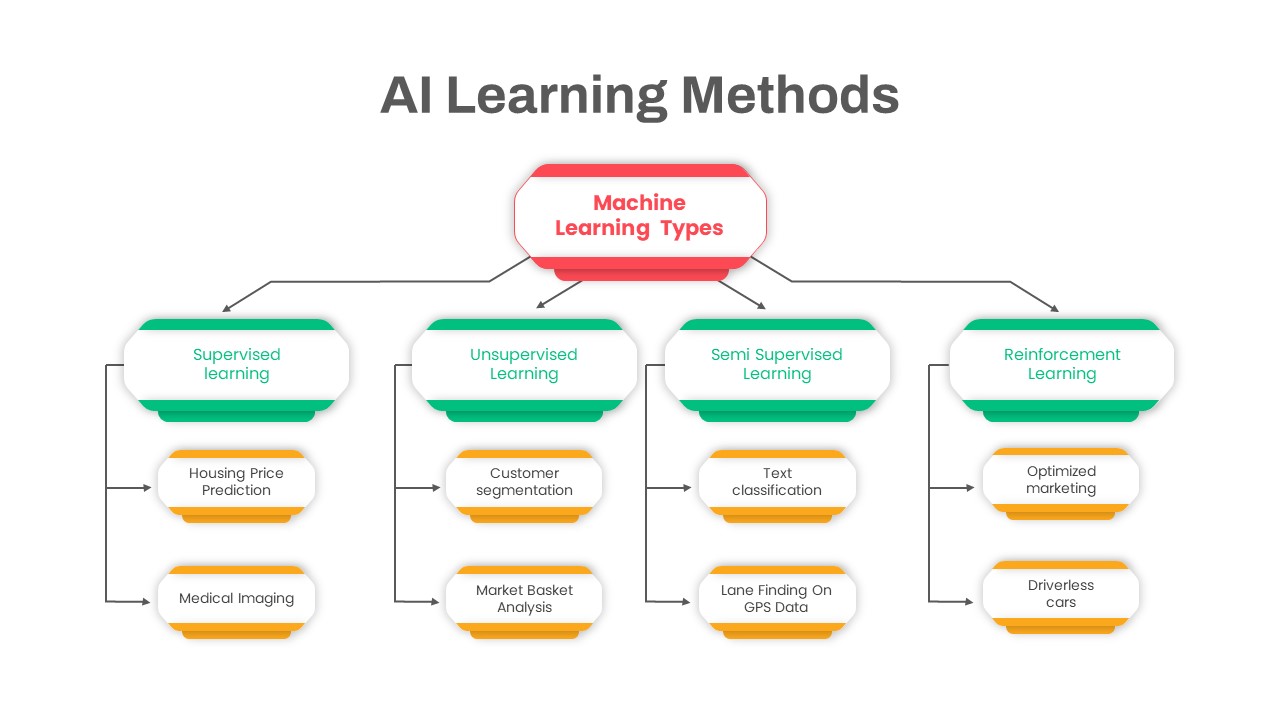
AI Learning Methods Flowchart Diagram Template for PowerPoint & Google Slides
Flow Charts
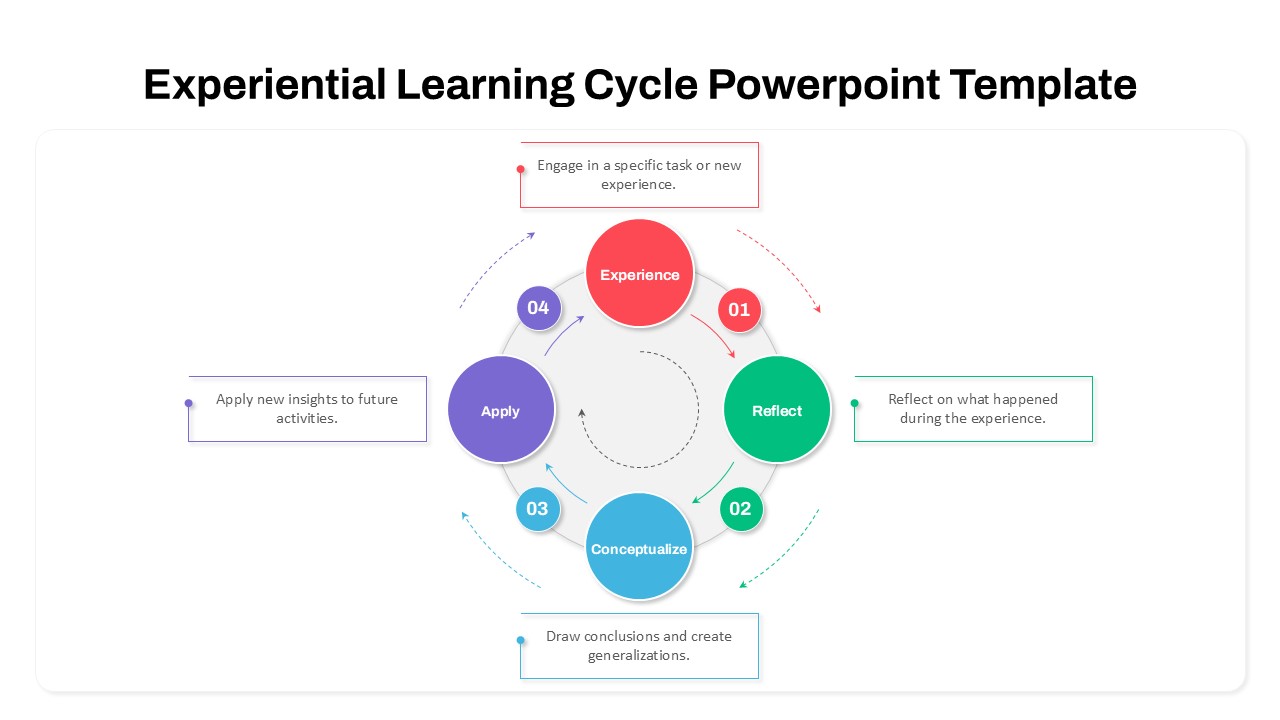
Experiential Learning Cycle Diagram Template for PowerPoint & Google Slides
Circular
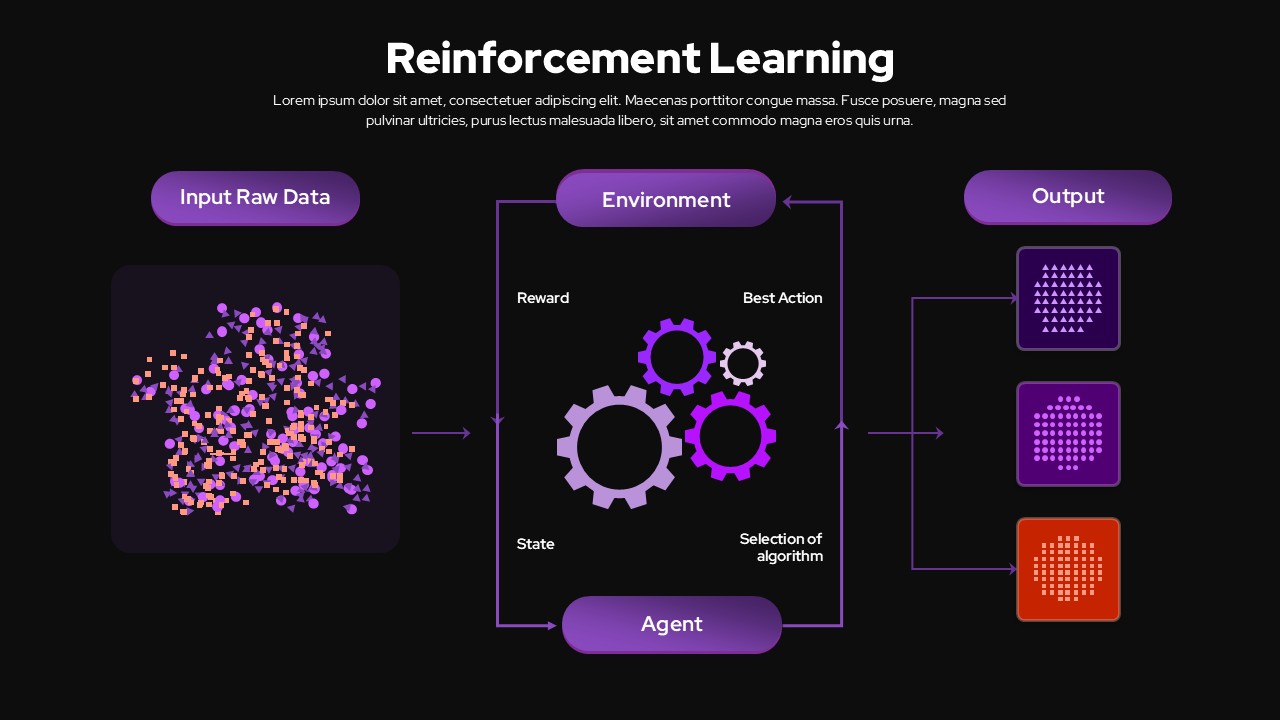
Reinforcement Learning Diagram Dark Template for PowerPoint & Google Slides
Machine Learning
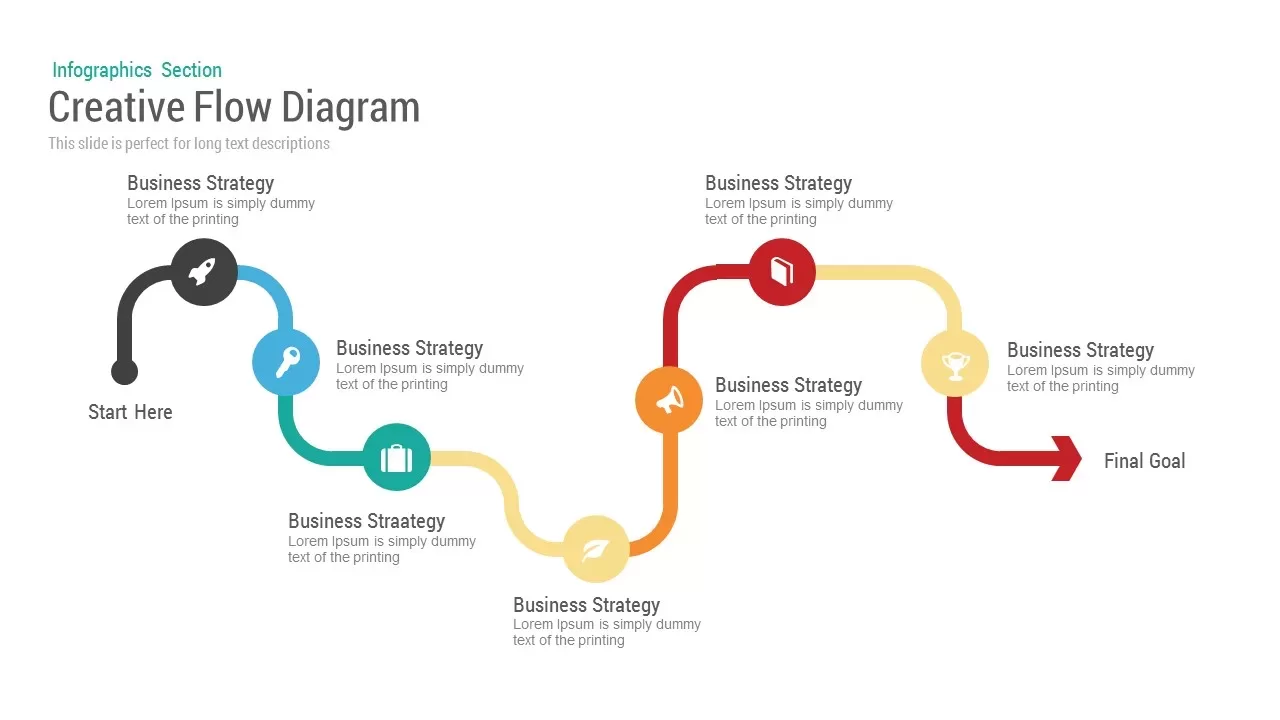
Creative flow diagram template for PowerPoint & Google Slides
Process
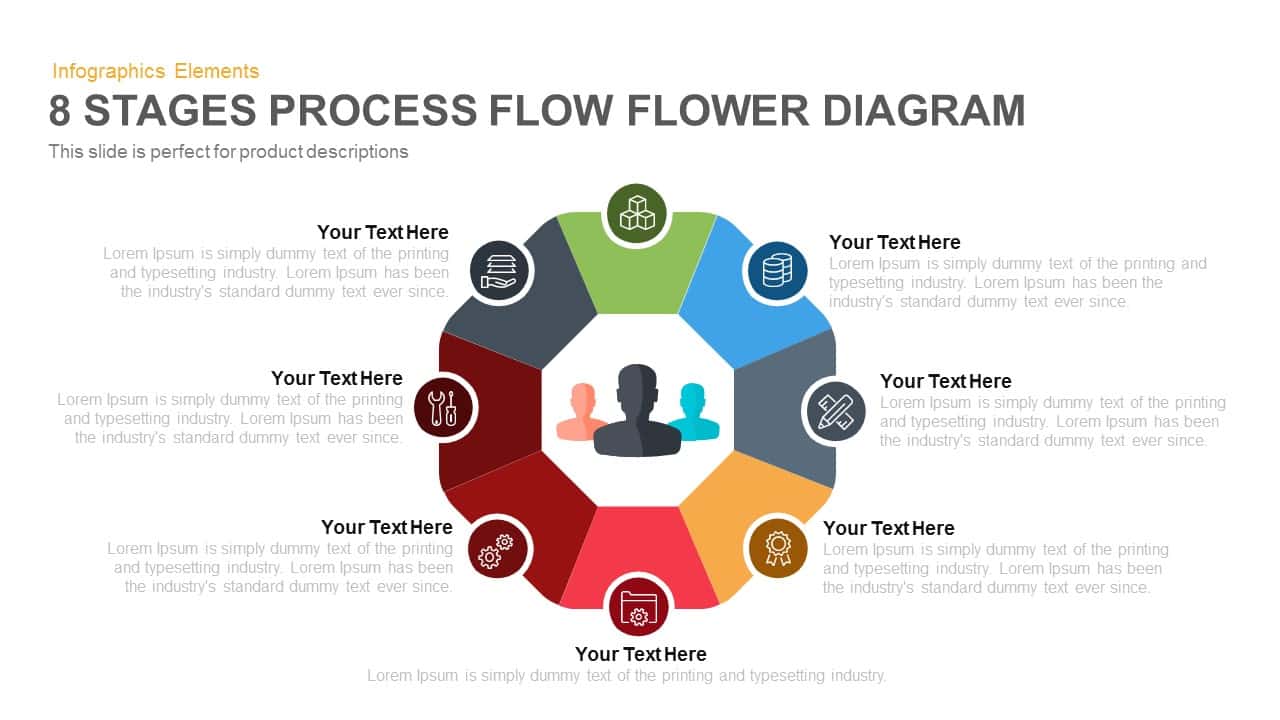
8-Stage Process Flow Flower Diagram Template for PowerPoint & Google Slides
Infographics
Circular Flow Diagram Template for PowerPoint & Google Slides
Infographics
4 Section Pipe Diagram Process Flow Template for PowerPoint & Google Slides
Process
Dynamic Shield Process Flow Diagram template for PowerPoint & Google Slides
Process
Six Hexagon Stages Process Flow Diagram Template for PowerPoint & Google Slides
Process
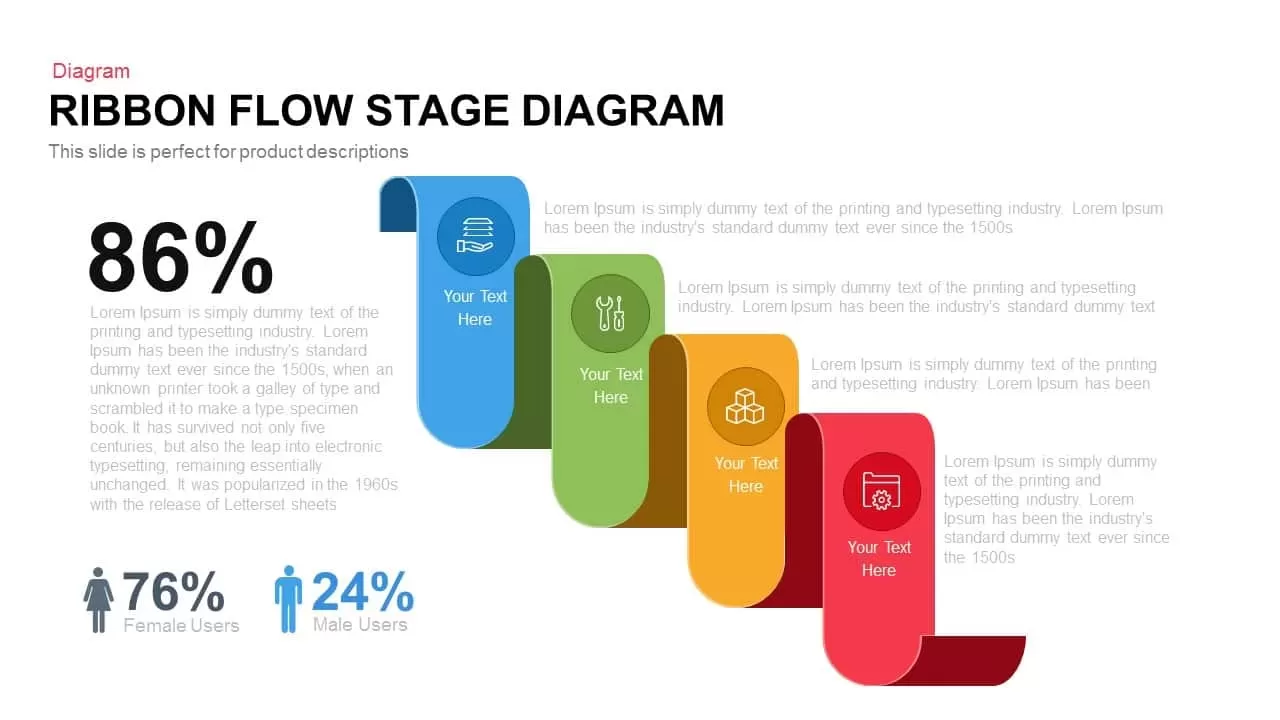
Ribbon Flow Diagram template for PowerPoint & Google Slides
Process
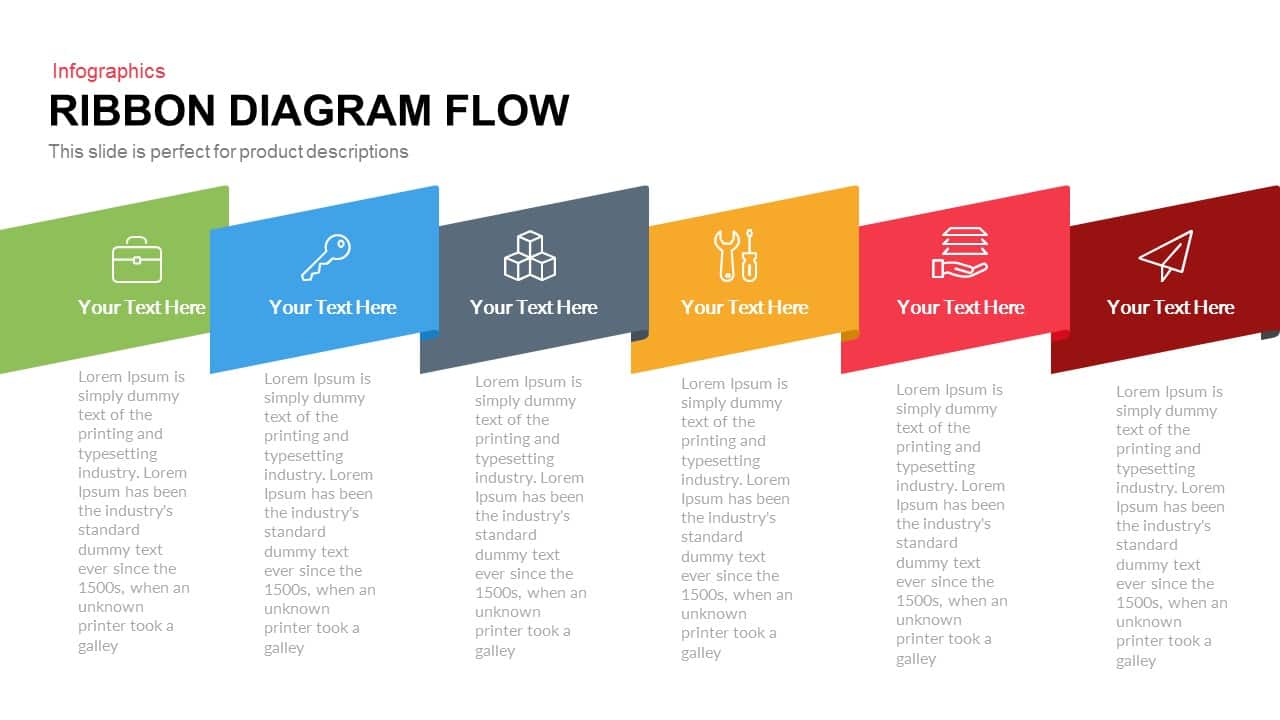
Ribbon Diagram Flow template for PowerPoint & Google Slides
Process
Process Flow Diagram template for PowerPoint & Google Slides
Infographics

15-Step Process Flow Diagram Template for PowerPoint & Google Slides
Process
3D Shape Linear Process Flow Diagram Template for PowerPoint & Google Slides
Process

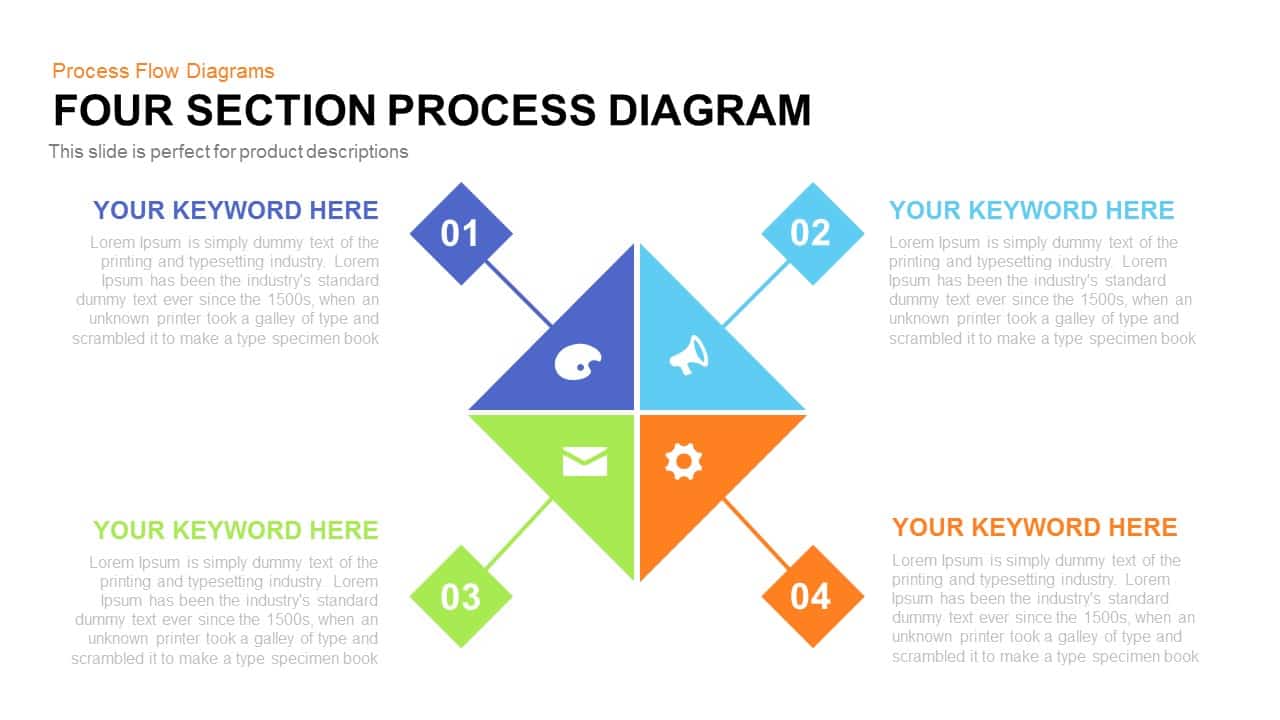
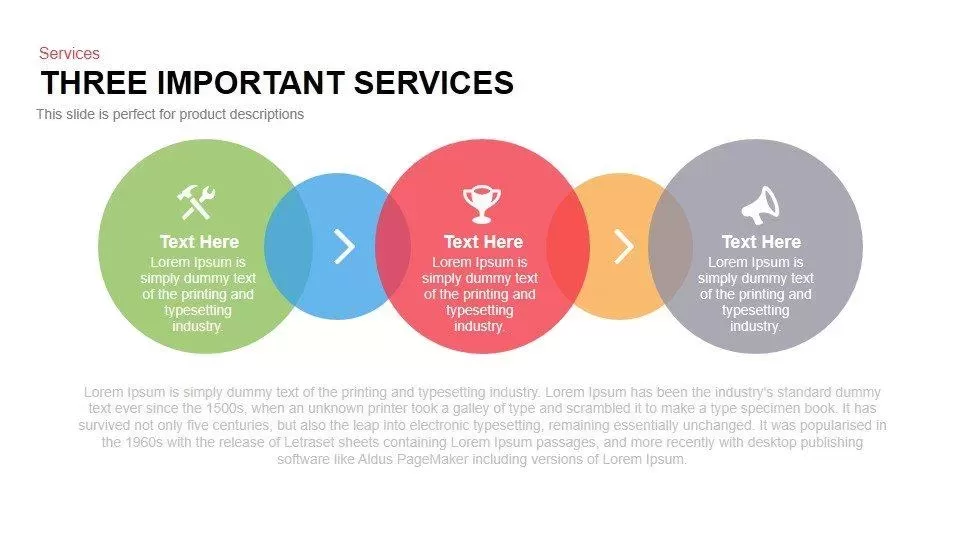
Three Important Services Flow Diagram Template for PowerPoint & Google Slides
Process
Linear Process Flow Circles Diagram Template for PowerPoint & Google Slides
Process
Six-Stage Zig-Zag Process Flow Diagram Template for PowerPoint & Google Slides
Process
Vertical Business Process Flow Diagram Template for PowerPoint & Google Slides
Process
Six-Sided Shutter Diagram Process Flow Template for PowerPoint & Google Slides
Process
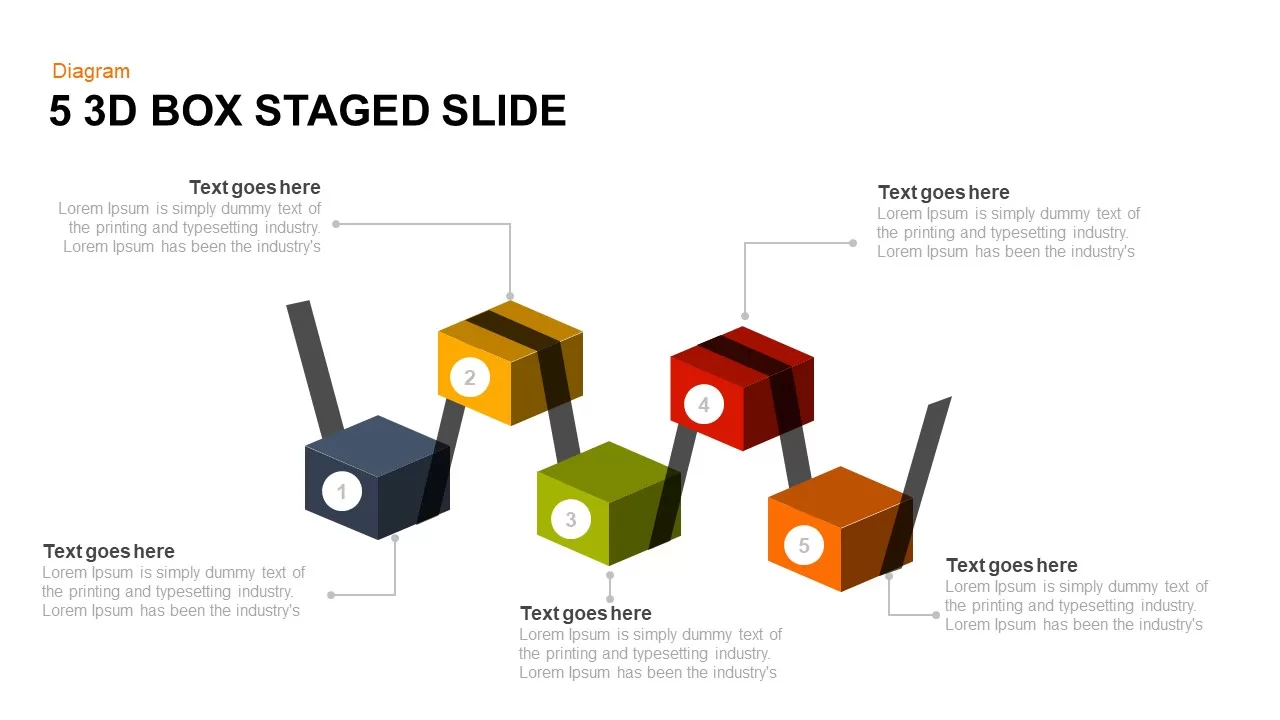
Five-Stage 3D Box Flow Diagram Template for PowerPoint & Google Slides
Process
10 Stages Business Flow Process Diagram template for PowerPoint & Google Slides
Business
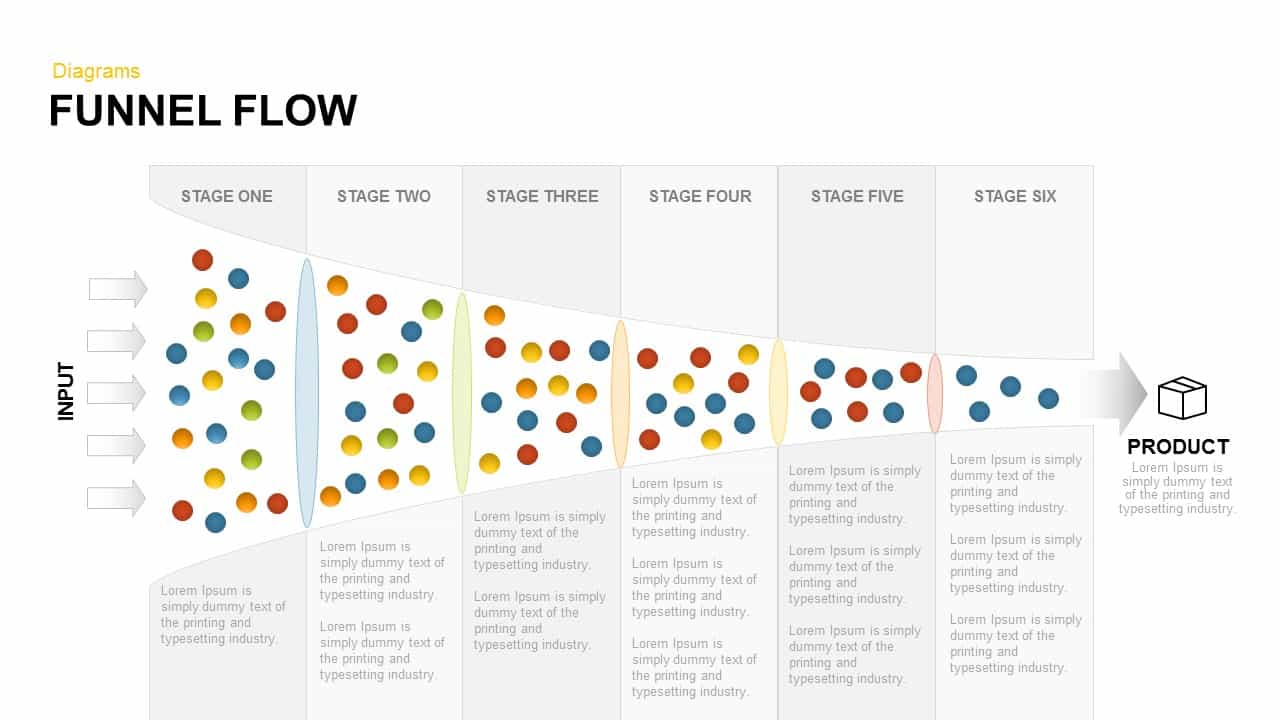
Funnel Flow Diagram template for PowerPoint & Google Slides
Funnel
Gear Flow Diagram template for PowerPoint & Google Slides
Process

Eight-Stage Radial Process Flow Diagram Template for PowerPoint & Google Slides
Process
Four-Plus Process Flow Diagram Template for PowerPoint & Google Slides
Process
4 Step Revenue Growth Flow Diagram Template for PowerPoint & Google Slides
Process
Pipe Water Infographics Flow Diagram Template for PowerPoint & Google Slides
Process
Five Stage Linear Process Flow Diagram Template for PowerPoint & Google Slides
Process
Five-Stage Linear Process Flow Diagram Template for PowerPoint & Google Slides
Process
10-Point Gradient Agenda Flow Diagram Template for PowerPoint & Google Slides
Agenda
Five-Stage Agenda Flow Diagram Template for PowerPoint & Google Slides
Agenda
Six-Step Hexagon Process Flow Diagram Template for PowerPoint & Google Slides
Process
Five-Stage Circular Process Flow Diagram Template for PowerPoint & Google Slides
Circular
Five-Stage Circular Flow Diagram Template for PowerPoint & Google Slides
Circular
5-Stage Gear Process Flow Diagram Template for PowerPoint & Google Slides
Process
3D Seven-Stage Process Flow Diagram Template for PowerPoint & Google Slides
Process
Four-Stage Linear Process Flow Diagram Template for PowerPoint & Google Slides
Process
Four-Stage Circular Flow Diagram Template for PowerPoint & Google Slides
Circular
5-Stage Linear Process Flow Diagram Template for PowerPoint & Google Slides
Process
5 Stage Linear Process Flow Diagram Template for PowerPoint & Google Slides
Process
Five-Stage Process Flow Diagram Template for PowerPoint & Google Slides
Process
4 Stage Linear Process Flow Diagram Template for PowerPoint & Google Slides
Process
7 Stage Linear Process Flow Diagram Template for PowerPoint & Google Slides
Process
8 Step Circular Process Flow Diagram Template for PowerPoint & Google Slides
Process
4 Stage Linear Process Flow Diagram Template for PowerPoint & Google Slides
Process
6-Step Business Process Flow Diagram Template for PowerPoint & Google Slides
Process
6-Step Circular Process Flow Diagram Template for PowerPoint & Google Slides
Process
Six-Stage Circular Flow Diagram Template for PowerPoint & Google Slides
Circular
Five Stage Puzzle Flow Diagram Template for PowerPoint & Google Slides
Process
4-Stage Linear Process Flow Diagram Template for PowerPoint & Google Slides
Process
Financial Agreement Signing Flow Diagram Template for PowerPoint & Google Slides
Process
4-Step Linear Process Flow Diagram Template for PowerPoint & Google Slides
Process
Vertical Split Flow Chart Diagram Template for PowerPoint & Google Slides
Flow Charts
Business Process Management Flow Diagram Template for PowerPoint & Google Slides
Process
Colorful 8-Stage Droplet Process Flow Diagram Template for PowerPoint & Google Slides
Process
Flow Chart Diagram Template for PowerPoint & Google Slides
Flow Charts
Minimal Process Flow Diagram Infographic Template for PowerPoint & Google Slides
Process
Flow Chart Diagram template for PowerPoint & Google Slides
Flow Charts
Process Flow Diagram template for PowerPoint & Google Slides
Process
Free Circular Multi-Step Flow Chart Diagram Template for PowerPoint & Google Slides
Flow Charts
Free
Curved Arrow Process Flow Diagram Template for PowerPoint & Google Slides
Process
Curved Arrow Process Flow Diagram Template for PowerPoint & Google Slides
Arrow
Curved Arrow Flow Diagram template for PowerPoint & Google Slides
Business
3D Conveyor Belt Process Flow Diagram Template for PowerPoint & Google Slides
Process
E-Waste Management Process Flow Diagram Template for PowerPoint & Google Slides
Process
Comprehensive Process Flow Diagram Template for PowerPoint & Google Slides
Process
Animated Gears Process Flow Diagram Template for PowerPoint & Google Slides
Process
Advanced Data Flow Diagram Pack Template for PowerPoint & Google Slides
Flow Charts
Capital Investments Process Flow Diagram Template for PowerPoint & Google Slides
Process
Order to Cash Process Flow Diagram Template for PowerPoint & Google Slides
Process
5D Digital Marketing Flow Diagram Template for PowerPoint & Google Slides
Digital Marketing
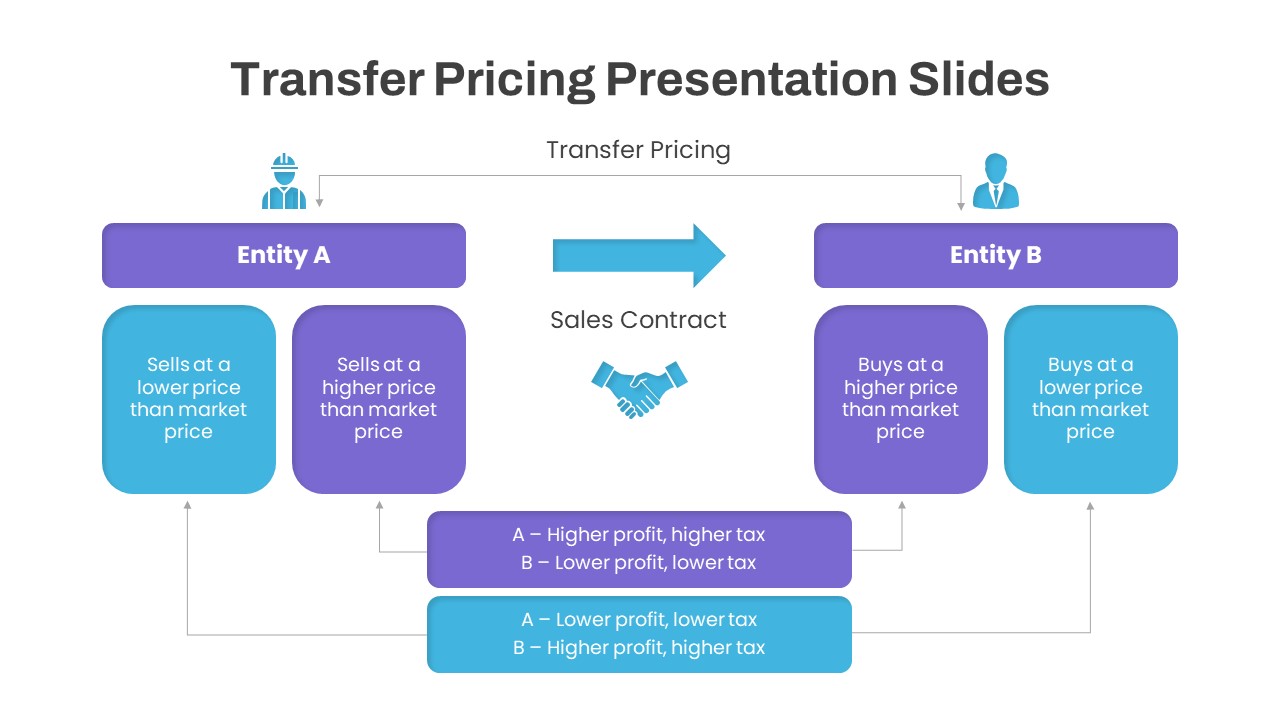
Dynamic Transfer Pricing Flow Diagram Template for PowerPoint & Google Slides
Finance
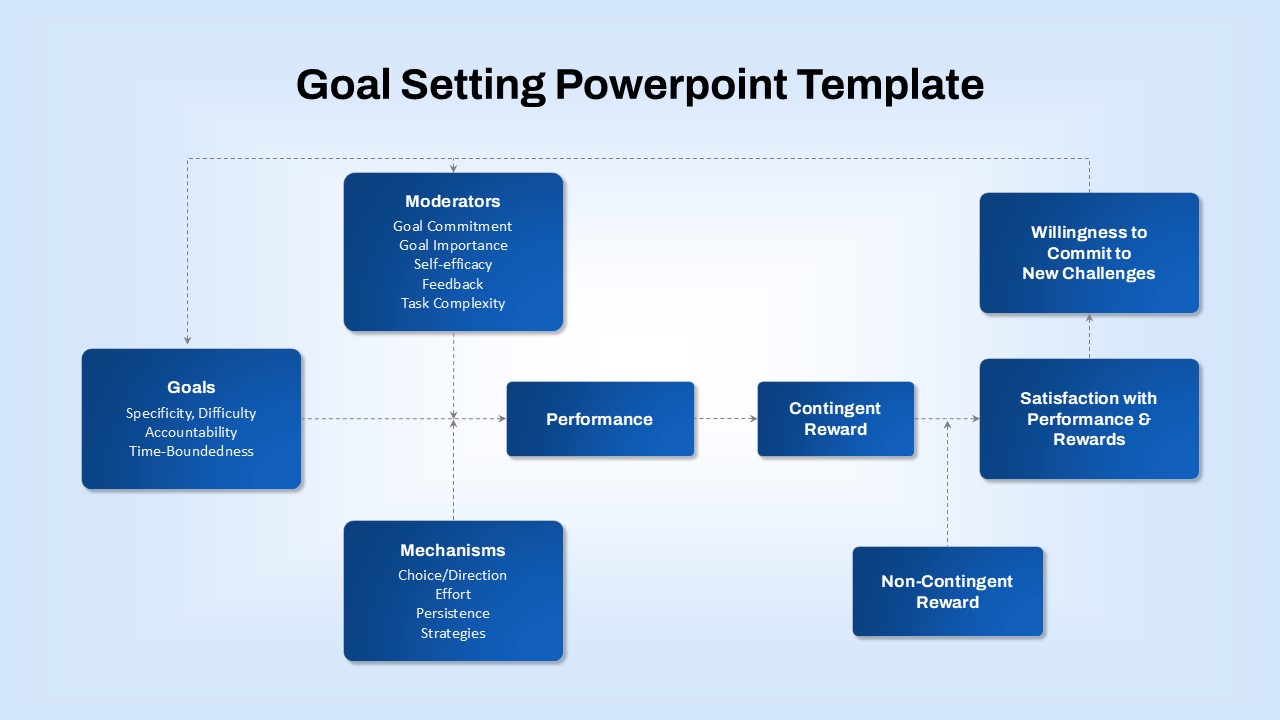
Goal-Setting Process Flow Diagram Template for PowerPoint & Google Slides
Goals
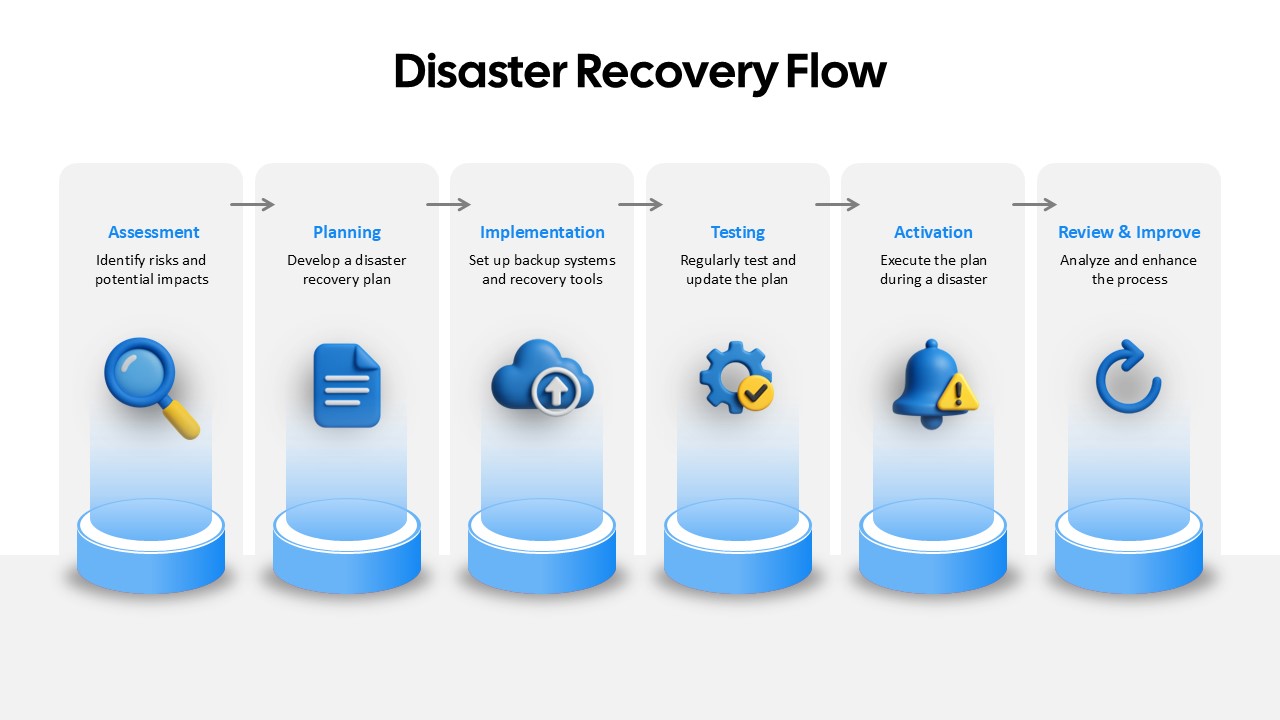
Disaster Recovery Flow Diagram Template for PowerPoint & Google Slides
Process
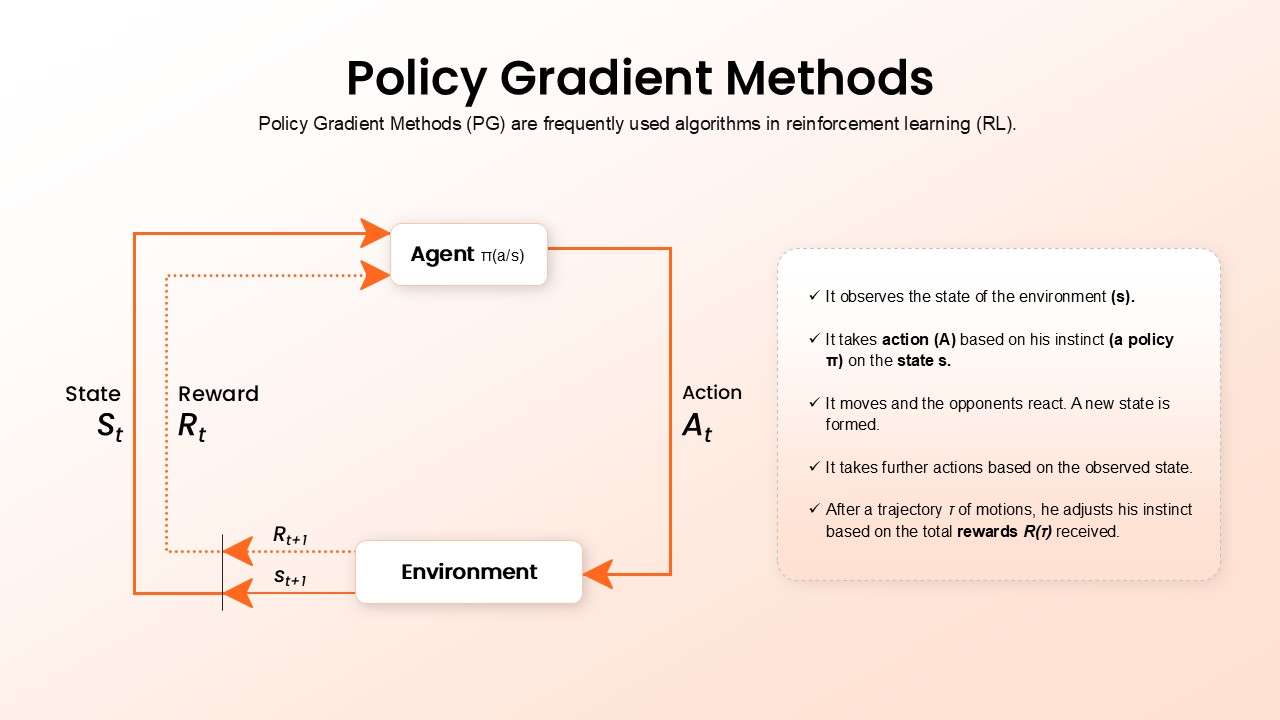
Policy Gradient Methods Flow Diagram Template for PowerPoint & Google Slides
AI
Resume Screening Process Flow Diagram Template for PowerPoint & Google Slides
Process
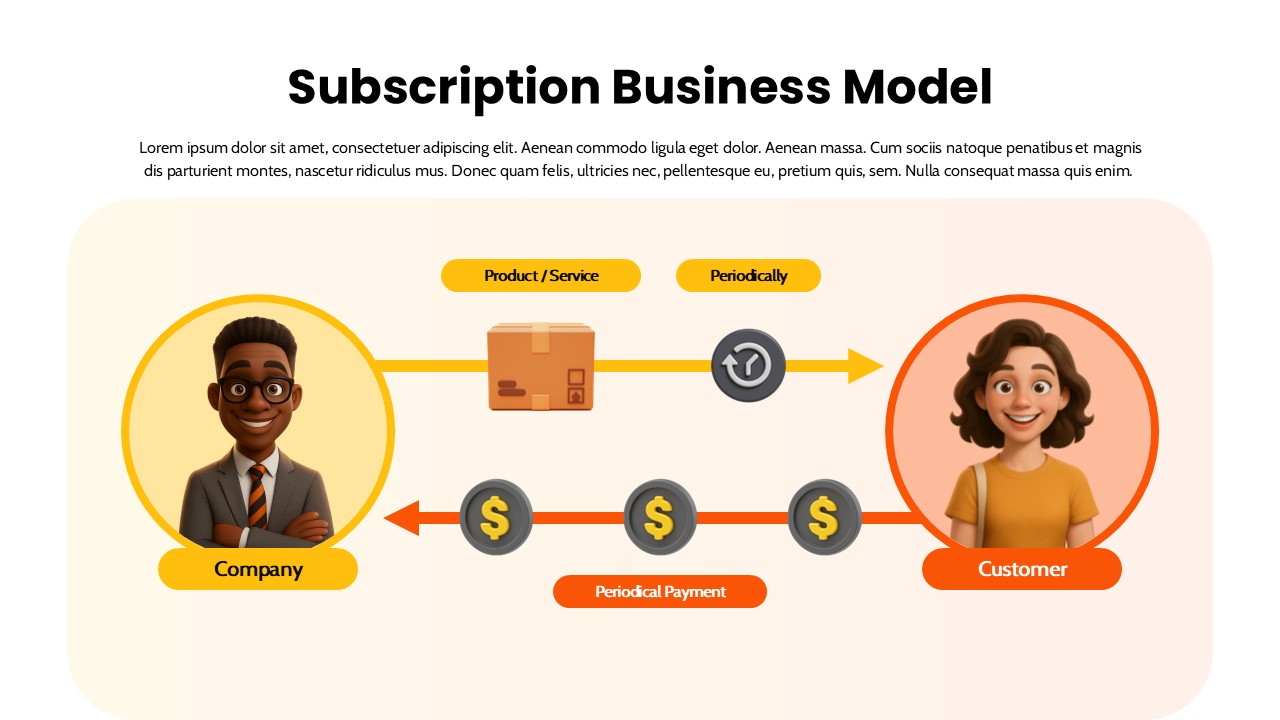
Subscription Business Model Flow Diagram Template for PowerPoint & Google Slides
Business Models
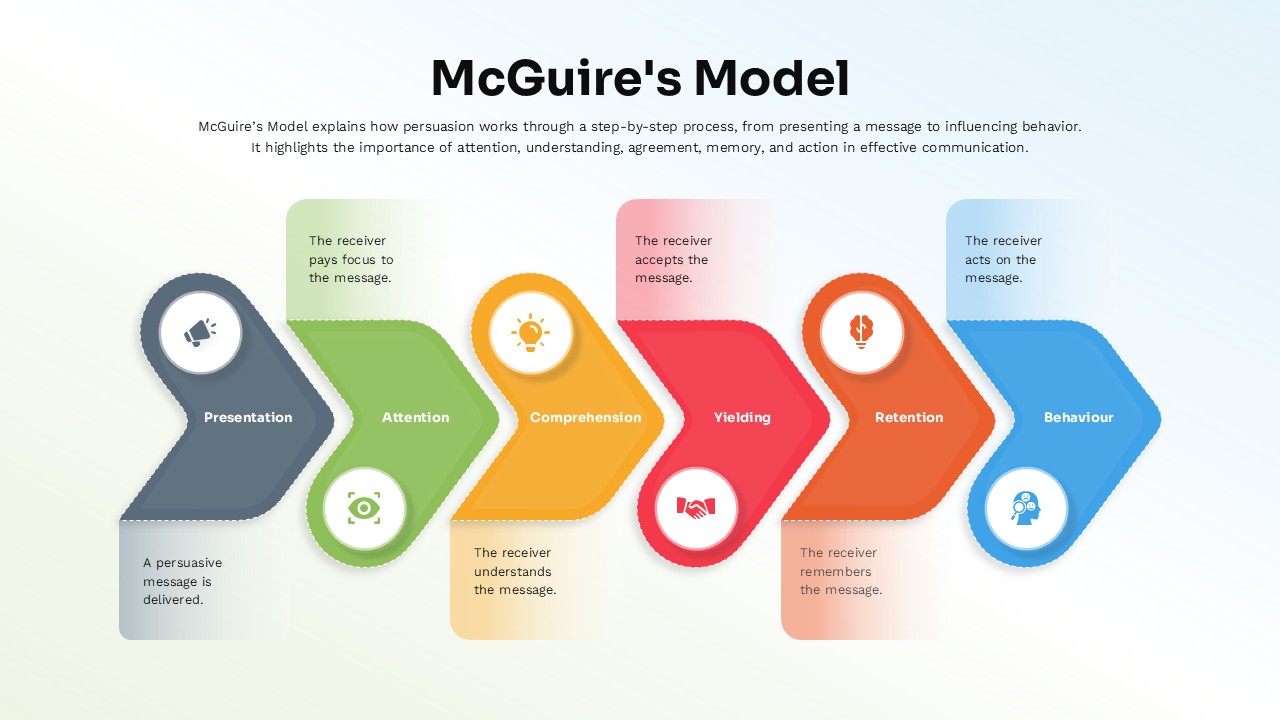
McGuire’s Persuasion Process Flow Diagram Template for PowerPoint & Google Slides
Marketing
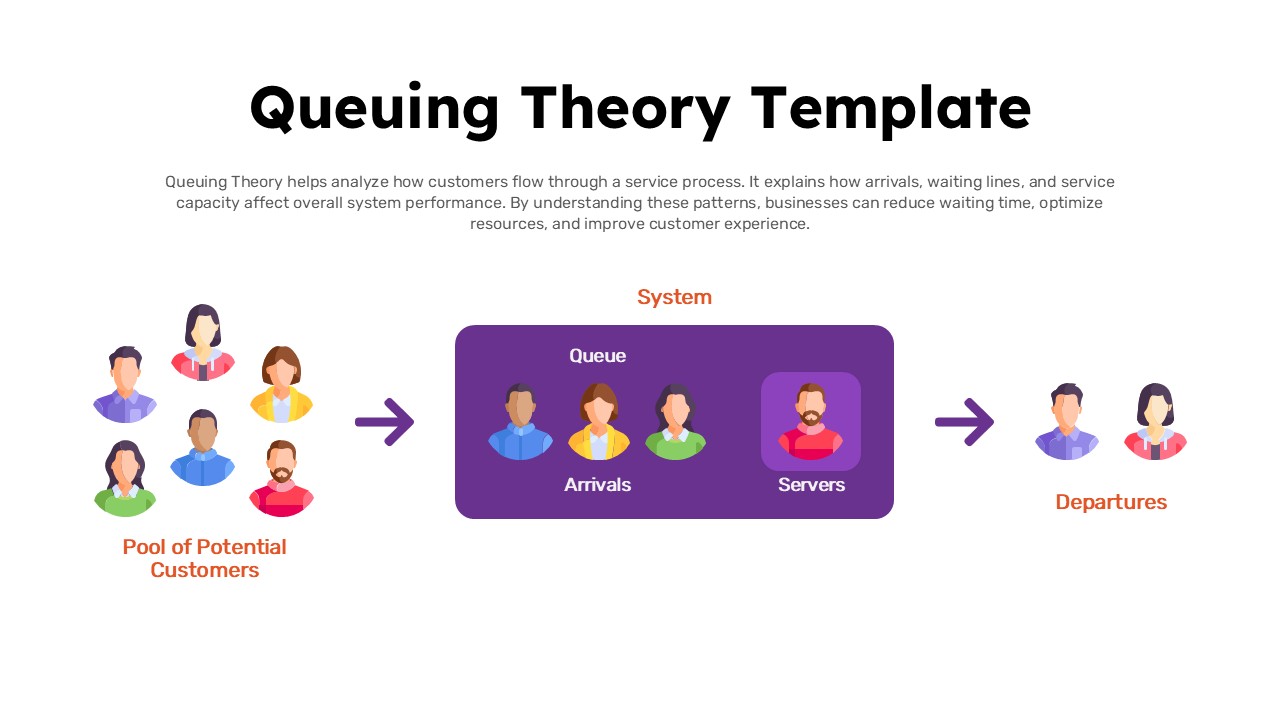
Queuing Theory System Flow Diagram Template for PowerPoint & Google Slides
Process
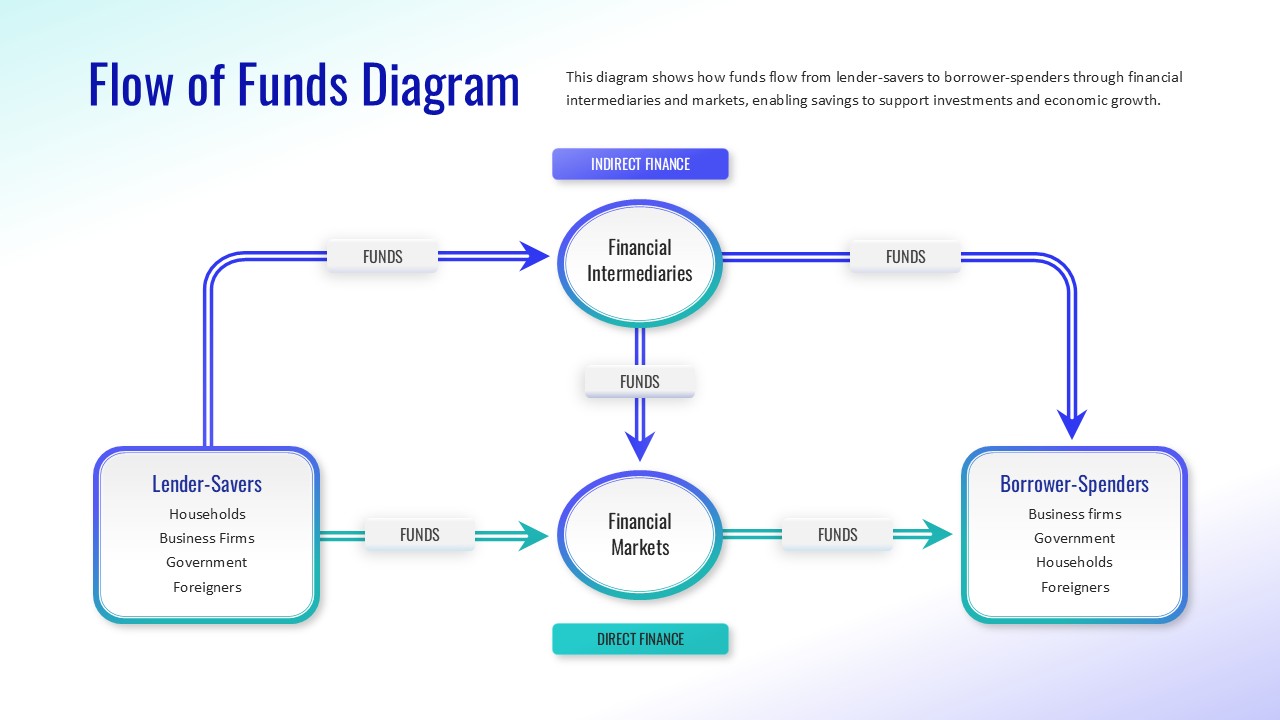
Flow of Funds Financial System Diagram Template for PowerPoint & Google Slides
Finance
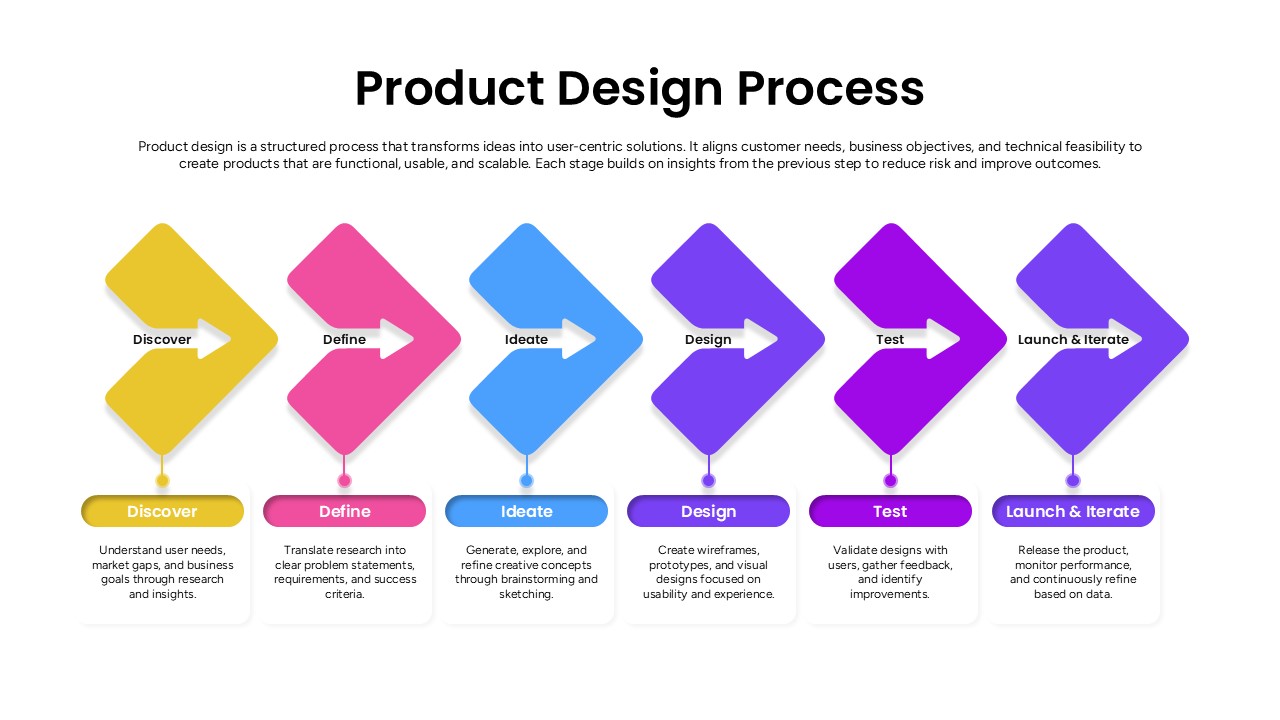
Product Design Process Flow Diagram Template for PowerPoint & Google Slides
Process
Arrow Circle Flow Diagram for PowerPoint & Google Slides
Infographics
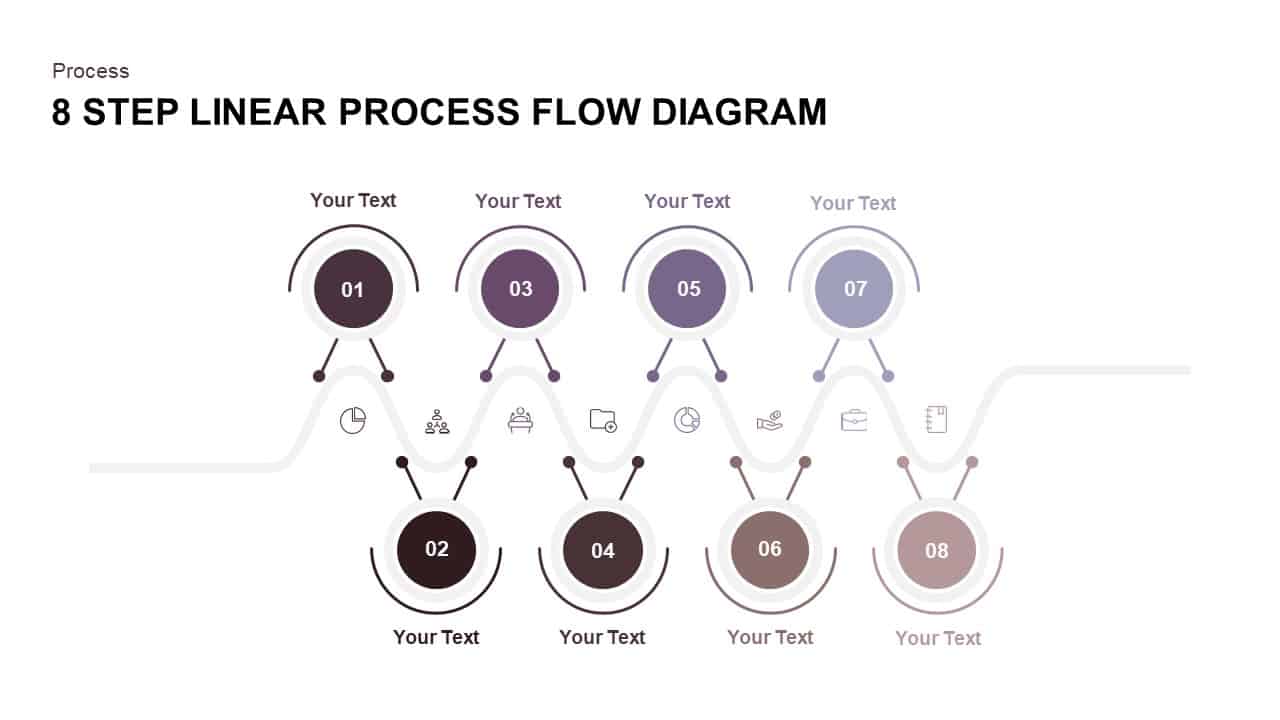
8 Step Linear Process Flow Diagram for PowerPoint & Google Slides
Process
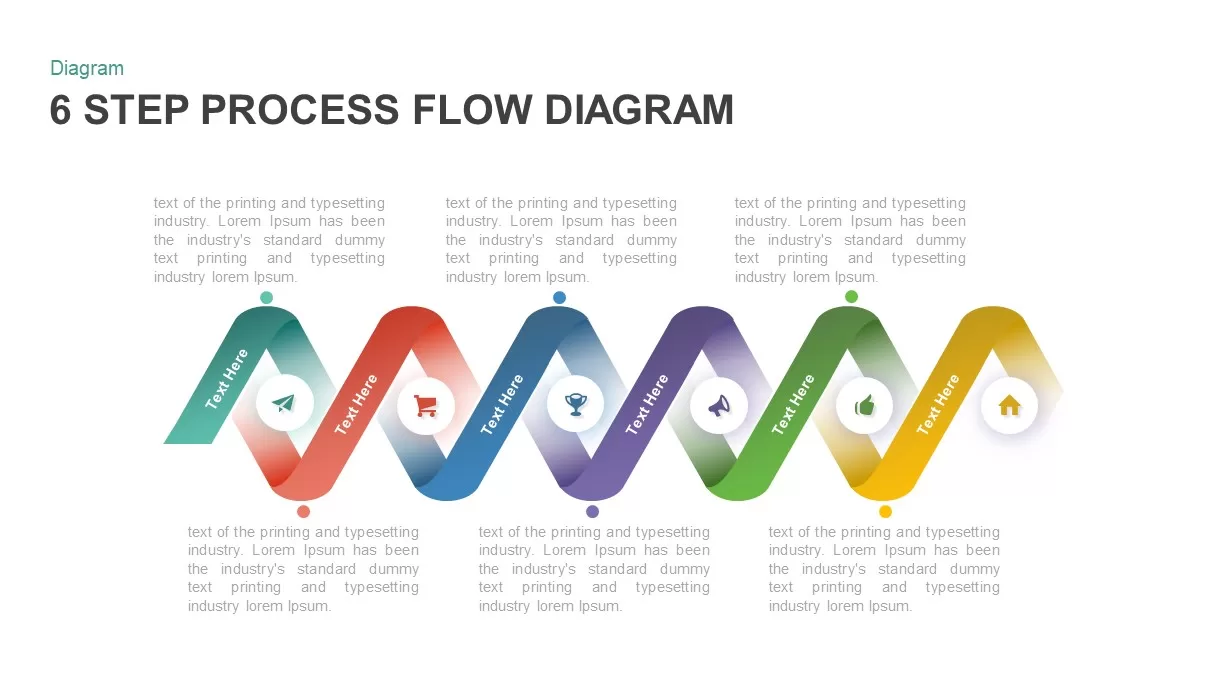
6 Step Process Flow Diagram for PowerPoint & Google Slides
Charts