Weighing Scale Metaphor Powerpoint and Keynote Template


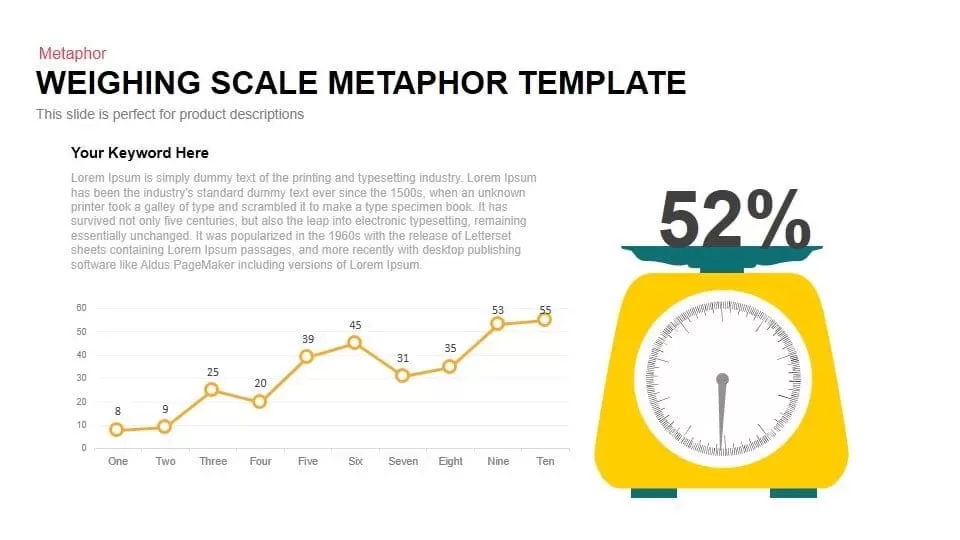
This slide presents a compelling weighing scale metaphor to visualize quantitative comparisons and balance product metrics. On the right, a stylized weighing scale icon in vibrant yellow and teal displays a prominent percentage label above a fully customizable dial. To the left, a clean line chart plots ten data points—ranging from 8 to 55—accompanied by markers and a smooth golden-yellow trend line. The layout features a bold headline, subtle subheading, and placeholder text block for keywords or brief descriptions. The flat-design aesthetic, crisp typography, and well-defined color accents ensure visual clarity and professional appeal. Ideal for highlighting performance differences, the intuitive arrangement guides audience focus from numeric trends to metaphorical evaluation in seconds.
Who is it for
Product managers, marketing strategists, sales leaders, and business analysts will find this slide invaluable for presenting balanced metric comparisons and value assessments. Consultants and startup founders can articulate key performance indicators (KPIs) with intuitive visual metaphors. Trainers and educators can leverage the design to explain trade-offs in case studies or deliver interactive workshop content. The editable master layout supports quick customization of data labels, color schemes, and icon sizes to match any corporate branding guidelines.
Other Uses
Beyond product comparisons, this template adapts seamlessly to cost-benefit analyses, budget allocation reviews, and risk assessment presentations. Use it for KPI dashboard enhancements, quarterly performance reports, and competitive benchmarking sessions. It also serves as an engaging visual aid for training modules on decision-making frameworks and workshop activities that require clear, metaphor-driven storytelling. Whether in executive briefings or investor pitches, this versatile metaphor slide drives alignment and fosters data-driven discussions.
Login to download this file


