Q1 Business Review Dashboard PowerPoint Template
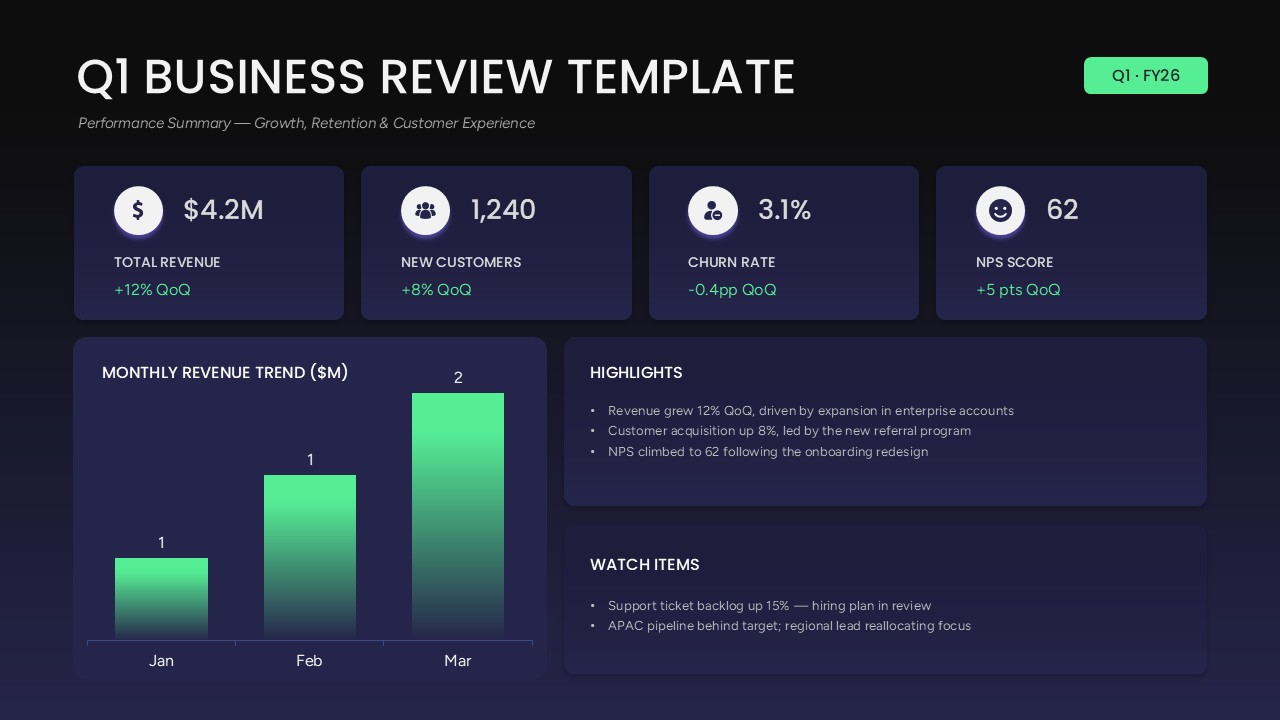
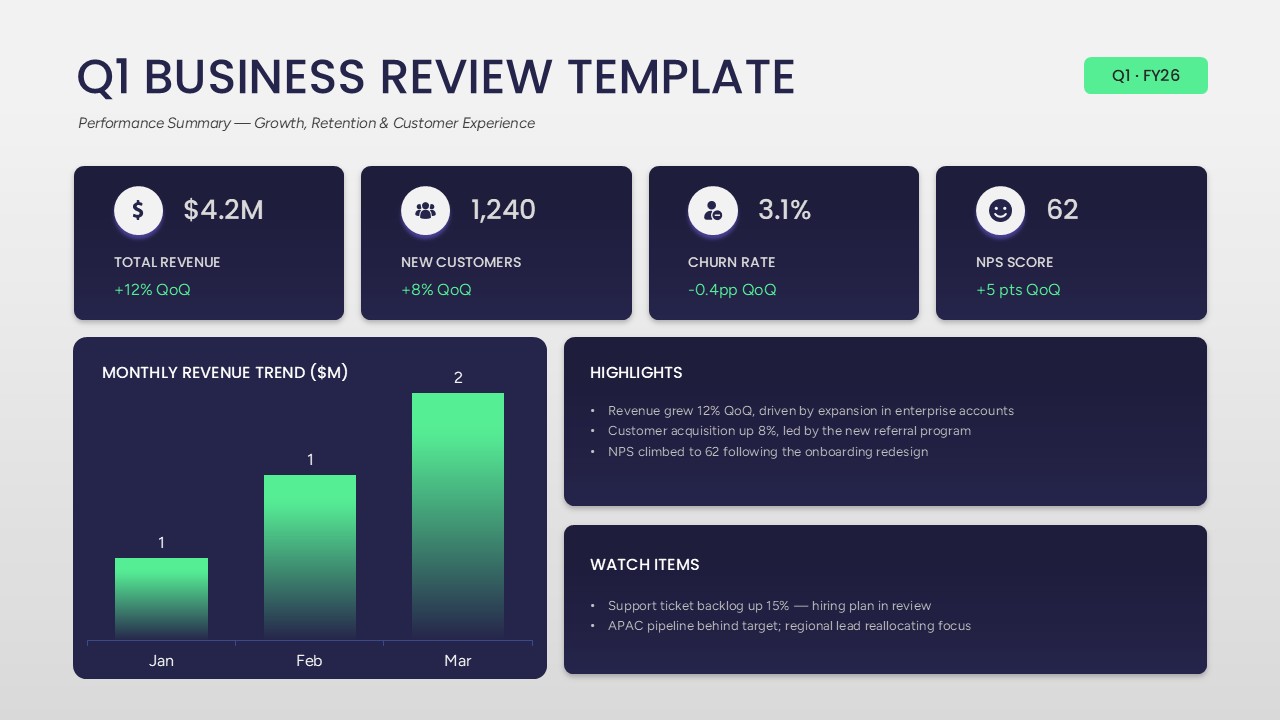
A Q1 business review is the quarterly report a company puts in front of leadership, investors, or the broader team to show exactly how revenue, customer growth, churn, and satisfaction moved across the first three months of the fiscal year. This Q1 Business Review PowerPoint Template turns that report into a single dashboard slide, built for finance leads, operations managers, and account teams who need a quarterly summary that reads clearly in a boardroom or an all-hands presentation without flipping through a dozen disconnected charts.
Four metric cards anchor the top of the slide, Total Revenue, New Customers, Churn Rate, and NPS Score, each showing a quarter-over-quarter change in green so movement is visible at a glance. A monthly revenue bar chart runs January through March underneath, sitting next to two text panels: Highlights, which calls out wins like enterprise account growth and a stronger NPS score, and Watch Items, which flags open risks such as a growing support backlog or a lagging regional pipeline. Pairing wins with open risks on the same slide is what separates a real business review from a highlights-only recap, and it’s the structure this PowerPoint presentation is built around.
Every piece is a native, editable object once opened in PowerPoint. The bar chart pulls from a linked data table, so swapping in April through June figures for the next quarterly review takes a few clicks instead of a chart rebuild. Metric cards, bullet panels, and the quarter badge in the corner are all separate text boxes that hold up cleanly whether the file stays in PowerPoint or gets uploaded into Google Slides for teams running their review process there. As a PPT template, it fits board decks, investor updates, all-hands meetings, and internal leadership reviews equally well, anywhere a quarter needs to be summarized honestly in one screen instead of buried across a spreadsheet. Download the Q1 Business Review PowerPoint Template, drop in real numbers, and the deck is ready to present.
Frequently Asked Questions
Can I use this template for Q2, Q3, or Q4 reviews as well?
Does this template work in both PowerPoint and Google Slides?
Login to download this file

Item ID
SB06276Designed By
Naseeba Sithara


Related Templates

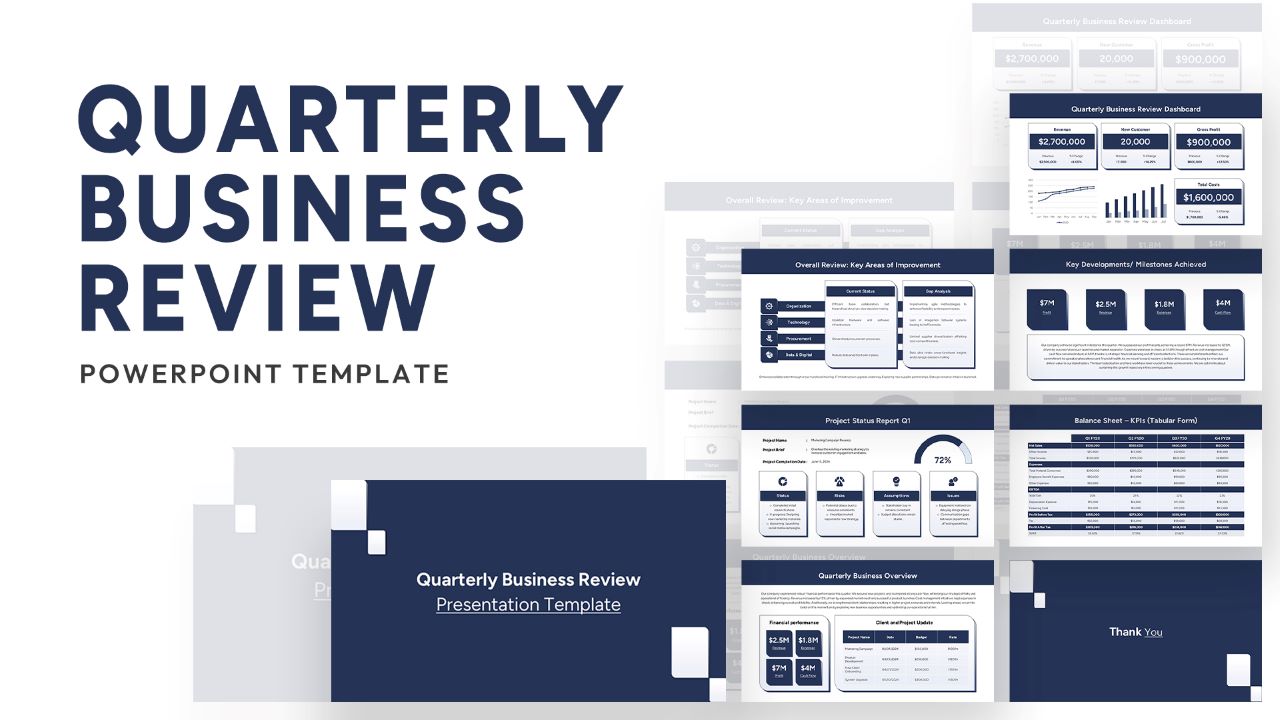
Quarterly Business Review Dashboard Template for PowerPoint & Google Slides
Pitch Deck
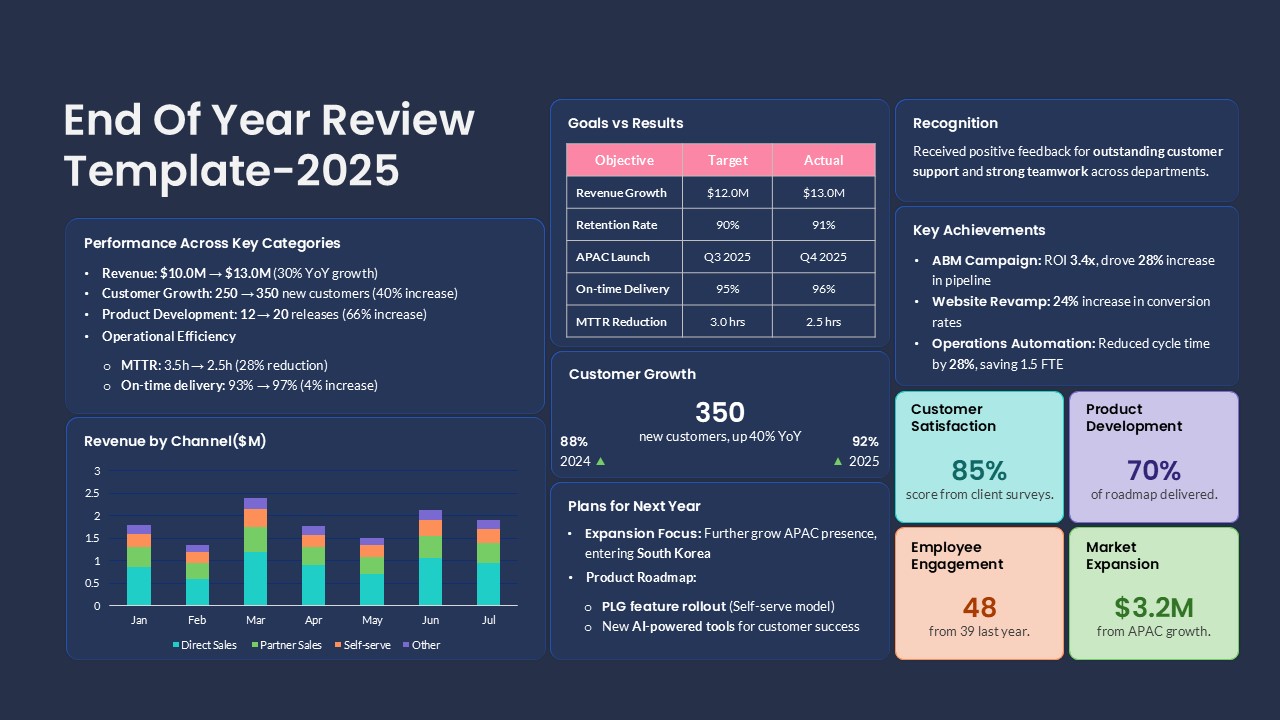
End of Year Review Dashboard Template for PPT & Google Slides
Business Report
Business Review Deck with Market Updates Template for PowerPoint & Google Slides
Company Profile
Free Quarterly Business Review PowerPoint Template & Google Slides
Business
Free
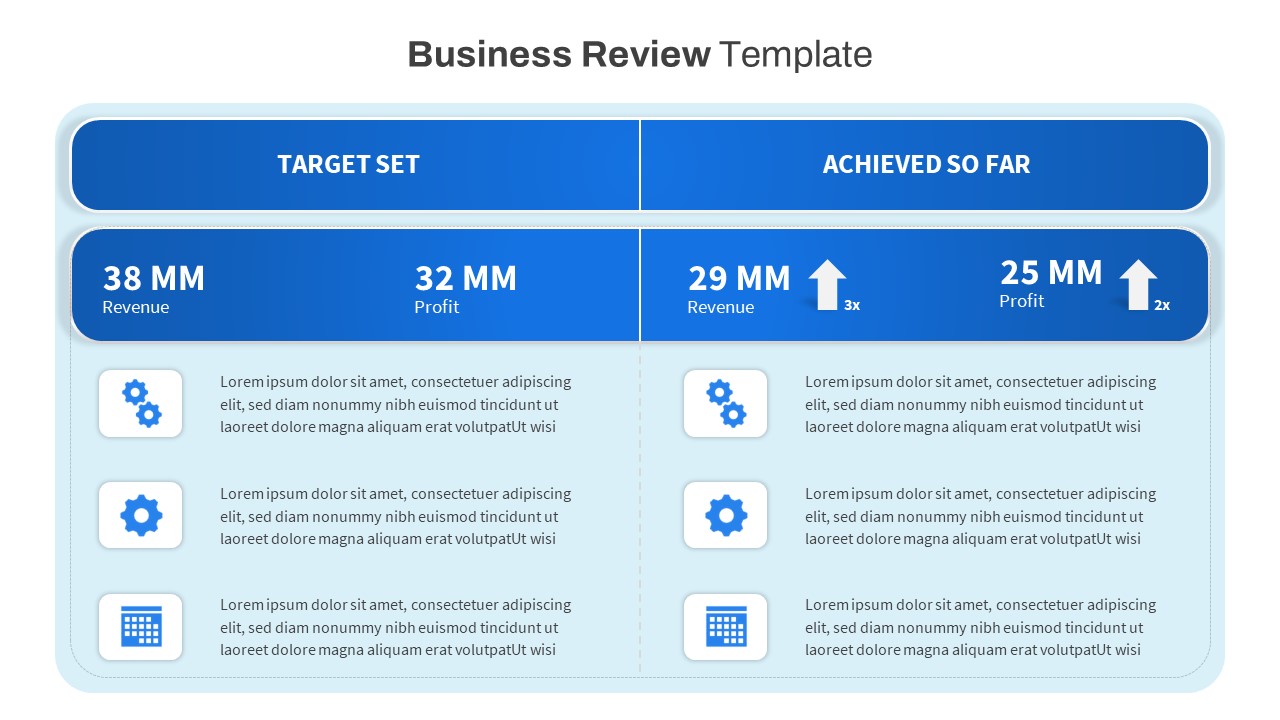
Free Business Review PowerPoint Template
Business Report
Free
Monthly Business Review PowerPoint Template
Business Report
Annual Business Review Timeline Template for PowerPoint & Google Slides
Timeline
Business Intelligence Dashboard Presentation Template
Dashboard
Financial Review Template for PowerPoint
Finance
Four Section Review PowerPoint Template and Google Slides
Agenda
Performance Review Process Management Cycle template for PowerPoint & Google Slides
Employee Performance
Financial Planning Process With Review and Monitor Template for PowerPoint
Process
Audit Sales Review Presentation Template for PowerPoint & Google Slides
Decks

Free Book Review PowerPoint Template
Company Profile
Free
Strategic Pipeline Review Process PowerPoint Template
Business Strategy
Monthly Sales Review PowerPoint Template Free
Charts
Quarterly Sales Review PowerPoint Template
Bar/Column
Performance Review PowerPoint template
Employee Performance
Free Monthly Sales Review Template for PowerPoint & Google Slides
Business Report
Free
Sprint Review Meeting Agenda Template
Agenda