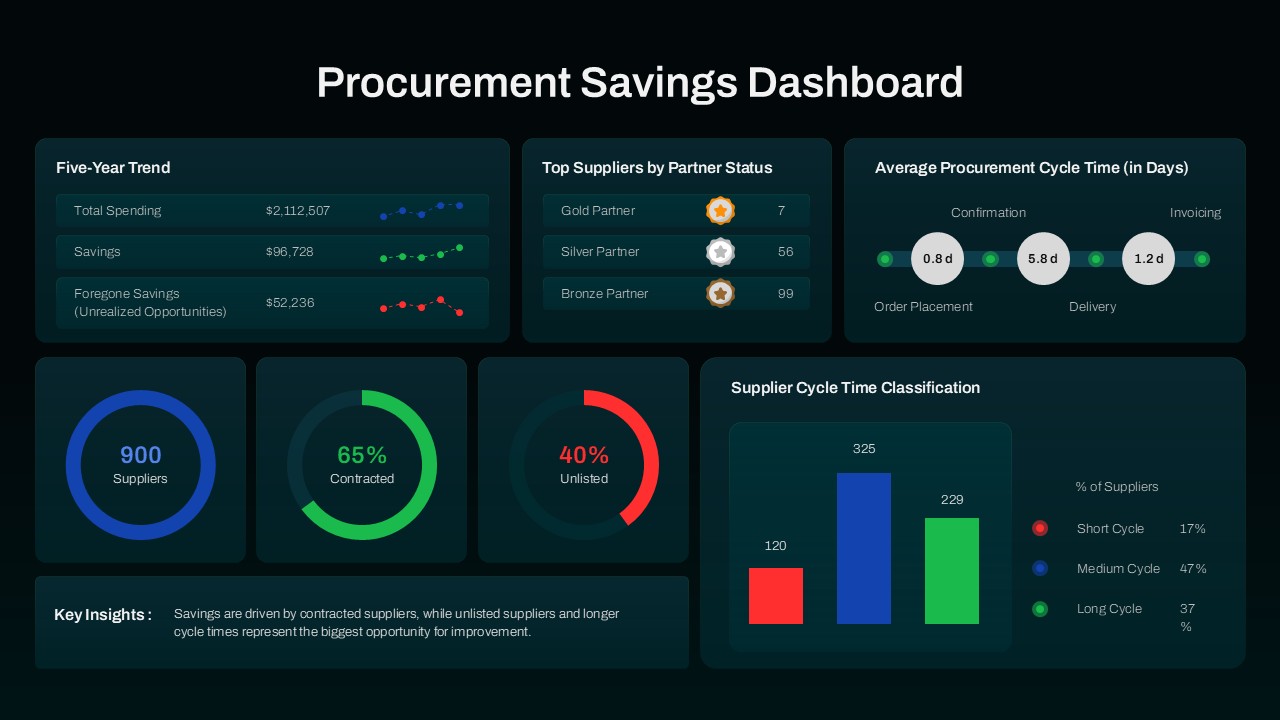
Procurement Savings Dashboard PowerPoint Template
Procurement decisions become more valuable when spending data, supplier performance, and cost-saving opportunities are presented in one clear view. This Procurement Savings Dashboard template is built for procurement managers, sourcing specialists, finance teams, supply chain analysts, purchasing departments, and business leaders who need a structured way to communicate procurement results and operational performance. Fully editable for PowerPoint and Google Slides, users can customize charts, values, labels, colors, supplier metrics, and reporting categories while preserving a clean dashboard structure.
This dashboard follows a practical reporting structure that mirrors how procurement teams review and present performance data. The layout begins with a five-year procurement trend section, allowing users to display total spending, realized savings, and unrealized savings opportunities. This provides immediate visibility into spending behavior and long-term cost management outcomes.
The presentation then moves into supplier performance analysis, where partner classifications and supplier relationships can be compared for easier evaluation. Procurement teams can explain supplier distribution and strategic vendor segmentation without overwhelming audiences with raw data.
Supplier Performance Metrics and Spend Analysis Dashboard
The lower section expands reporting capabilities through visual procurement indicators. Circular metrics can display supplier volume, contract percentages, and unlisted supplier ratios, while cycle-time charts help explain procurement efficiency and process performance. The supplier cycle classification section also supports discussions around operational bottlenecks and vendor responsiveness.
This dashboard supports presentation storytelling by guiding audiences from procurement spending trends to supplier insights and finally to improvement opportunities. Financial teams can use it for executive reporting, while procurement departments can use it to present sourcing performance and purchasing effectiveness.
Frequently Asked Questions
What procurement metrics can I track with this dashboard template?
Can I customize the supplier classification categories in this template?
Login to download this file

Item ID
SB05915Designed By
Naseeba Sithara
Related Templates

Cost Cutting Savings Dashboard Template for PowerPoint & Google Slides
Pie/Donut
Procurement KPI Dashboard & Metrics Template for PowerPoint & Google Slides
Business Report
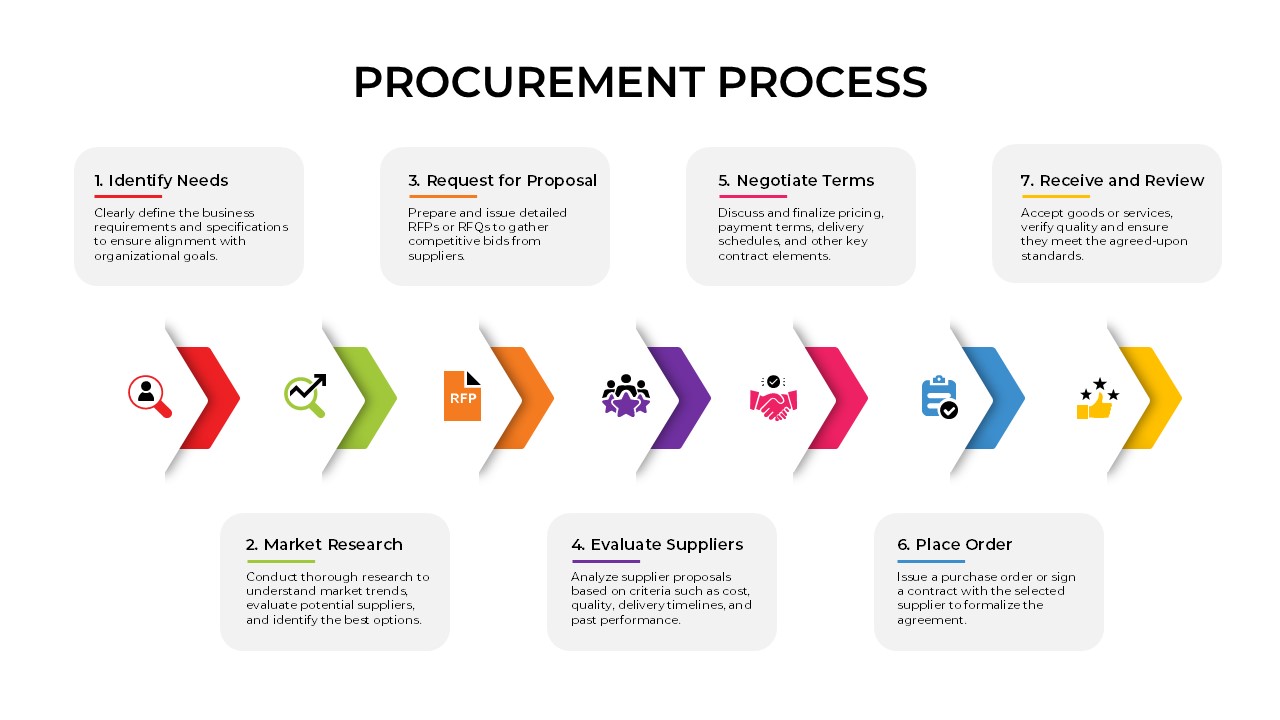
Procurement Process PowerPoint Template
Process
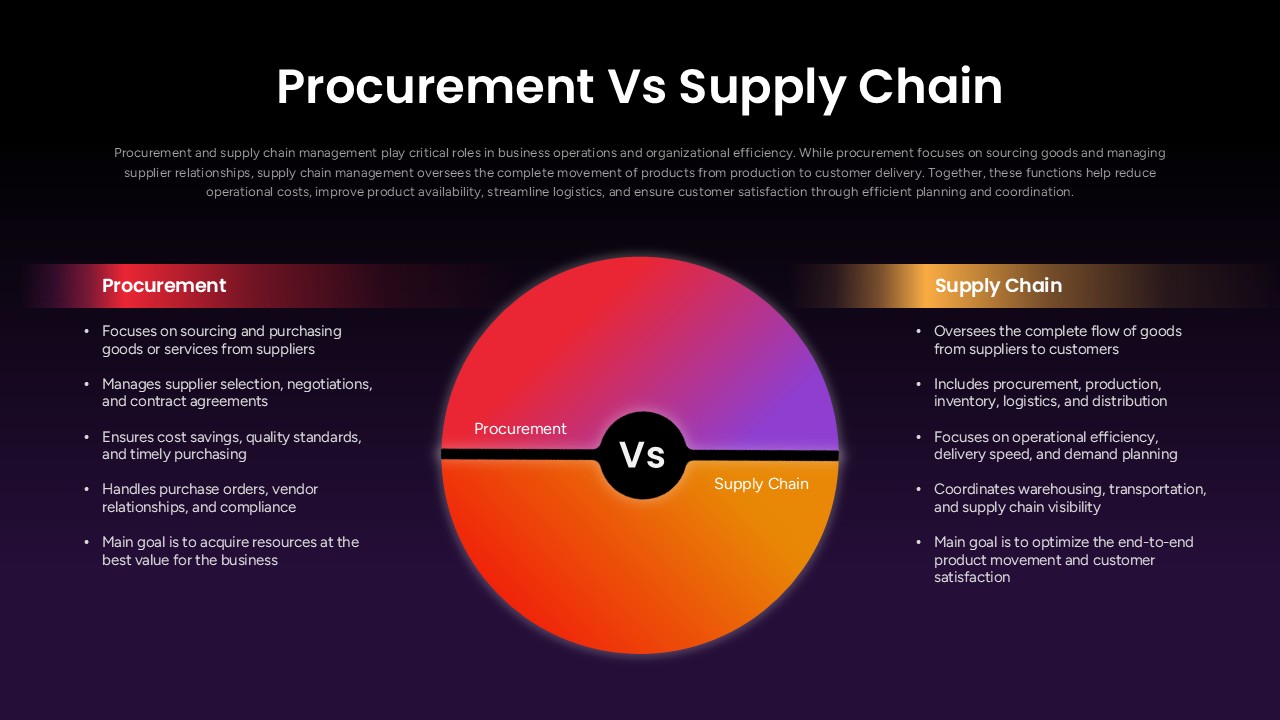
Procurement Vs Supply Chain Comparison Presentation Template
Comparison

Product Usage Analytics Dashboard Chart Template for PowerPoint & Google Slides
Bar/Column
Employee Skill Analysis Dashboard Template for PowerPoint & Google Slides
Employee Performance
KPI Dashboard Overview template for PowerPoint & Google Slides
Finance
Free Metro UI Dashboard Infographic Template for PowerPoint & Google Slides
Business Report
Free
Website Performance Monitoring Dashboard Template for PowerPoint & Google Slides
Business Report
Employee Satisfaction Survey Dashboard Template for PowerPoint & Google Slides
Employee Performance
Customer Satisfaction KPI Dashboard Template for PowerPoint & Google Slides
Customer Experience
Free KPI Dashboard Template for PowerPoint & Google Slides
Charts
Free
Michigan County Map with KPI Dashboard Template for PowerPoint & Google Slides
World Maps
Quarterly Financial Summary Dashboard Template for PowerPoint & Google Slides
Business Report
Inventory Management Dashboard Template for PowerPoint & Google Slides
Process
Employee Performance Metrics Dashboard Template for PowerPoint & Google Slides
Employee Performance
Customer Interview Insights Dashboard Template for PowerPoint & Google Slides
Customer Experience
Dashboard Project Status Template for PowerPoint & Google Slides
Project Status
Project Status Dashboard with RAG Legend Template for PowerPoint & Google Slides
Project Status
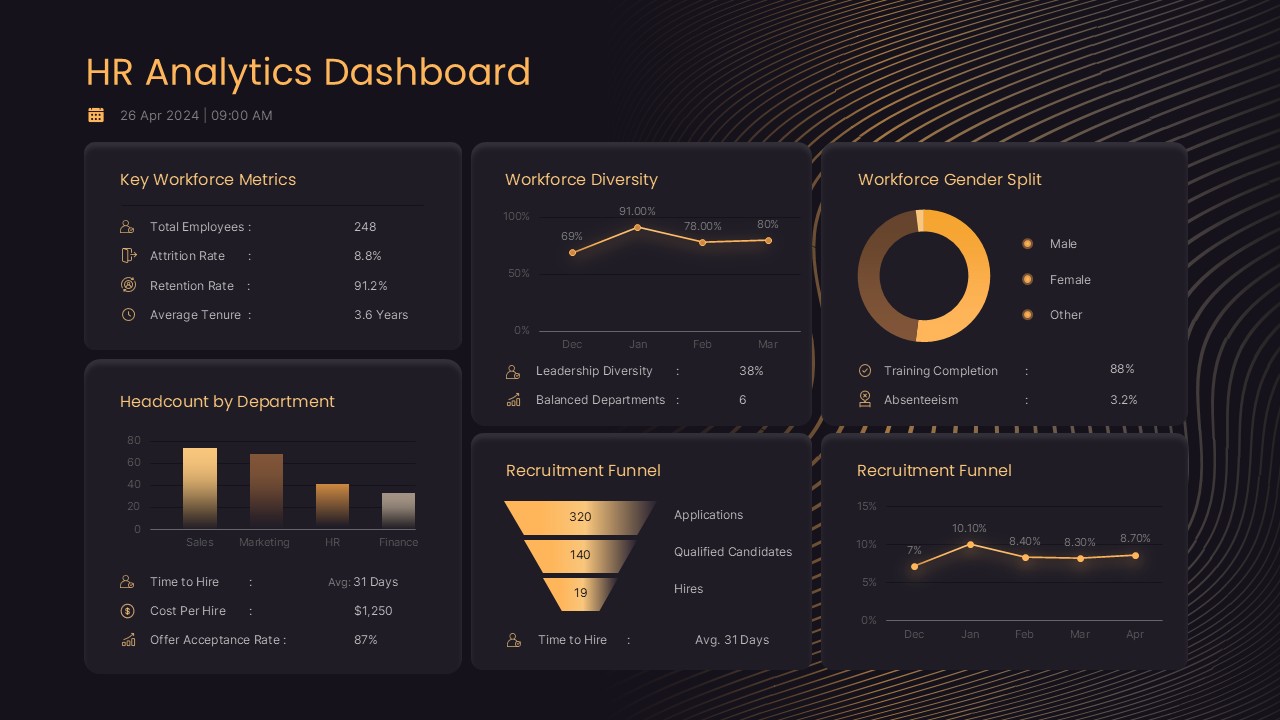
HR Analytics Dashboard PowerPoint & Google Slides Template
HR