Pentagon Arrow Process Diagram Template for PowerPoint & Google Slides
Description
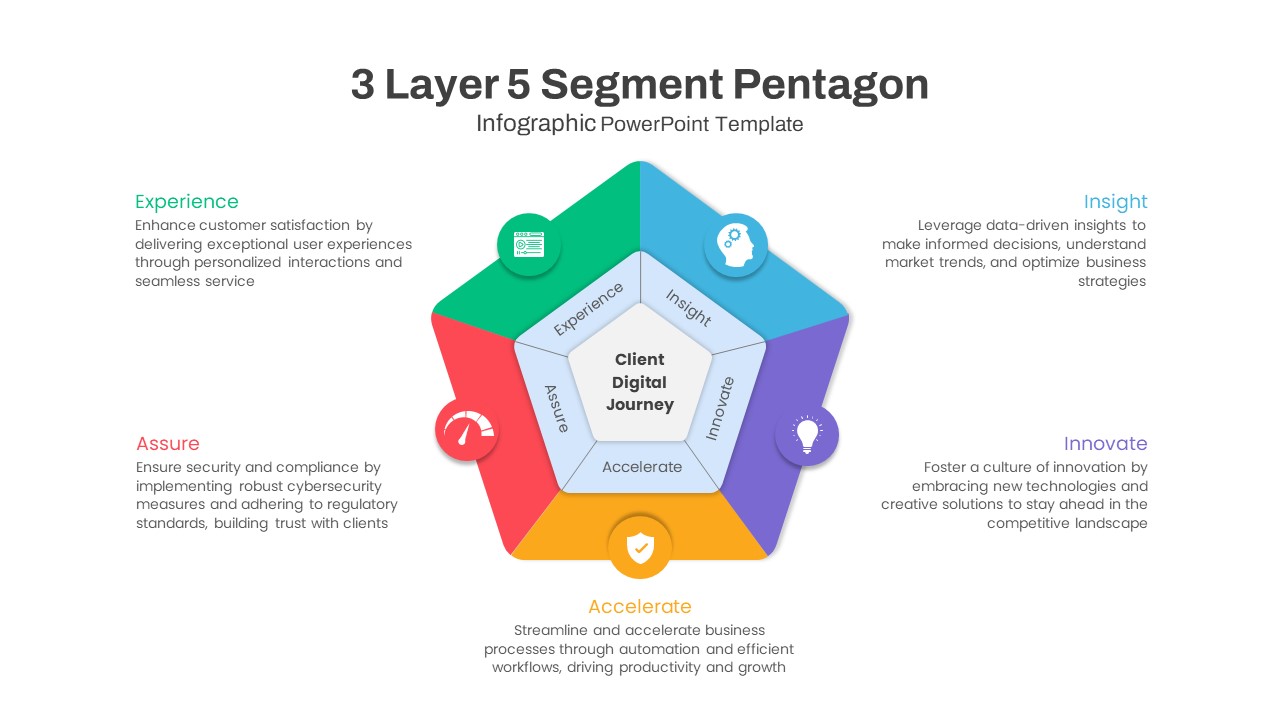
Leverage this pentagon arrow infographic slide to visualize five-step processes, hub-and-spoke models, or cyclical workflows with clarity and color. The central pentagon houses your core topic, surrounded by five vibrant arrow-shaped segments—yellow, cyan, blue, green, and pink—numbered one through five, each pointing clockwise to illustrate progression. Fine connector lines link each arrow to a text placeholder positioned around the graphic, enabling concise annotations for key stages or features. Subtle drop shadows, rounded corners, and consistent spacing create depth, while the white background maintains focus on content. The design balances visual appeal with readability, ensuring audiences can quickly grasp complex processes at a glance.
Built on master slides with fully editable vector shapes, this template lets you change arrow colors to match brand guidelines, relabel numeric indicators, swap fonts for alignment with corporate identity, and reposition text blocks for alternative layouts. Whether you’re presenting strategic roadmaps, product development cycles, stakeholder engagement plans, or training modules, simply duplicate the slide for multi-phase comparisons or split the graphic into standalone segments for focused deep dives. Connector animations can sequentially reveal each arrow, guiding audience attention and reinforcing narrative flow during live presentations. The layout’s symmetry and motion cues also make it ideal for illustrating feedback loops, decision trees, or priority matrices.
Optimized for both PowerPoint and Google Slides, the slide guarantees pixel-perfect clarity across devices and seamless compatibility, eliminating version-control hassles. With intuitive placeholders and a thoughtfully balanced mix of graphics and text, you can craft professional, impactful presentations in minutes—no graphic-design expertise required. Use this versatile pentagon arrow diagram to drive home process clarity, emphasize step-by-step narratives, highlight five core principles, and elevate your storytelling with a polished, modern infographic asset.
Who is it for
Project managers, consultants, marketing strategists, educators, and team leaders who need to communicate multi-step processes, cyclical workflows, or hub-and-spoke models in a visually engaging and easy-to-understand format.
Other Uses
Repurpose as a priority ranking chart, stakeholder mapping tool, product roadmap overview, risk-assessment framework, or organizational spine diagram—simply relabel arrows and adjust connector labels to suit any five-element scenario.
Login to download this file

Item ID
SB03008
Related Templates

Five-Stage Pentagon Arrow Diagram Template for PowerPoint & Google Slides
Arrow
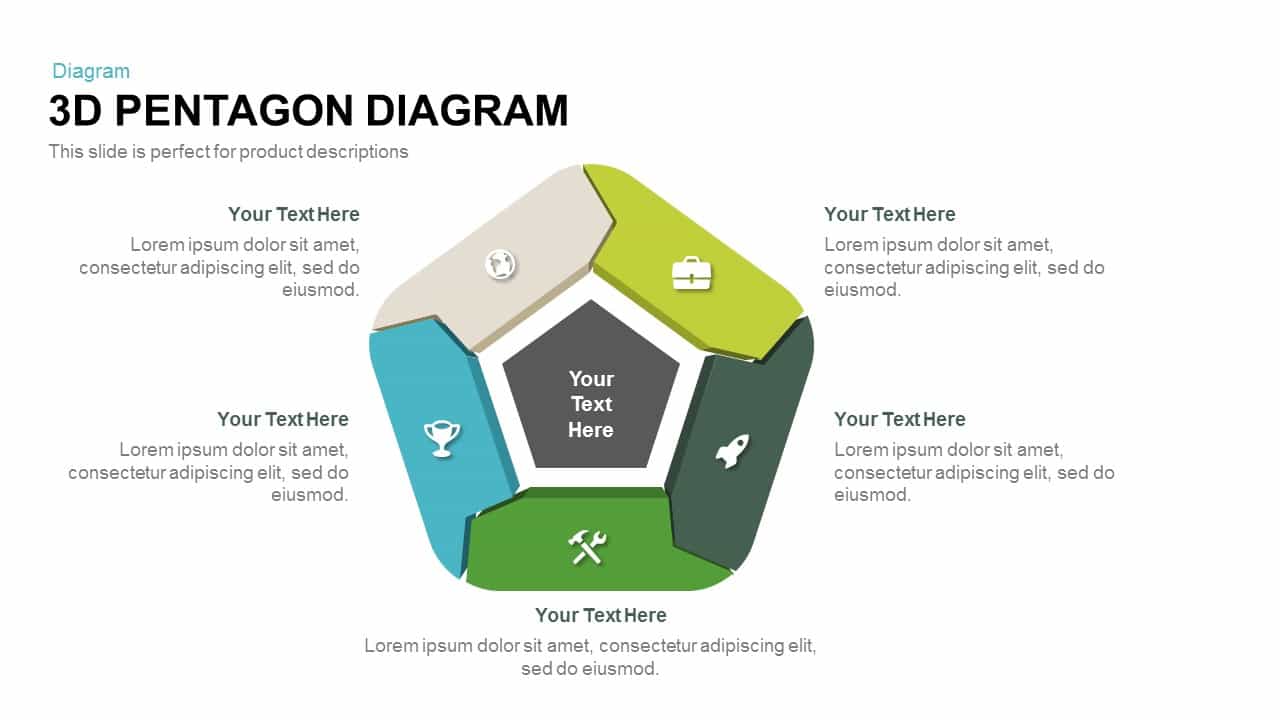
3D Pentagon Diagram template for PowerPoint & Google Slides
Process
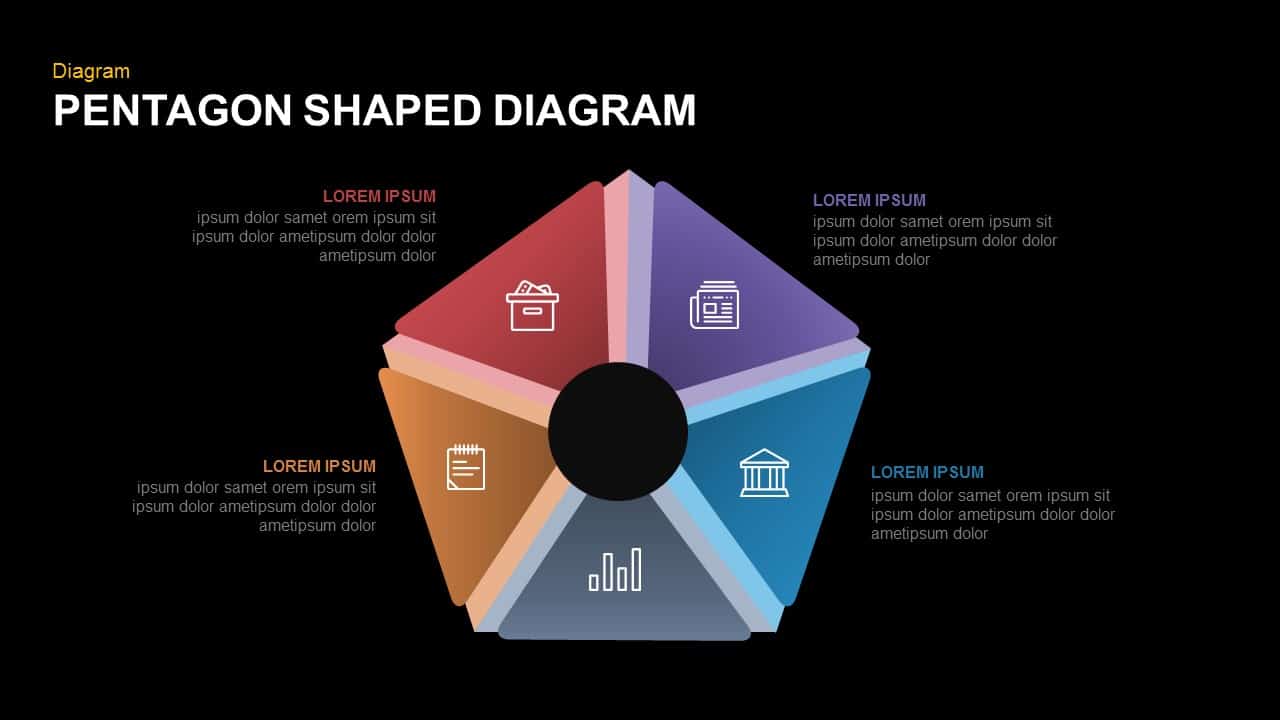
Five-Part Pentagon Shaped Diagram Template for PowerPoint & Google Slides
Process
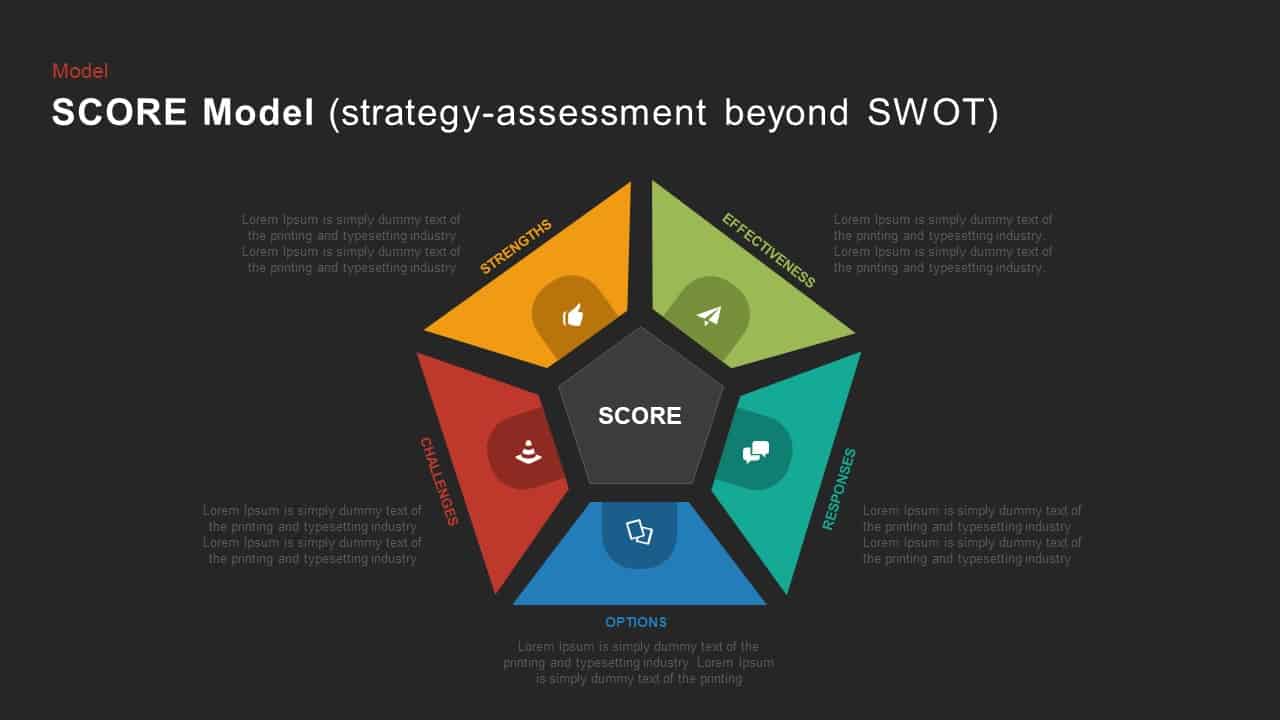
SCORE Model Pentagon Assessment Diagram Template for PowerPoint & Google Slides
Circular
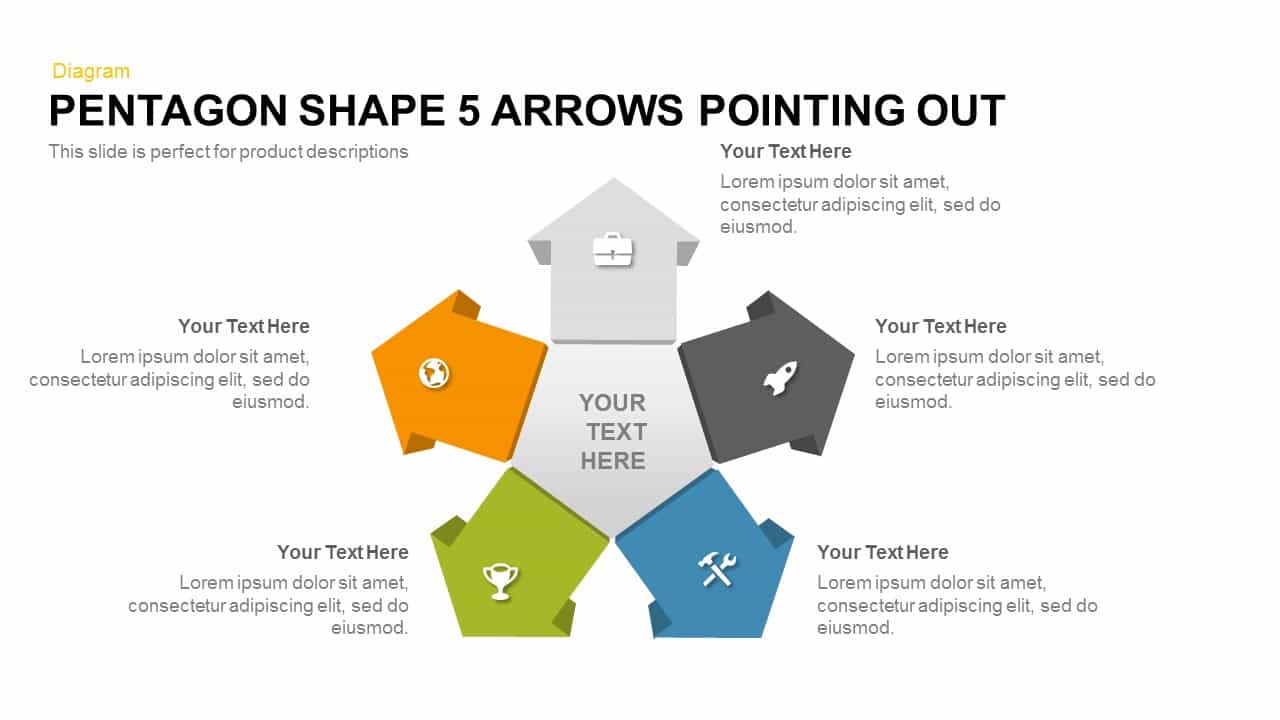
Pentagon Shape 5 Arrows Pointing Out template for PowerPoint & Google Slides
Arrow
Five-Segment Pentagon Digital Journey Template for PowerPoint & Google Slides
Process
5 Arrow Process Diagram Template for PowerPoint & Google Slides
Infographics
Six Arrow Radial Process Diagram template for PowerPoint & Google Slides
Infographics
6-Step Arrow Process Diagram Template for PowerPoint & Google Slides
Process
Colorful Arrow Process Diagram Template for PowerPoint & Google Slides
Arrow
Arrow Process Diagram Template for PowerPoint & Google Slides
Process
Three Circle Arrow Process Diagram template for PowerPoint & Google Slides
Circular
3D Sphere Arrow Process Diagram template for PowerPoint & Google Slides
Arrow

Three Stage 3D Arrow Process Diagram Template for PowerPoint & Google Slides
Process
Arrow Stage Process Diagram template for PowerPoint & Google Slides
Arrow
Six Pointing Arrow Process Diagram Template for PowerPoint & Google Slides
Arrow
Seven-Stage Arrow Process Diagram Template for PowerPoint & Google Slides
Process

Six-Process Circular Arrow Diagram Template for PowerPoint & Google Slides
Circular

8 Steps Arrow Process Diagram template for PowerPoint & Google Slides
Process

Elegant Process Support Arrow Diagram Template for PowerPoint & Google Slides
Arrow

Five-Stage Cyclic Process Arrow Diagram Template for PowerPoint & Google Slides
Process
Free Six-Stage Arrow Process Diagram Template for PowerPoint & Google Slides
Process
Free
Six-Step Linear Arrow Process Diagram Template for PowerPoint & Google Slides
Process
Three-Way Decision Process Arrow Diagram Template for PowerPoint & Google Slides
Arrow
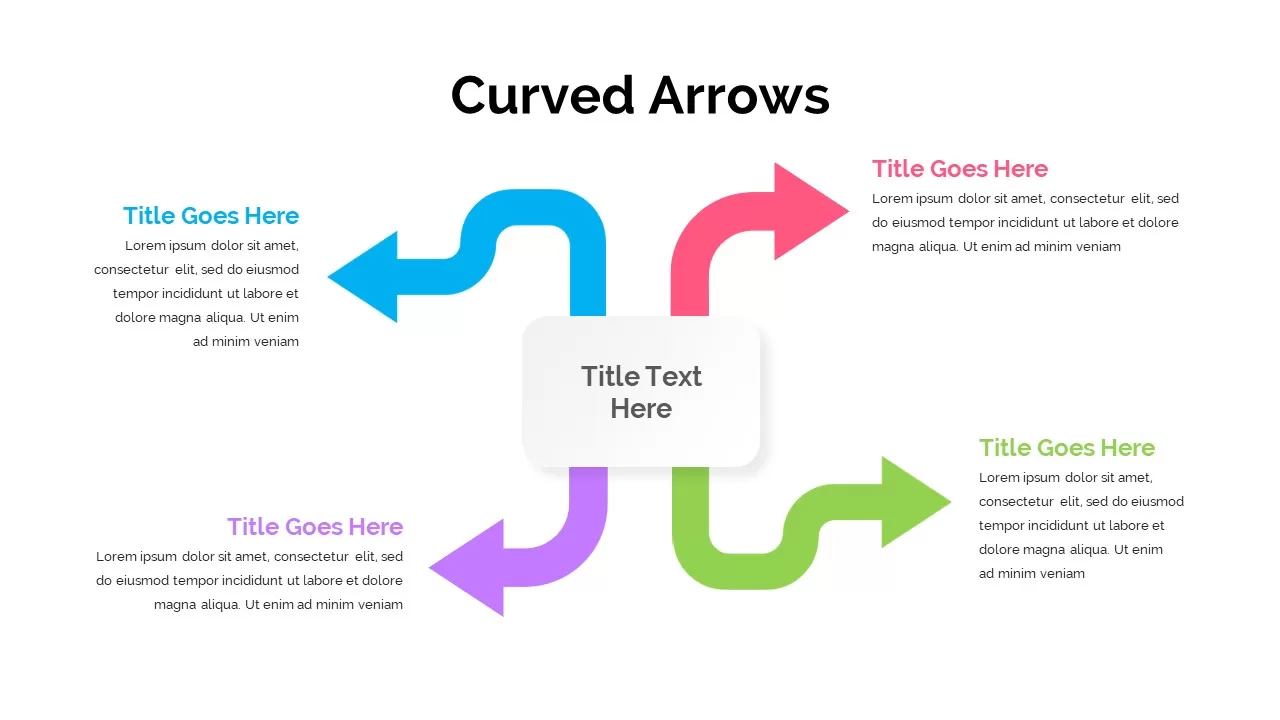
Curved Arrow Process Flow Diagram Template for PowerPoint & Google Slides
Process
Curved Arrow Process Flow Diagram Template for PowerPoint & Google Slides
Arrow
Three-Step Curved Arrow Process Diagram Template for PowerPoint & Google Slides
Arrow
Circular Arrow Process Diagram Template for PowerPoint & Google Slides
Circular
Arrow Process Diagram for PowerPoint & Google Slides
Process
5-Stage Arrow Infographics Process Flow Template for PowerPoint & Google Slides
Arrow
Dynamic Arrow Process Template for PowerPoint & Google Slides
Process
Five-Stage Direct Flow Arrow Process Template for PowerPoint & Google Slides
Arrow
Four-Step Arrow Process Infographic Template for PowerPoint & Google Slides
Arrow
Implementation Process Strategy Arrow Template for PowerPoint & Google Slides
Arrow
Curved Arrow Process Flow Infographic Template for PowerPoint & Google Slides
Process
Dynamic Curved Arrow Process Roadmap Template for PowerPoint & Google Slides
Process
3D Curved Arrow Growth Process Slide Template for PowerPoint & Google Slides
Process
Four-Step Curved Arrow Process Template for PowerPoint & Google Slides
Process
Curved Arrow Process Flow template for PowerPoint & Google Slides
Process
Curved Arrow Process Flow template for PowerPoint & Google Slides
Process
Circle Arrow Process Flow template for PowerPoint & Google Slides
Process
Circle Arrow Process Flow template for PowerPoint & Google Slides
Process
4 Step Arrow Diagram template for PowerPoint & Google Slides
Arrow
5-Step Arrow Diagram template for PowerPoint & Google Slides
Arrow
3D Four Arrow Infographics Diagram Template for PowerPoint & Google Slides
Arrow
Five Up Arrow Infographic Diagram Template for PowerPoint & Google Slides
Arrow
5 Arrow Diagram template for PowerPoint & Google Slides
Arrow
Four Directional Arrow Diagram Template for PowerPoint & Google Slides
Arrow
Five Arrow Infographics Diagram Template for PowerPoint & Google Slides
Arrow
Five-Section Circular Arrow Diagram Template for PowerPoint & Google Slides
Circular
Five-Stage Zig-Zag Arrow Diagram Template for PowerPoint & Google Slides
Process
Five-Section Arrow Signpost Diagram Template for PowerPoint & Google Slides
Arrow
Five-Stage Circle Arrow Diagram Template for PowerPoint & Google Slides
Circular
Four-Way Directional Arrow Diagram Template for PowerPoint & Google Slides
Arrow
Timeline Arrow Infographics Diagram Template for PowerPoint & Google Slides
Timeline
Seven-Segment Circular Arrow Diagram Template for PowerPoint & Google Slides
Arrow
8-Step Circular Arrow Diagram Template for PowerPoint & Google Slides
Arrow
Pros & Cons Arrow Diagram template for PowerPoint & Google Slides
Comparison Chart
Four-Section Arrow Infographic Diagram Template for PowerPoint & Google Slides
Arrow
Four-Point Arrow Cycle Diagram Template for PowerPoint & Google Slides
Arrow
Six-Step Two-Sided Arrow Diagram Template for PowerPoint & Google Slides
Process
Four-Staged Business Arrow Diagram Template for PowerPoint & Google Slides
Process
Eight-Stage Zigzag Arrow Diagram Template for PowerPoint & Google Slides
Process
Eight-Step Inward Arrow Diagram Template for PowerPoint & Google Slides
Arrow
Five Stage Circular Arrow Diagram Template for PowerPoint & Google Slides
Process
Six-Stage Arrow Timeline Diagram Template for PowerPoint & Google Slides
Timeline
Agile Work Streams Arrow Diagram Template for PowerPoint & Google Slides
Process
3D Block Arrow Infographic Diagram Template for PowerPoint & Google Slides
Arrow
Free Curved Arrow Infographic Diagram Template for PowerPoint & Google Slides
Arrow
Free
Curved Arrow Flow Diagram template for PowerPoint & Google Slides
Business
Concentric Circular Arrow Cycle Diagram Template for PowerPoint & Google Slides
Process
Four-Arrow Curved Hub-and-Spoke Diagram Template for PowerPoint & Google Slides
Arrow
Hand-Drawn Four-Step Curved Arrow Diagram Template for PowerPoint & Google Slides
Arrow
Four-Step Curved Arrow Diagram Template for PowerPoint & Google Slides
Arrow
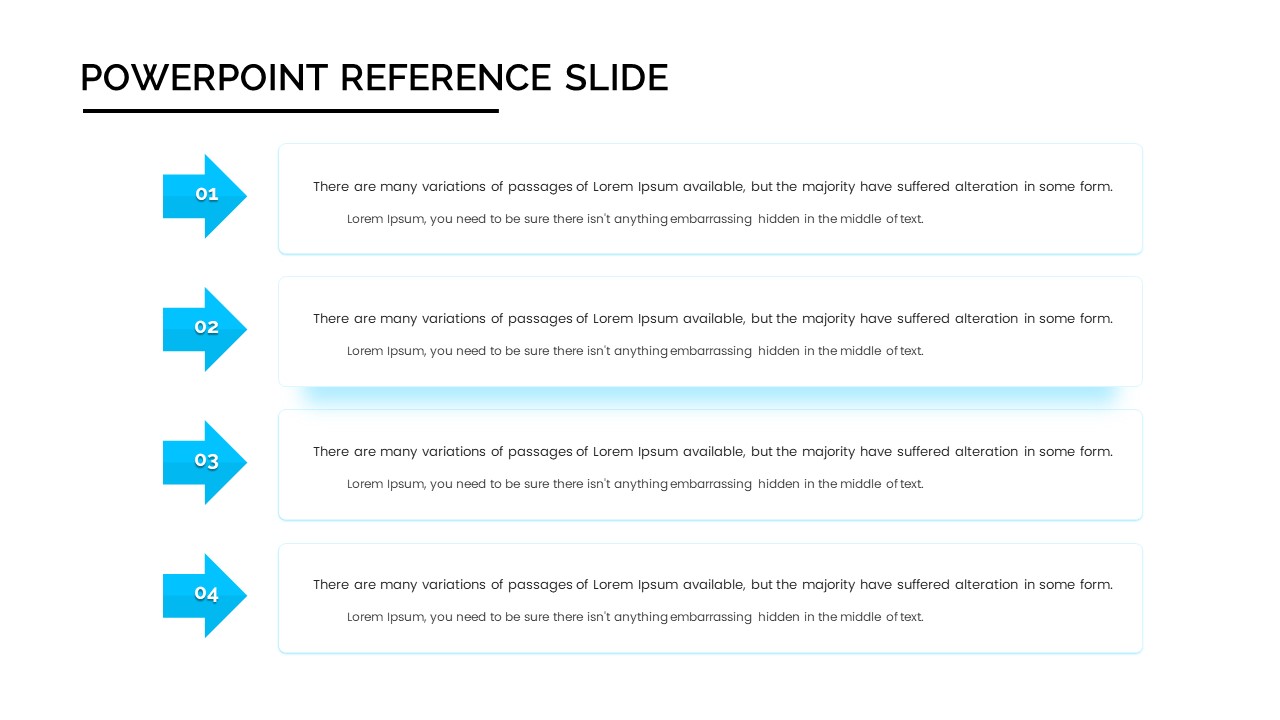
Four-Step Arrow Reference Diagram Slide Template for PowerPoint & Google Slides
Arrow
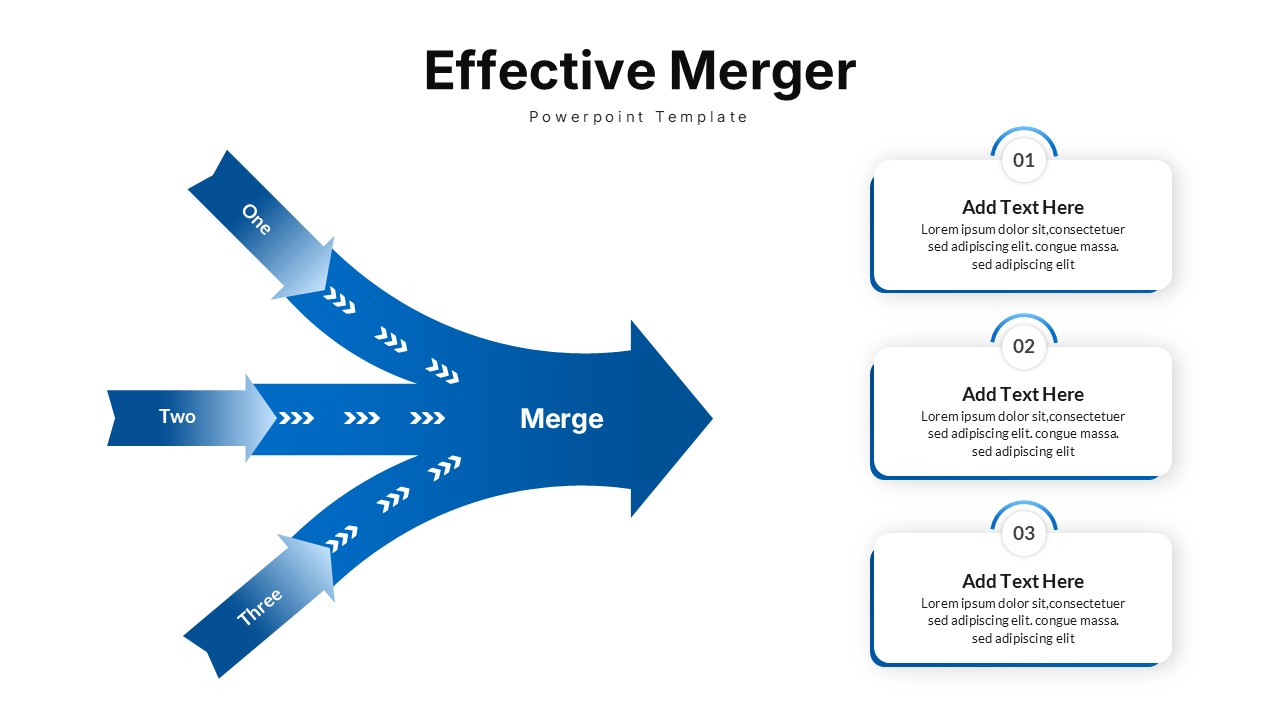
Effective Merger Arrow Diagram Template for PowerPoint & Google Slides
Arrow
Arrow Circle Flow Diagram for PowerPoint & Google Slides
Infographics
Success and Growth Stair Arrow Diagram for PowerPoint & Google Slides
Process
Five Circular Flow Arrow Diagram for PowerPoint & Google Slides
Arrow
Arrow Infographics template for PowerPoint & Google Slides
Infographics
3D Arrow Directional template for PowerPoint & Google Slides
Arrow
Four Swoosh Arrow Infographics template for PowerPoint & Google Slides
Arrow

Strategy Arrow and Gear Icons Template for PowerPoint & Google Slides
Infographics
Eight-Segment 3D Arrow Infographics Template for PowerPoint & Google Slides
Arrow
3D Arrow Infographics template for PowerPoint & Google Slides
Arrow
Arrow Timeline Infographic Slide Template for PowerPoint & Google Slides
Timeline
Growth Arrow for Progress & Growth template for PowerPoint & Google Slides
Arrow
Dynamic Growth Arrow Step Infographic Template for PowerPoint & Google Slides
Process
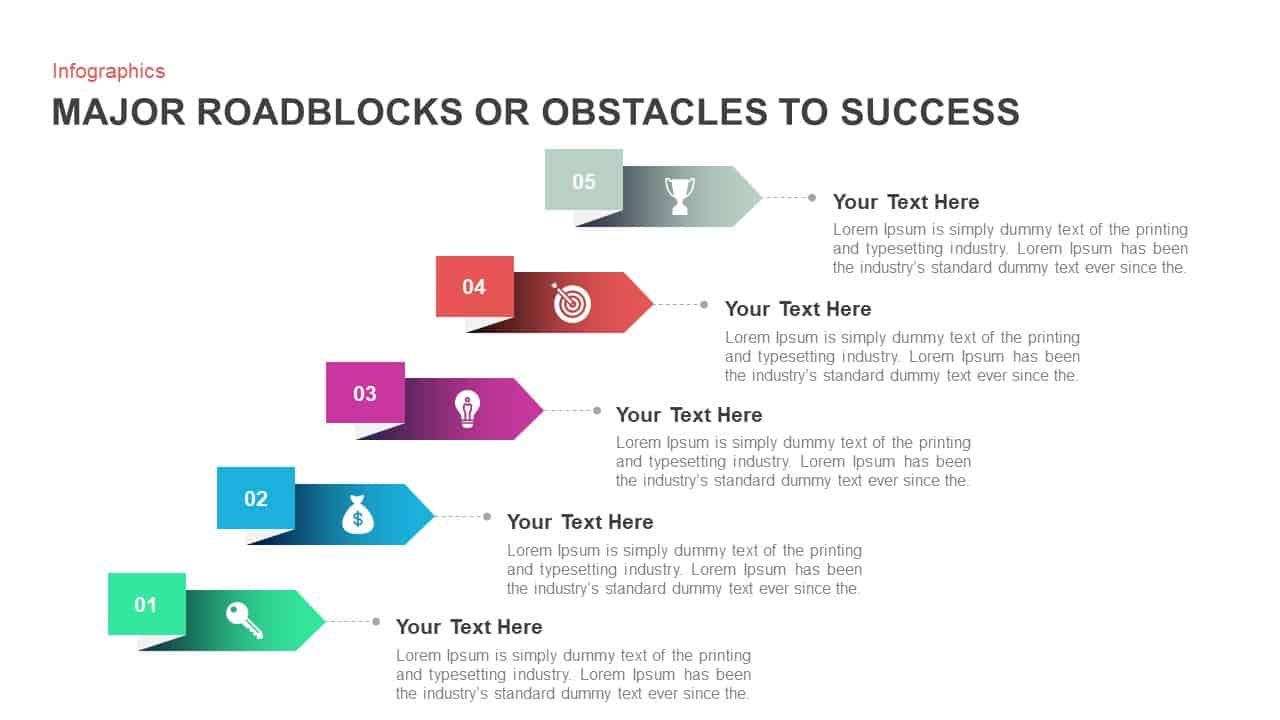
Major Roadblocks to Success Arrow Template for PowerPoint & Google Slides
Arrow
Curved Arrow Flow Template for PowerPoint & Google Slides
Process
Dual-Stage Circular Arrow Cycle Template for PowerPoint & Google Slides
Process
Three-Path Curved Arrow Infographic Template for PowerPoint & Google Slides
Arrow
Six-Segment Circular Arrow Cycle Template for PowerPoint & Google Slides
Circular
Curved Arrow Progression template for PowerPoint & Google Slides
Process
Accomplishment Arrow Infographic Template for PowerPoint & Google Slides
Accomplishment
Five-Stage Circular Arrow Infographic Template for PowerPoint & Google Slides
Circular
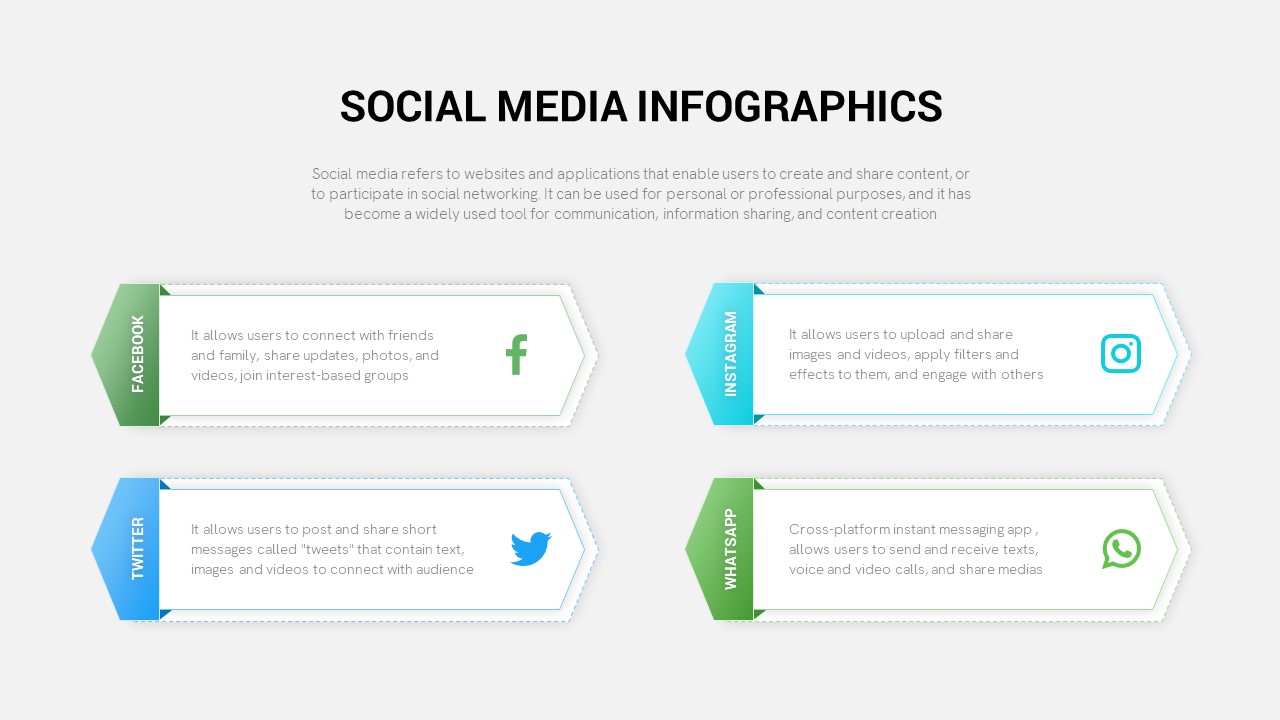
Social Media Infographic Arrow Layout Template for PowerPoint & Google Slides
Arrow
Bow and Arrow Goal Infographic Slide Template for PowerPoint & Google Slides
Goals
Arrow Line Chart Template for PowerPoint & Google Slides
Comparison Chart
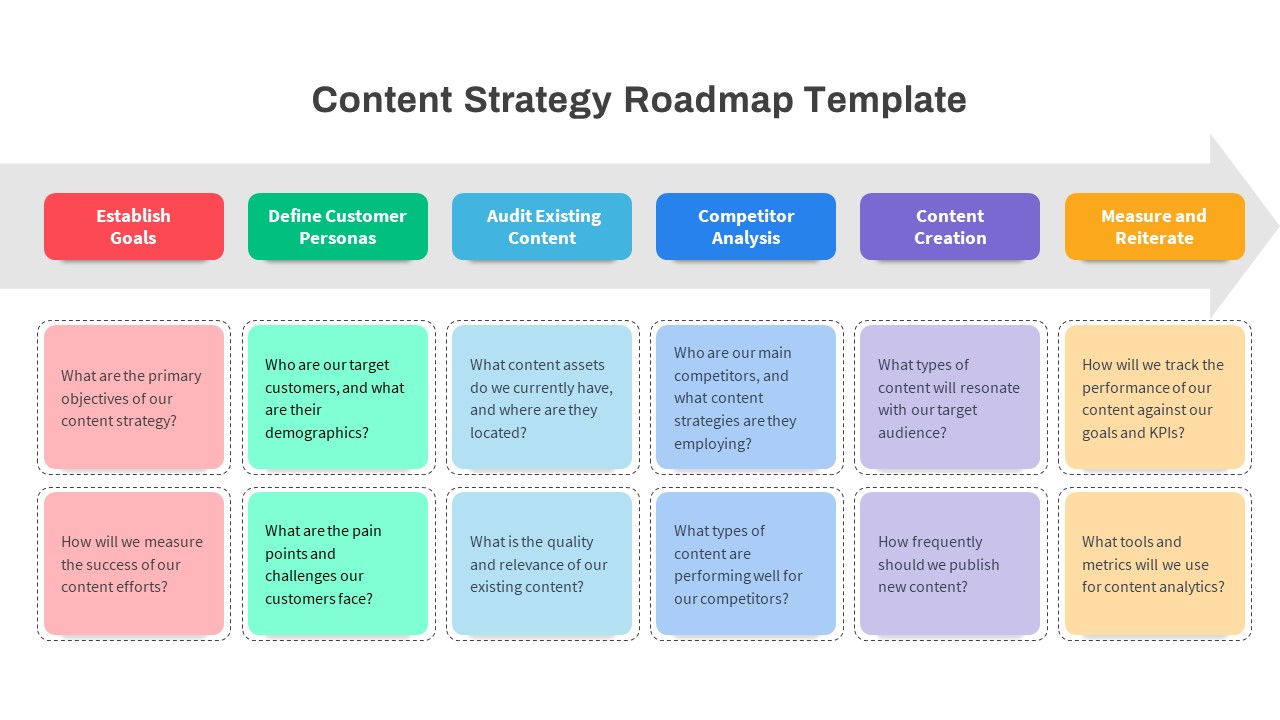
Content Strategy Roadmap Arrow Template for PowerPoint & Google Slides
Roadmap