














Overlapping Circle Chart PowerPoint Template
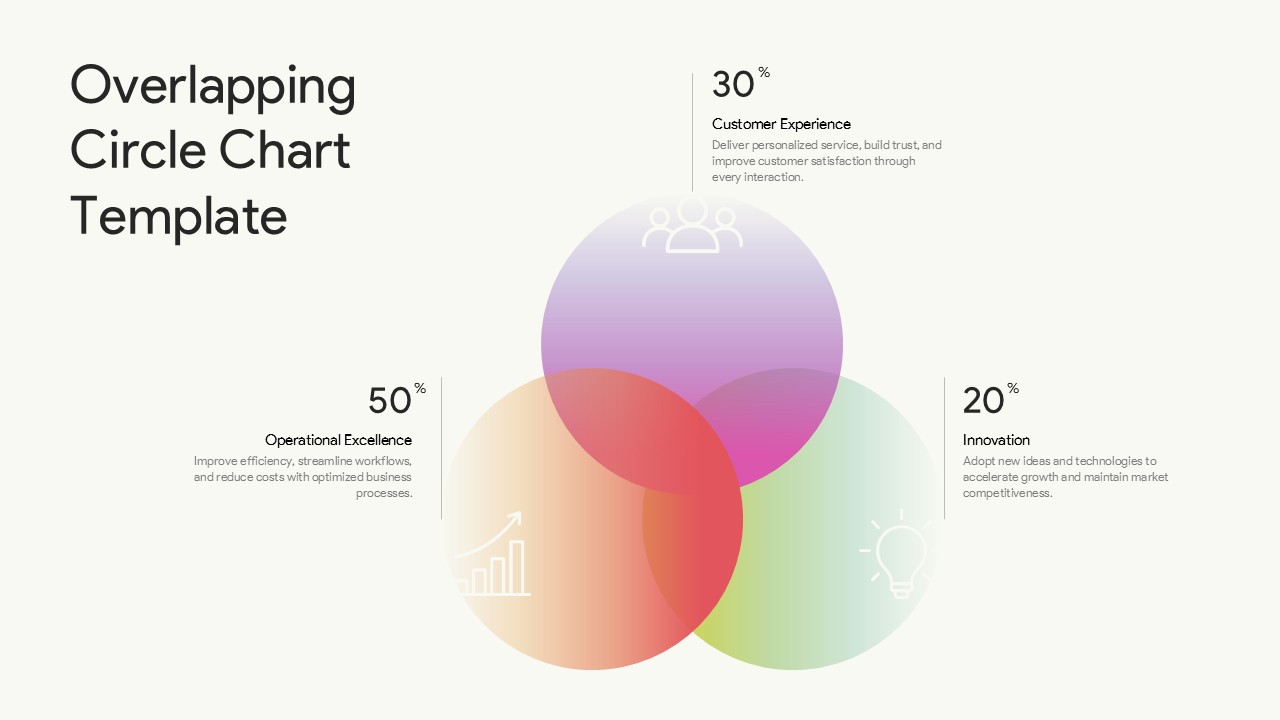
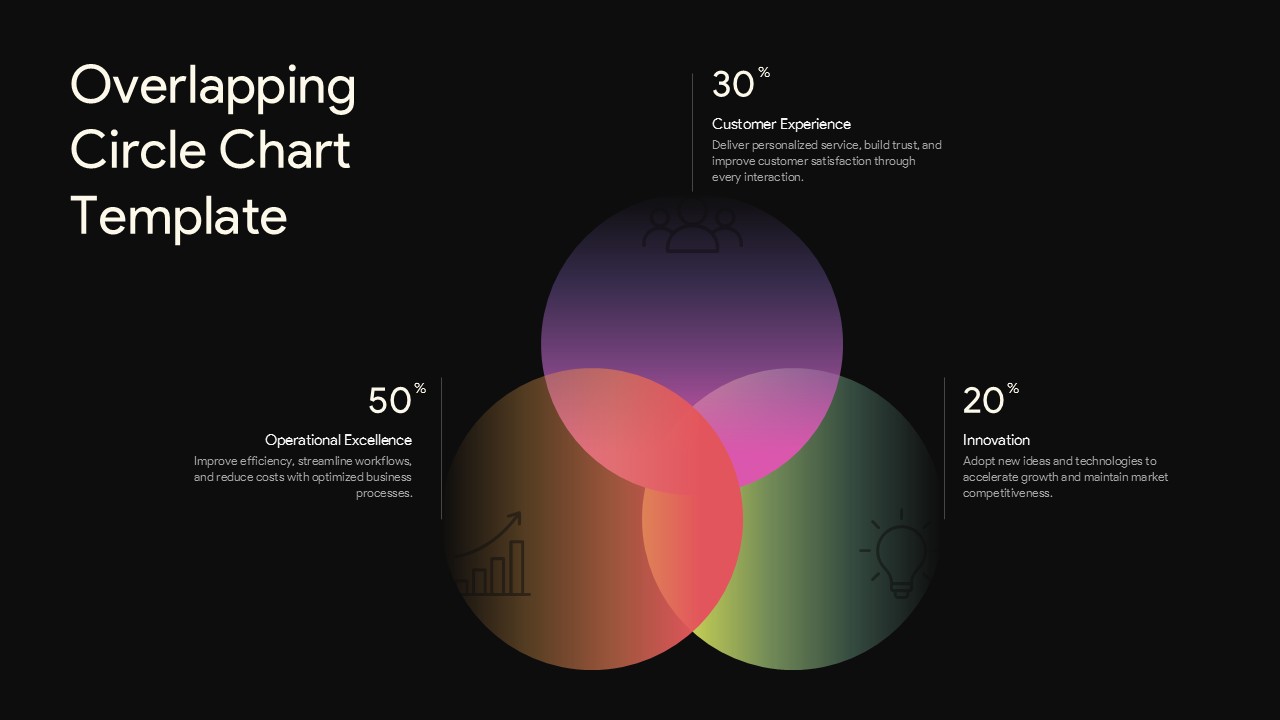
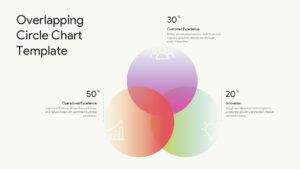
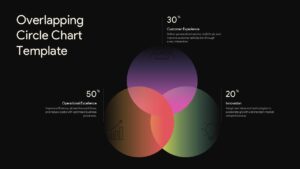
Show how three essential business areas work together using this Overlapping Circle Chart PowerPoint Template. The slide features three intersecting circular shapes positioned around a common center, creating a visual representation of connected objectives and shared business interests. Each circle highlights a separate focus area, including Operational Excellence (50%), Customer Experience (30%), and Innovation (20%). Soft gradient transitions in purple, pink, orange, and green give the diagram a distinctive appearance, while simple line icons reinforce the meaning of each category. Percentage figures, section headings, and brief descriptions are positioned around the central graphic, allowing presenters to communicate individual priorities alongside their relationships. The overlapping sections also offer a visual way to explain how different initiatives contribute to a broader organizational goal.
Use this Overlapping Circle Chart PowerPoint Template in business strategy presentations to demonstrate how operational performance, customer relationships, and innovation influence overall growth. Project managers can adapt the three sections to outline connected project objectives, while business consultants can use the diagram to explain strategic focus areas and organizational priorities. The layout is also suitable for management meetings, performance reviews, and corporate planning discussions where multiple factors contribute to a shared outcome. Replace the sample percentages with relevant figures, update the category titles, and add descriptions that reflect your subject. You can also customize the icons and gradient colors to suit your presentation style. Download this Overlapping Circle Chart PowerPoint Template to communicate related business priorities through an easy-to-follow visual.
Frequently Asked Questions
What are some practical uses of a three-circle infographic in presentations?
Login to download this file

Item ID
SB06069Designed By
Athira


Related Templates

Overlapping Timeline PowerPoint Template
Timeline
Circle Strategy Creative Chart PowerPoint template
Business Strategy
Circle Chart Infographic PowerPoint Template
Pie/Donut
Four Circle Service PowerPoint Template
Process
Circle Spider Diagram Template for PowerPoint and Google Slides
Circular
Circle Graph PowerPoint Template
Circular
Modern Nine Circle Network Diagram Template for PowerPoint & Google Slides
Circular
4 Business Circle Template for PowerPoint
Circular
3 Arrows Circle PowerPoint Template and Google Slides
Circular
Circle Split Diagram PowerPoint Template and Google Slide
Circular

Creative Zigzag Circle Service Steps Template for PowerPoint & Google Slides
Process
Editable Twin Circle Process Diagram Template for PowerPoint & Google Slides
Process
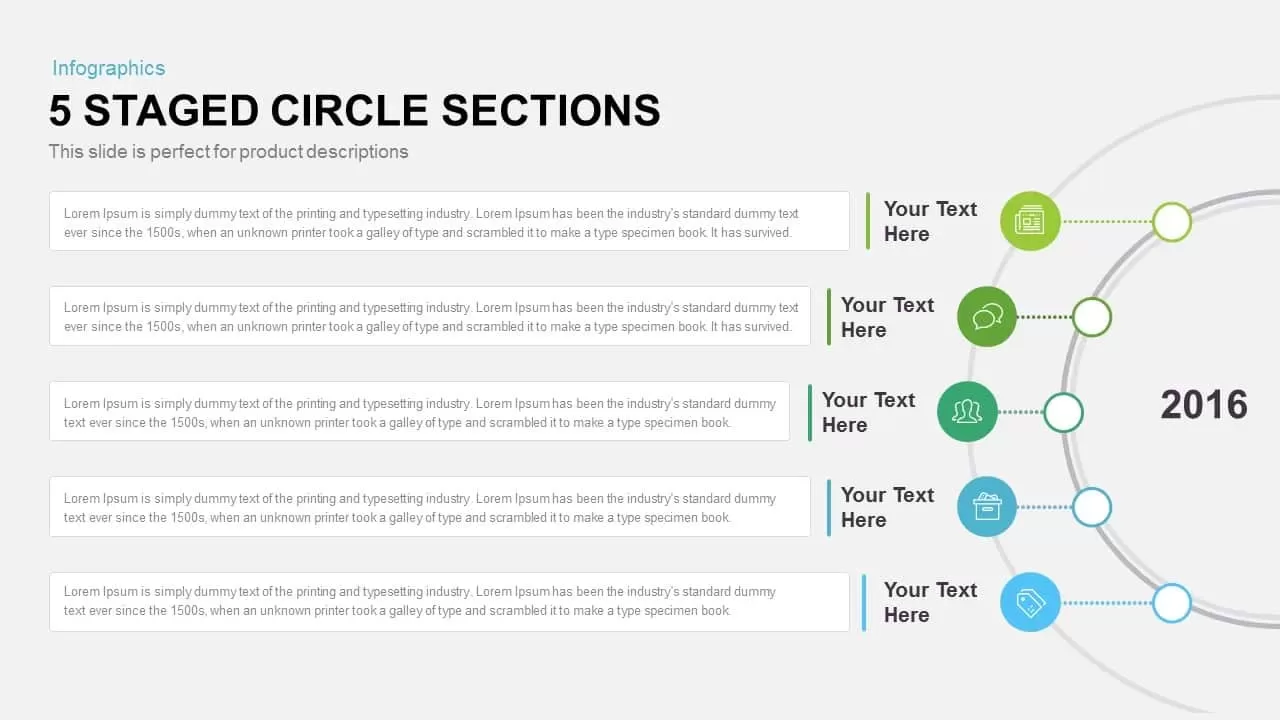
Five-Staged Circle Sections Diagram Template for PowerPoint & Google Slides
Circular
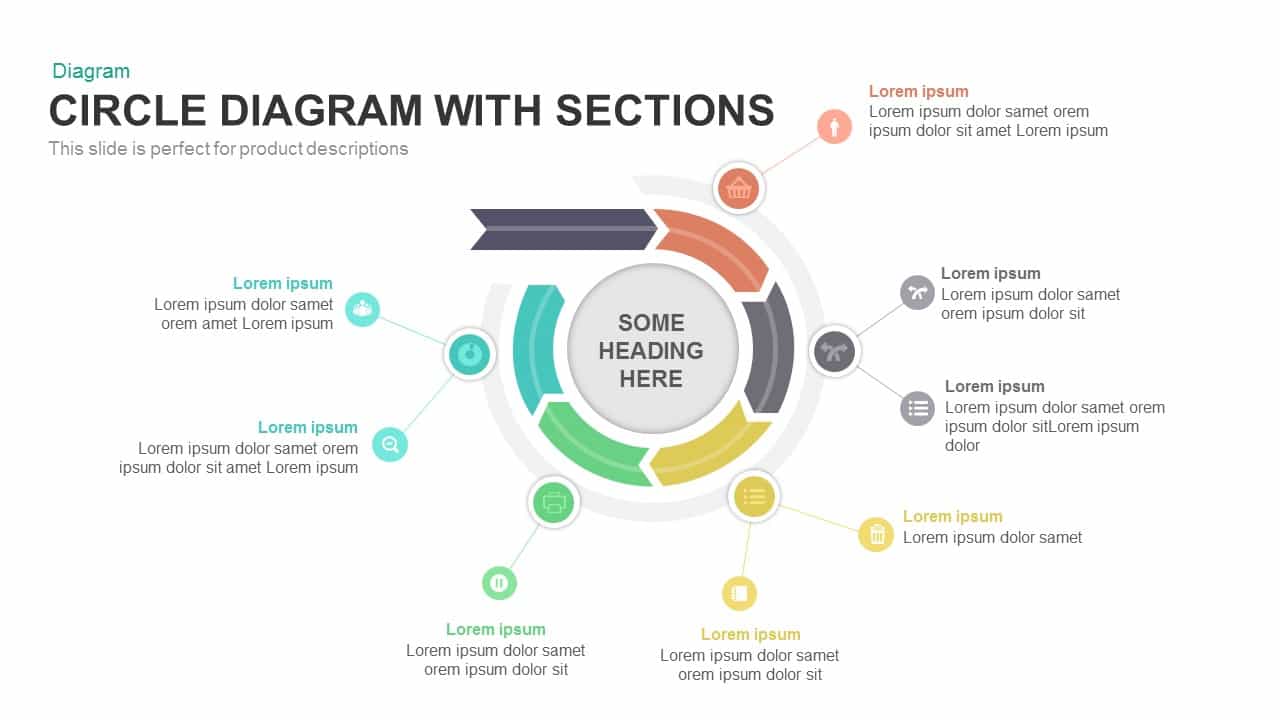
Circle Diagram Template with Sections PowerPoint
Circular
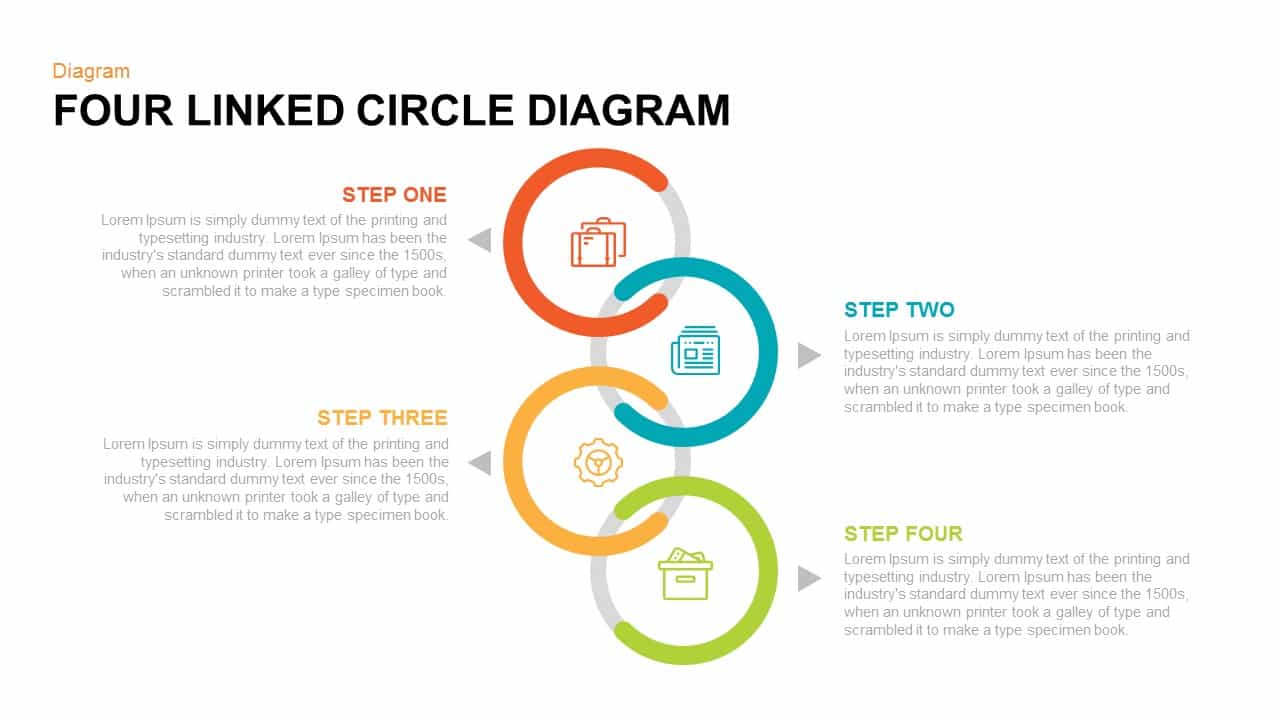
Four Linked Circle Diagram PowerPoint Template
Process
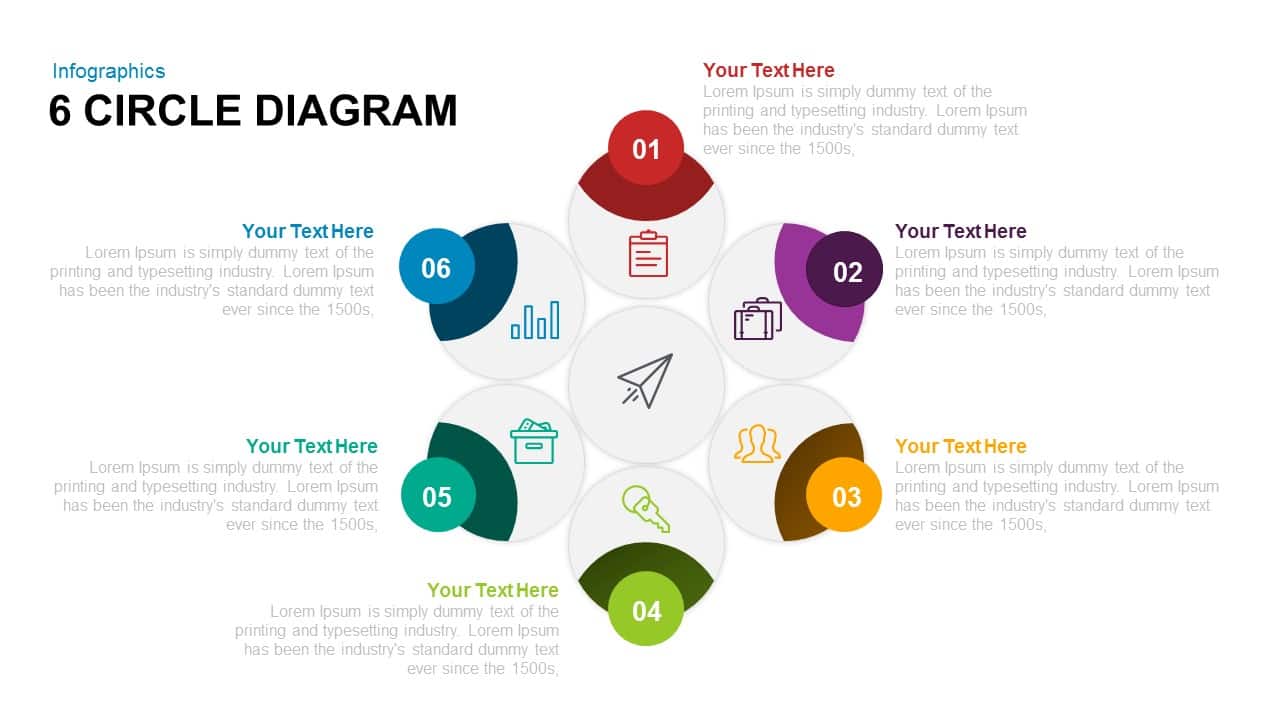
6 Circle Diagram PowerPoint Template and Google Slide
Circular
Circle Arrows Process Flow template for PowerPoint & Google Slides
Process
Circle Arrows PowerPoint Template
Circular
Five Circle Venn Diagram for Template for PowerPoint & Google Slides
Circular
8 Circle Venn Diagram PowerPoint Template
Circular