Operation Process Metaphor Diagram Template for PowerPoint & Google Slides

Description
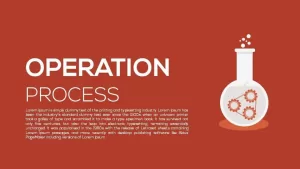
Leverage this Operation Process Metaphor slide to illustrate your team’s workflow optimization, process automation, and operational strategies with a compelling visual narrative. The central graphic showcases a laboratory flask blending scientific experimentation with engineering efficiency—complete with bubbling liquid and an embedded gear icon—set against a bold orange backdrop. Large, uppercase “OPERATION PROCESS” text anchors the left side, complemented by a customizable subtitle and body text area for detailed explanations. Each vector-based element, from the flask and gear to supporting text boxes, is fully editable: adjust colors, swap icons, and update text placeholders to match your brand guidelines in seconds.
Crafted on master slides for both PowerPoint and Google Slides, this template employs theme-linked color swatches, preformatted chart objects, and safe-zone guides to maintain consistency and avoid cropping issues. The flat design aesthetic and crisp typography ensure maximum readability across devices and screen sizes. Drag-and-drop vector graphics and intuitive formatting controls simplify angle adjustments and layout tweaks, while optional entrance animations add dynamic flair without distracting from core content. Whether preparing an executive briefing, project status report, or training workshop, this slide streamlines your workflow by combining conceptual imagery with practical customization features.
Optimized for 16:9 widescreen, the slide maintains full-resolution fidelity and seamless cross-platform compatibility. Repurpose the components to visualize supply chain processes, quality control pipelines, risk assessment frameworks, or innovation roadmaps. The slide also includes optional overlay shapes and callout lines to highlight specific process milestones or performance indicators, making it ideal for manufacturing, R&D presentations, and operational excellence discussions. With built-in editable shapes and text areas, you can tailor the slide to various contexts, ensuring your operational narratives engage audiences and drive strategic alignment.
Who is it for
Operations managers, process engineers, and business analysts will benefit from this slide when mapping workflows, optimizing production lines, or communicating operational strategies. Quality assurance teams, R&D departments, and executive leadership can leverage its metaphorical design to align stakeholders around continuous improvement initiatives.
Other Uses
Beyond illustrating operational workflows, repurpose this template for product development roadmaps, manufacturing process flows, R&D experiment breakdowns, or quality control frameworks. Adapt the flask-gear graphic to represent innovation pipelines, resource allocation models, or risk management cycles across industries.
Login to download this file

Item ID
SB00519
Related Templates

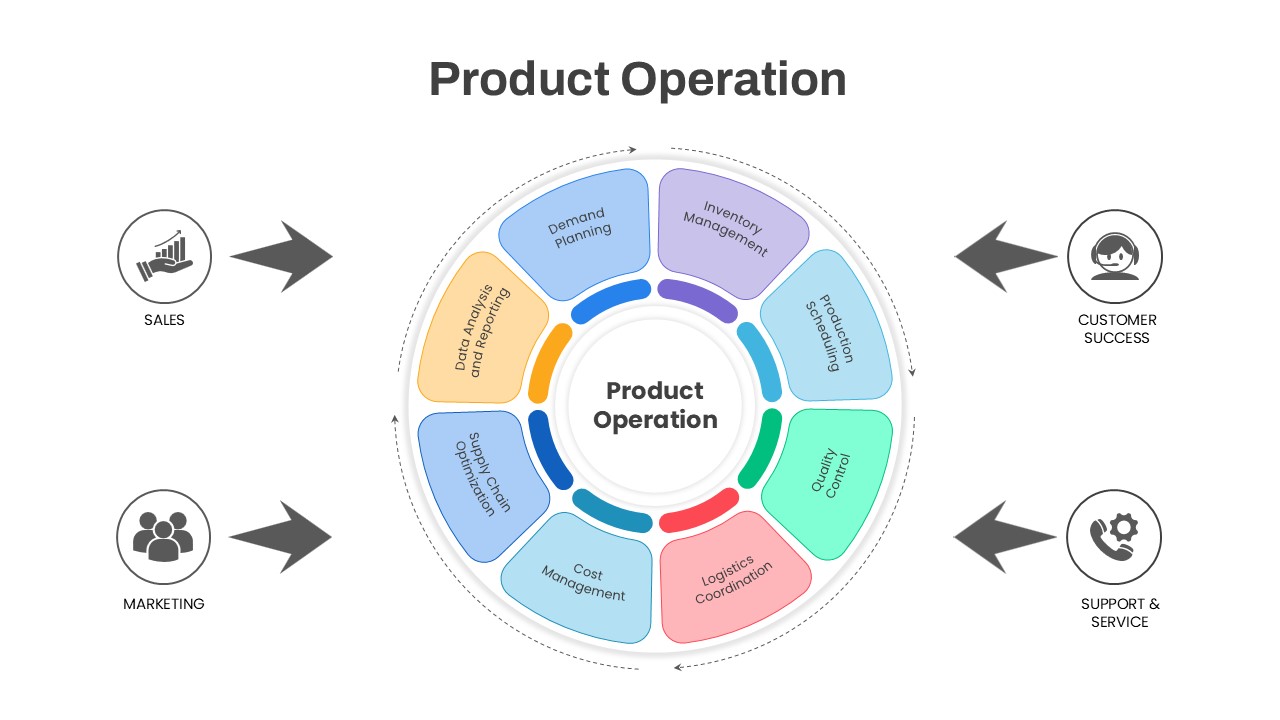
Product Operation Process Diagram Template for PowerPoint & Google Slides
Process

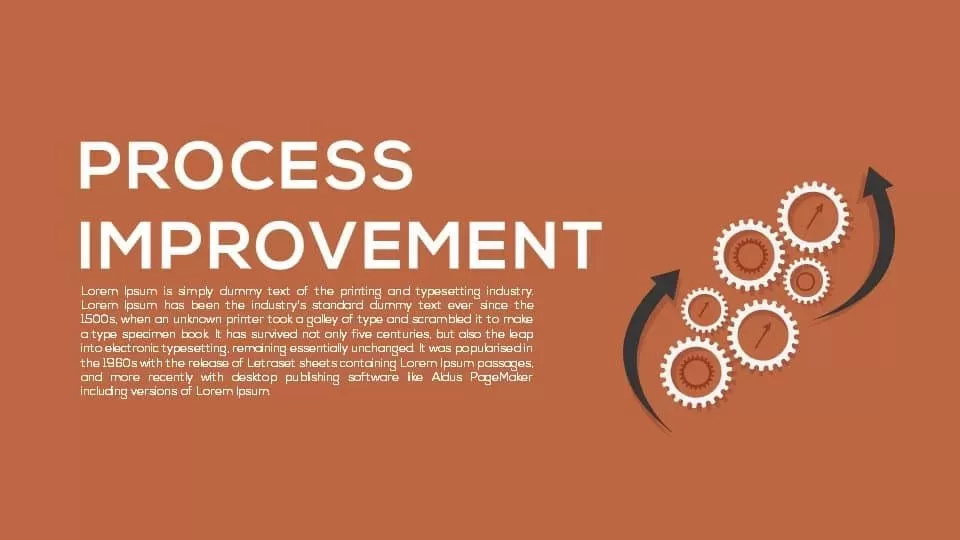
Process Improvement Metaphor Diagram Template for PowerPoint & Google Slides
Process
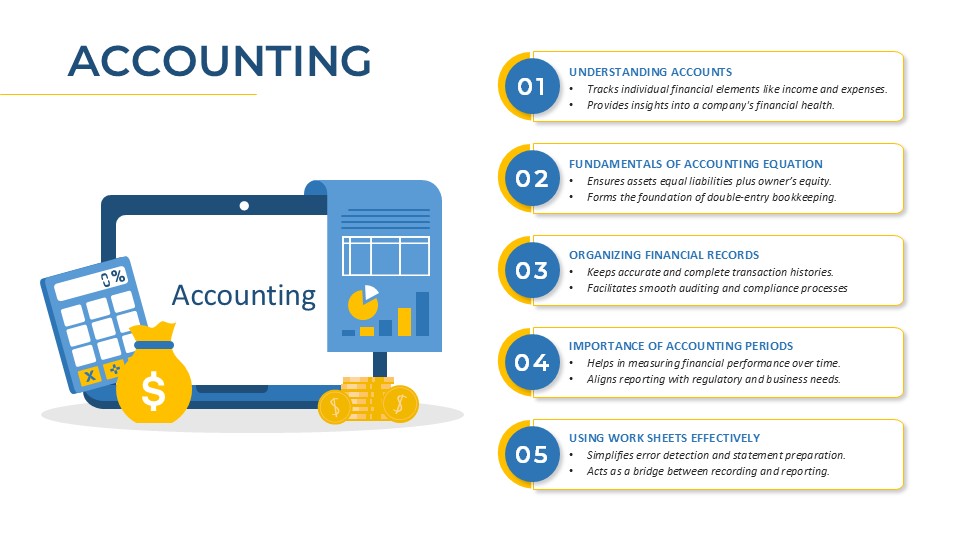
Accounting Process Metaphor Diagram Template for PowerPoint & Google Slides
Accounting
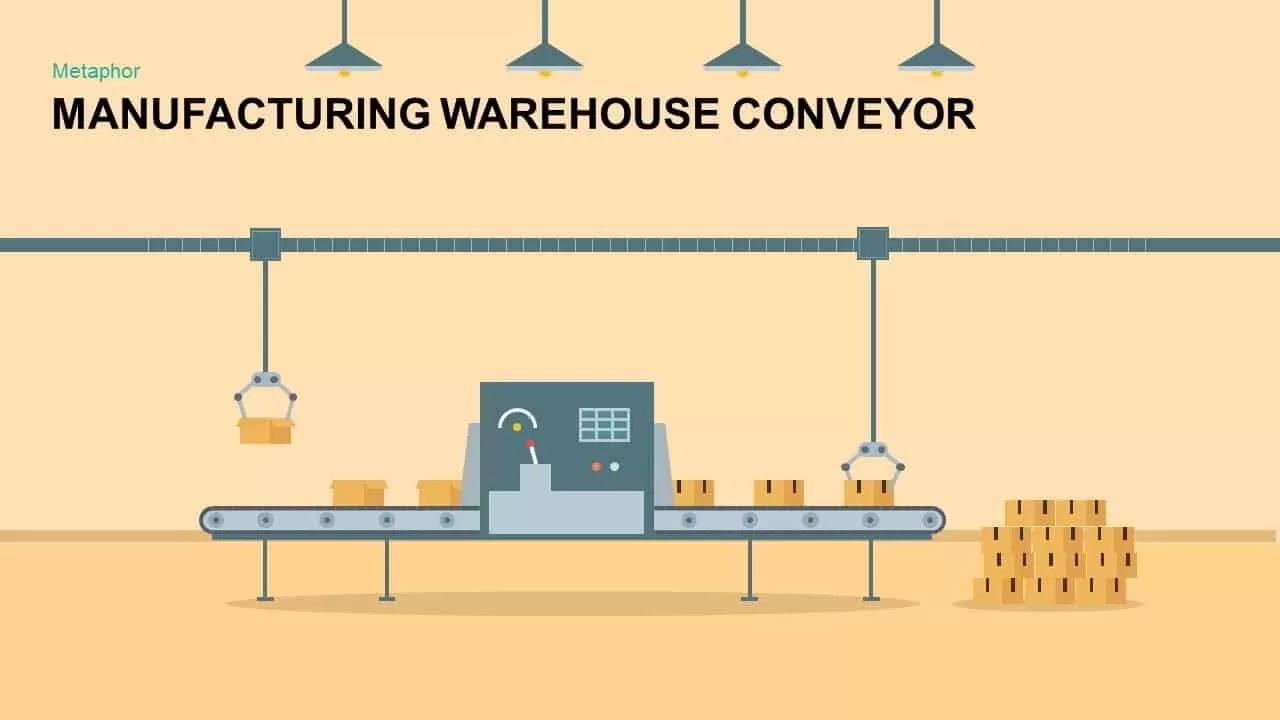
Warehouse Conveyor Process Metaphor Template for PowerPoint & Google Slides
Process

Strength Metaphor Dumbbell Diagram Template for PowerPoint & Google Slides
Accomplishment
Professional Security Metaphor Diagram Template for PowerPoint & Google Slides
Information Technology
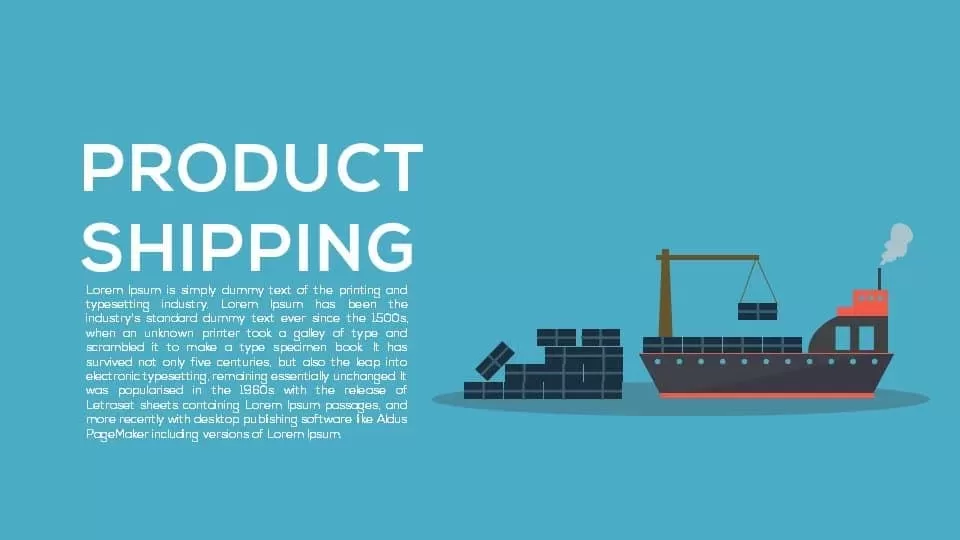
Product Shipping Metaphor Diagram Template for PowerPoint & Google Slides
Process
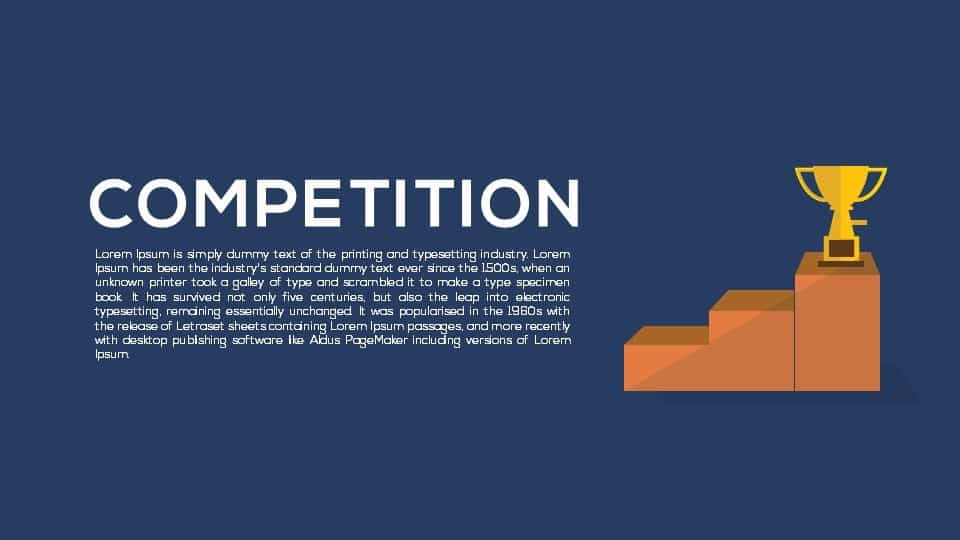
Competition Metaphor Podium Diagram Template for PowerPoint & Google Slides
Business
Cyber Security Metaphor Diagram Template for PowerPoint & Google Slides
Risk Management
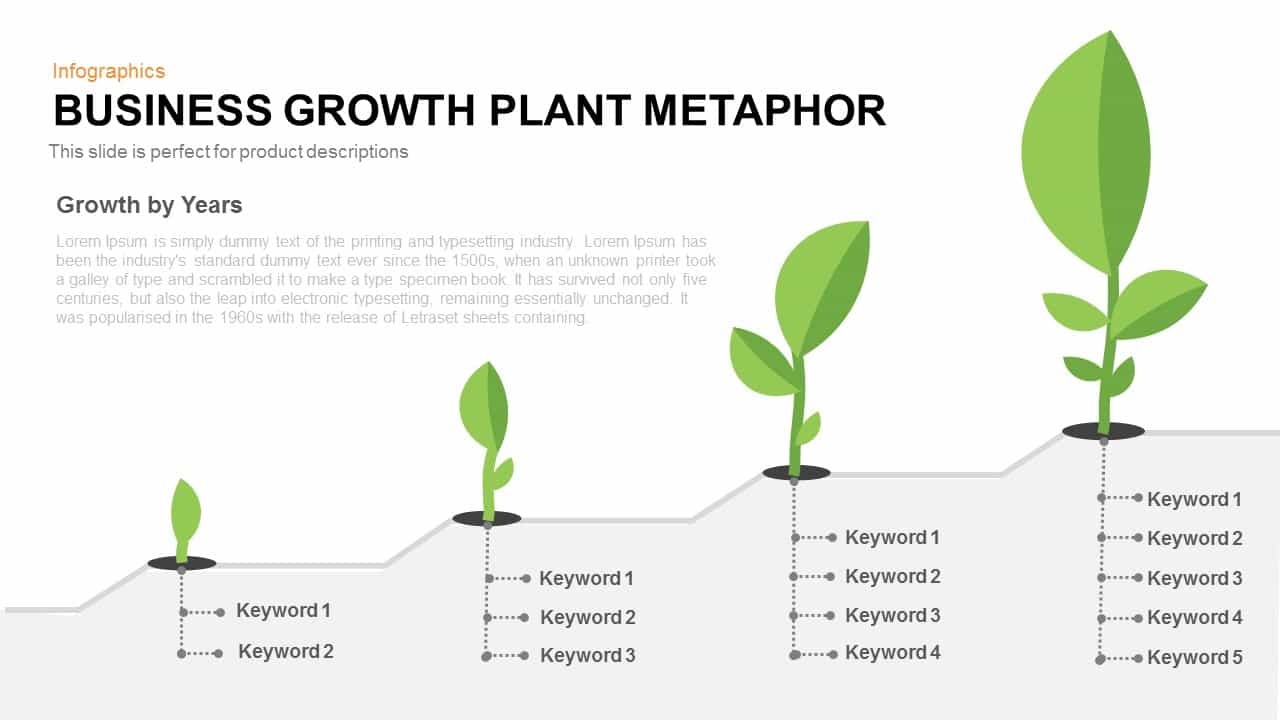
Business Growth Plant Metaphor Timeline Template for PowerPoint & Google Slides
Business Strategy
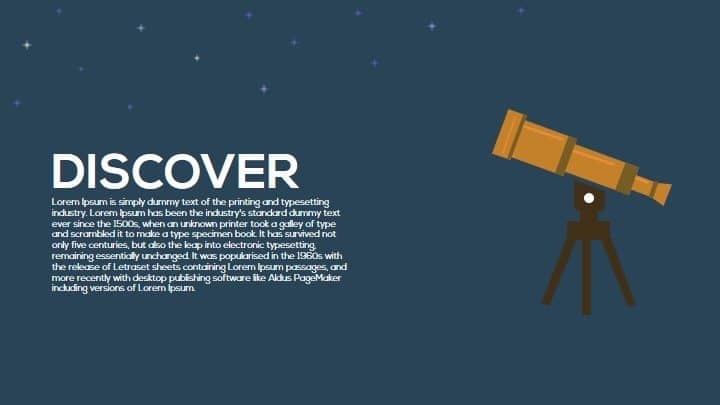
Discover Metaphor Concept Slide Template for PowerPoint & Google Slides
Infographics
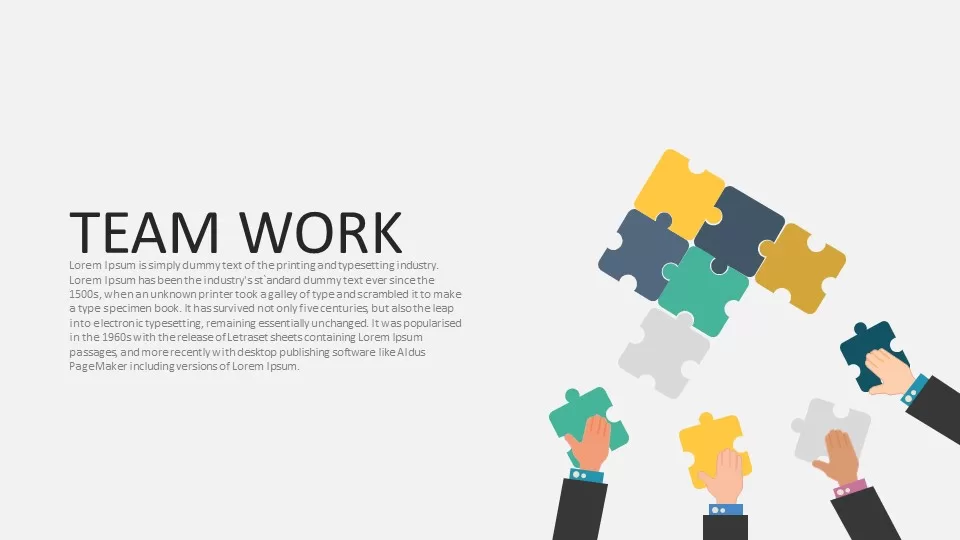
Teamwork Puzzle Metaphor Slide Template for PowerPoint & Google Slides
Our Team
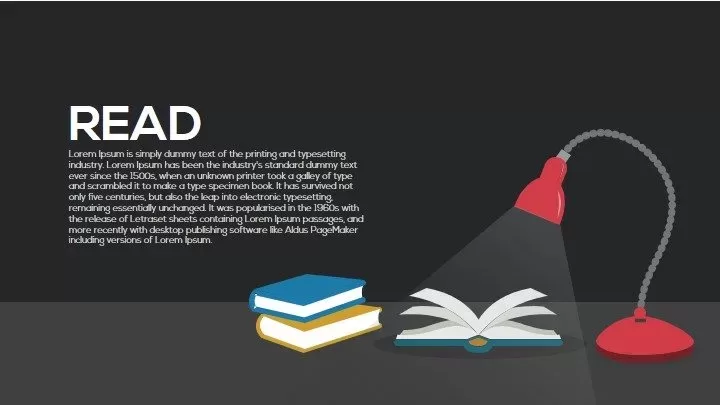
Read Metaphor Concept Illustration Slide Template for PowerPoint & Google Slides
Infographics
Metaphor Light Bulb Idea Concept Template for PowerPoint & Google Slides
Infographics
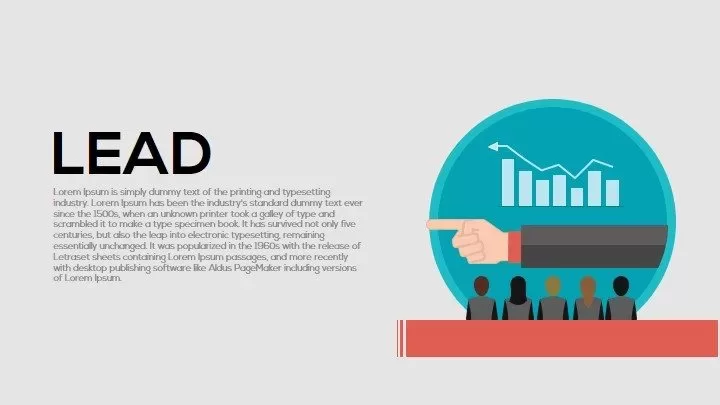
Leadership Metaphor Presentation Slide Template for PowerPoint & Google Slides
Leadership
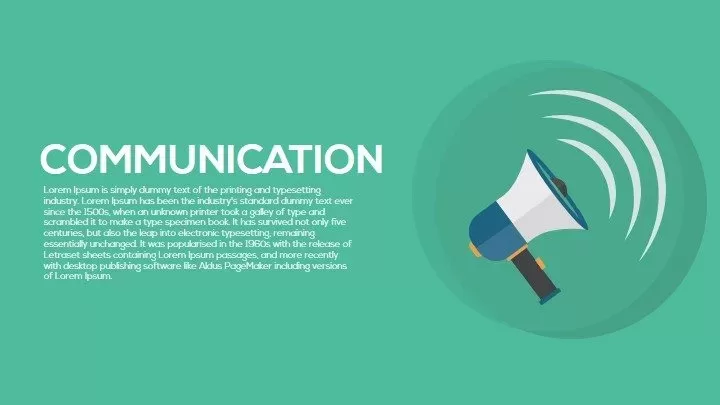
Megaphone Communication Metaphor Template for PowerPoint & Google Slides
Advertising
Metaphor Multitasking Illustration Template for PowerPoint & Google Slides
Business
Metaphor Knowledge Illustration Slide Template for PowerPoint & Google Slides
Infographics
Rebuild Brick Wall Metaphor Slide Template for PowerPoint & Google Slides
Infographics
Efficiency KPI Dashboard Metaphor Template for PowerPoint & Google Slides
Infographics
Destination Roadmap Pin Metaphor Template for PowerPoint & Google Slides
Roadmap
Metaphor Speed Template for PowerPoint & Google Slides
Process
Scale Metaphor Metrics Comparison Template for PowerPoint & Google Slides
Charts
Key Metaphor Infographic Slide Template for PowerPoint & Google Slides
Process
Mustard and Navy Balance Scale Metaphor Template for PowerPoint & Google Slides
Comparison
Shield Metaphor Security and Protection Template for PowerPoint & Google Slides
Risk Management
Magnifying Glass Research Metaphor Template for PowerPoint & Google Slides
Process
Business Opportunity Metaphor Slide Template for PowerPoint & Google Slides
Opportunities Challenges
Productivity Metaphor Clock Icon Template for PowerPoint & Google Slides
Graphics
Explore Binoculars Metaphor Slide Template for PowerPoint & Google Slides
Process
Guide Metaphor Navigation Infographic Template for PowerPoint & Google Slides
Process
Office Workspace Metaphor Slide Template for PowerPoint & Google Slides
Business Proposal
Navigation Compass Metaphor Slide Template for PowerPoint & Google Slides
Vision and Mission
Deadline Metaphor Timeline & Hourglass Template for PowerPoint & Google Slides
Project
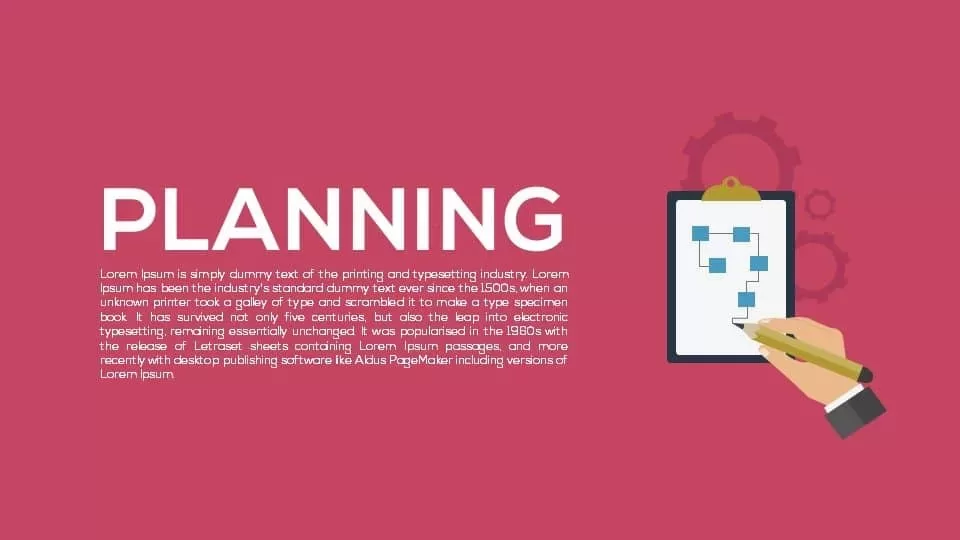
Planning Metaphor Flowchart Slide Template for PowerPoint & Google Slides
Process
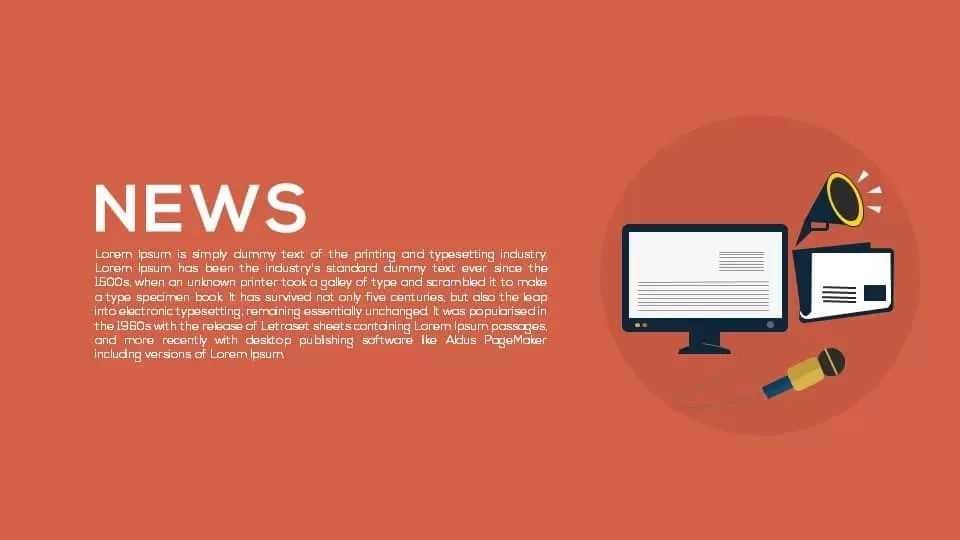
News Metaphor Media Communication Slide Template for PowerPoint & Google Slides
Business Report
Improvement Growth Arrow Metaphor Template for PowerPoint & Google Slides
Bar/Column
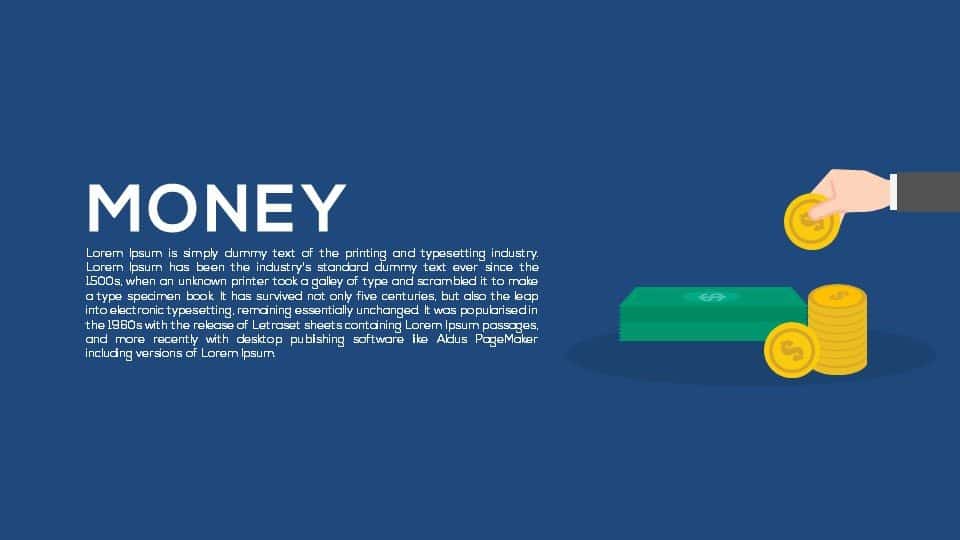
Money Metaphor Financial Overview Template for PowerPoint & Google Slides
Finance
Dual Percentage Comparison Metaphor Template for PowerPoint & Google Slides
Comparison

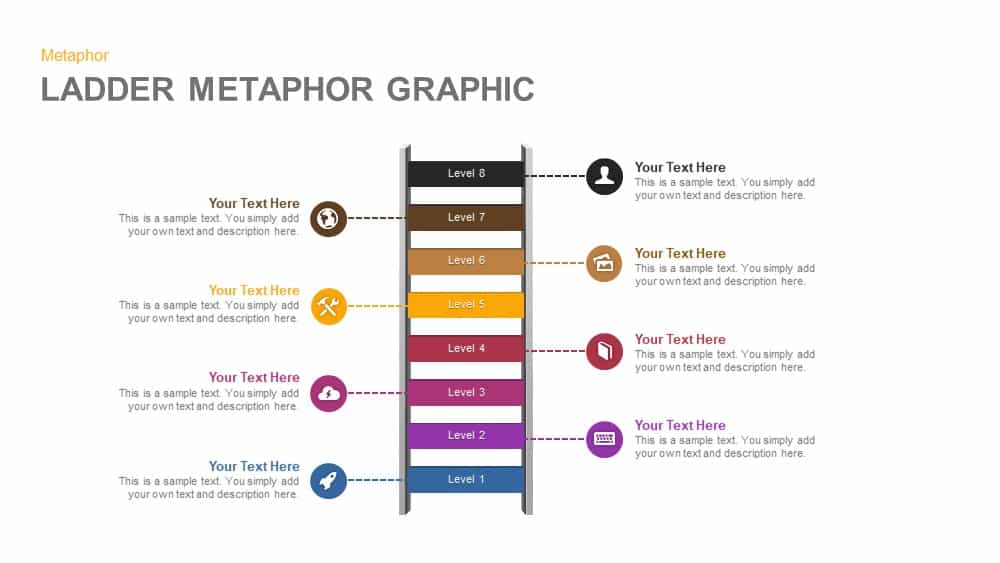
Eight-Level Ladder Metaphor Graphic Template for PowerPoint & Google Slides
Process
Business Decision-Making Metaphor Template for PowerPoint & Google Slides
Leadership
Developer Icons Metaphor Slide Template for PowerPoint & Google Slides
Software Development
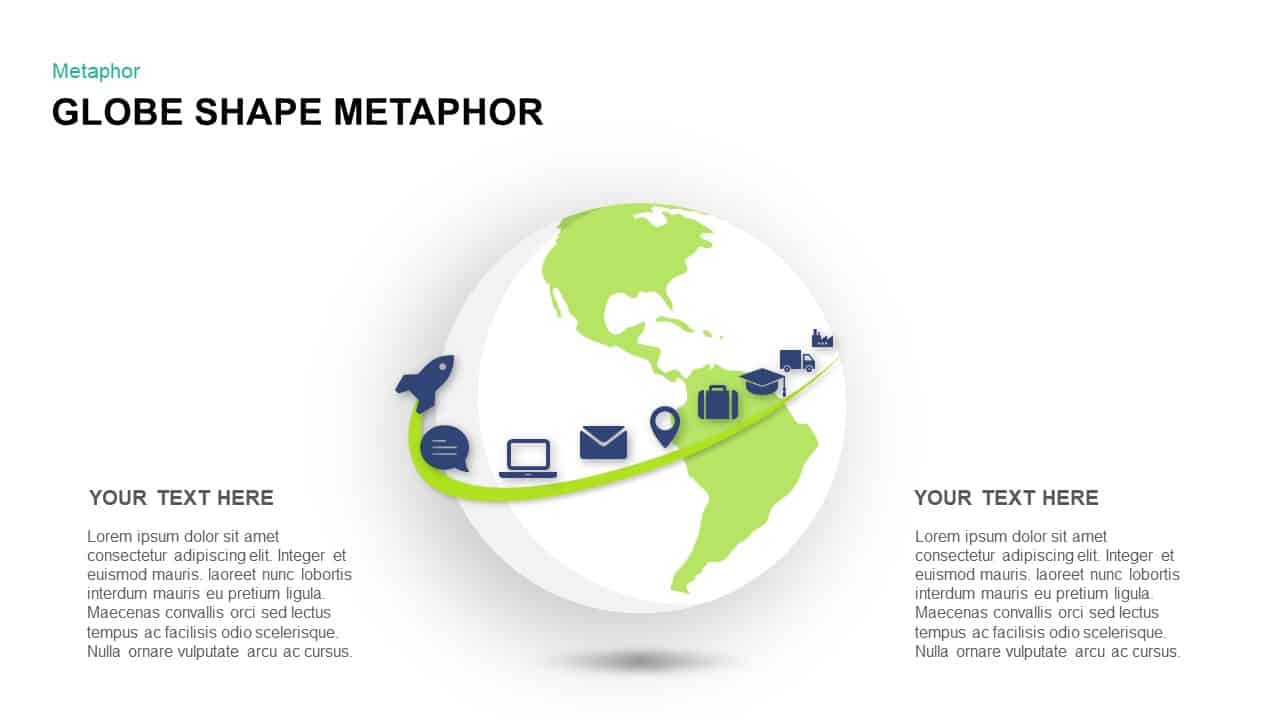
Global Business Pathway Metaphor Template for PowerPoint & Google Slides
Opportunities Challenges

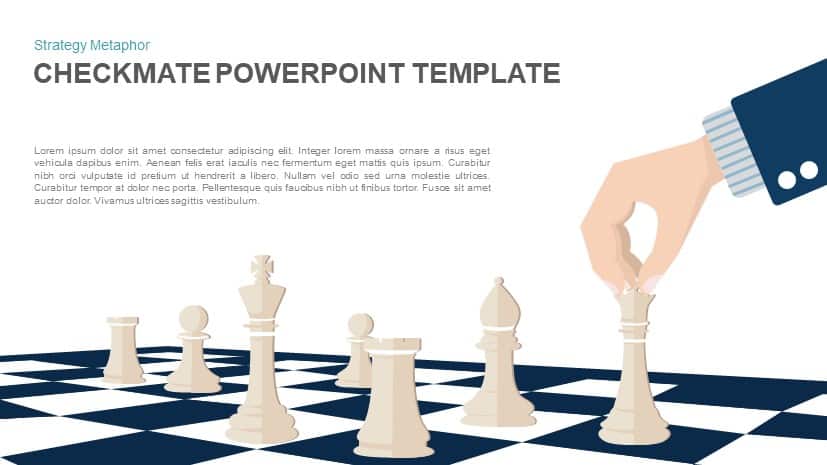
Checkmate Strategy Chess Metaphor Template for PowerPoint & Google Slides
Opportunities Challenges
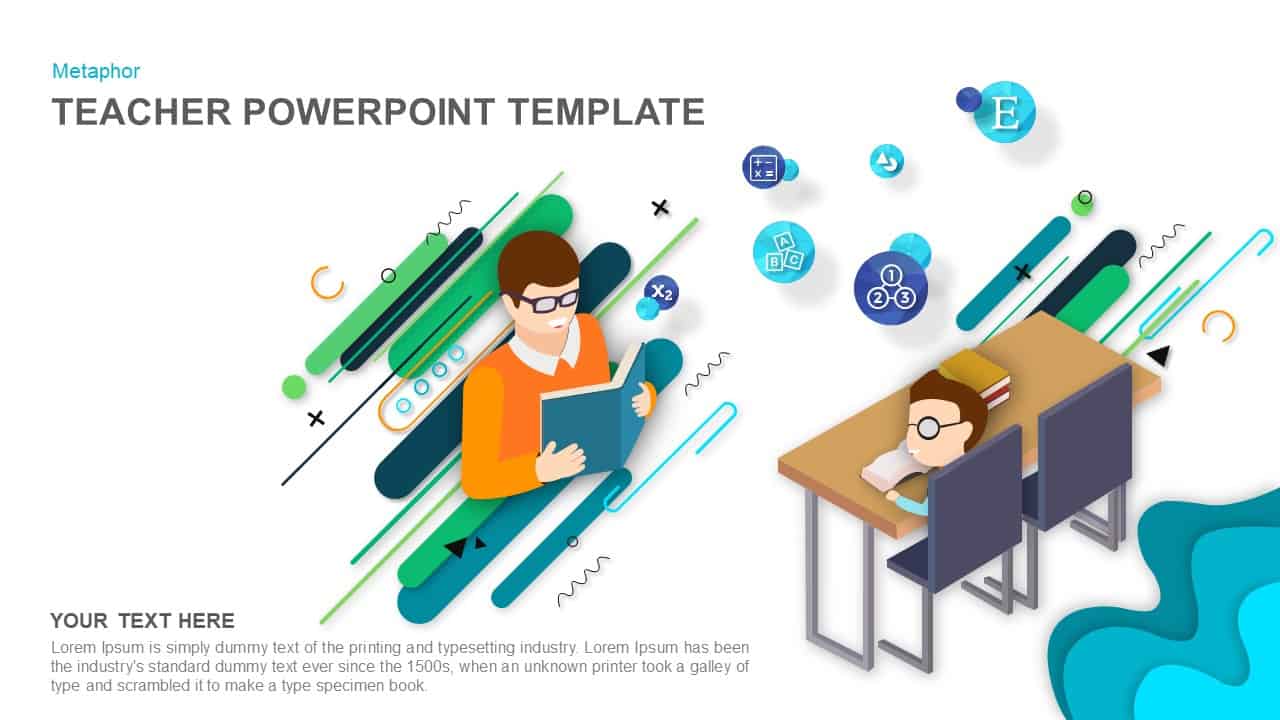
Teacher Illustration Metaphor Slide Template for PowerPoint & Google Slides
Process
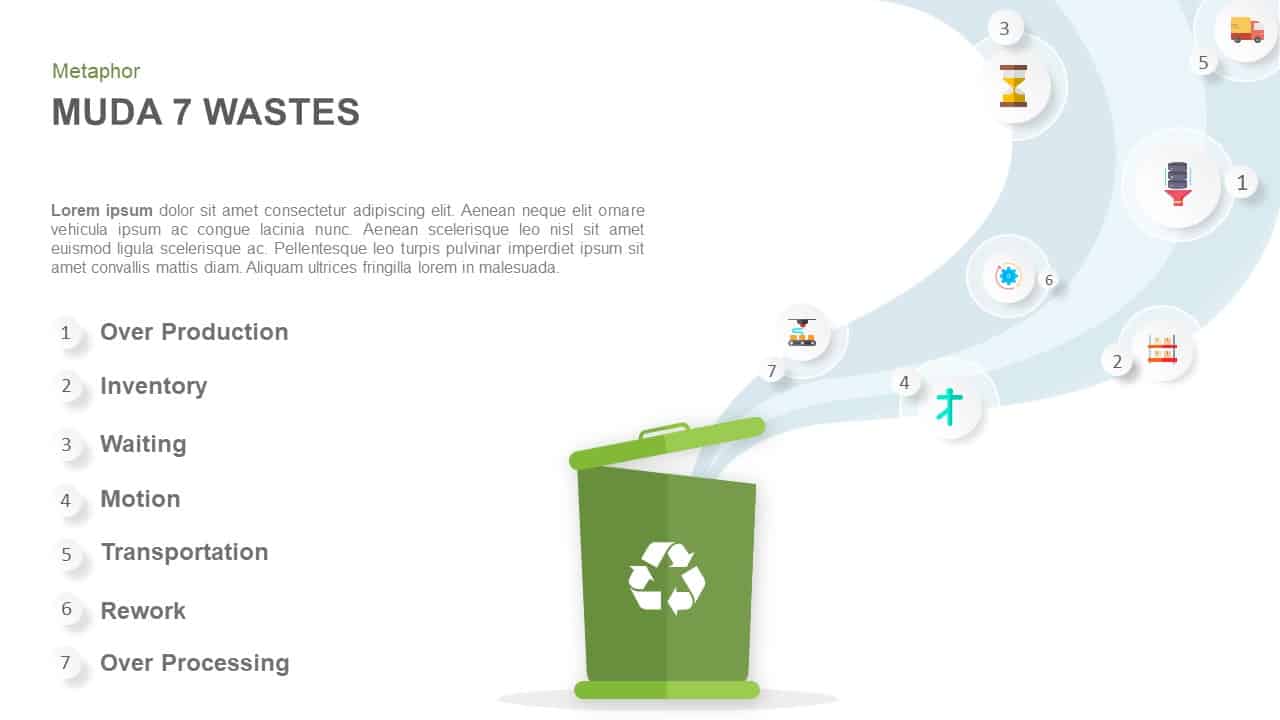
Muda 7 Wastes Recycling Bin Metaphor Template for PowerPoint & Google Slides
Process

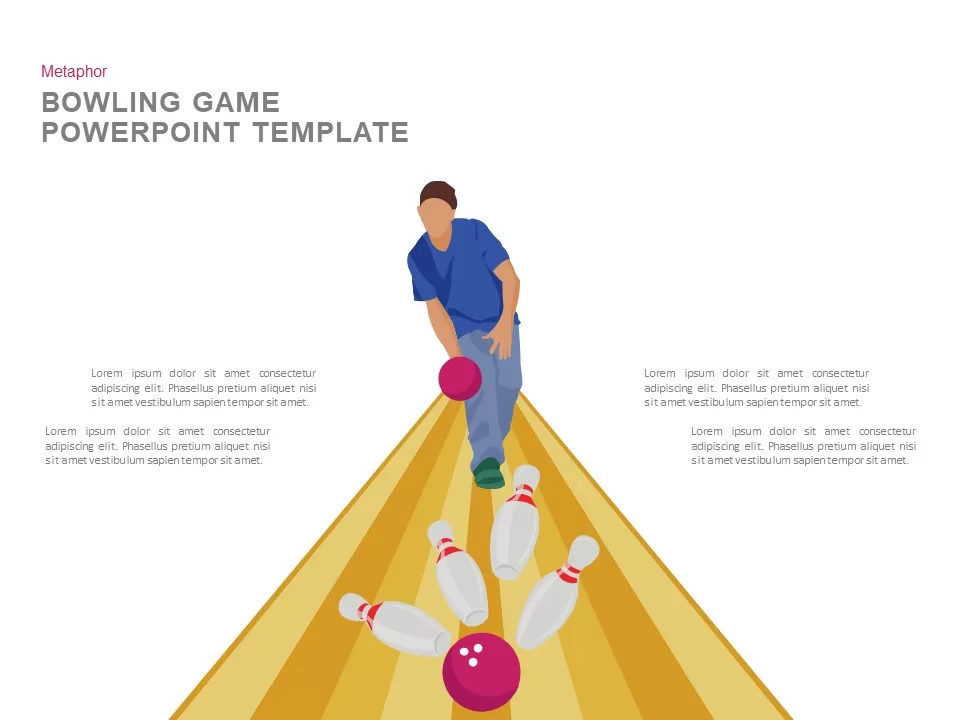
Bowling Game Illustration Metaphor Template for PowerPoint & Google Slides
Process
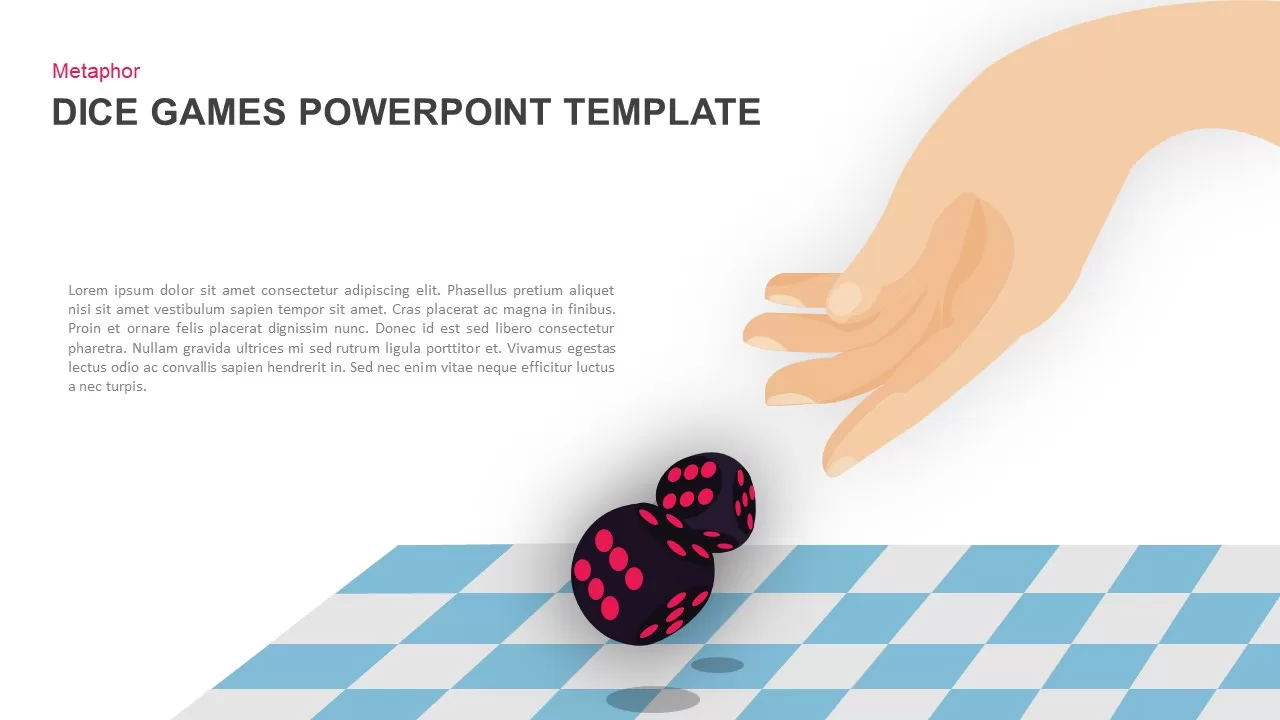
Dice Game Throwing Metaphor Slide Template for PowerPoint & Google Slides
Process
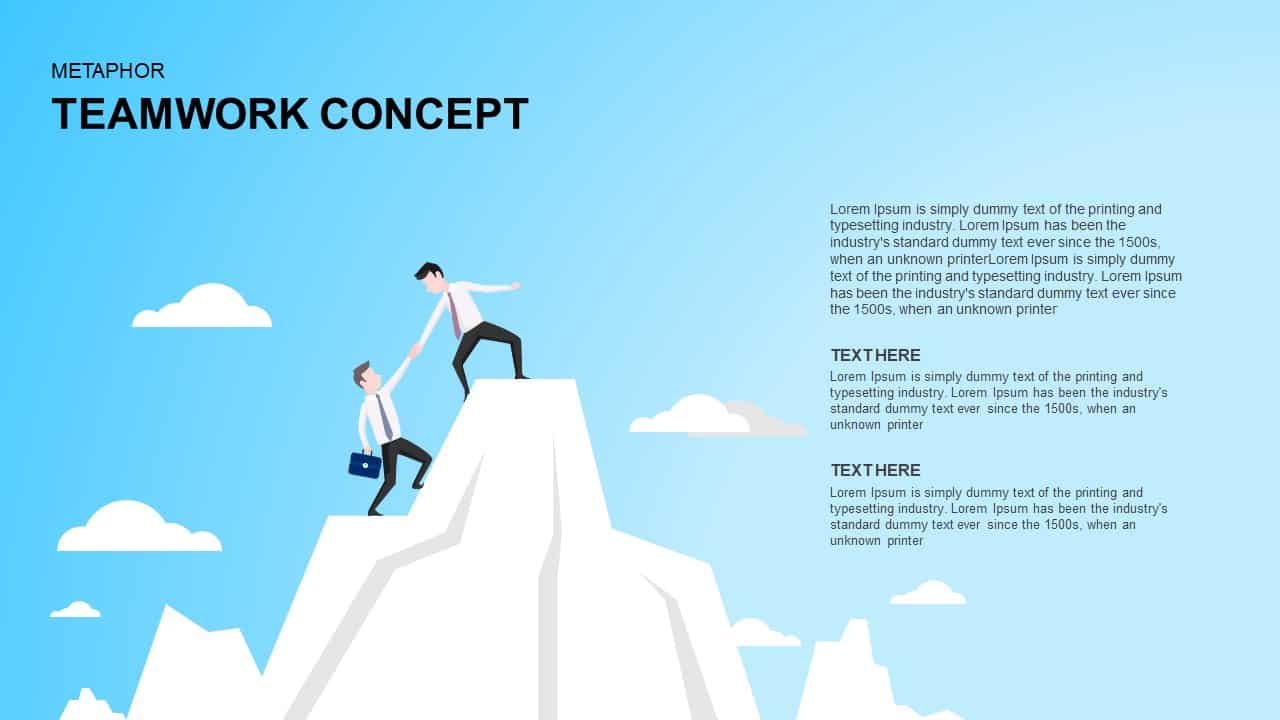
Teamwork Concept Metaphor Template for PowerPoint & Google Slides
Leadership
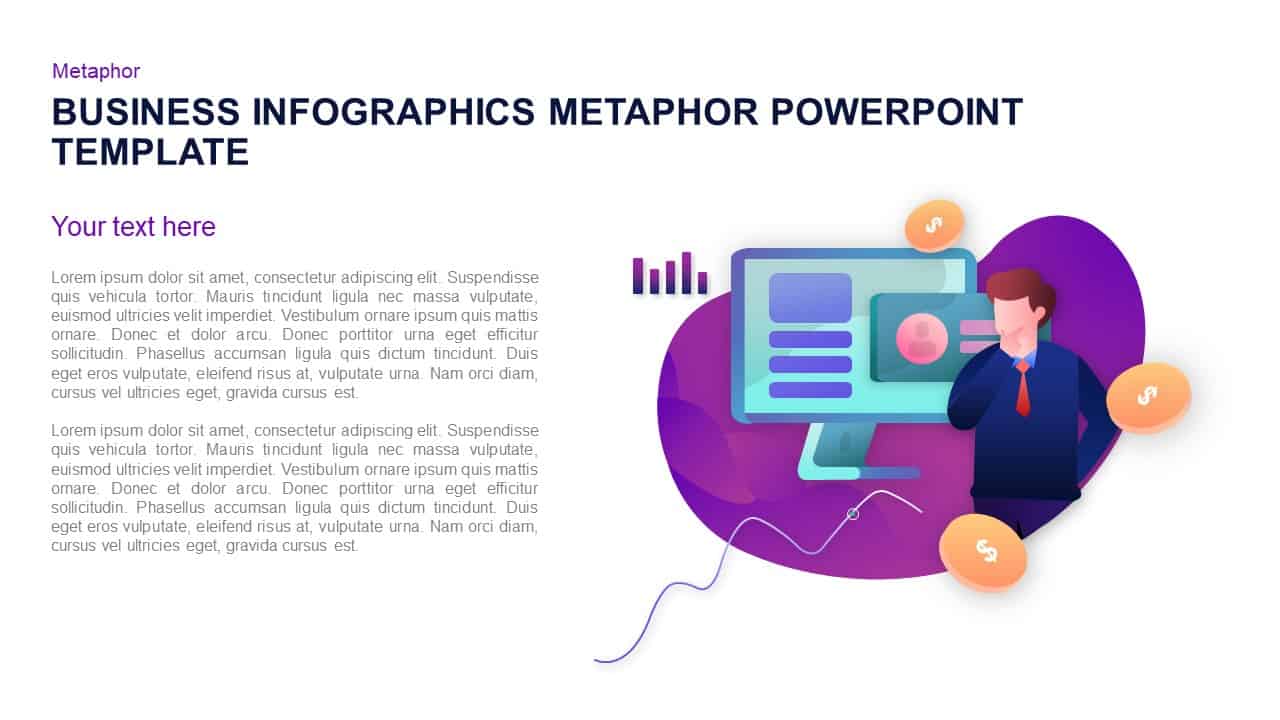
Business Growth Infographic Metaphor Template for PowerPoint & Google Slides
Revenue
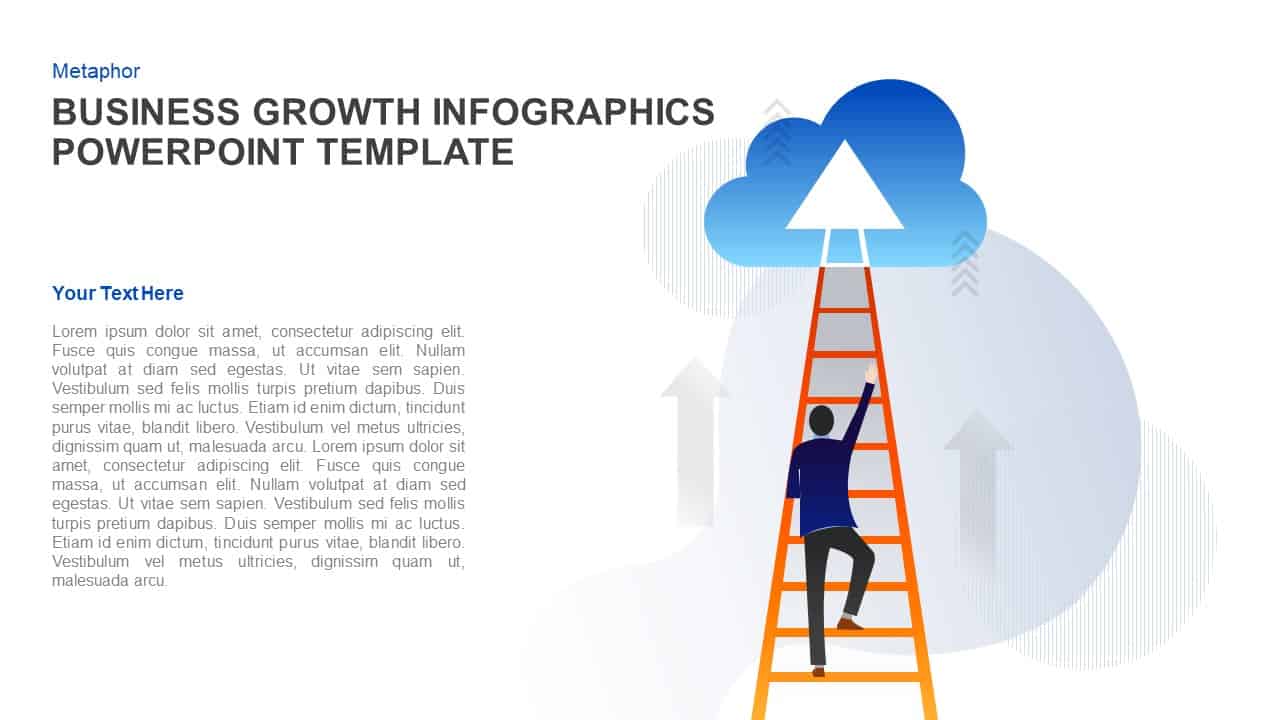
Business Growth Ladder to Cloud Metaphor Template for PowerPoint & Google Slides
Vision and Mission
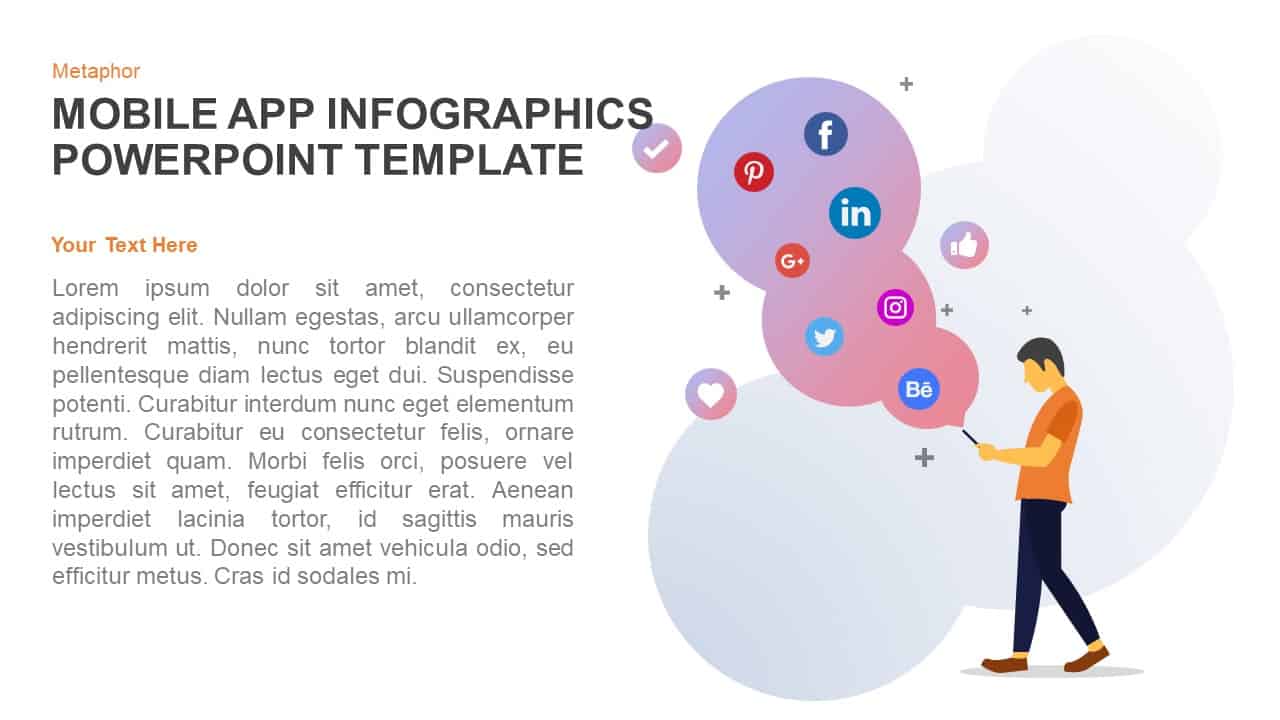
Mobile App Social Media Metaphor Template for PowerPoint & Google Slides
Infographics
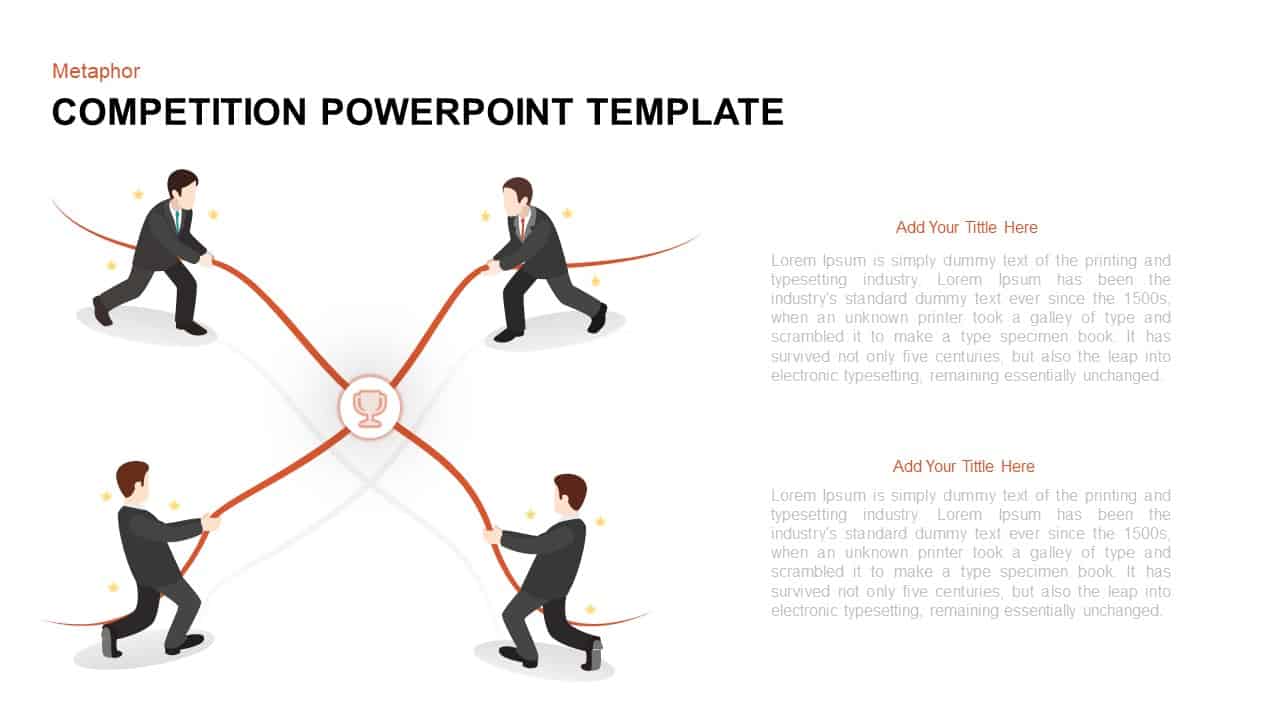
Competitive Tug-of-War Metaphor Template for PowerPoint & Google Slides
Business Strategy
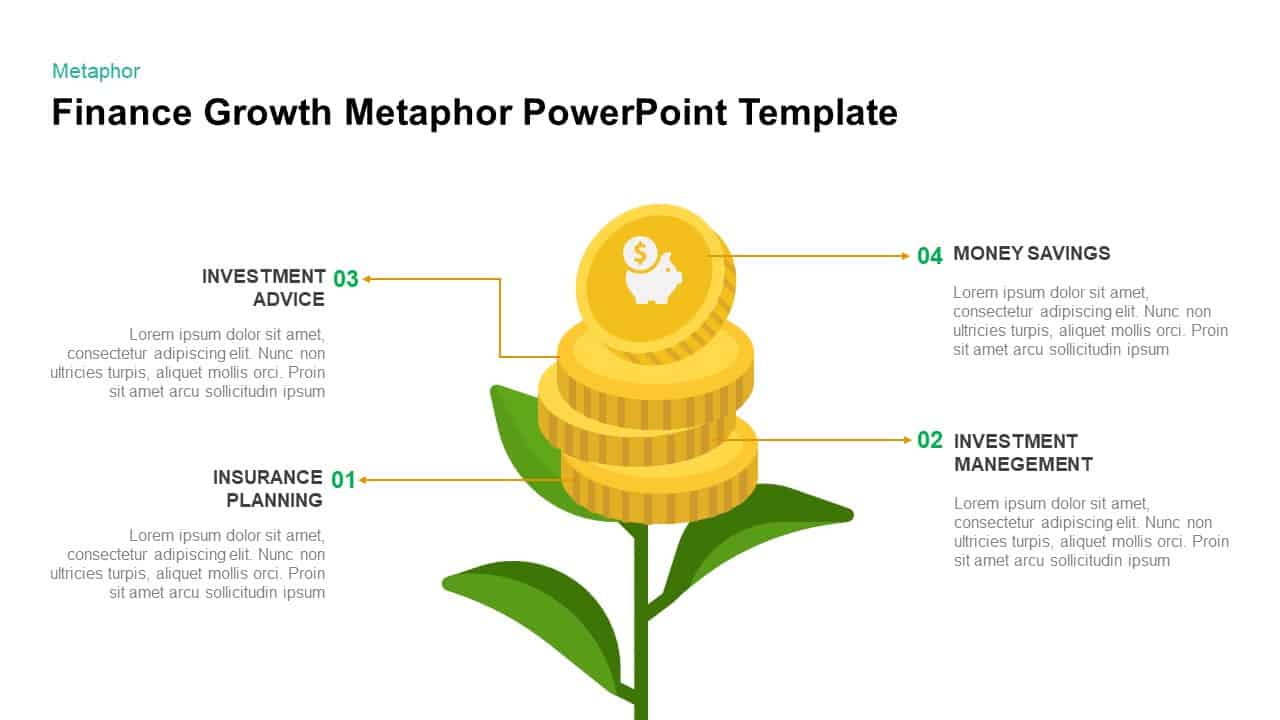
Finance Growth Plant Metaphor Slide Template for PowerPoint & Google Slides
Finance
Collaborative Teamwork Metaphor Illustration Template for PowerPoint & Google Slides
Leadership
Business Decision Making Metaphor Template for PowerPoint & Google Slides
Arrow
Social Media Metaphor Illustration Template for PowerPoint & Google Slides
Digital Marketing
Lead Generation Funnel Metaphor Template for PowerPoint & Google Slides
Marketing Funnel
SWOT Analysis Metaphor Illustration Template for PowerPoint & Google Slides
SWOT
Vibrant Digital Marketing Metaphor Template for PowerPoint & Google Slides
Advertising
Collaborative Teamwork Metaphor Slide Template for PowerPoint & Google Slides
Our Team
Customer Service Metaphor Infographic Template for PowerPoint & Google Slides
Customer Experience
Financial Report Metaphor Illustration Template for PowerPoint & Google Slides
Finance
Business Growth Metaphor Chart Template for PowerPoint & Google Slides
Business
Teamwork Metaphor Illustration Template for PowerPoint & Google Slides
Leadership
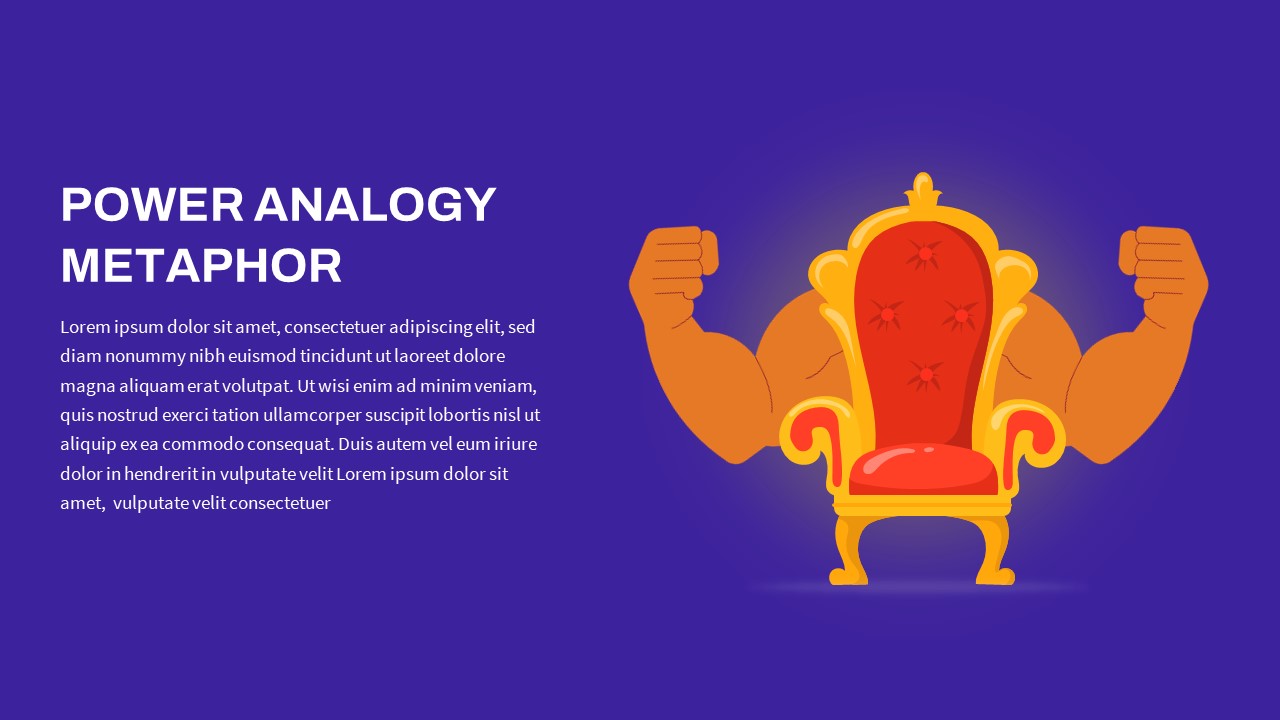
Creative Power Analogy Metaphor Slide Template for PowerPoint & Google Slides
Leadership
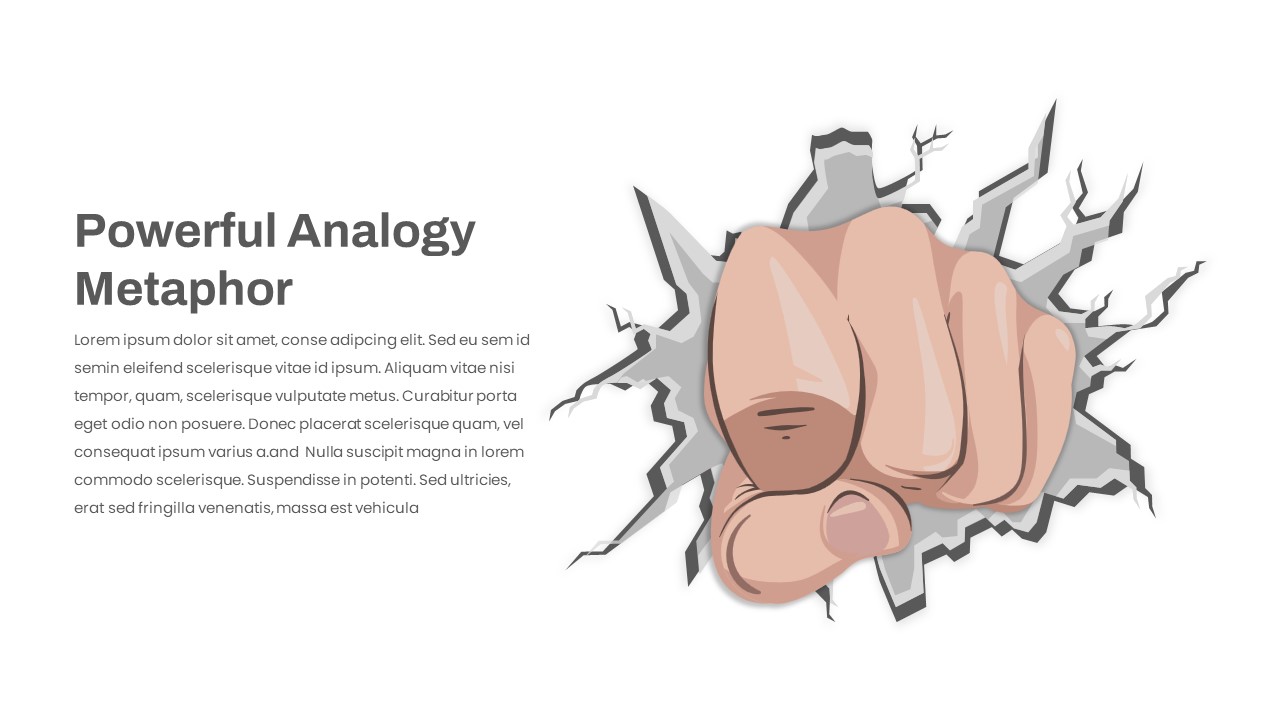
Powerful Visual Metaphor Analogy Slide Template for PowerPoint & Google Slides
Opportunities Challenges
Relay Race Metaphor for PowerPoint & Google Slides
Accomplishment
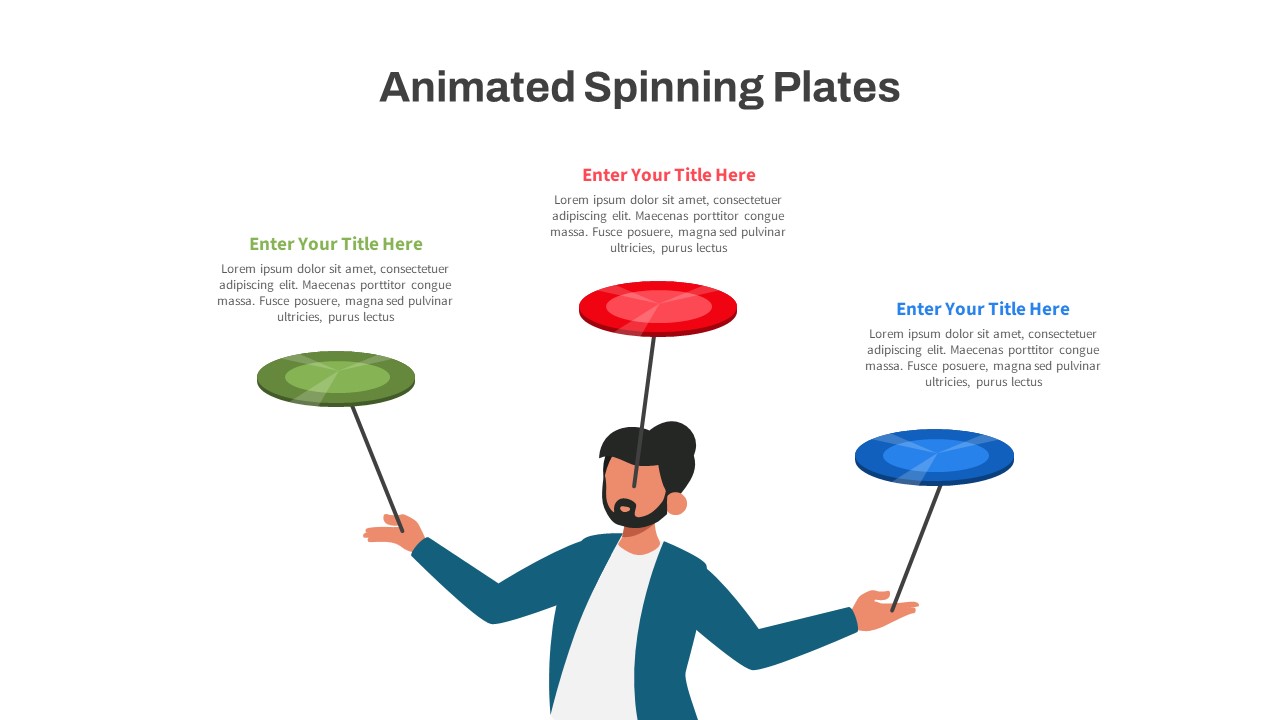
Animated Spinning Plates Metaphor Slide for PowerPoint & Google Slides
Infographics
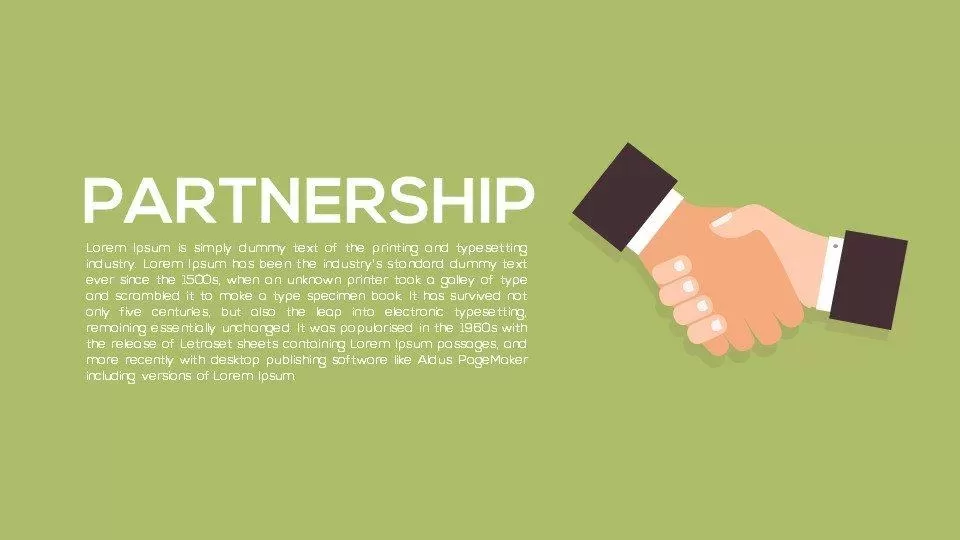
Metaphor Partnership PowerPoint Template and Keynote Template
Opportunities Challenges
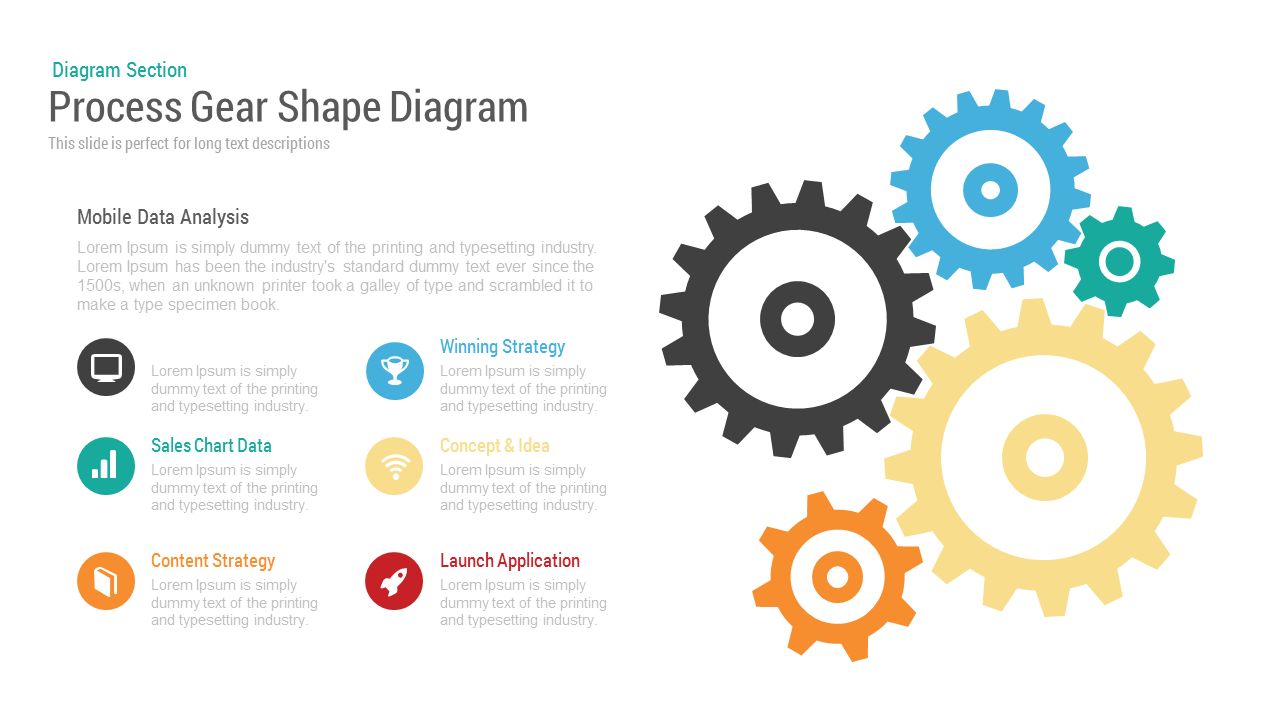
Gear Process Diagram PowerPoint Template for PowerPoint & Google Slides
Process
Sales Process Workflow Funnel Diagram PowerPoint Template for PowerPoint & Google Slides
Funnel
Gear Process Diagram template for PowerPoint & Google Slides
Process
Three Circle Arrow Process Diagram template for PowerPoint & Google Slides
Circular

Five-Step Gear Process Diagram Template for PowerPoint & Google Slides
Process
Arrow Stage Process Diagram template for PowerPoint & Google Slides
Arrow
Dynamic 4 Gear Process Diagram Template for PowerPoint & Google Slides
Process
Modern Five-Stage Cycle Process Diagram Template for PowerPoint & Google Slides
Process
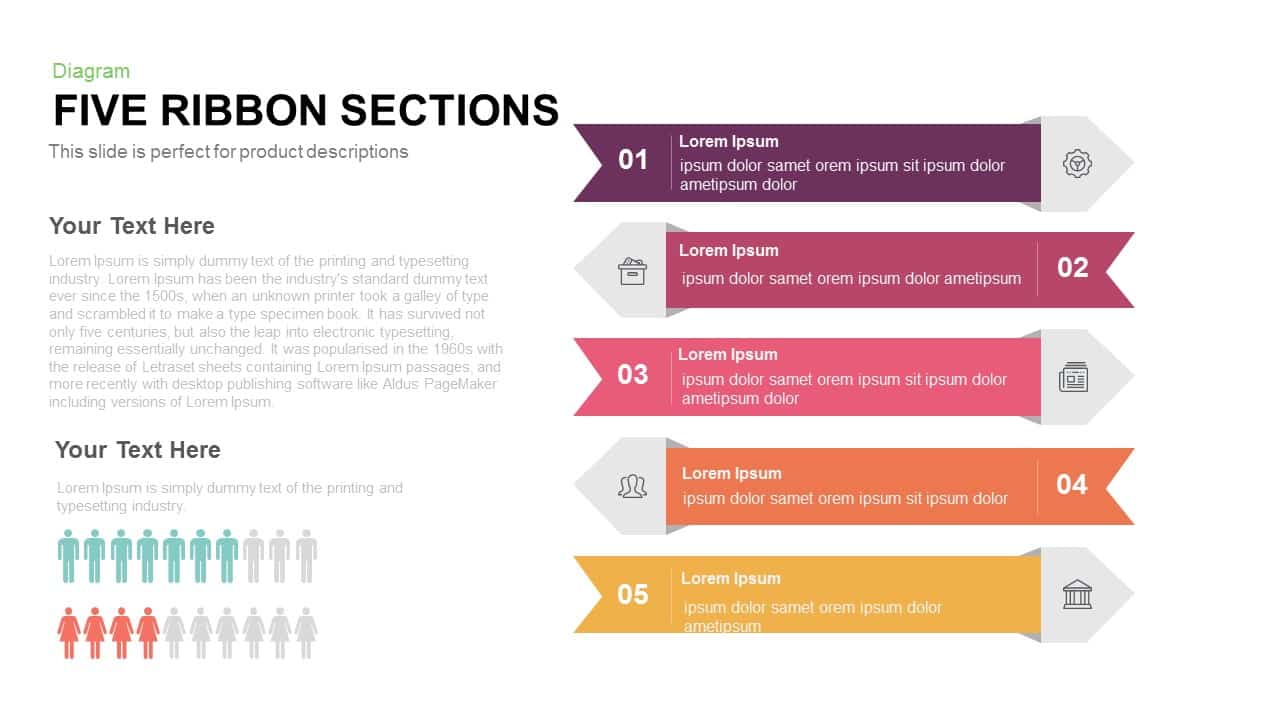
Five Ribbon Sections Process Diagram Template for PowerPoint & Google Slides
Process
Five Stage Process Diagram Infographic Template for PowerPoint & Google Slides
Process

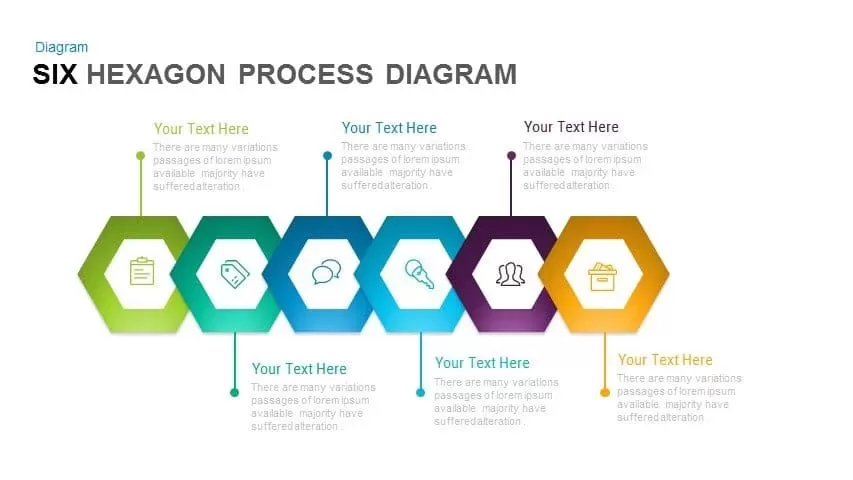
Six-Step Hexagon Process Diagram Template for PowerPoint & Google Slides
Process
10 Stages Business Flow Process Diagram template for PowerPoint & Google Slides
Business
Eight-Stage Radial Process Flow Diagram Template for PowerPoint & Google Slides
Process
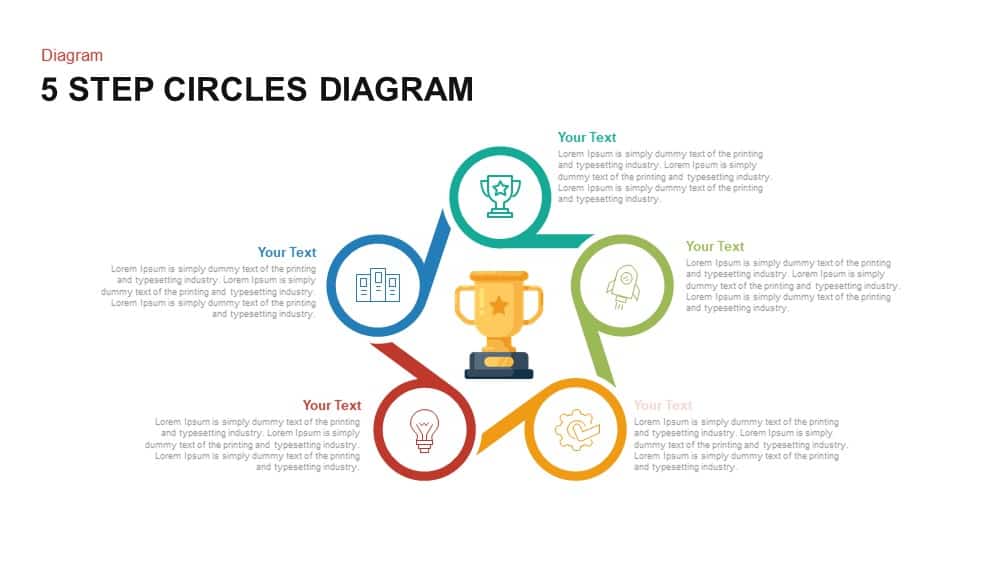
Modern Five-Step Circles Process Diagram Template for PowerPoint & Google Slides
Circular
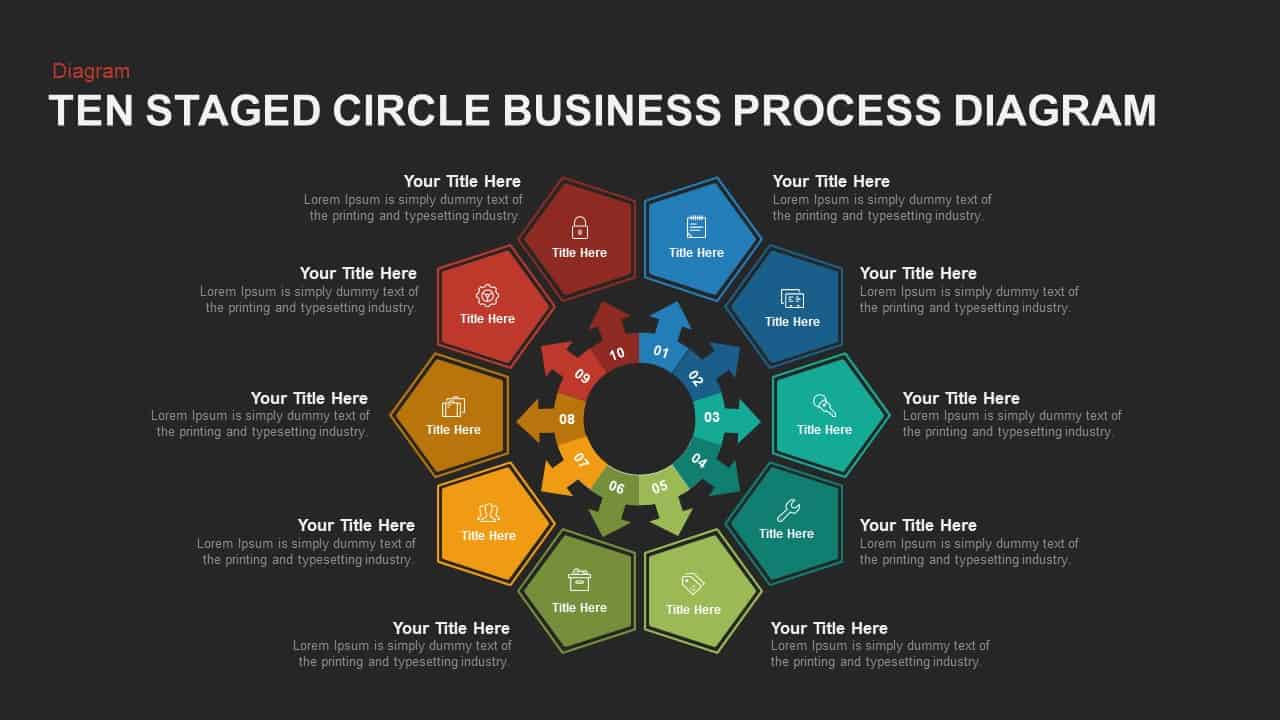
Ten-Stage Business Process Diagram Template for PowerPoint & Google Slides
Process
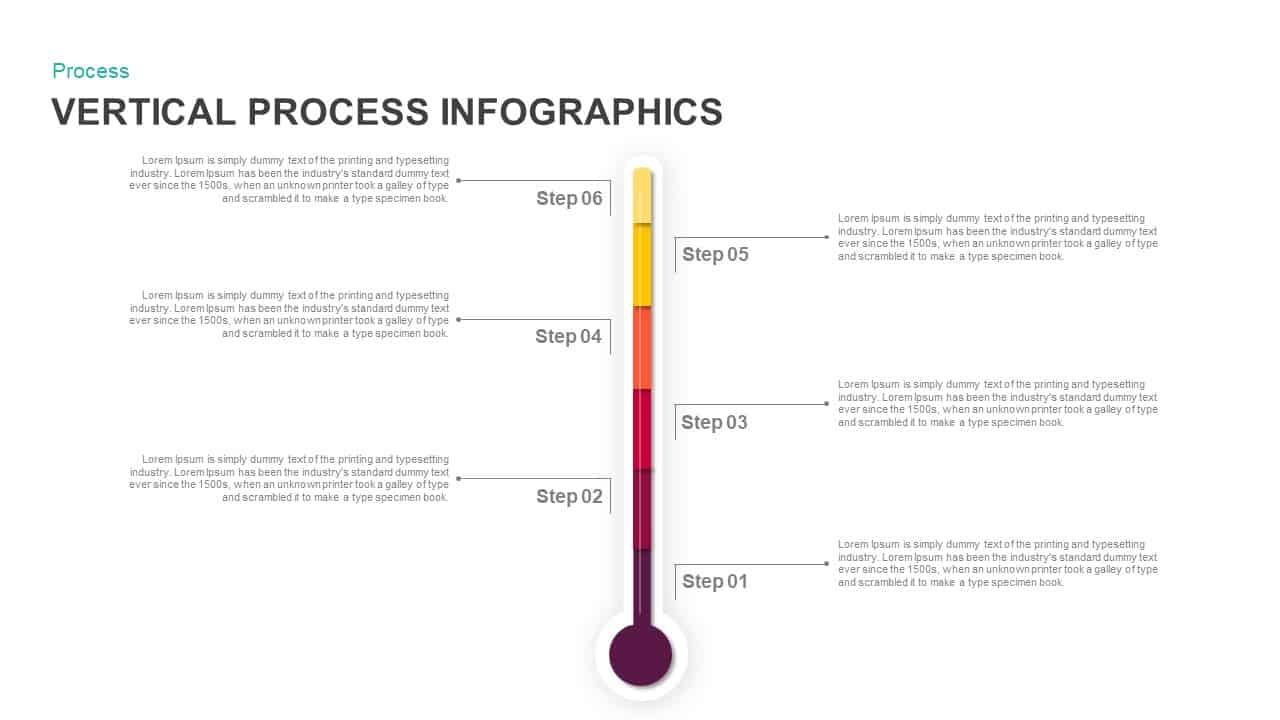
Six-Step Vertical Process Diagram Template for PowerPoint & Google Slides
Process
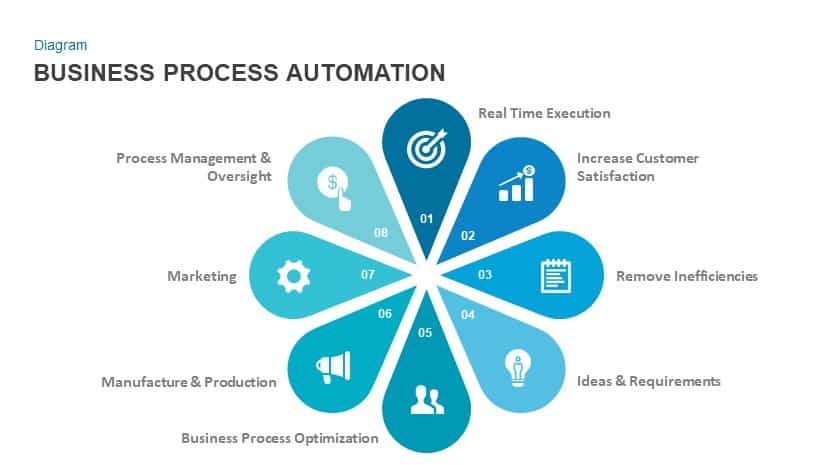
Business Process Automation Diagram Template for PowerPoint & Google Slides
Process
Free Six-Stage Arrow Process Diagram Template for PowerPoint & Google Slides
Process
Free
Six-Step Linear Arrow Process Diagram Template for PowerPoint & Google Slides
Process
Six-Stage Circular Diagram Process Template for PowerPoint & Google Slides
Circular
Six-Step Hexagon Process Flow Diagram Template for PowerPoint & Google Slides
Process
Three-Step Flowchart Process Diagram Template for PowerPoint & Google Slides
Flow Charts
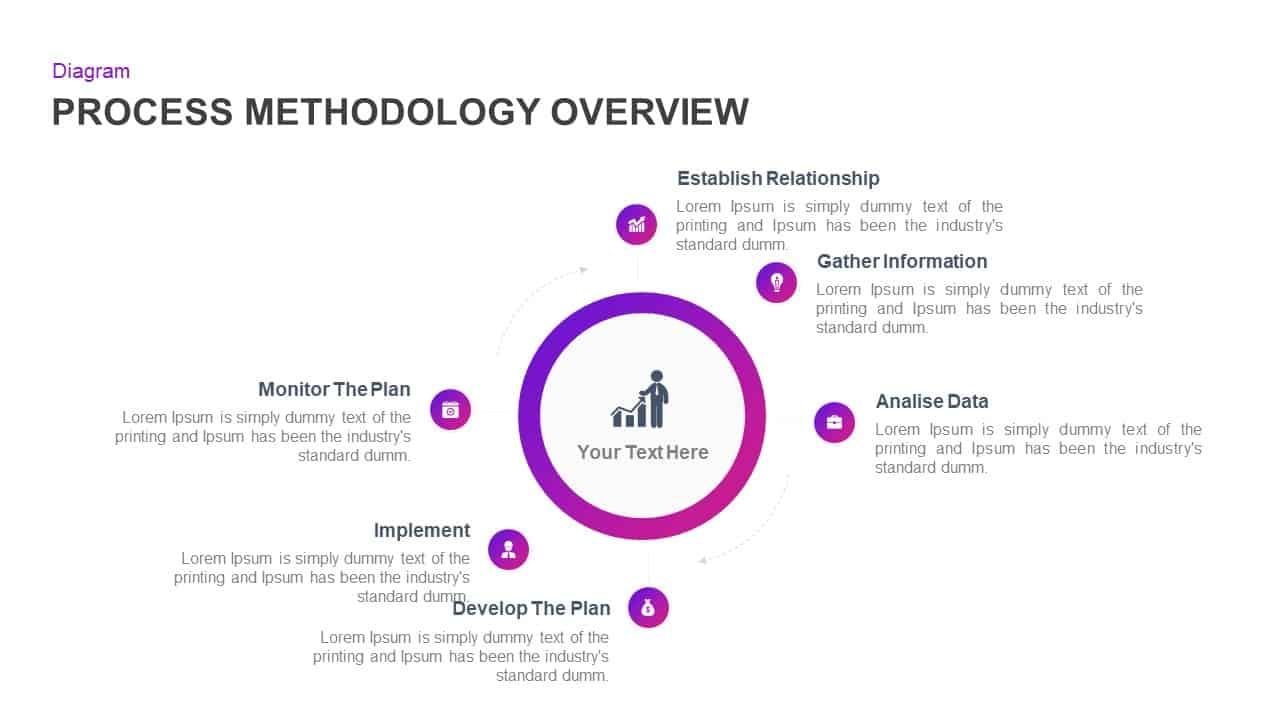
Process Methodology Overview Diagram Template for PowerPoint & Google Slides
Process
Business Process Management Flow Diagram Template for PowerPoint & Google Slides
Process

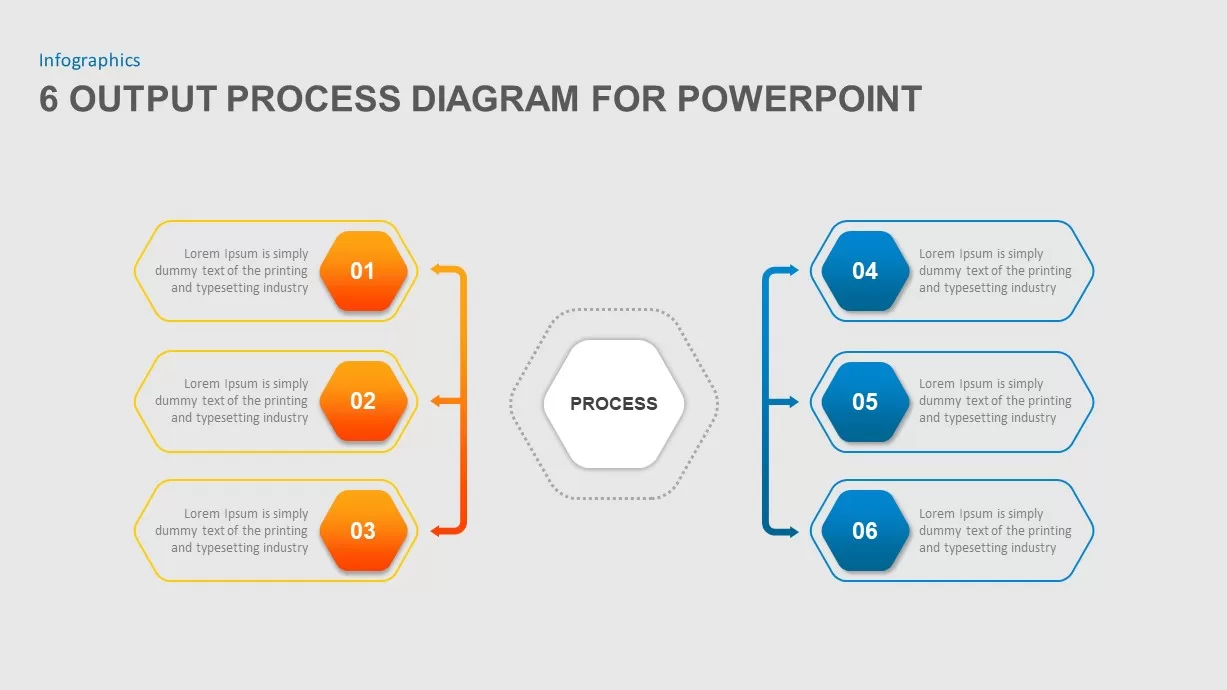
Six-Step Output Process Diagram Template for PowerPoint & Google Slides
Process
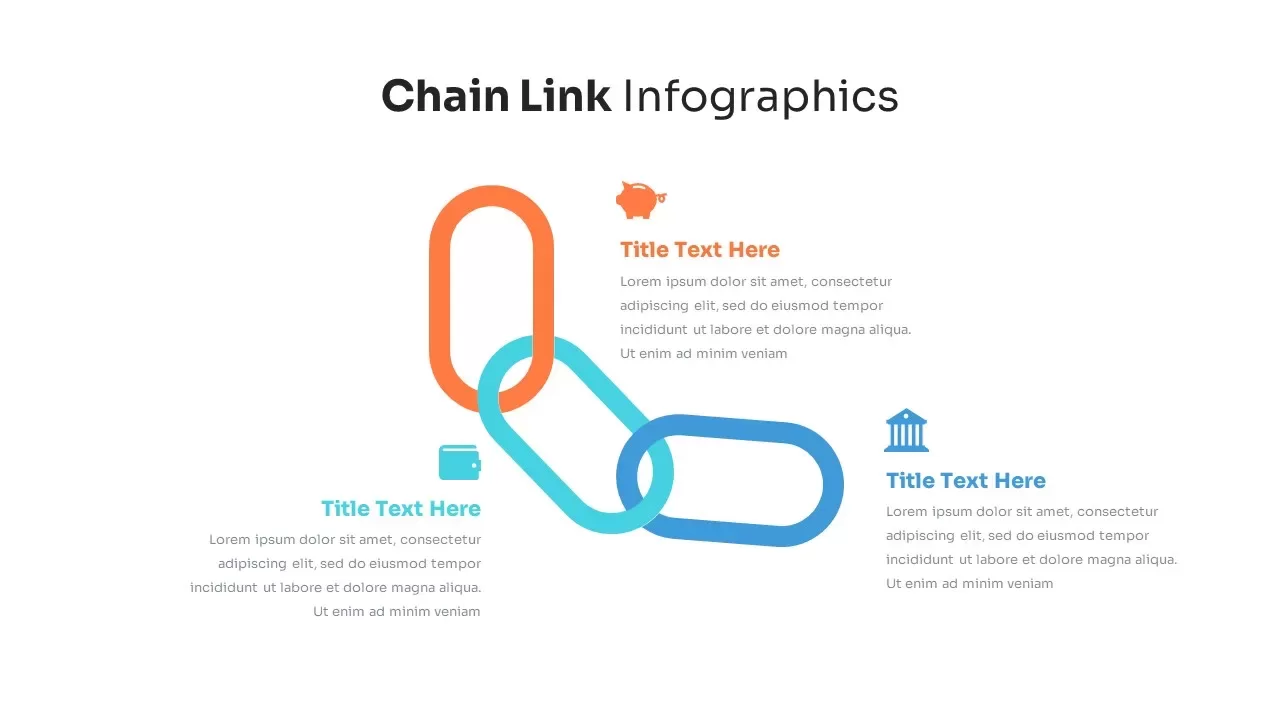
Chain Link Process Infographic Diagram Template for PowerPoint & Google Slides
Process
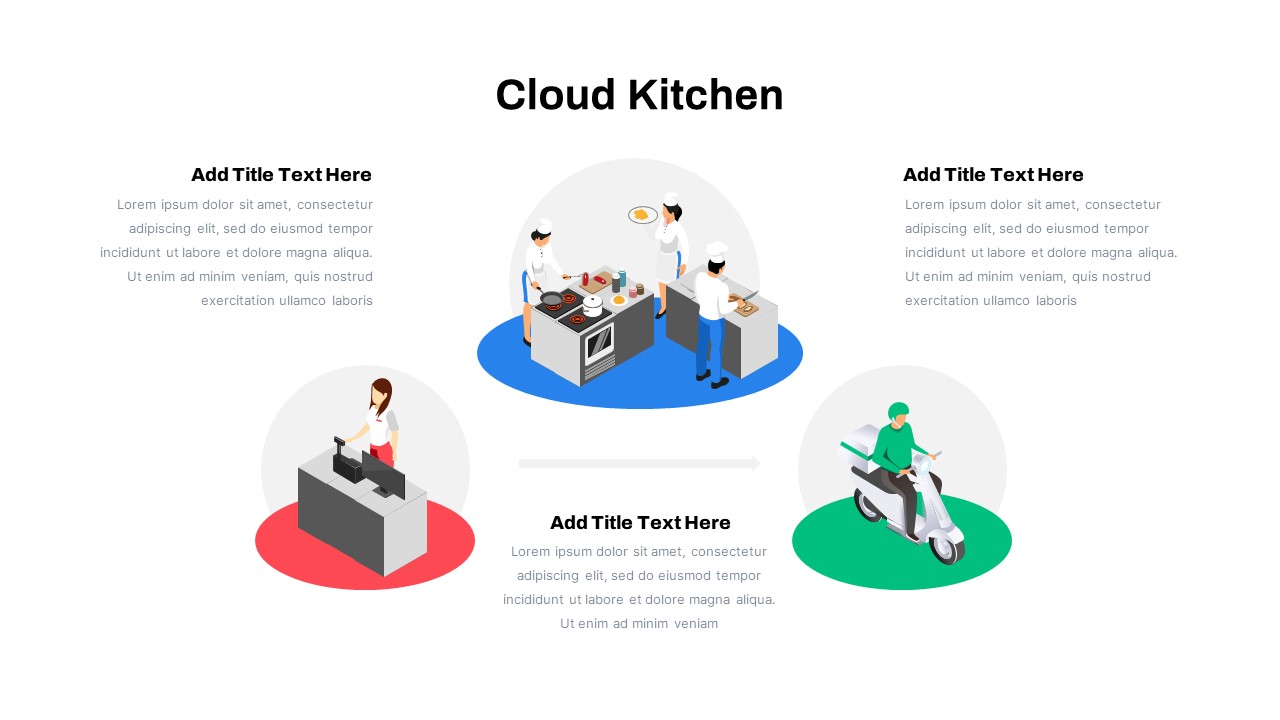
Cloud Kitchen Business Process Diagram Template for PowerPoint & Google Slides
Process
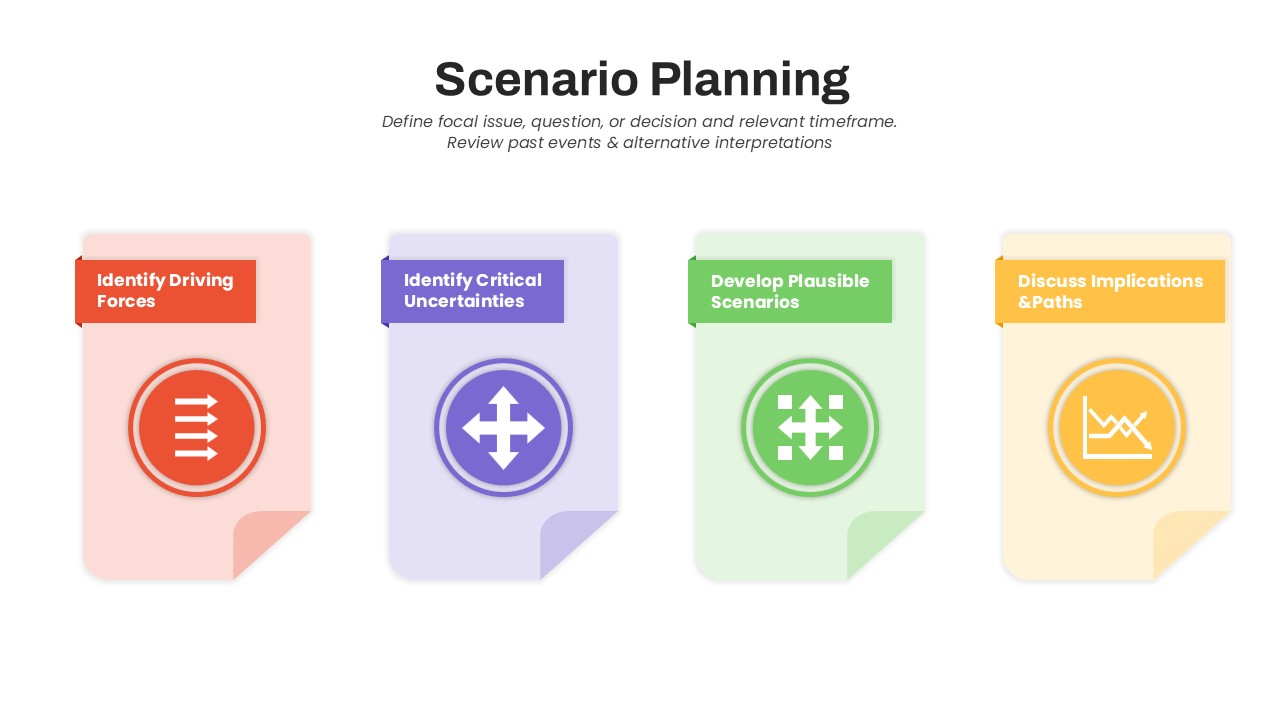
Scenario Planning Process Diagram Template for PowerPoint & Google Slides
Process
Change Management Process Cycle Diagram Template for PowerPoint & Google Slides
Process
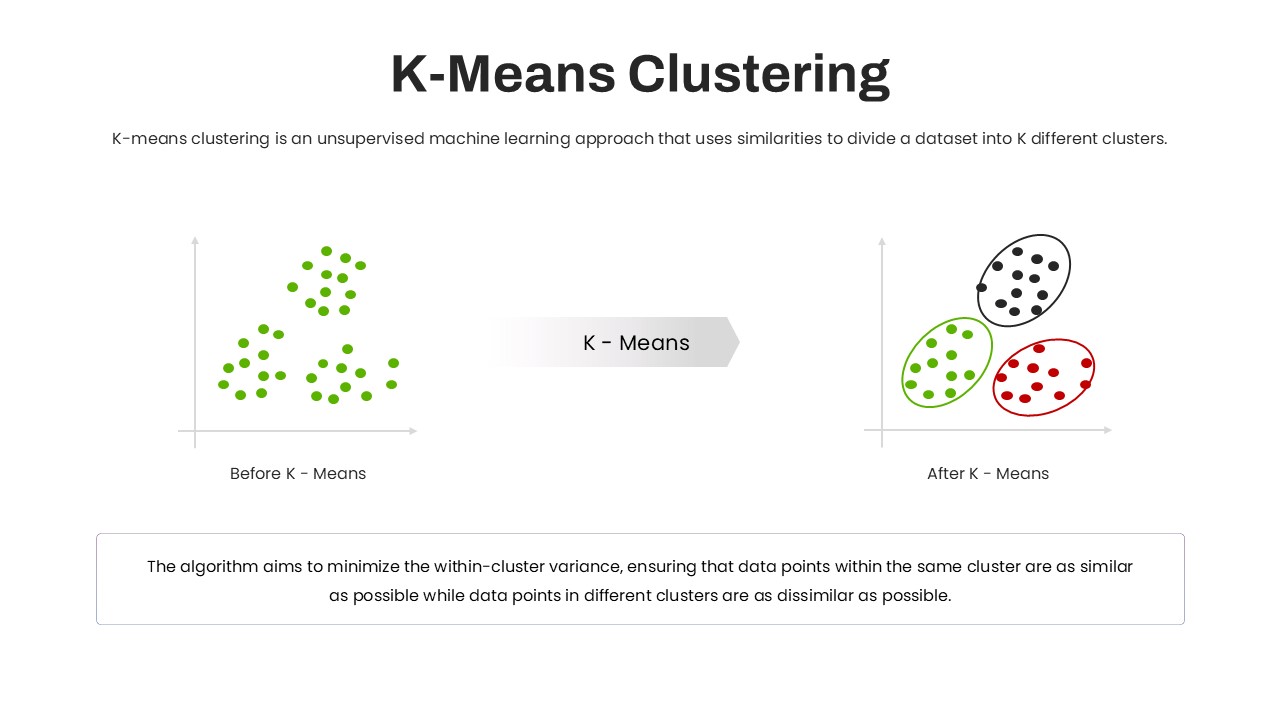
K-Means Clustering Process Diagram Template for PowerPoint & Google Slides
Machine Learning