MECE Framework Venn & Block Diagram Template for PowerPoint & Google Slides


Description
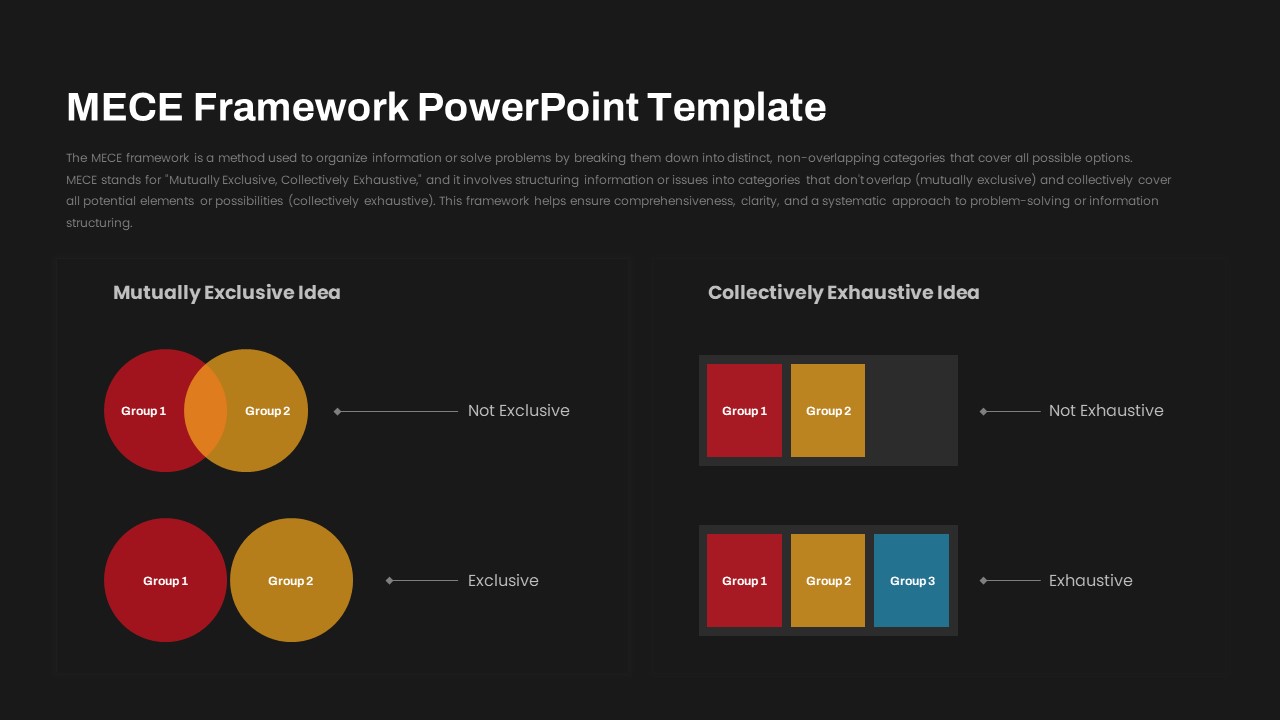
Demonstrate the MECE (Mutually Exclusive, Collectively Exhaustive) framework with a side-by-side design that clarifies category distinctions and completeness. On the left, two Venn circles showcase overlapping versus non-overlapping relationships, highlighting exclusivity. On the right, colored blocks illustrate incomplete and complete coverage scenarios, emphasizing exhaustiveness. The flat, modern design uses vibrant red, orange, and blue elements on a clean white canvas, paired with crisp typography for easy readability.
Built for rapid customization, this slide features editable vector shapes, intuitive placeholders, and master slides that ensure uniform styling across your deck. Adjust colors, swap icons, or modify text in seconds without losing quality. Optimized for both PowerPoint and Google Slides, it maintains high-resolution fidelity across platforms and streamlines collaboration by eliminating formatting issues.
Built on a master slide architecture, it ensures consistent typography, spacing, and placeholder hints across your presentation. Detailed on-slide guides and intuitive placeholders support quick onboarding for non-designers, reducing edit time while preserving visual harmony.
Who is it for
This slide is ideal for strategists, consultants, business analysts, and project managers who need to structure complex information clearly. Use it in executive briefings, strategic workshops, consulting presentations, or academic lectures to illustrate MECE principles and support data-driven decision making. Teams in finance, marketing, operations, and product development will gain clarity and alignment.
Other Uses
Beyond framework introductions, repurpose this slide to segment customer personas, map project scopes, organize audit findings, outline survey results, or present risk assessments. The flexible design allows duplication of shapes to compare departments, timeline phases, or KPI categories. Customize color schemes and text to illustrate business models, process steps, or performance benchmarks, making this asset a versatile addition to any presentation toolkit.
Login to download this file

Item ID
SB03878
Related Templates

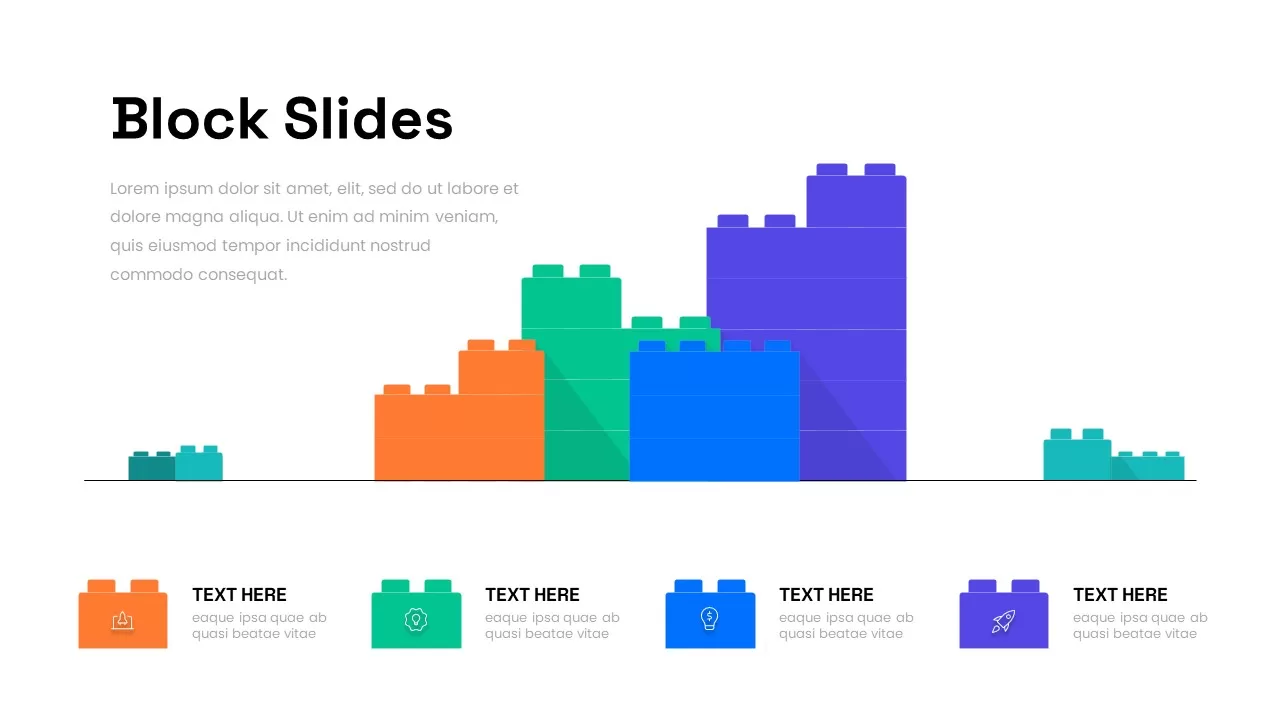
Colorful LEGO Block Stage Diagram Template for PowerPoint & Google Slides
Process
3D Block Arrow Infographic Diagram Template for PowerPoint & Google Slides
Arrow

Isometric 3D Block Comparison Diagram Template for PowerPoint & Google Slides
Comparison

Four-Circle Venn Process Diagram template for PowerPoint & Google Slides
Process
Venn Diagram Infographics Pack Template for PowerPoint & Google Slides
Circular
Creative Three-Circle Venn Diagram Template for PowerPoint & Google Slides
Comparison
Past, Present & Future Venn Diagram Template for PowerPoint & Google Slides
Comparison
Colorful Venn Diagram Infographics Template for PowerPoint & Google Slides
Circular
Modern Gear Venn Diagram Infographic Template for PowerPoint & Google Slides
Comparison
Autonomy, Mastery & Purpose Venn Diagram Template for PowerPoint & Google Slides
Circular
Free Simple Venn Diagram Overview template for PowerPoint & Google Slides
Comparison Chart
Free
Free Venn Diagram template for PowerPoint & Google Slides
Charts
Free
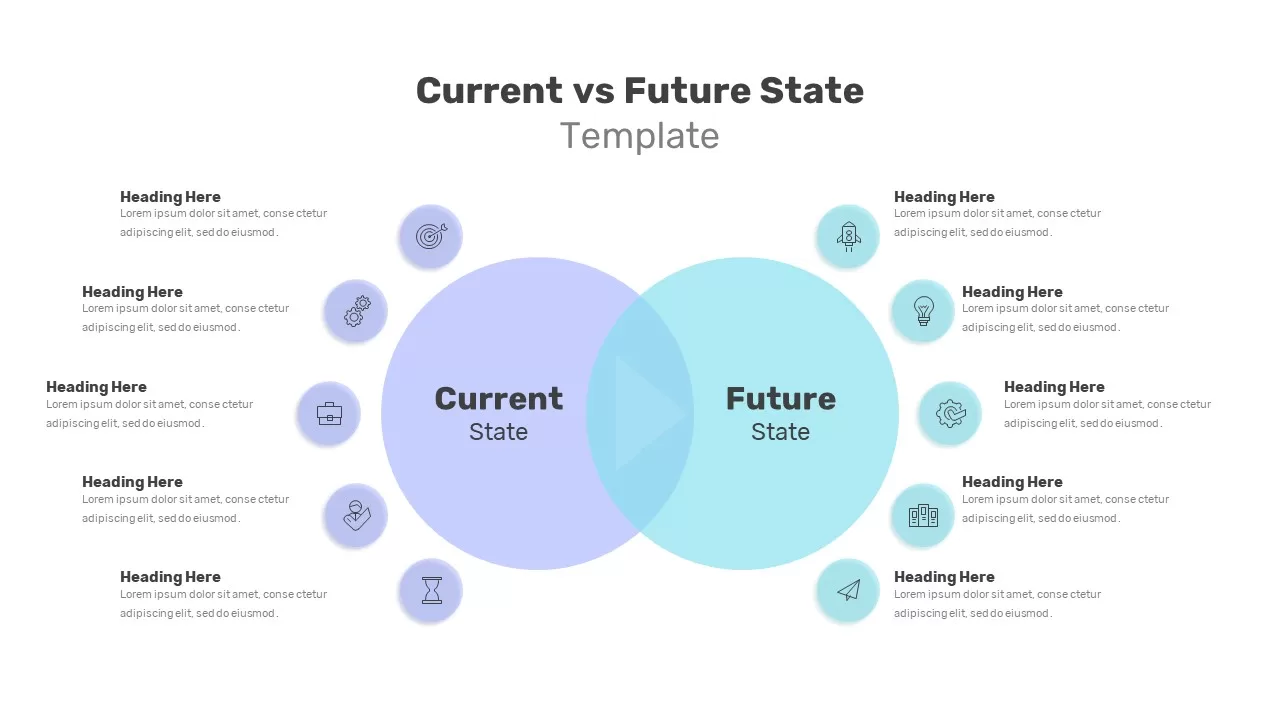
Current vs Future State Venn Diagram Template for PowerPoint & Google Slides
Comparison
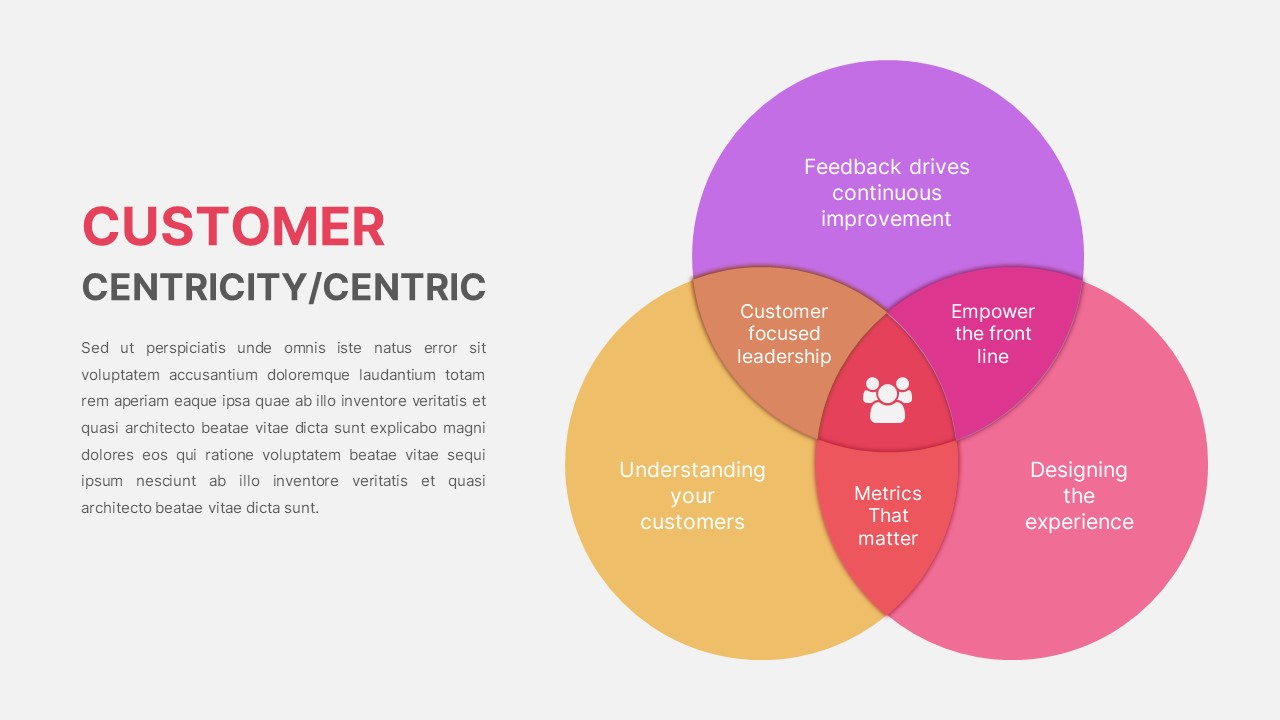
Customer Centricity Venn Diagram template for PowerPoint & Google Slides
Infographics
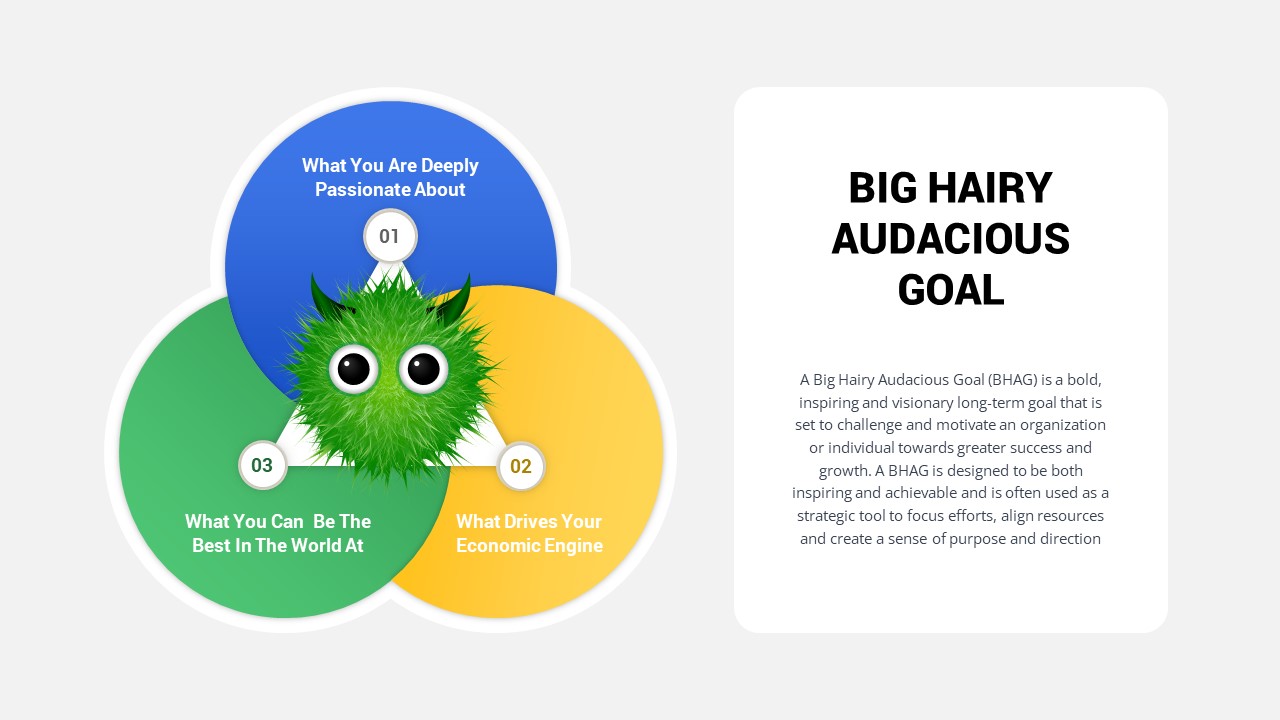
Big Hairy Audacious Goal Venn Diagram Template for PowerPoint & Google Slides
Circular
Five Circle Venn Diagram for Template for PowerPoint & Google Slides
Circular
8 Circle Venn Diagram Infographic Design Template for PowerPoint & Google Slides
Circular
Professional 6 Circle Venn Diagram Template for PowerPoint & Google Slides
Circular
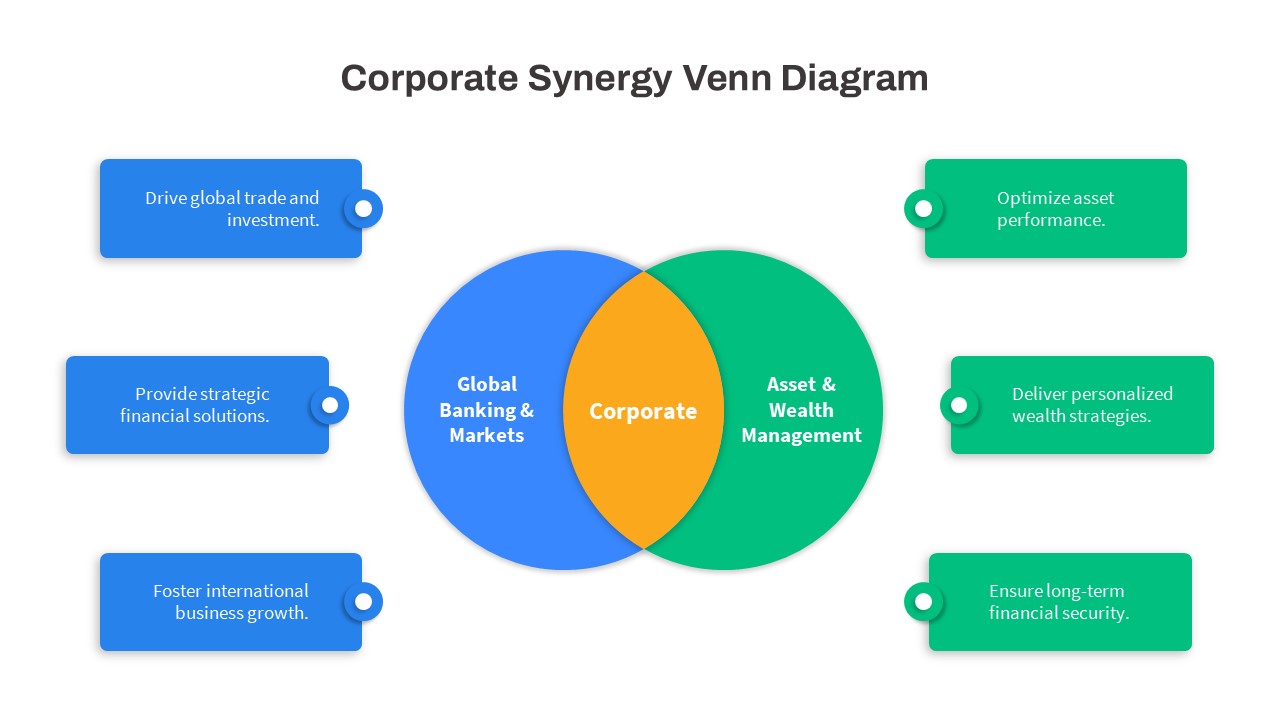
Corporate Synergy Venn Diagram Template for PowerPoint & Google Slides
Comparison
Salience Model Venn Diagram Infographic Template for PowerPoint & Google Slides
Circular
Modern Growth Hacking Venn Diagram Template for PowerPoint & Google Slides
Circular
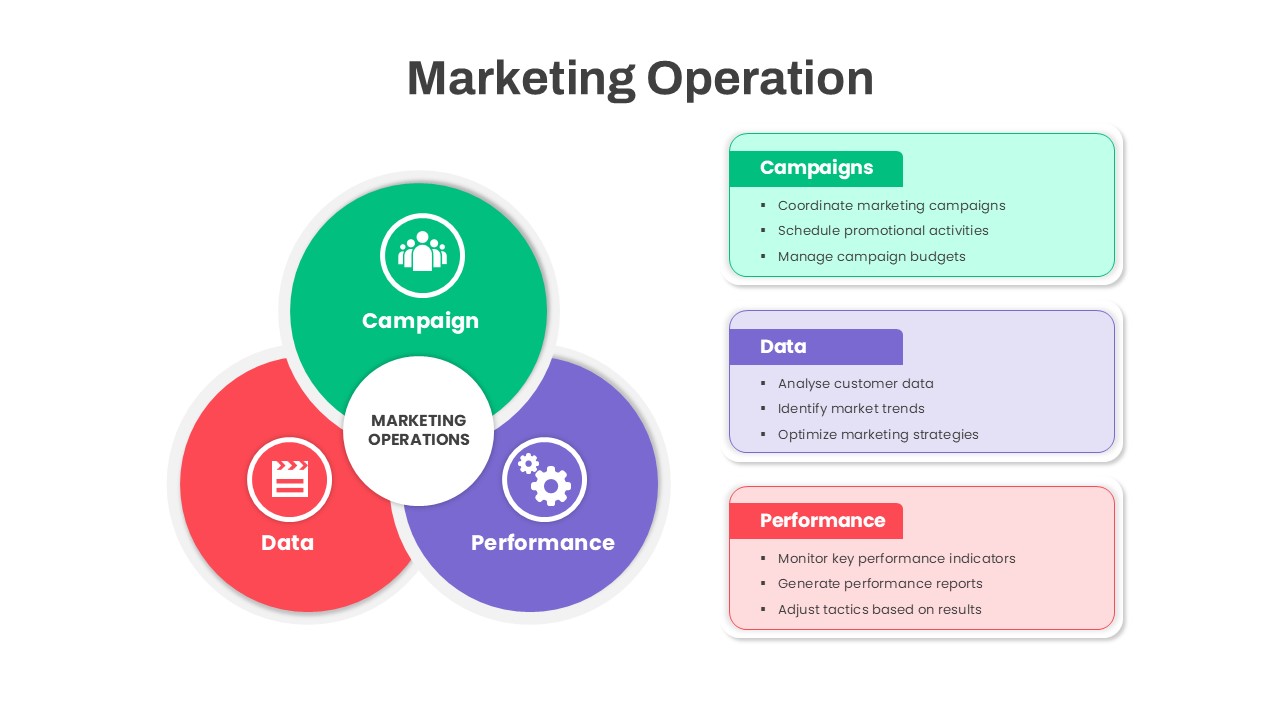
Marketing Operations Venn Diagram Template for PowerPoint & Google Slides
Circular
3Ps Triple Bottom Line Venn Diagram Template for PowerPoint & Google Slides
Circular
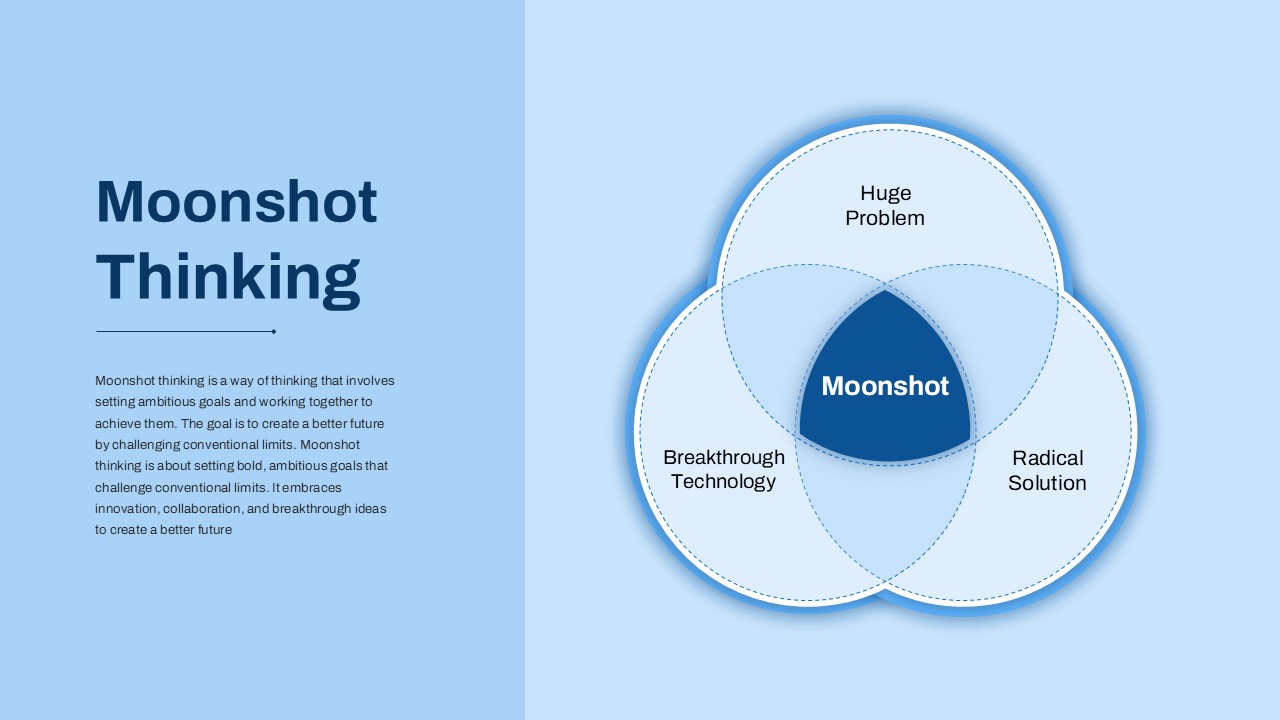
Bold Moonshot Thinking Venn Diagram Template for PowerPoint & Google Slides
Circular
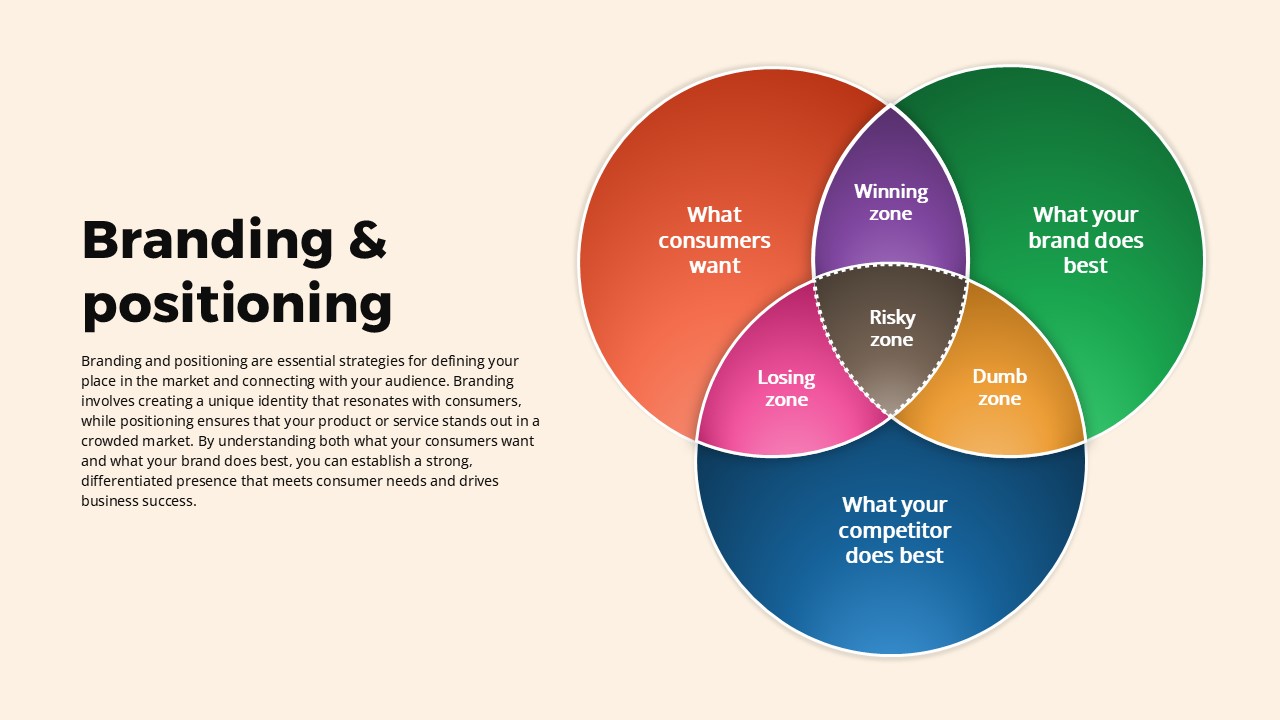
Branding and Positioning Venn Diagram Template for PowerPoint & Google Slides
Comparison
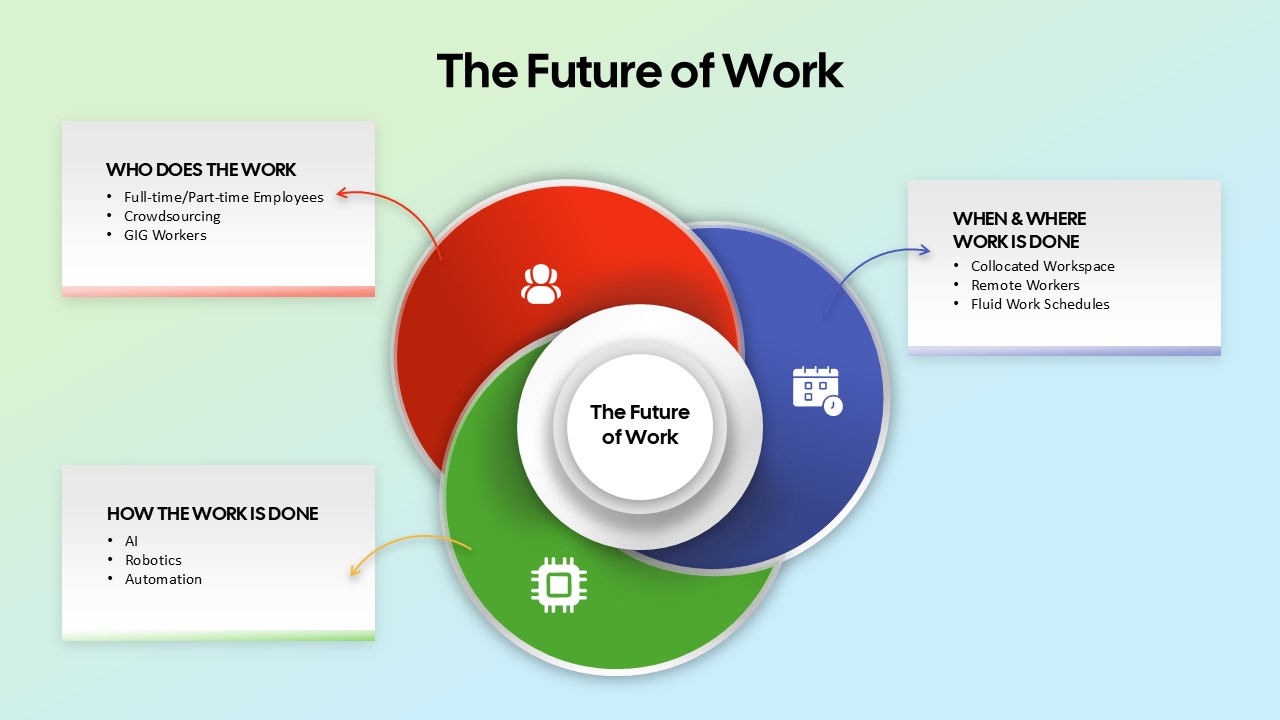
The Future of Work Venn Diagram Template for PowerPoint & Google Slides
Circular
Quadruple Venn Diagram Template for PowerPoint & Google Slides
Circular
4 Set Venn Diagram Comparison Template for PowerPoint & Google Slides
Comparison
Colorful Venn Diagram with 4 Circle for PowerPoint & Google Slides
Circular
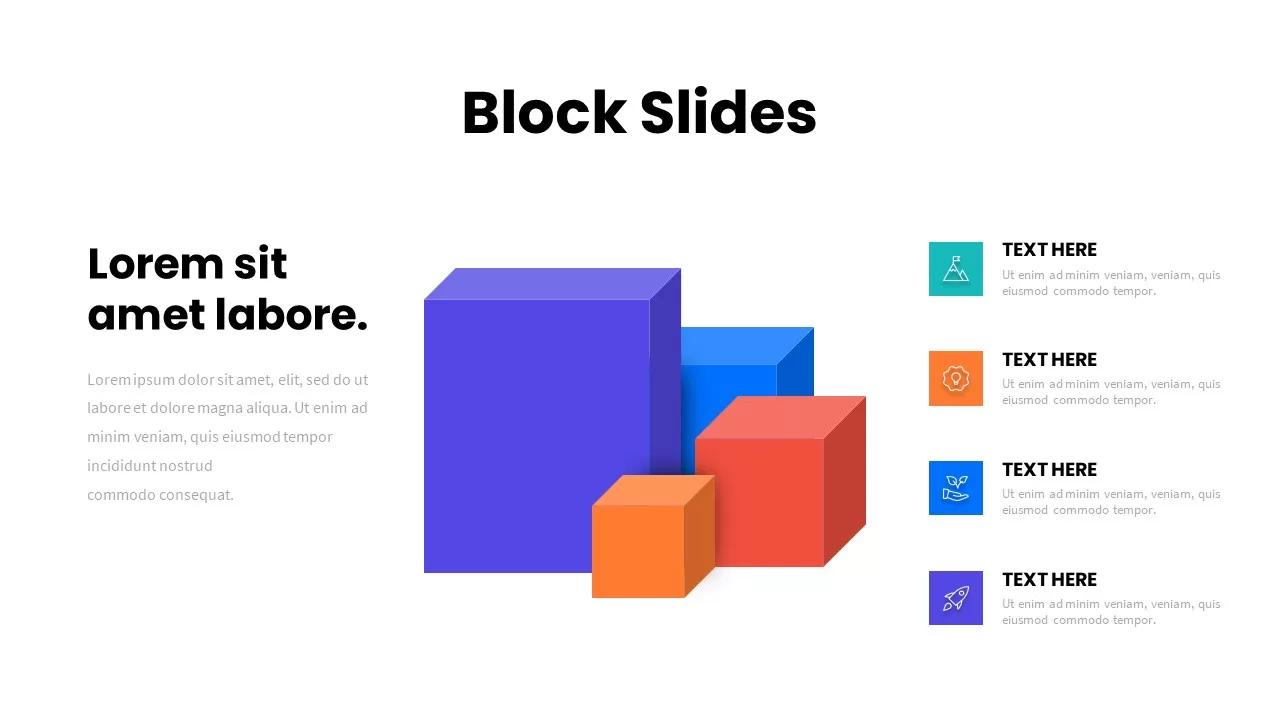
3D Block Infographic template for PowerPoint & Google Slides
Infographics
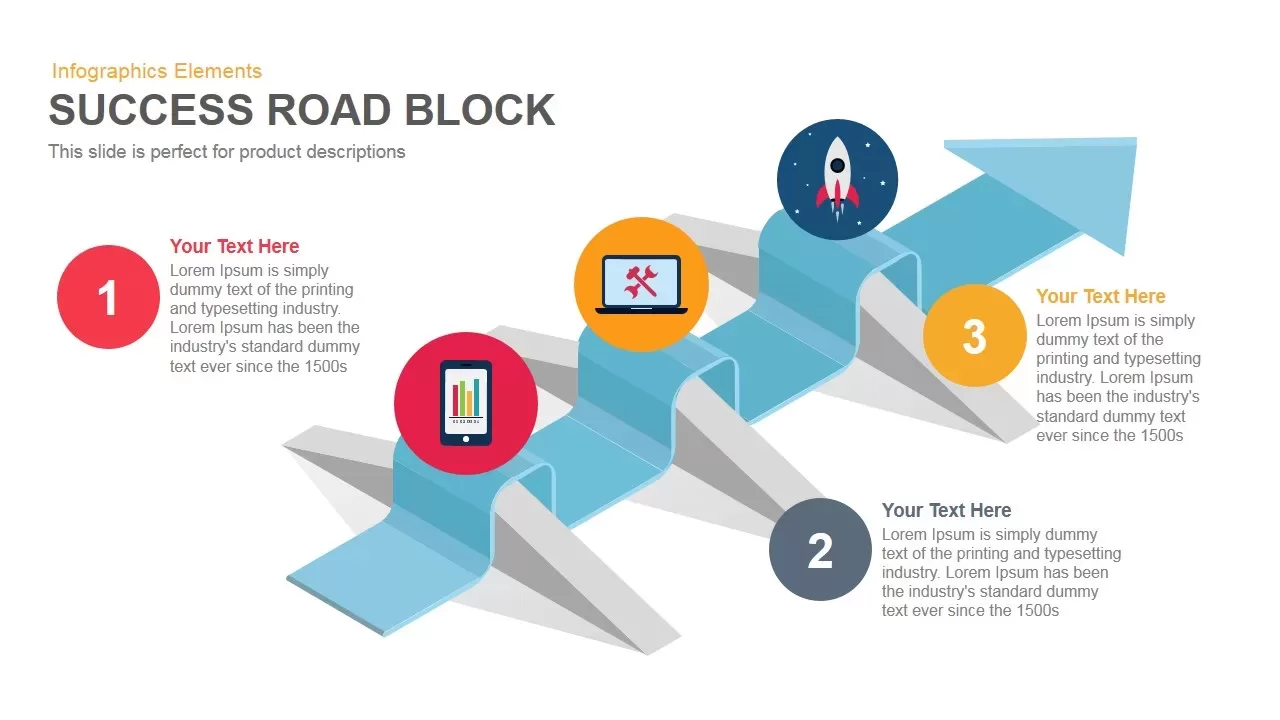
Success Road Block template for PowerPoint & Google Slides
Process

Modern Ten-Block Section Title Chart template for PowerPoint & Google Slides
Comparison
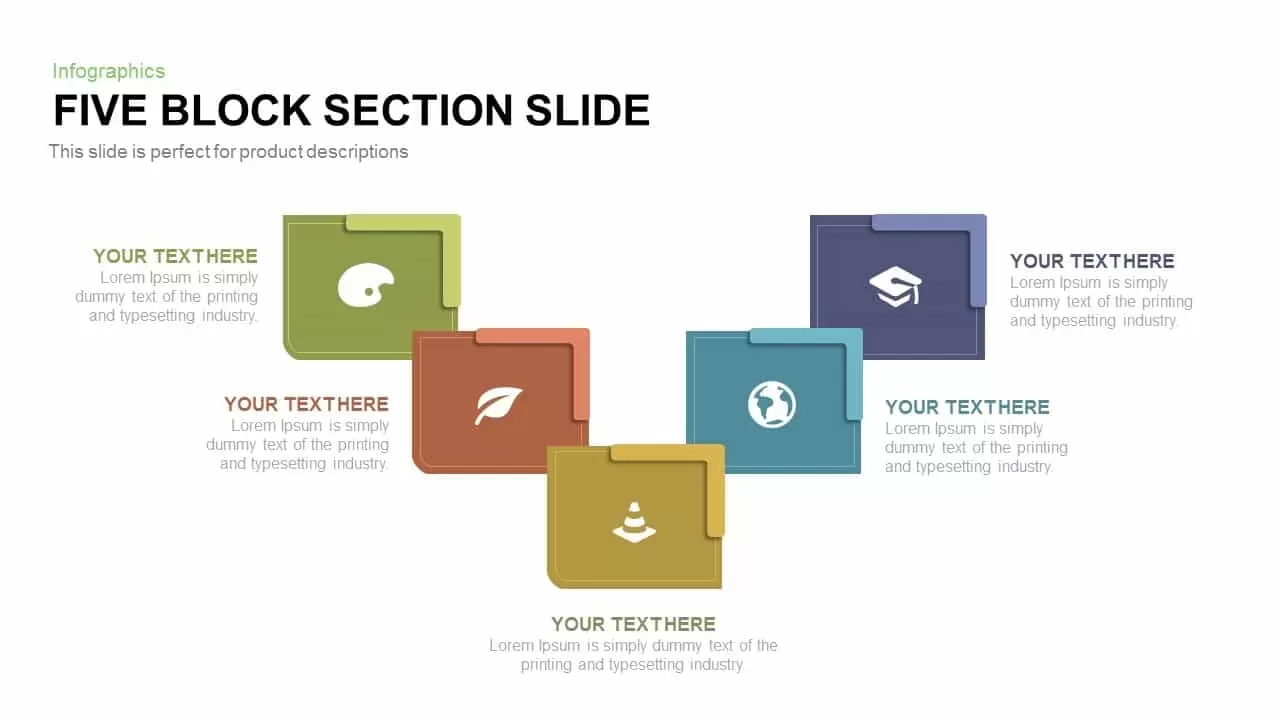
Five-Block Section Feature Highlights Template for PowerPoint & Google Slides
Comparison
Modular Block Infographic Slide Template for PowerPoint & Google Slides
Infographics
Six-Layer 3D Block Stack Infographic Template for PowerPoint & Google Slides
Process
Isometric Block Infographic Steps Template for PowerPoint & Google Slides
Process
Colorful Block Infographic Metrics Slide Template for PowerPoint & Google Slides
Infographics
Isometric Block Steps Infographic Template for PowerPoint & Google Slides
Process
Six-Block Capability Statement Template for PowerPoint & Google Slides
Business Report
Creative Block List Infographic Template for PowerPoint & Google Slides
Agenda
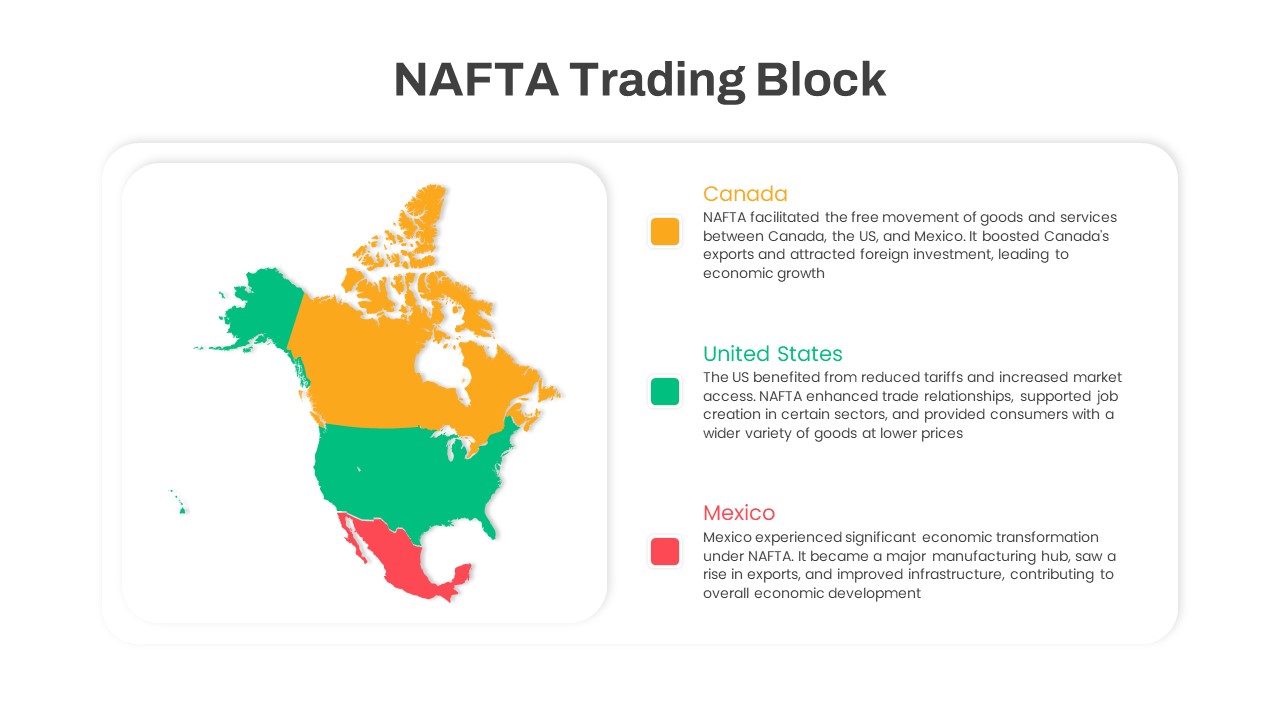
NAFTA Trading Block Map Infographic Template for PowerPoint & Google Slides
World Maps
3D Color Block Organizational Chart Slide for PowerPoint & Google Slides
Org Chart
Six-Staged Gear Diagram Framework Template for PowerPoint & Google Slides
Process
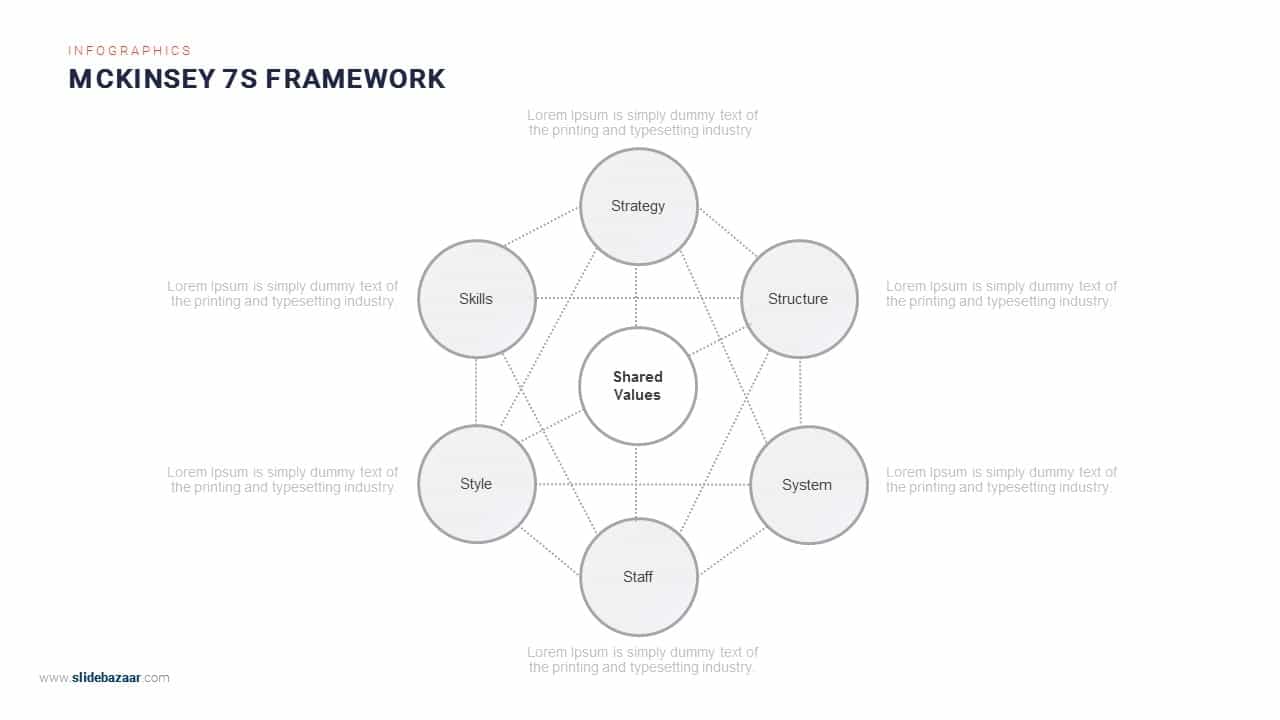
McKinsey 7S Framework Circular Diagram Template for PowerPoint & Google Slides
Circular
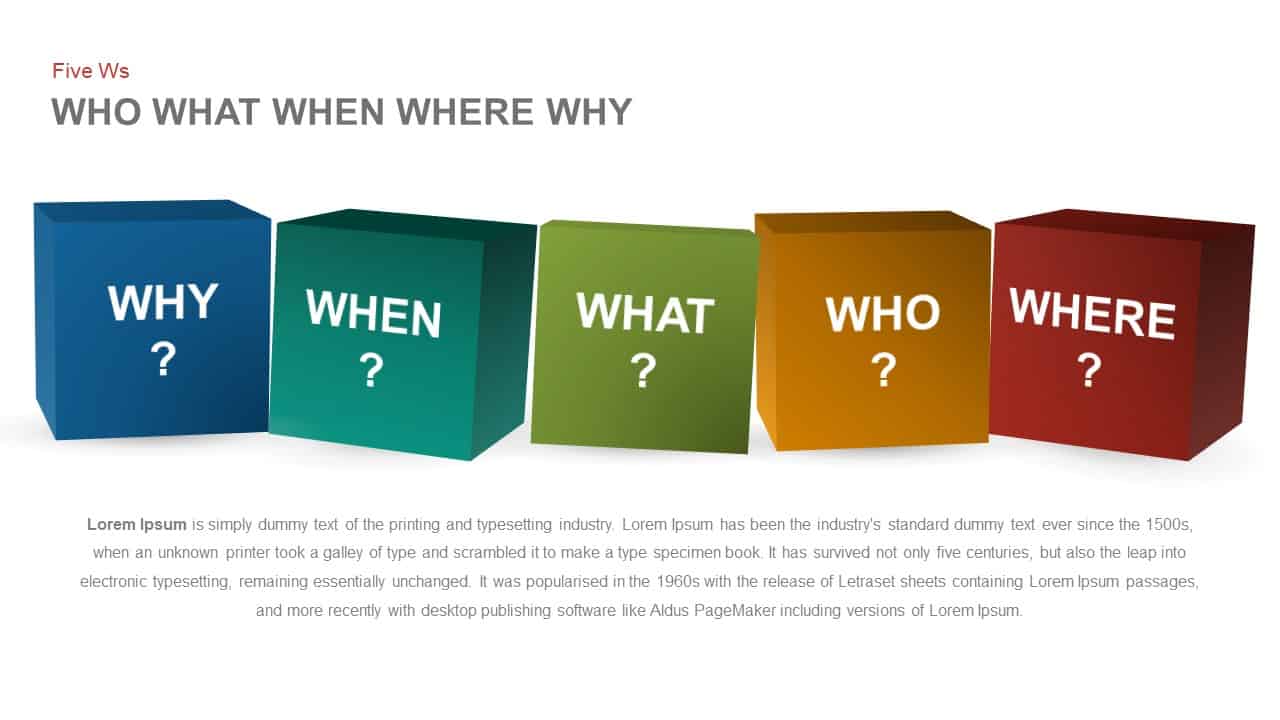
Five Ws Framework Cube Diagram Template for PowerPoint & Google Slides
Comparison
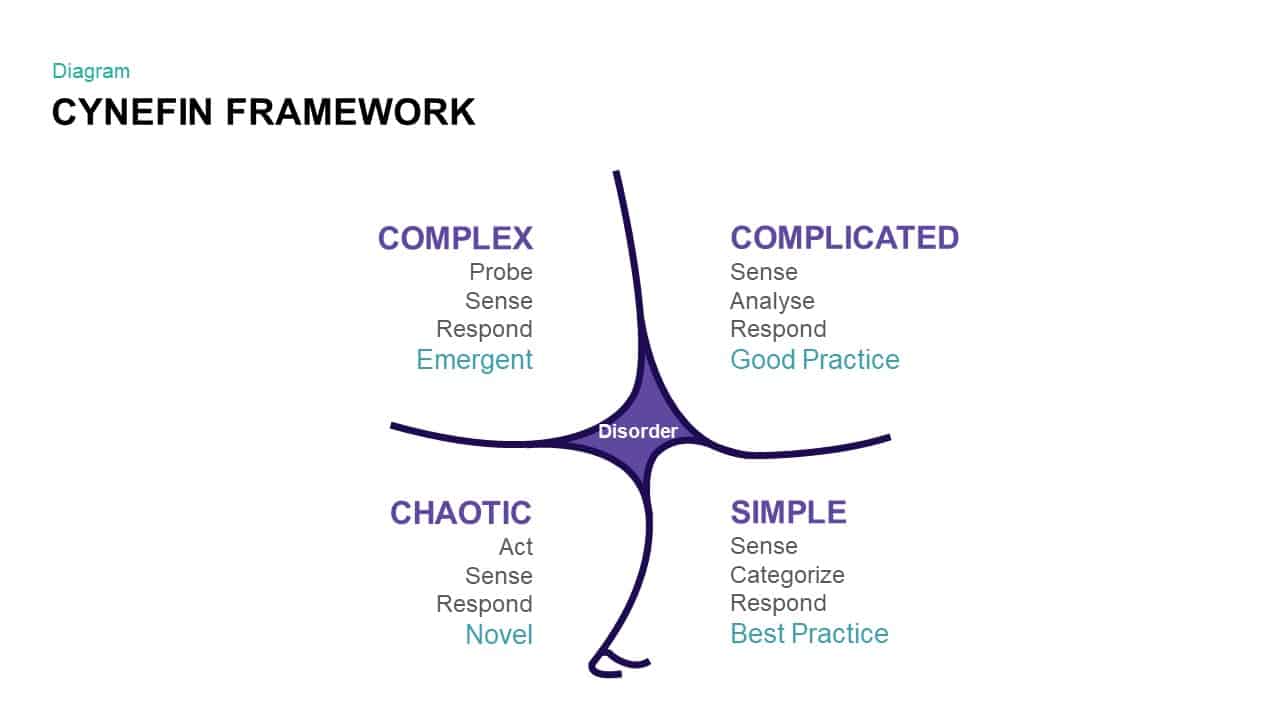
Comprehensive Cynefin Framework Diagram Template for PowerPoint & Google Slides
Opportunities Challenges
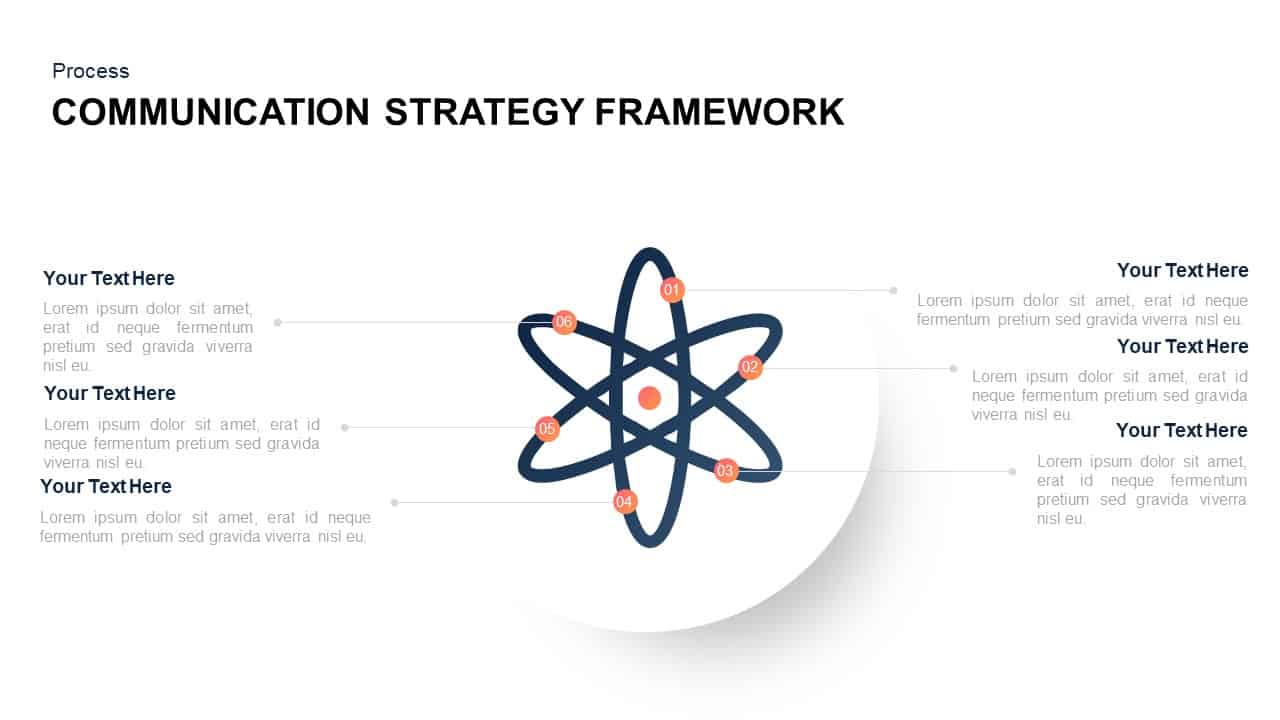
Communication Strategy Framework Diagram Template for PowerPoint & Google Slides
Circular
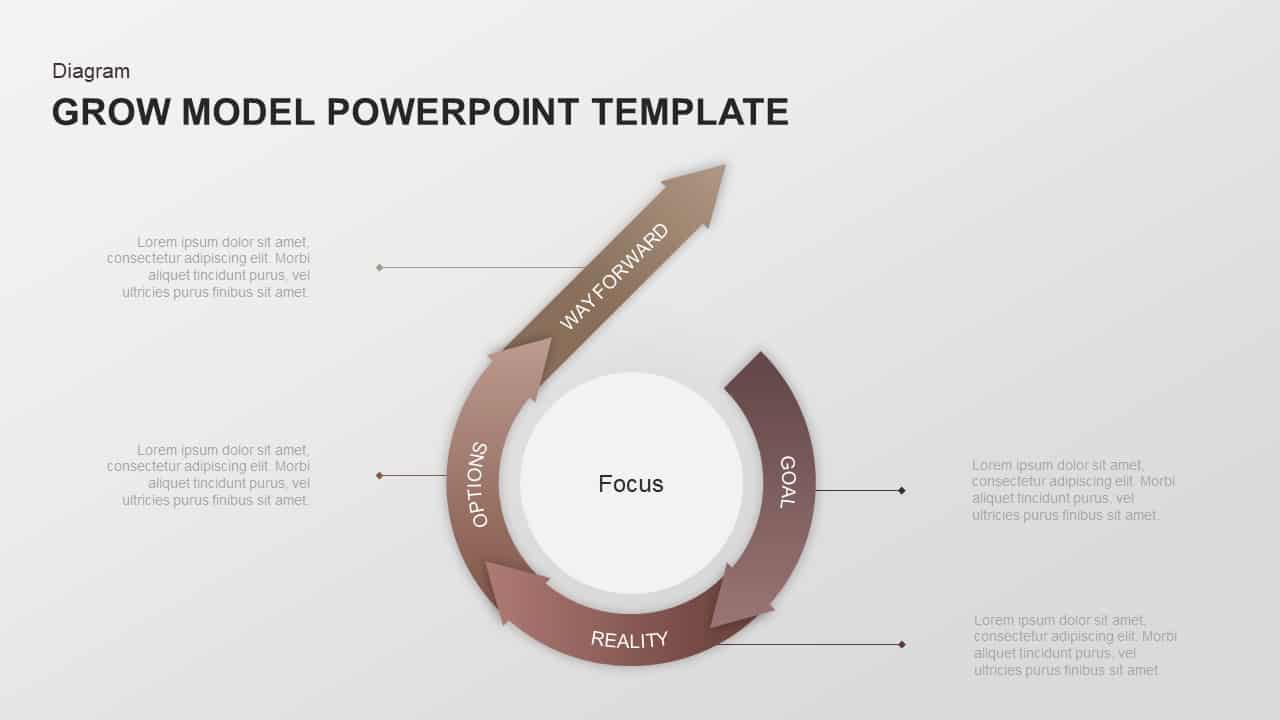
GROW Coaching Framework Diagram Template for PowerPoint & Google Slides
Process
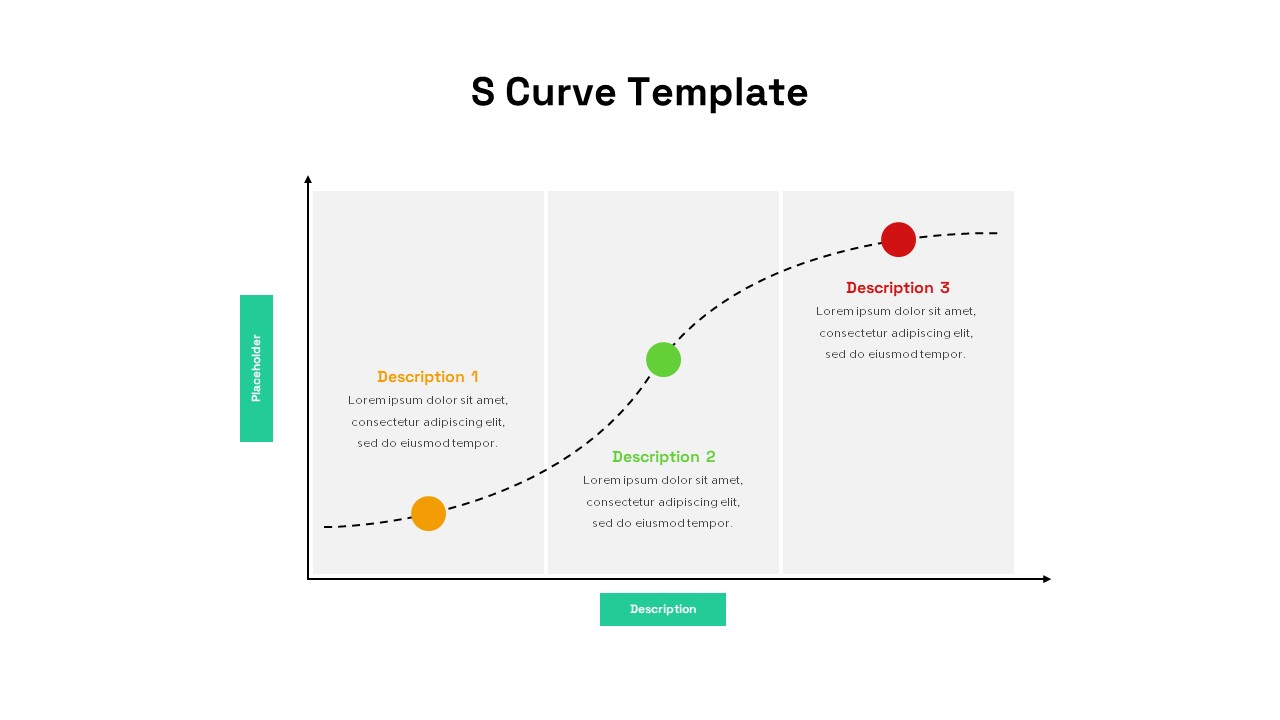
S-Curve Progression Framework Diagram Template for PowerPoint & Google Slides
Charts
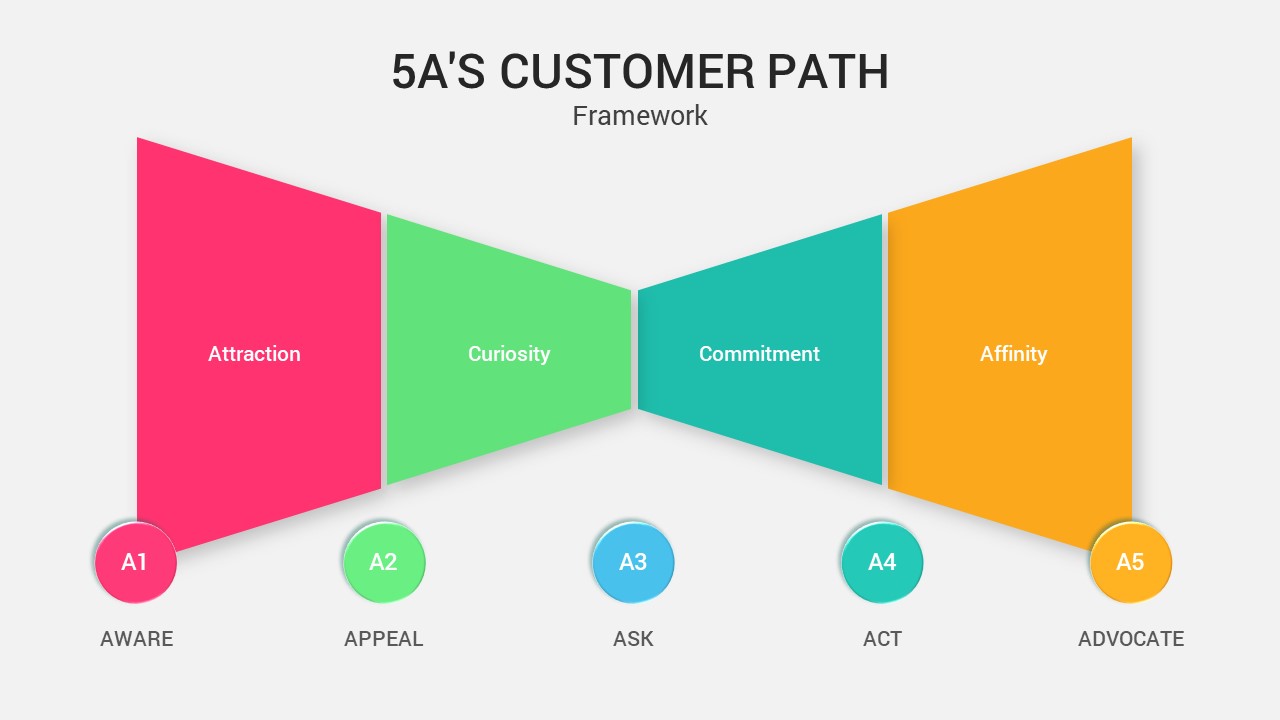
5A’s Customer Path Framework Diagram Template for PowerPoint & Google Slides
Process
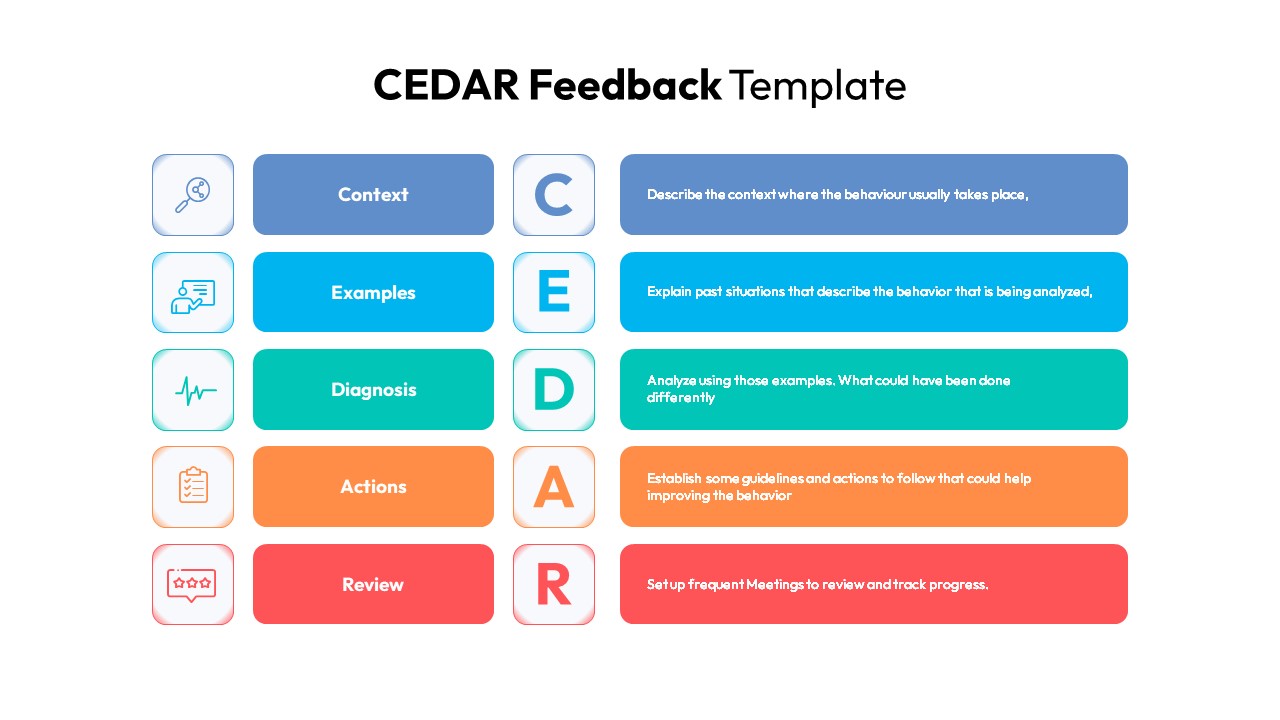
CEDAR Feedback Framework Diagram Template for PowerPoint & Google Slides
Employee Performance
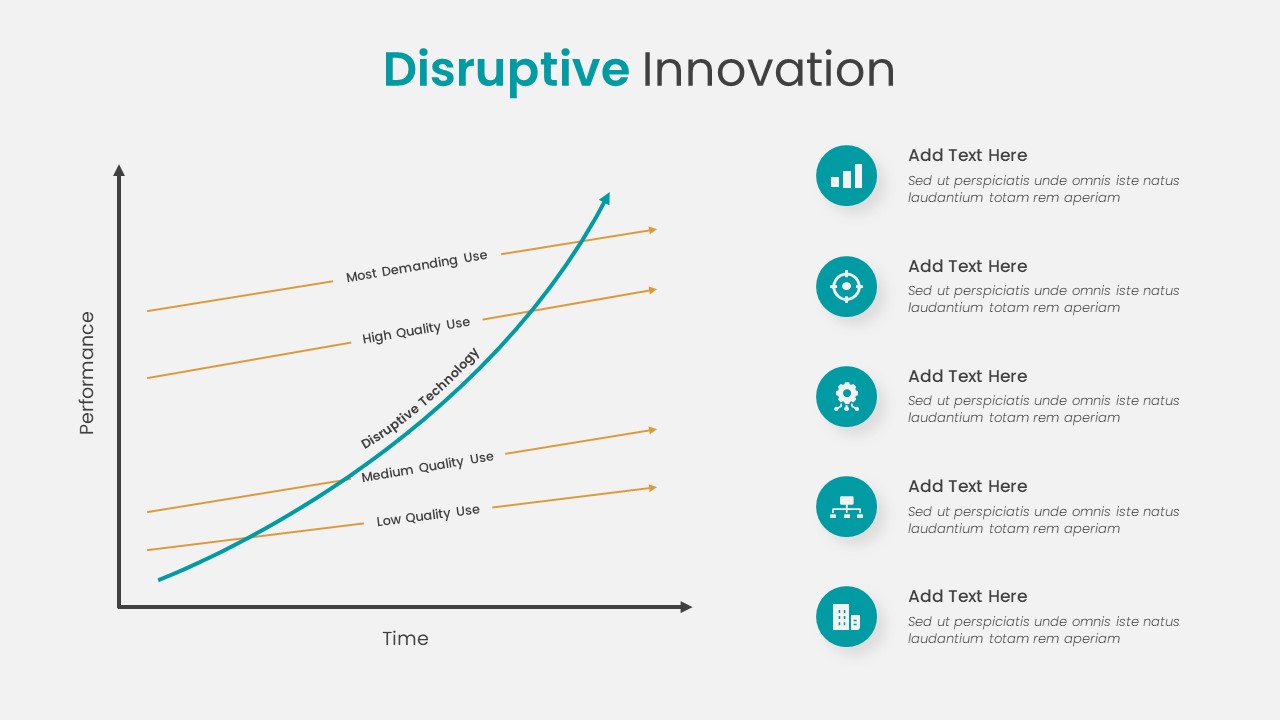
Disruptive Innovation Framework Diagram Template for PowerPoint & Google Slides
Comparison Chart
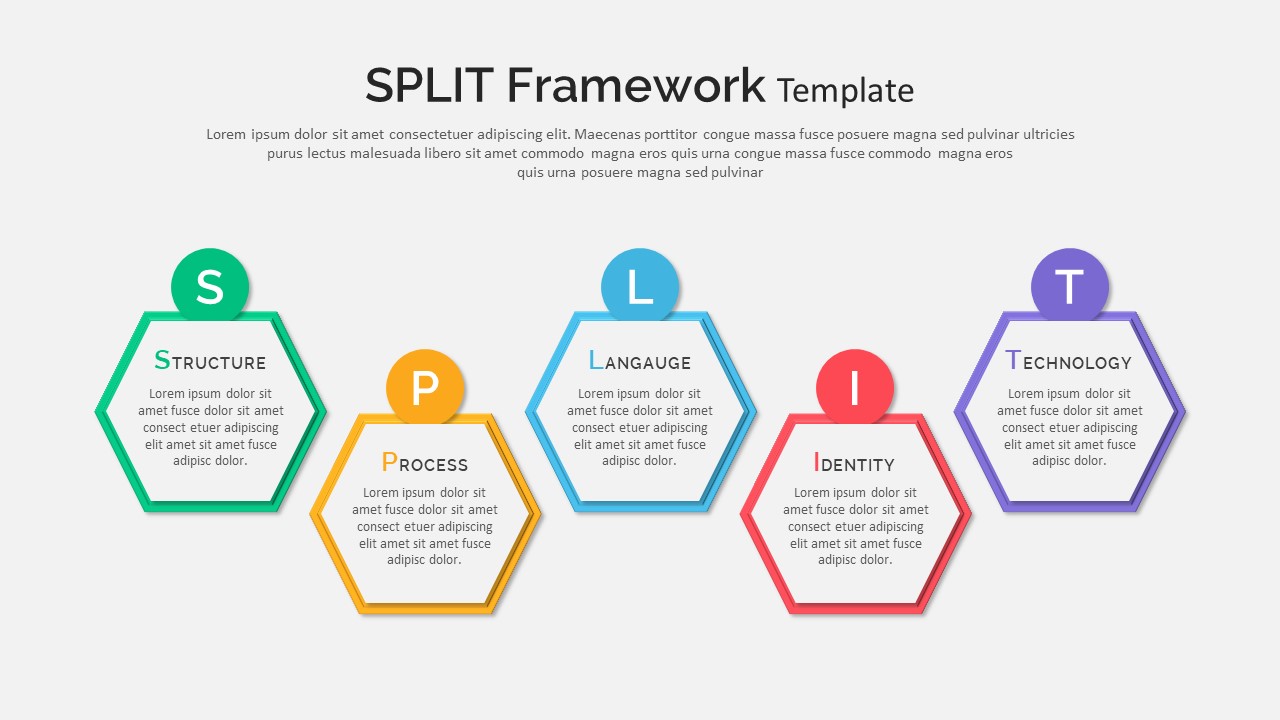
Split Framework Hexagon Diagram Slide Template for PowerPoint & Google Slides
Process
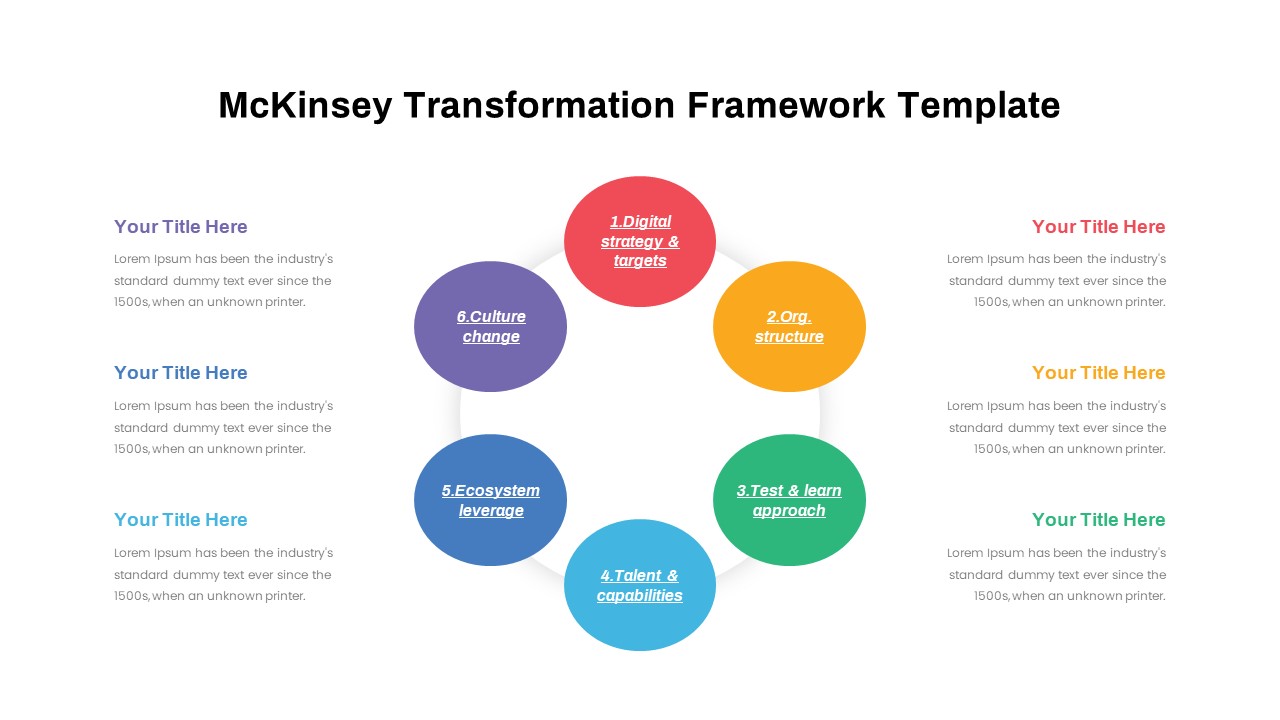
BCG Transformation Framework Diagram Template for PowerPoint & Google Slides
BCG
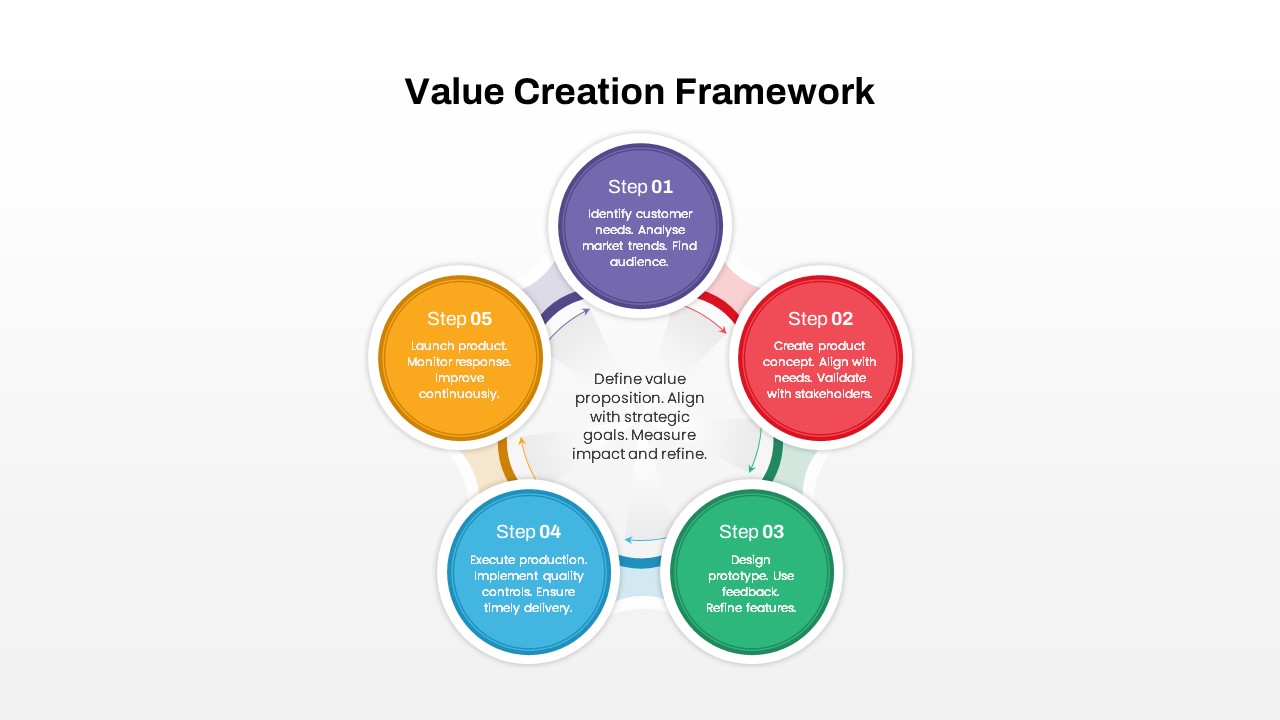
Value Creation Framework Process Diagram Template for PowerPoint & Google Slides
Business Plan
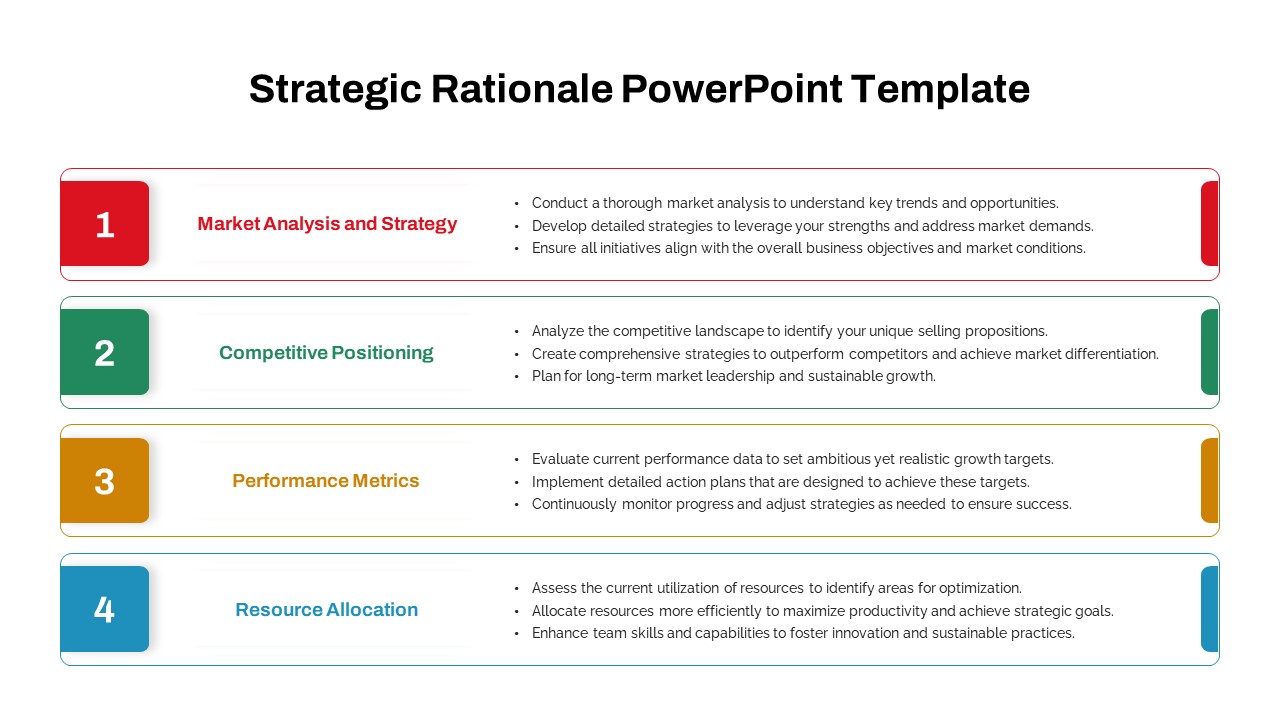
Strategic Rationale Framework Diagram Template for PowerPoint & Google Slides
Process
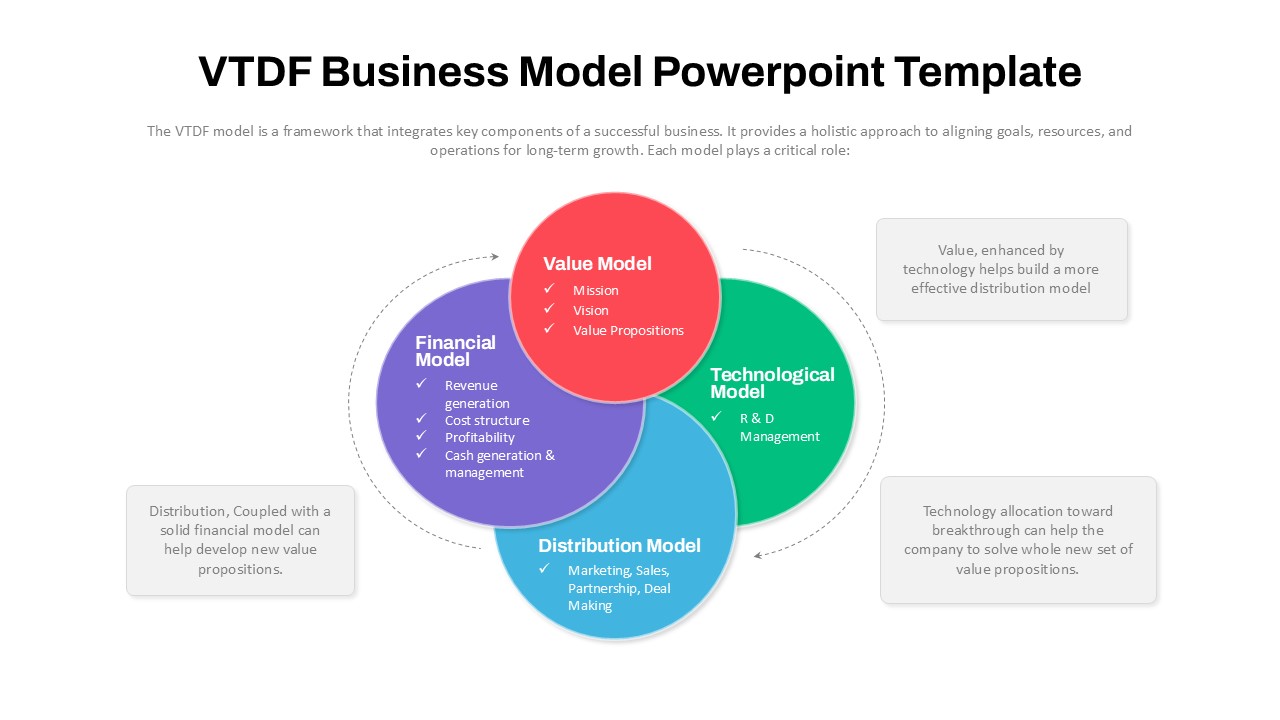
VTDF Business Model Framework Diagram Template for PowerPoint & Google Slides
Business Models
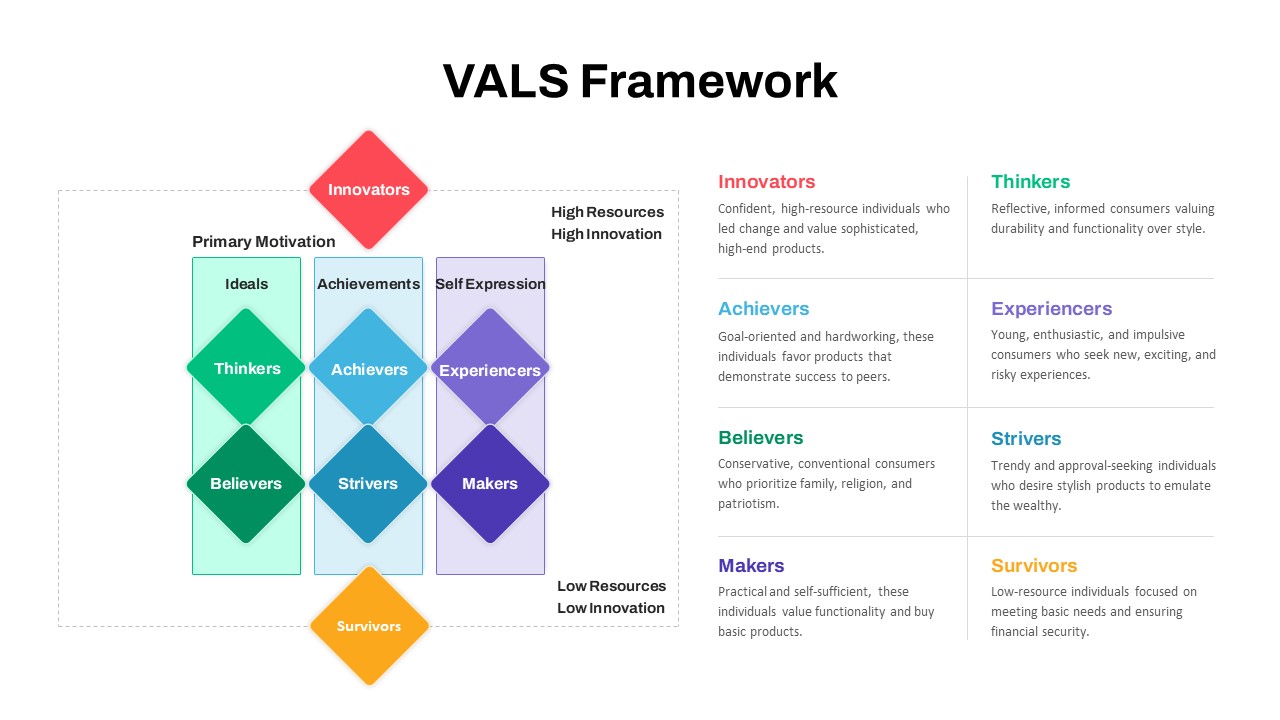
VALS Segmentation Framework Diagram Template for PowerPoint & Google Slides
Marketing
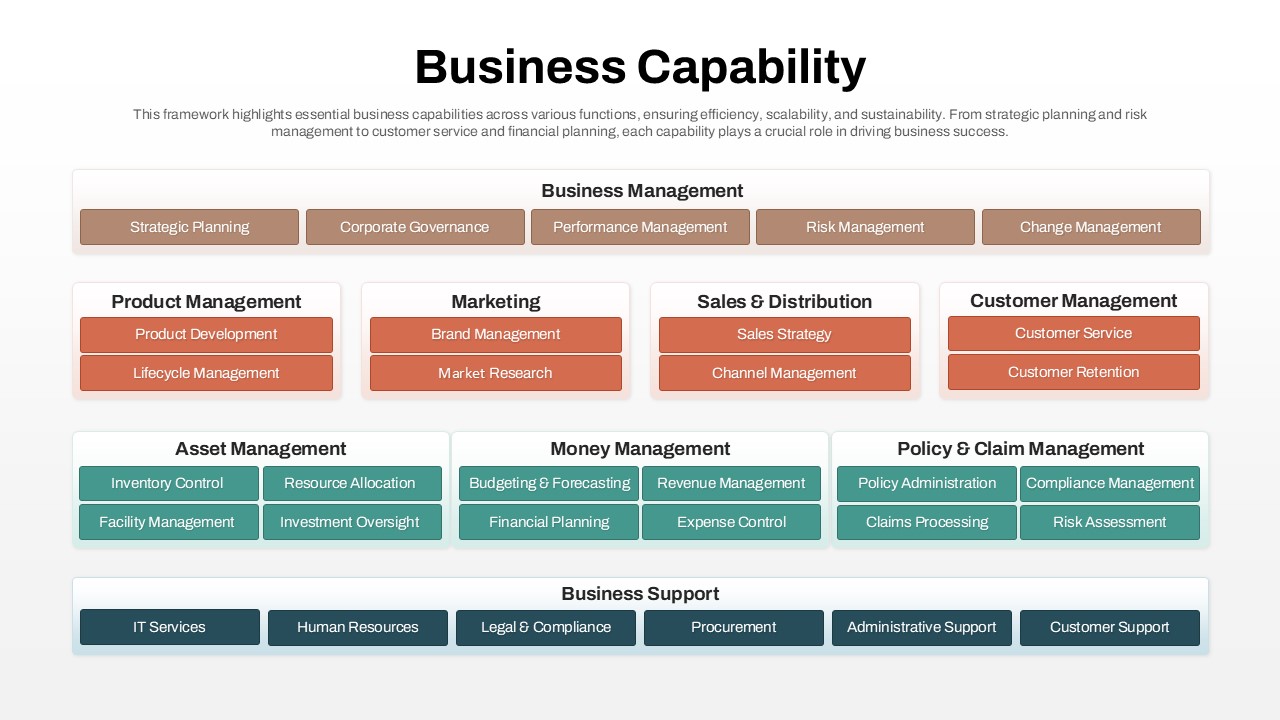
Business Capability Framework Diagram Template for PowerPoint & Google Slides
Business Models
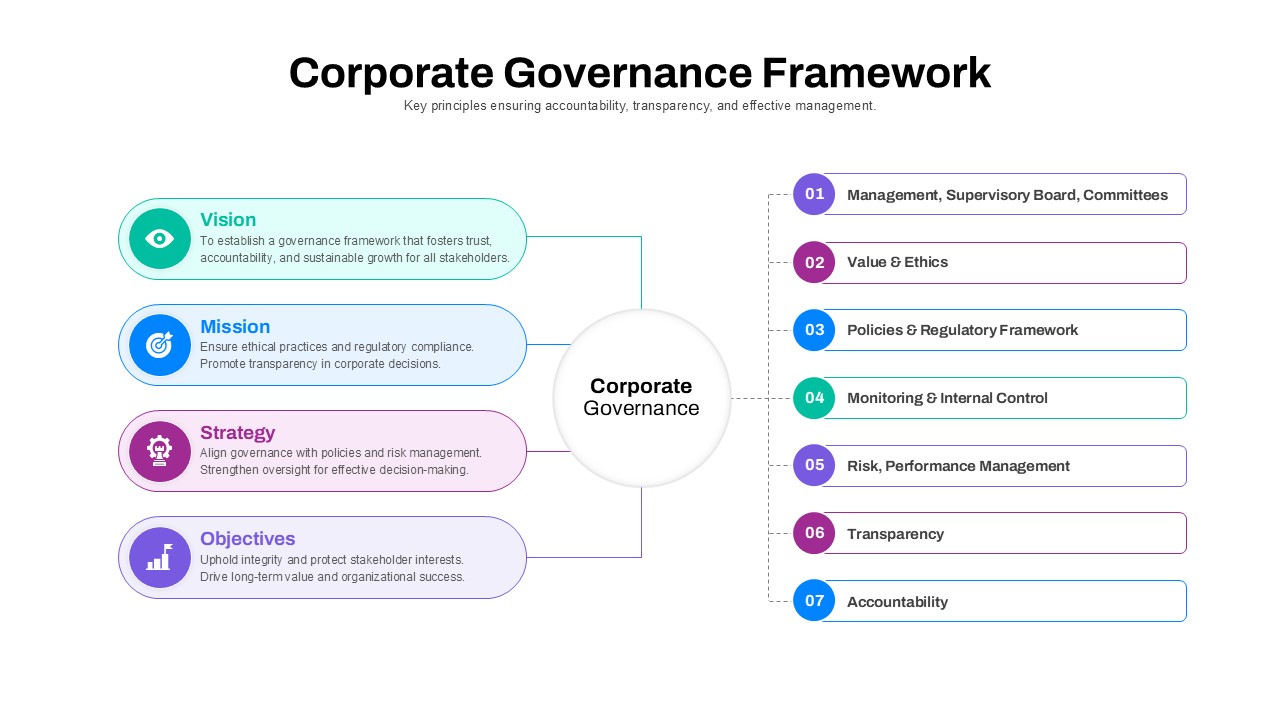
Corporate Governance Framework Diagram Template for PowerPoint & Google Slides
Process
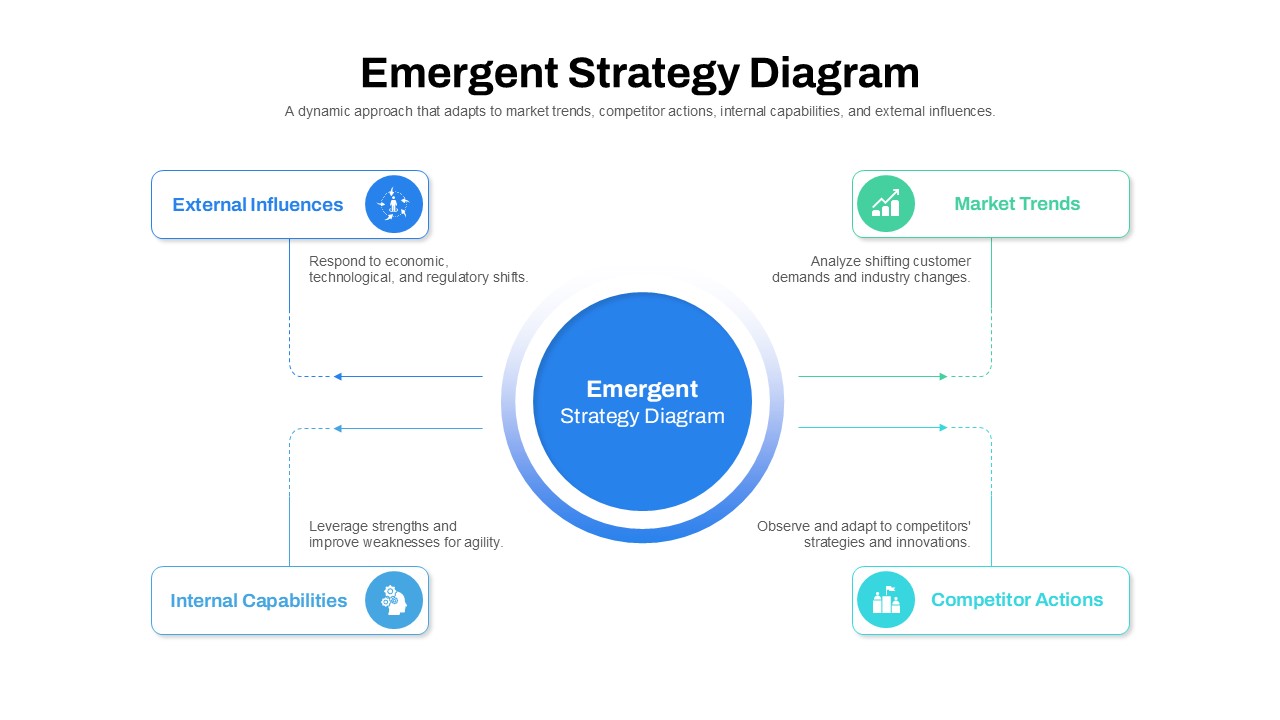
Emergent Strategy Diagram Framework Template for PowerPoint & Google Slides
Process
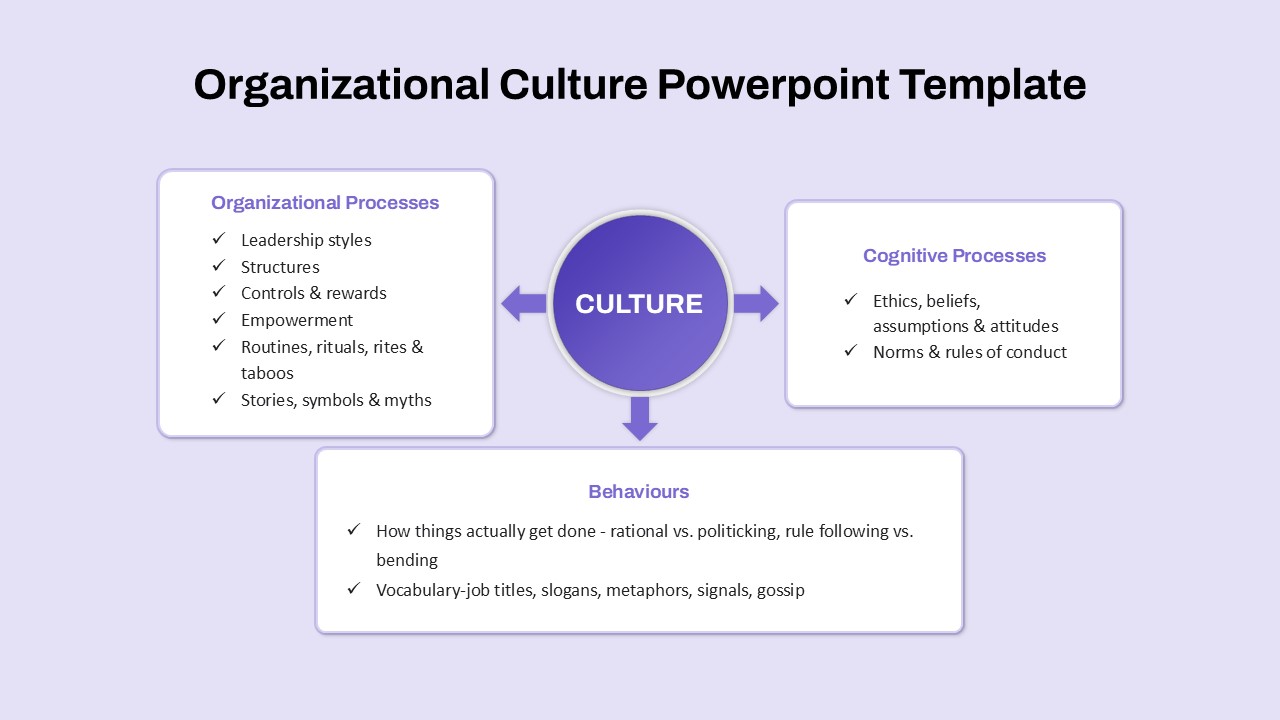
Organizational Culture Framework Diagram Template for PowerPoint & Google Slides
Arrow
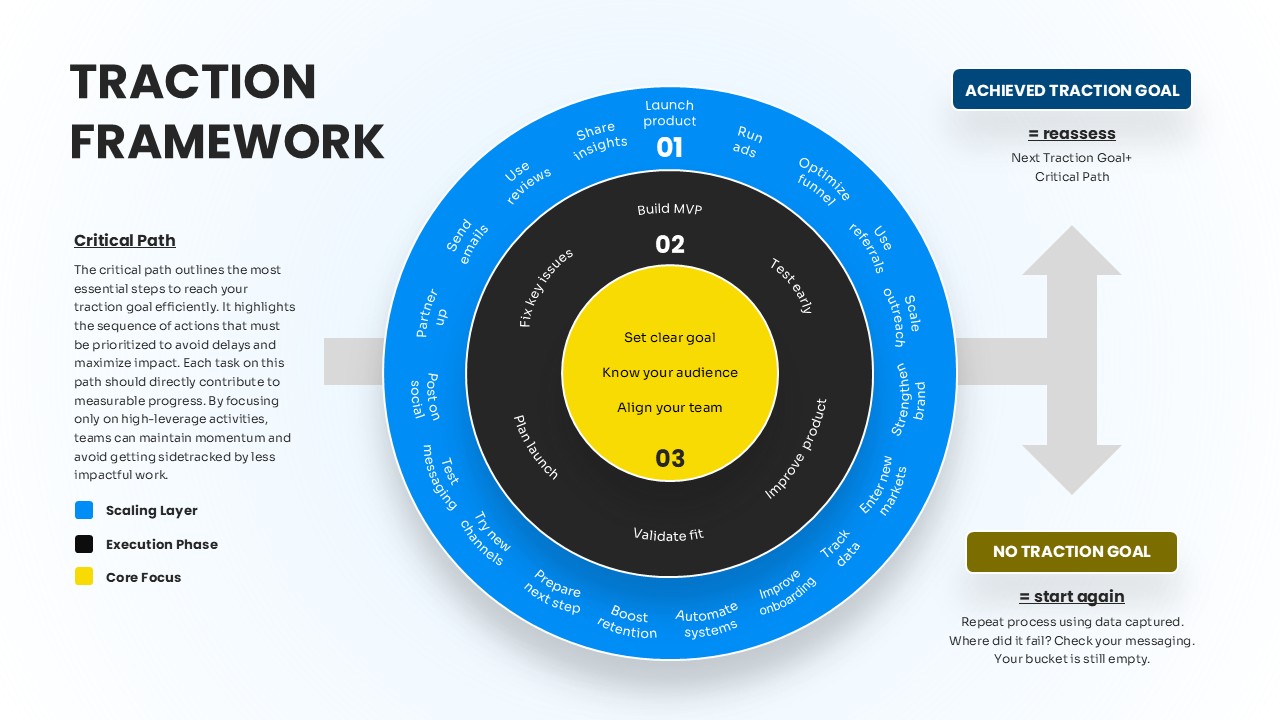
Concentric Traction Framework Diagram Template for PowerPoint & Google Slides
Process
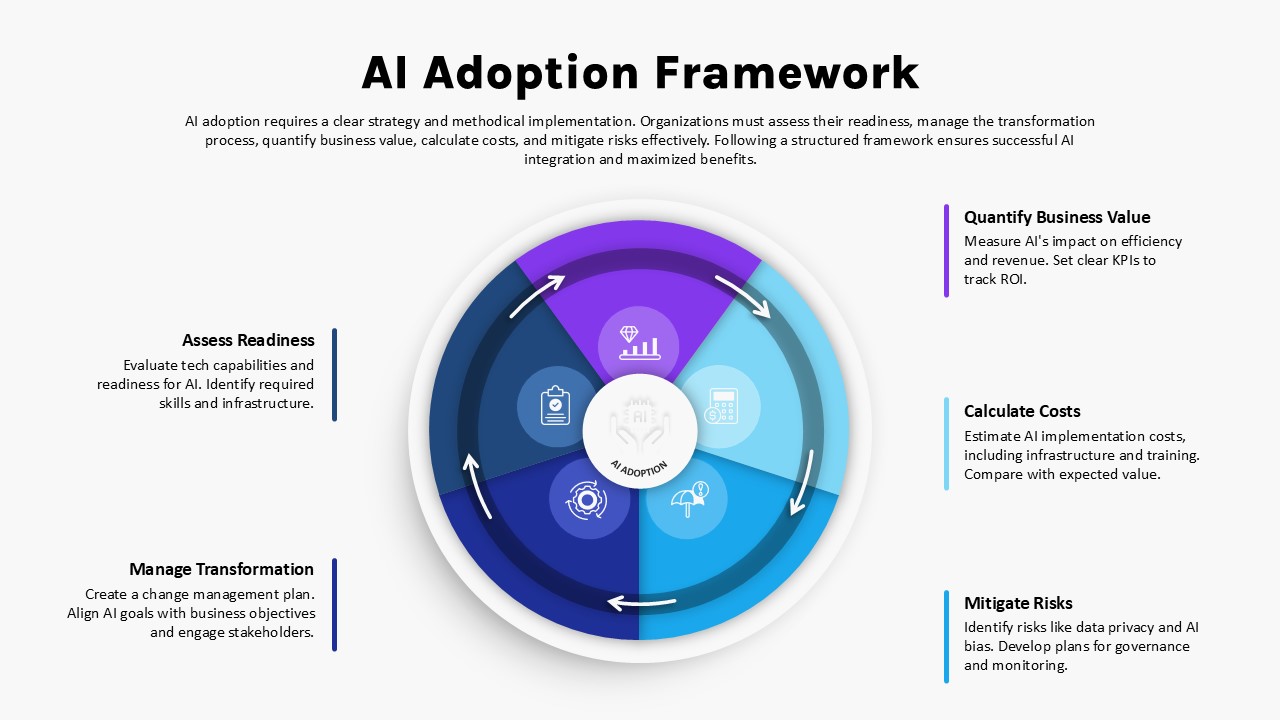
AI Adoption Framework Circular Diagram Template for PowerPoint & Google Slides
AI
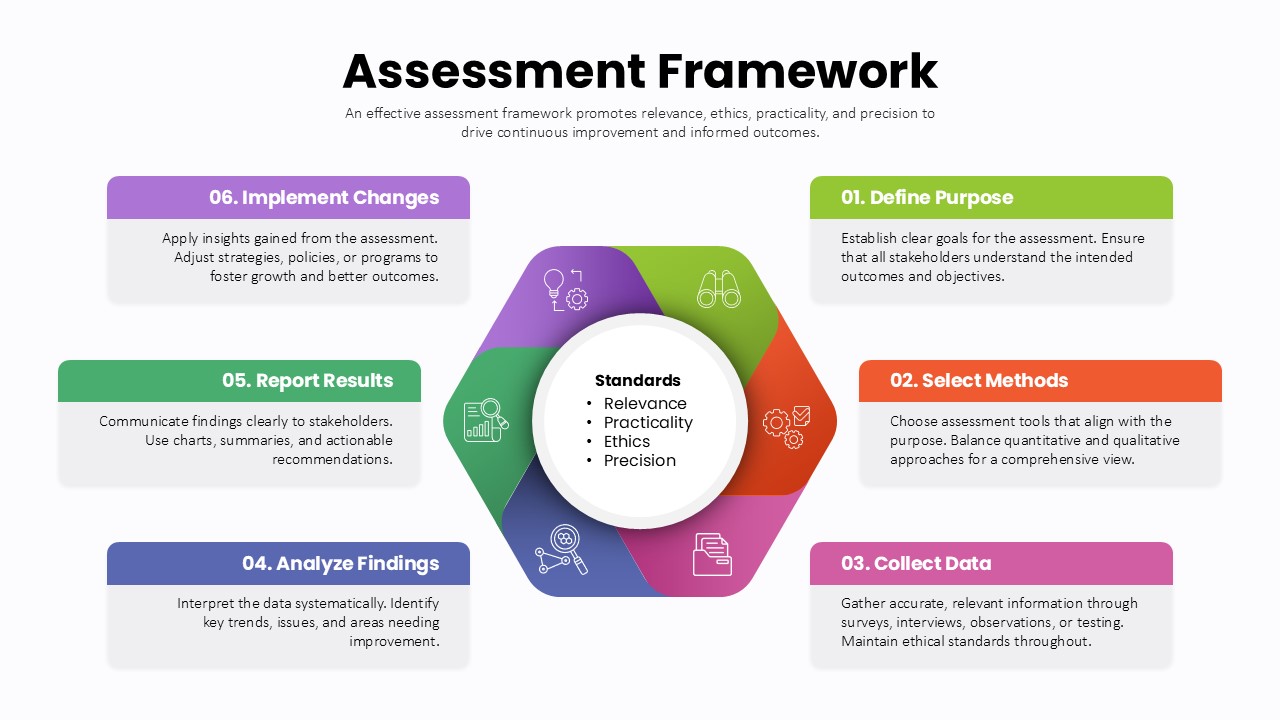
Assessment Framework Circular Diagram Template for PowerPoint & Google Slides
Circular
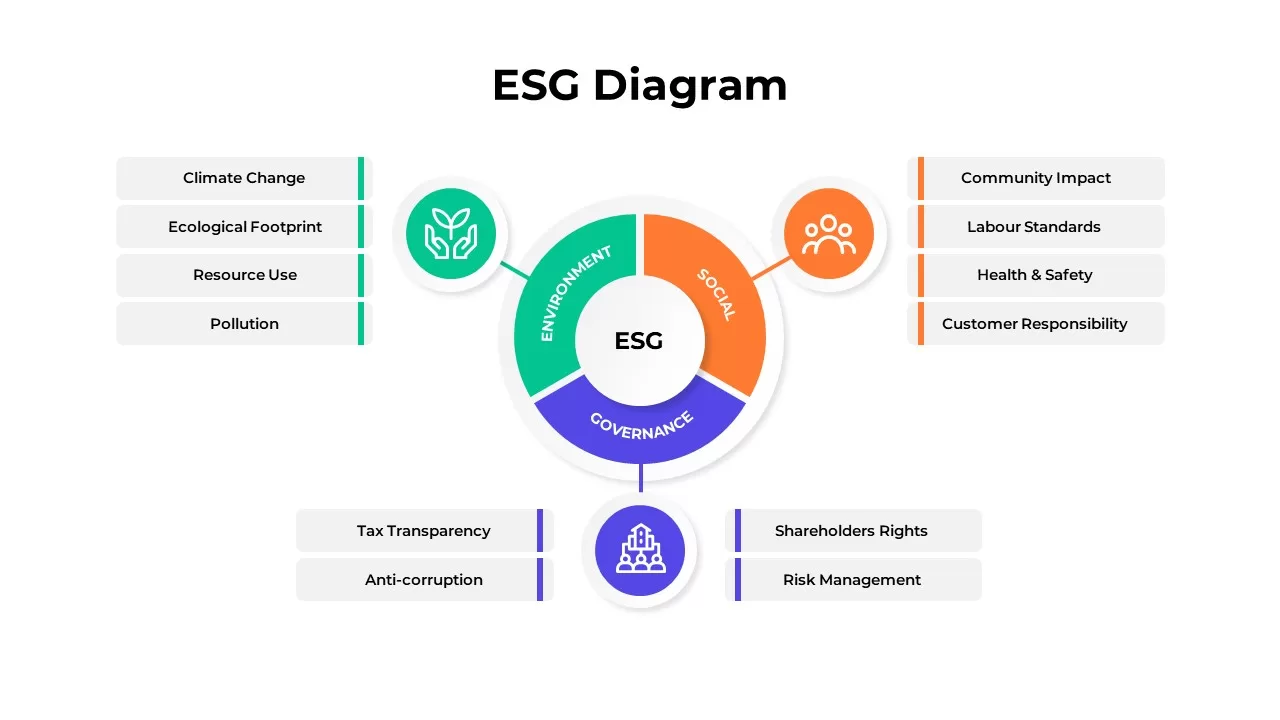
ESG Framework Segmentation Diagram for PowerPoint & Google Slides
Risk Management
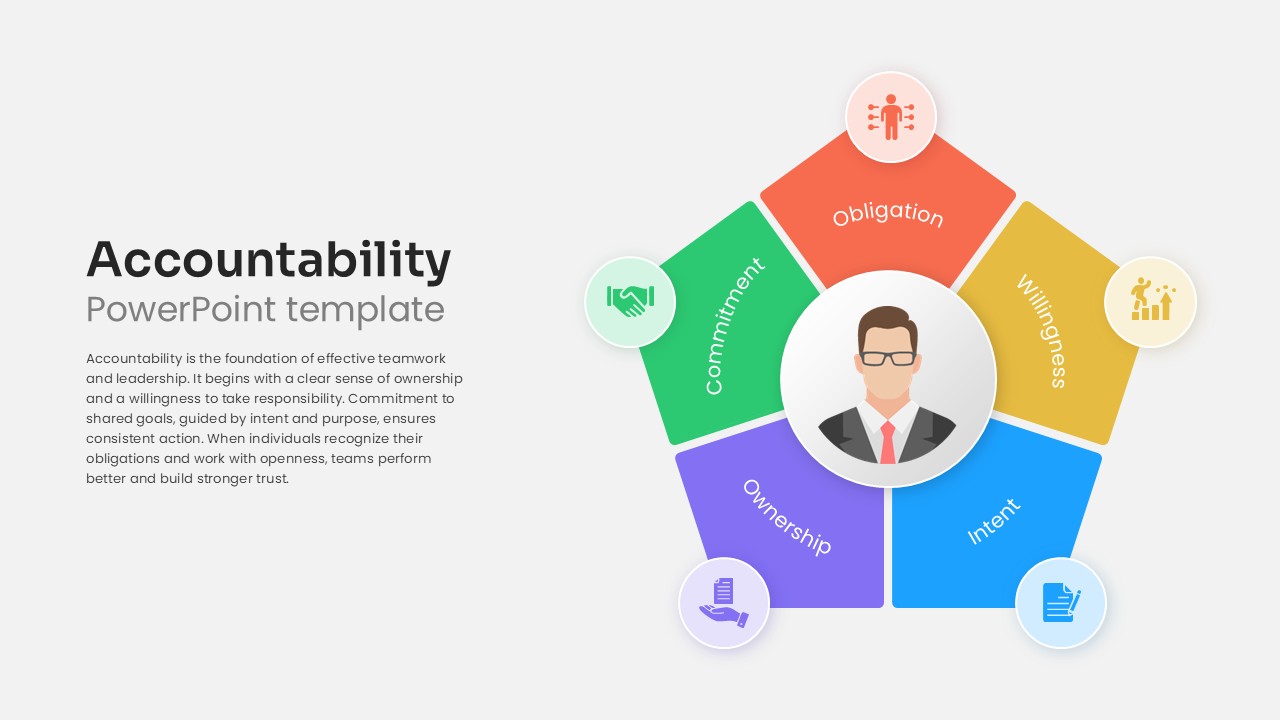
Accountability Framework PowerPoint template for PowerPoint & Google Slides
Leadership
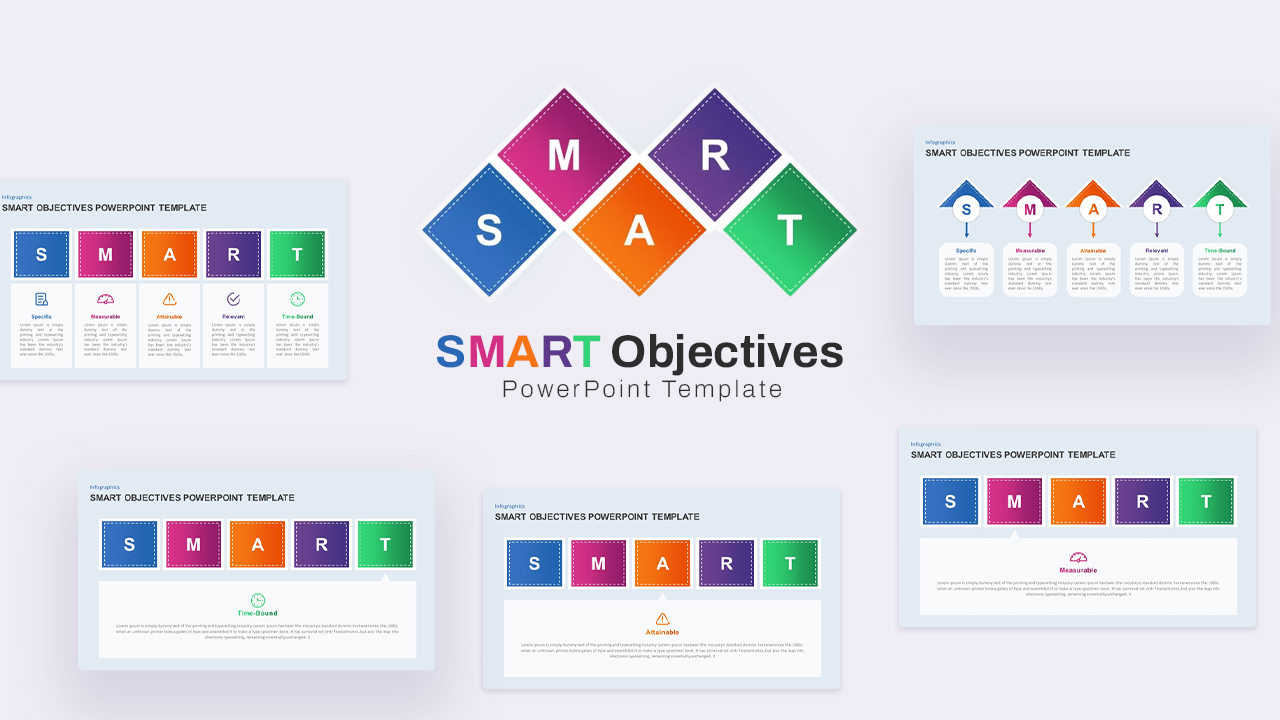
SMART Objectives – 5 Goals Framework Template for PowerPoint & Google Slides
Goals
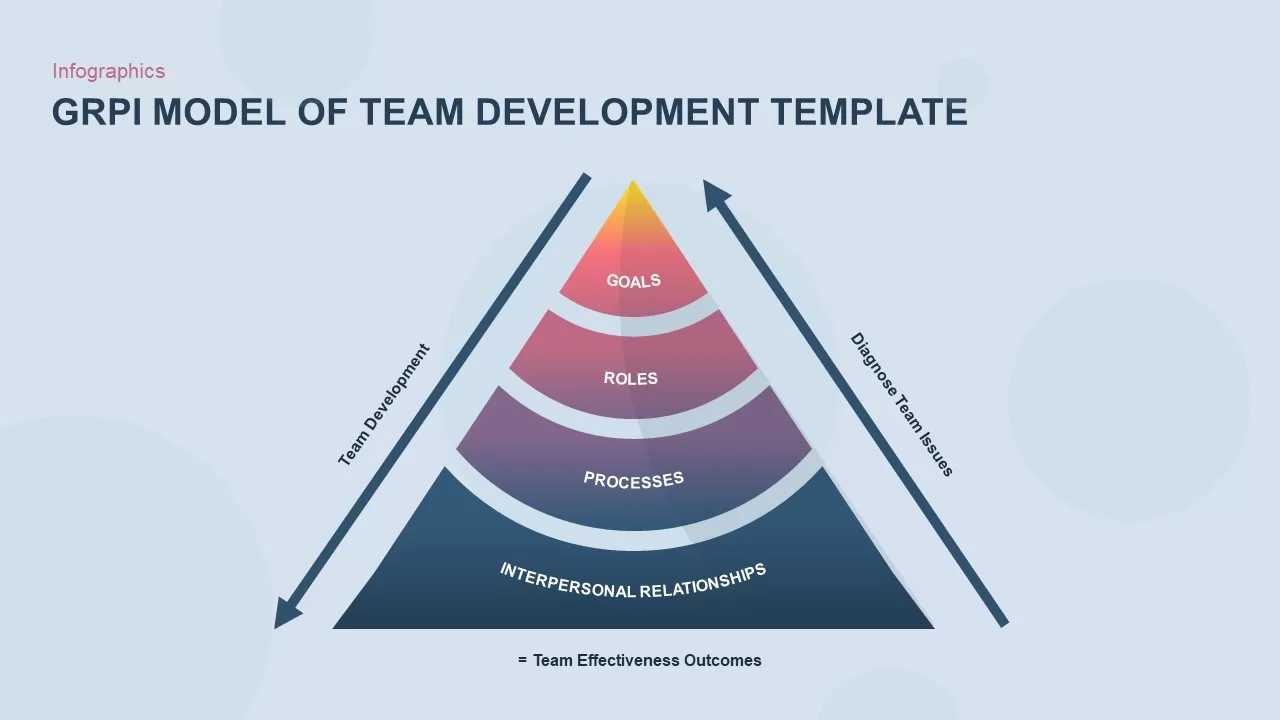
GRPI Model of Team Development Framework Template for PowerPoint & Google Slides
Leadership
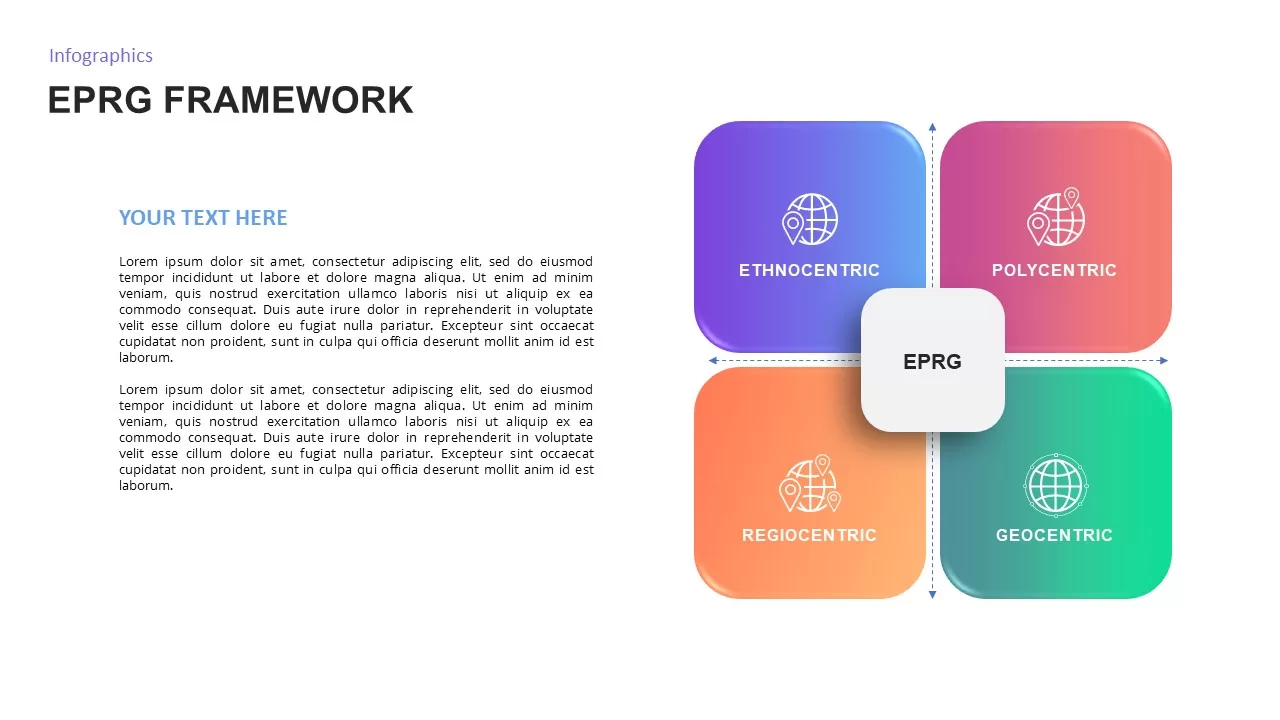
EPRG Framework Analysis template for PowerPoint & Google Slides
Business Strategy
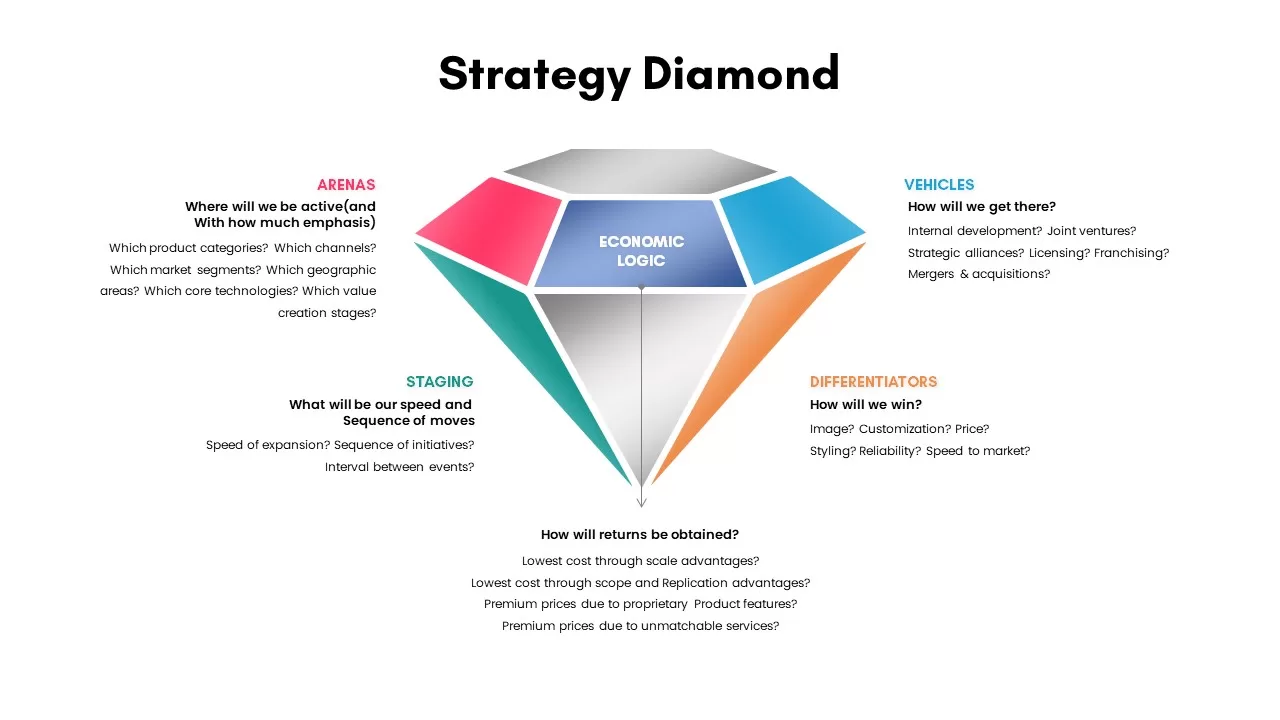
Strategy Diamond Framework Visual Template for PowerPoint & Google Slides
Competitor Analysis
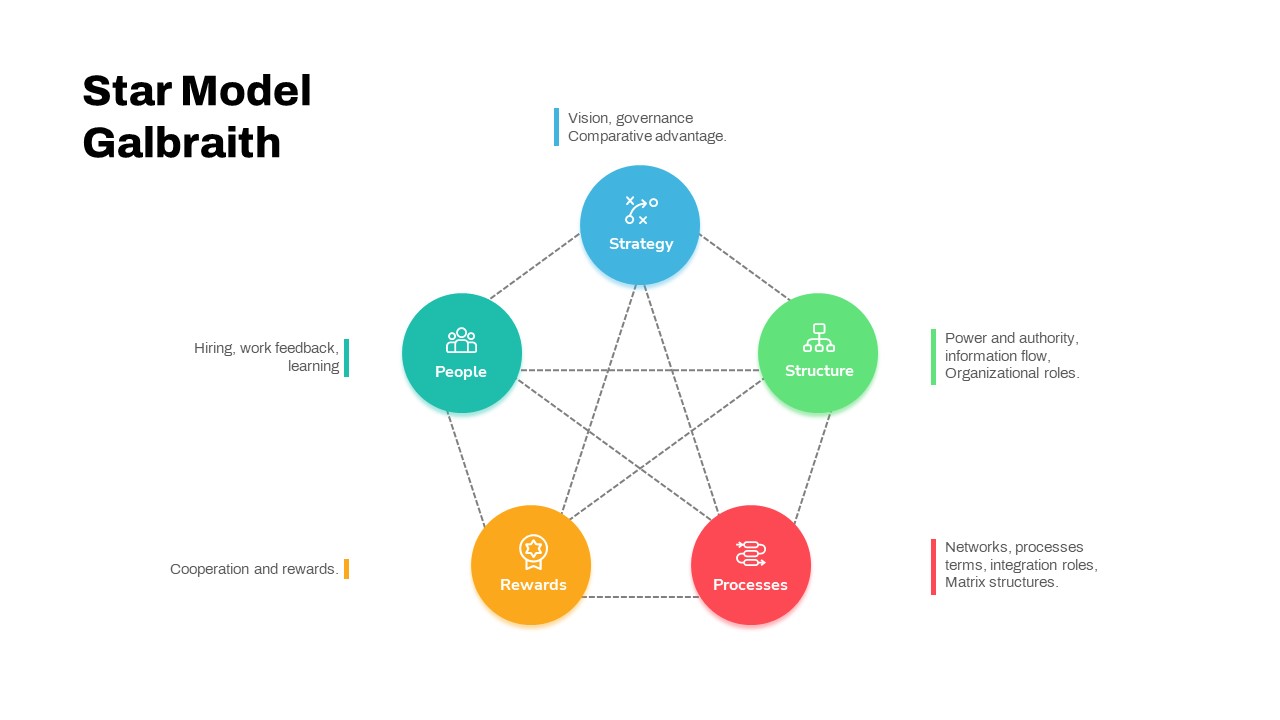
Star Model Galbraith Framework Template for PowerPoint & Google Slides
Business Strategy
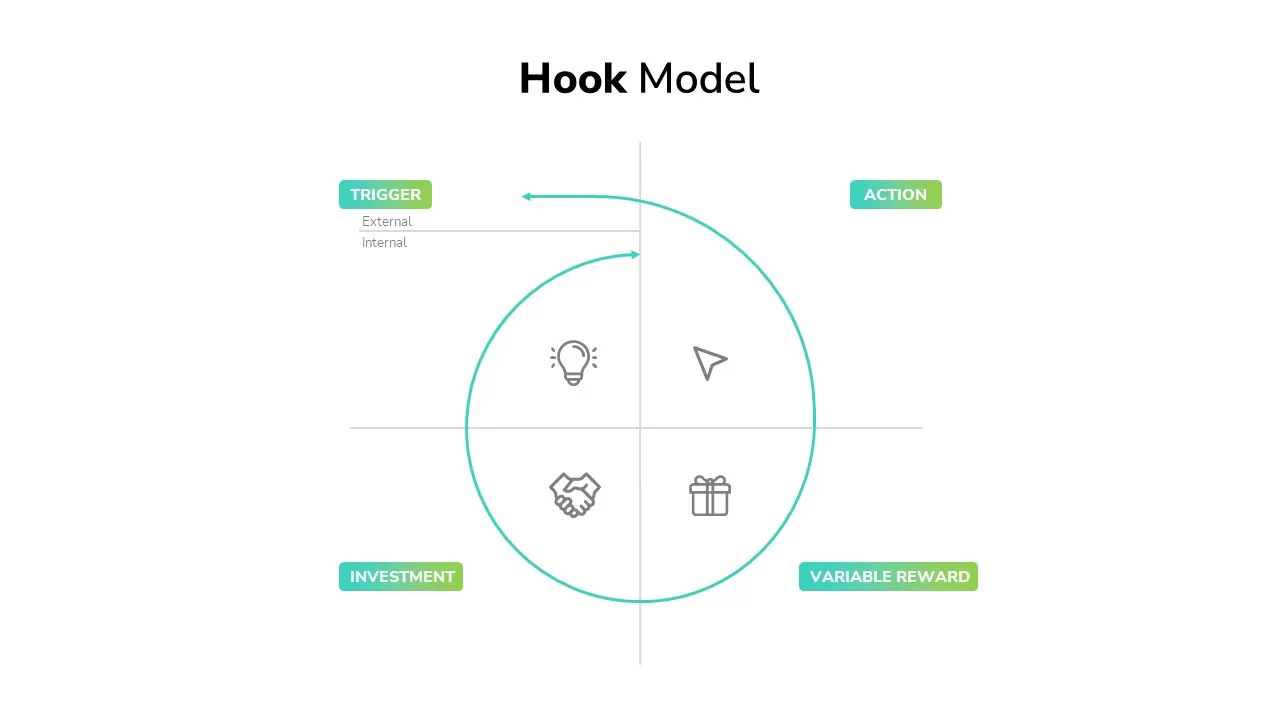
Hook Model Framework Template for PowerPoint & Google Slides
Business Strategy
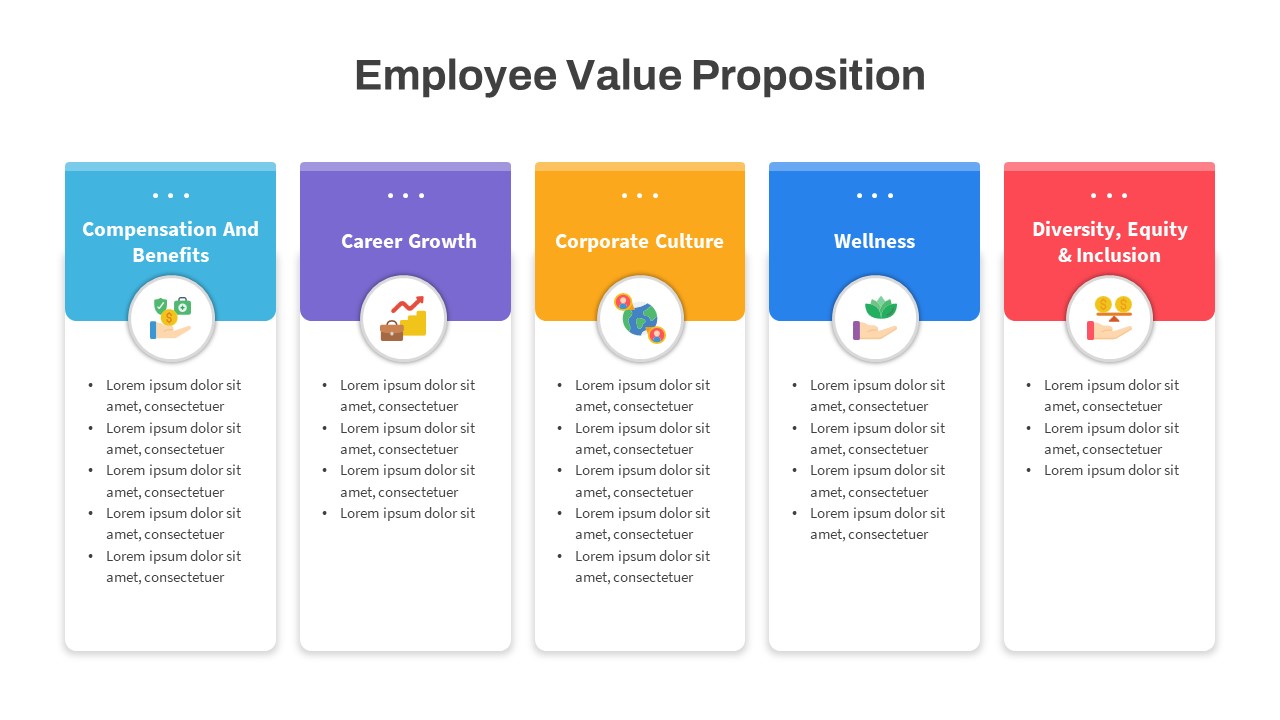
Employee Value Proposition Framework Template for PowerPoint & Google Slides
Recruitment
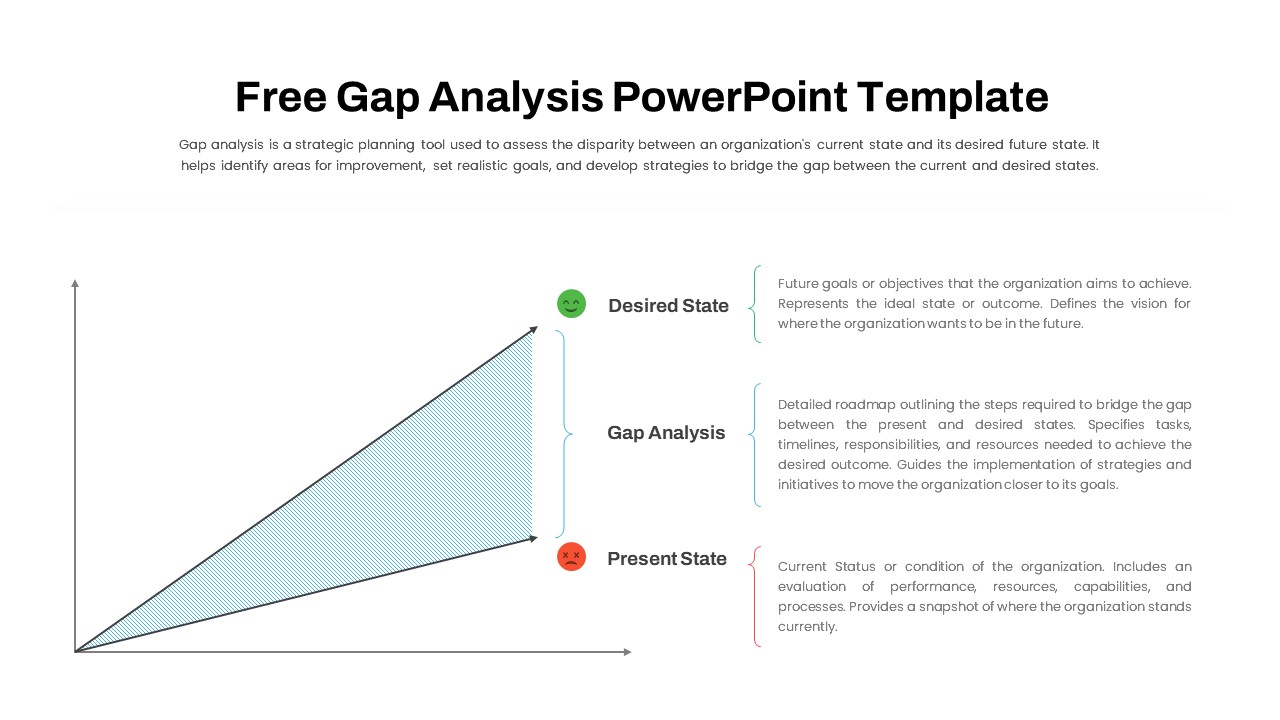
Free Comprehensive Gap Analysis Framework Template for PowerPoint & Google Slides
Opportunities Challenges
Free
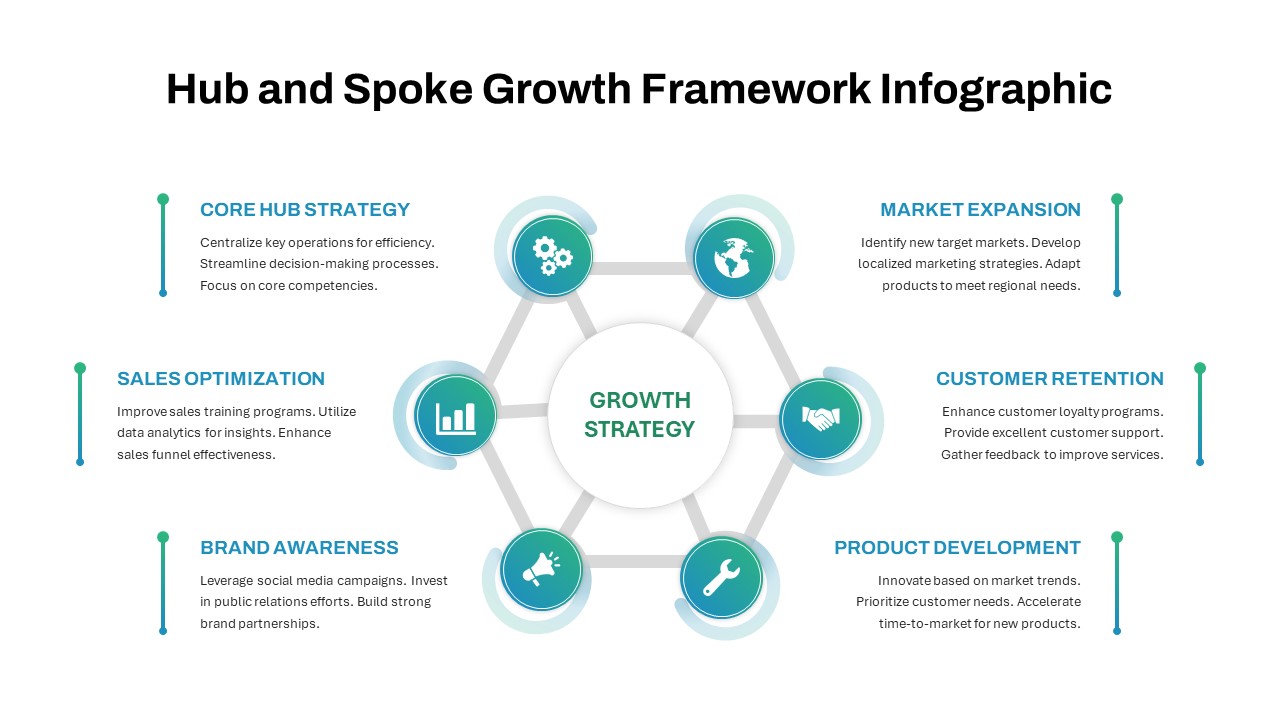
Hub and Spoke Growth Framework Template for PowerPoint & Google Slides
Circular
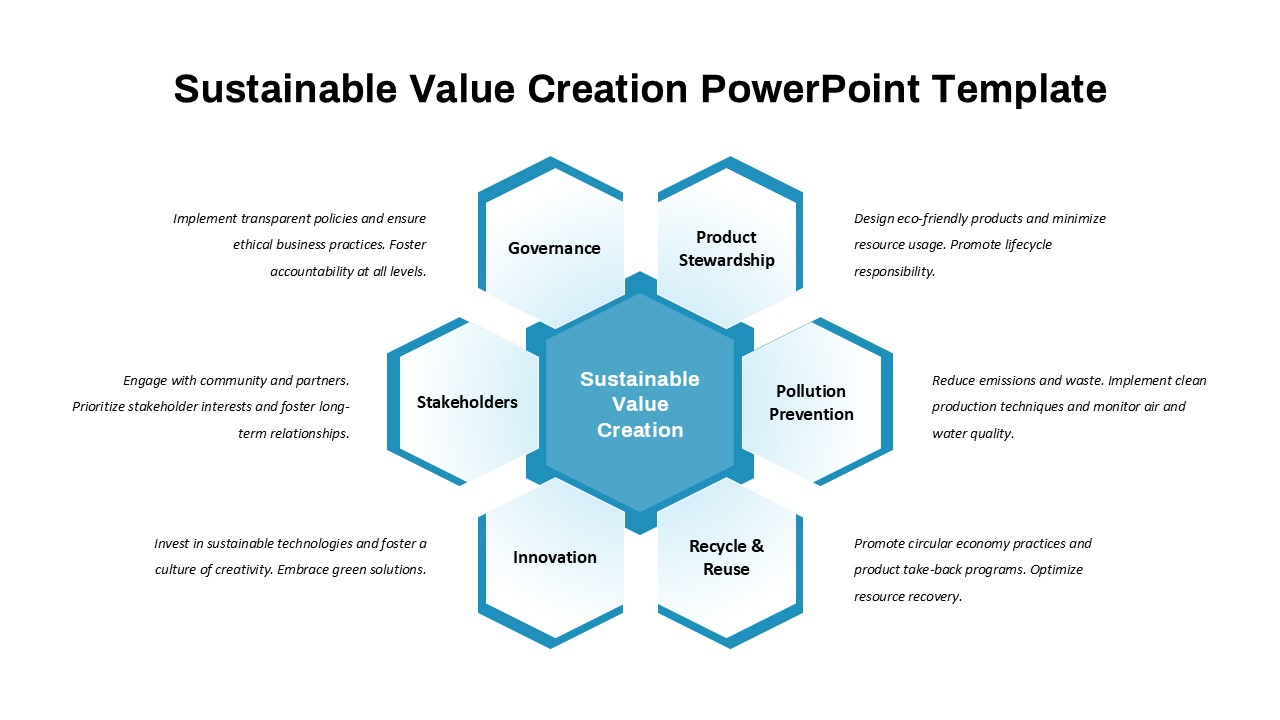
Sustainable Value Creation Framework Template for PowerPoint & Google Slides
Process
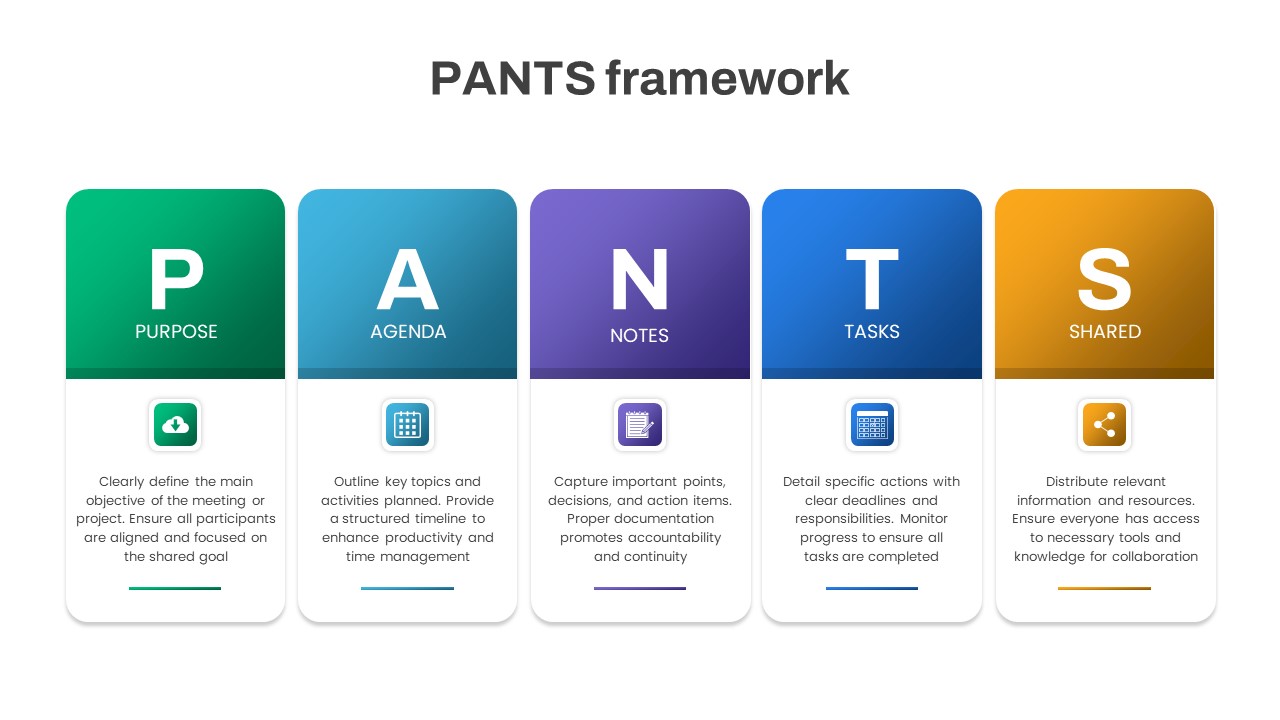
PANTS Framework for Effective Meetings Template for PowerPoint & Google Slides
Process
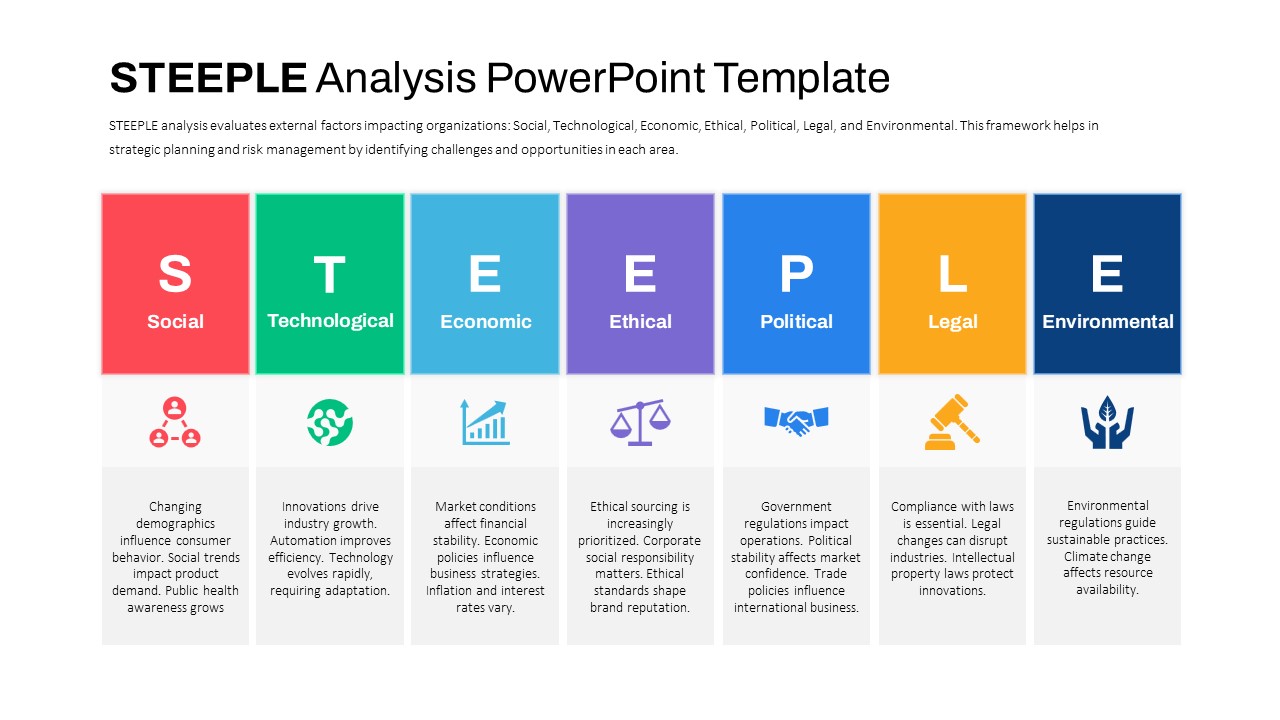
STEEPLE Analysis framework template for PowerPoint & Google Slides
Business Strategy
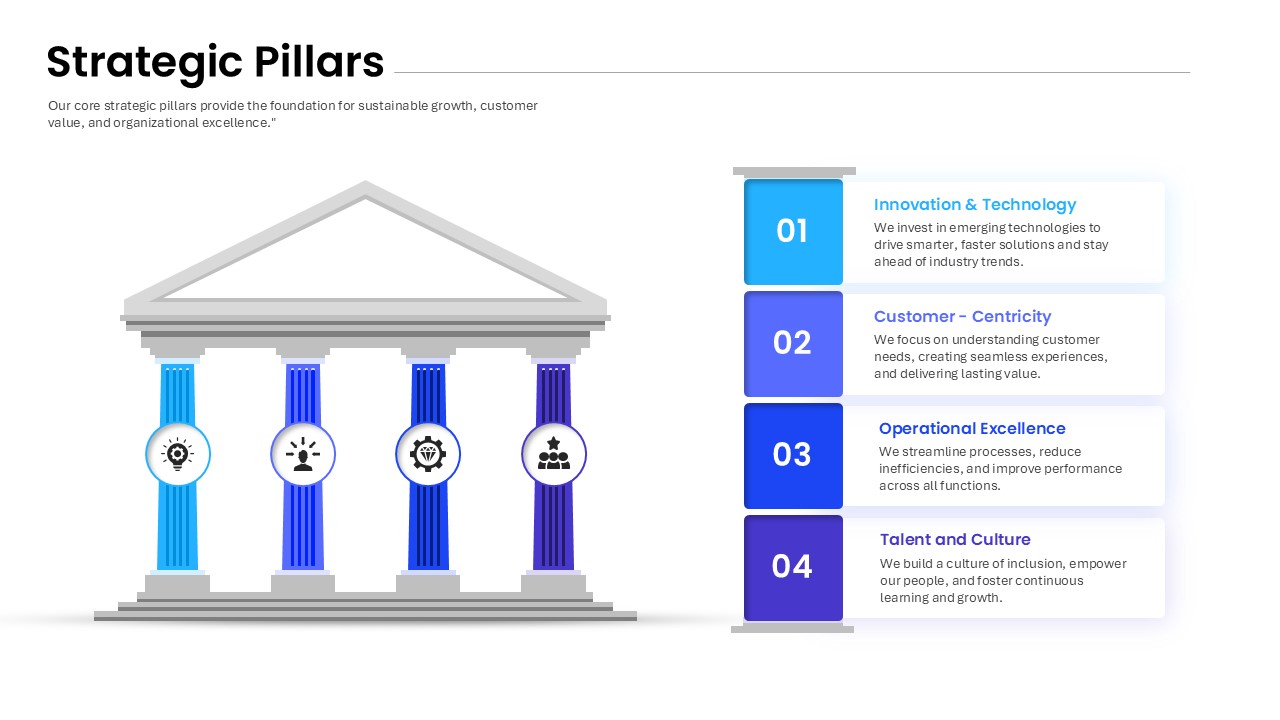
Strategic Pillars Foundation Framework Template for PowerPoint & Google Slides
Business Strategy
Personal Branding Canvas Framework Template for PowerPoint & Google Slides
Circular
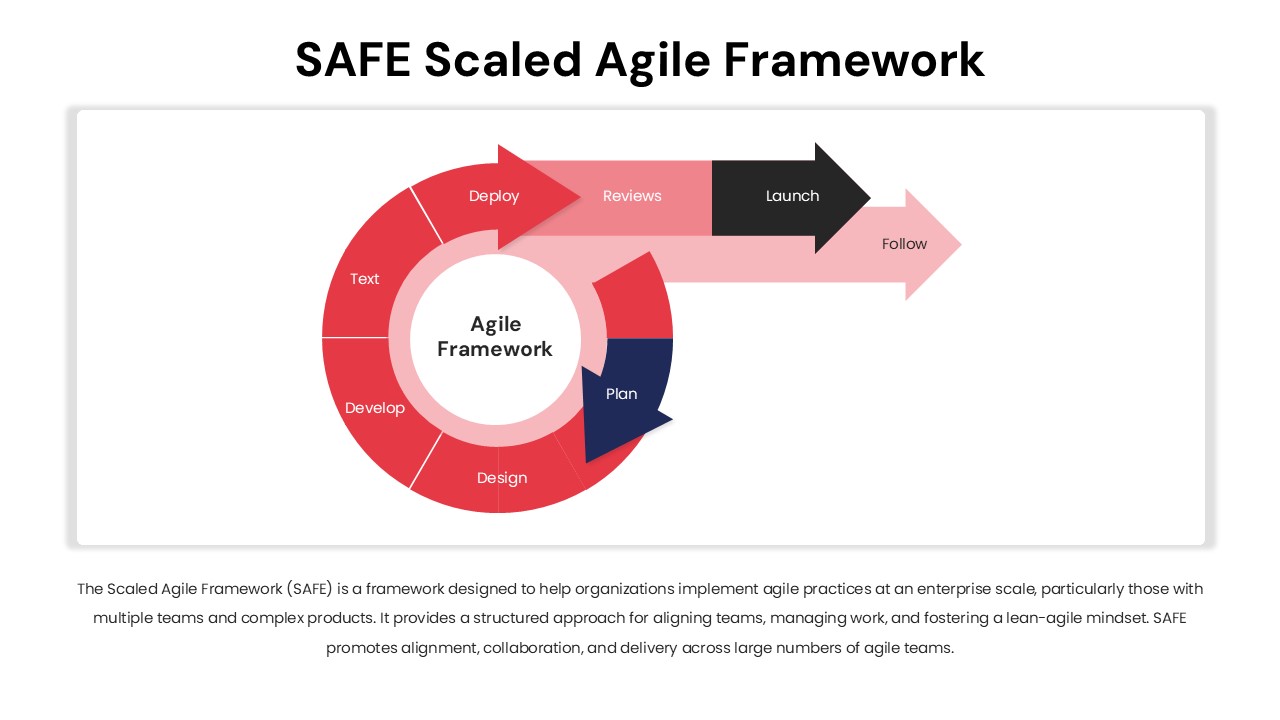
SAFE Scaled Agile Framework Template for PowerPoint & Google Slides
Process
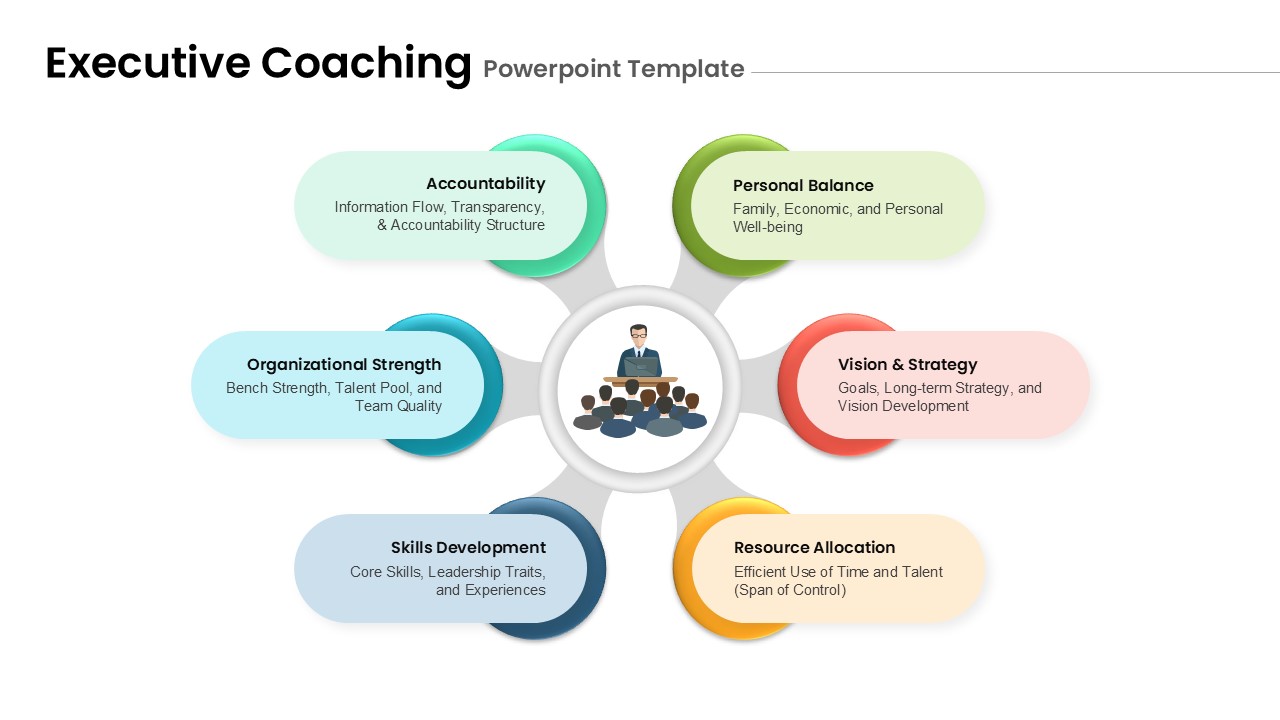
Executive Coaching Framework template for PowerPoint & Google Slides
Leadership
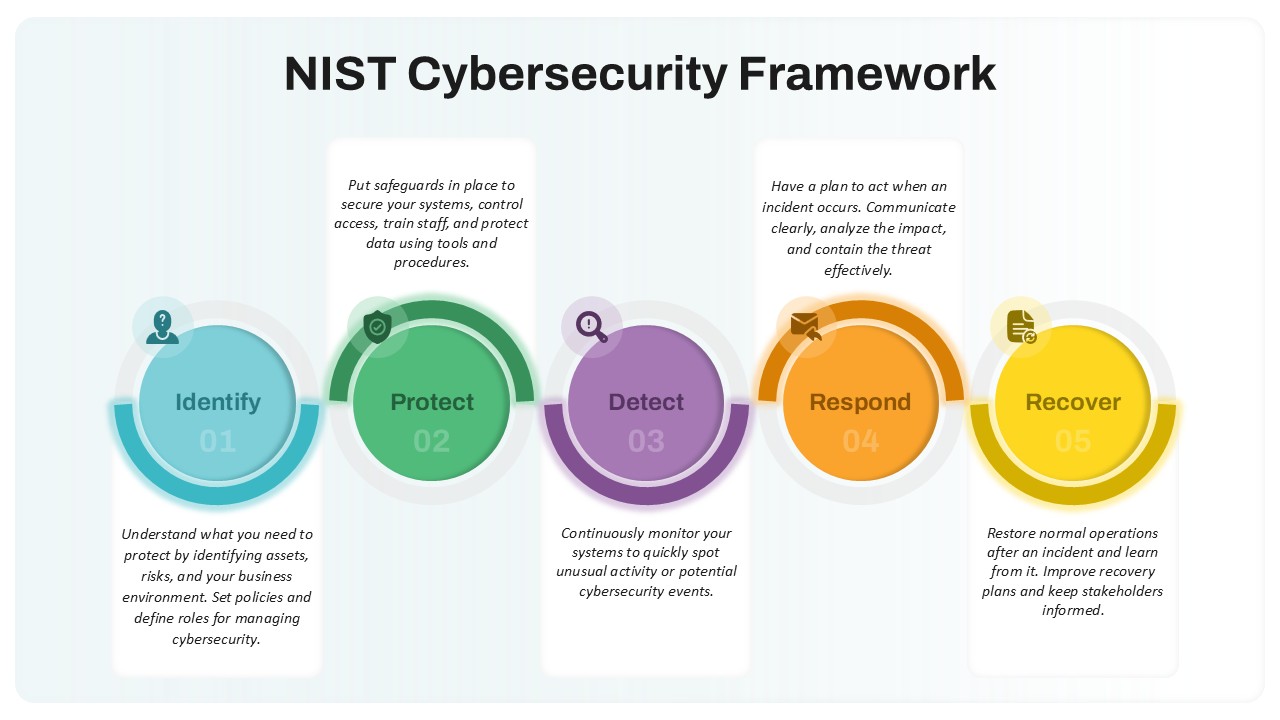
NIST Cybersecurity Framework Overview template for PowerPoint & Google Slides
Technology

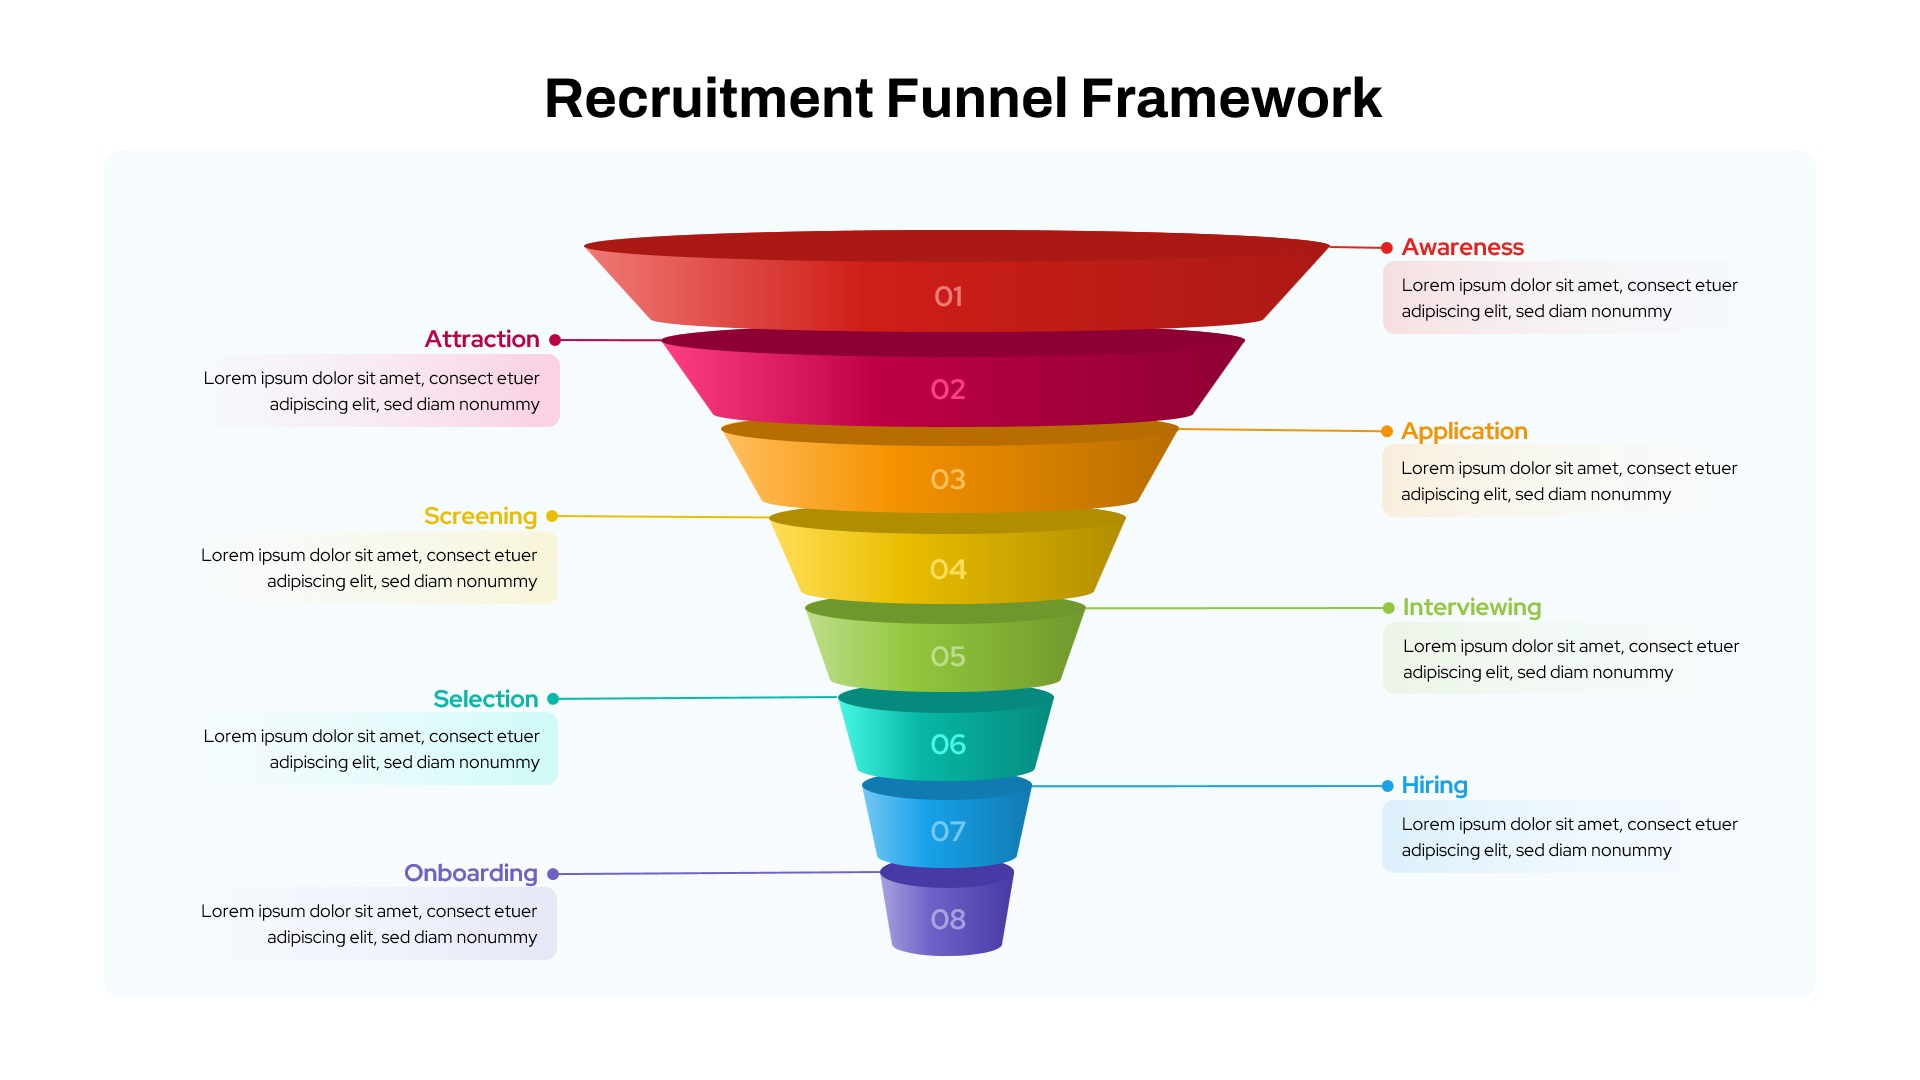
Recruitment Funnel Framework template for PowerPoint & Google Slides
Recruitment
Pirate Metrics AARRR Funnel Framework Template for PowerPoint & Google Slides
Funnel
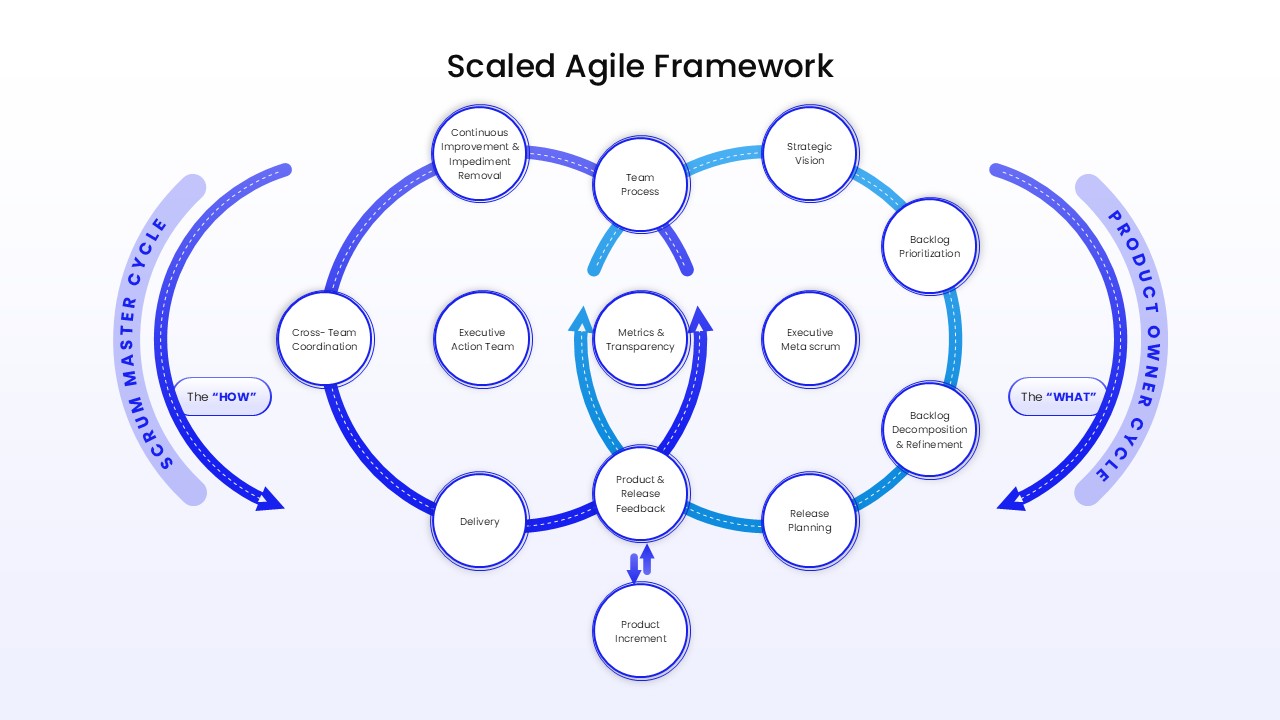
Two-Cycle Scaled Agile Framework Template for PowerPoint & Google Slides
Scrum
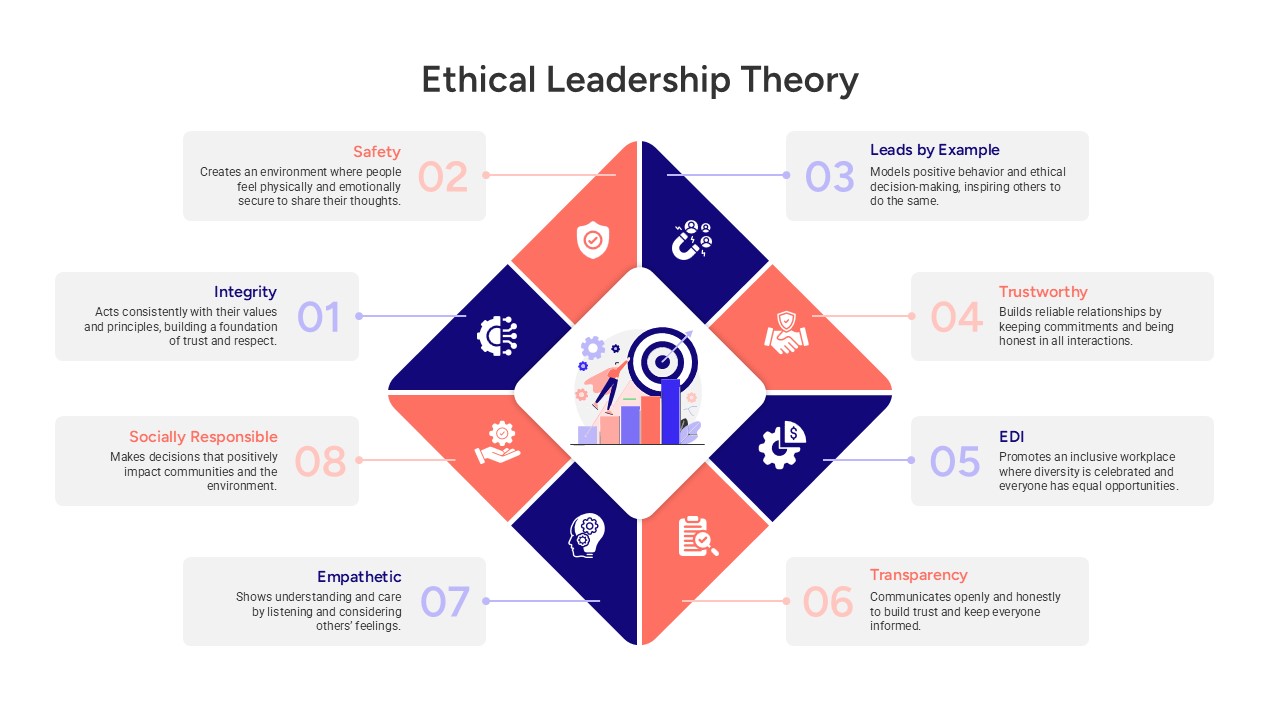
Ethical Leadership Theory Framework Template for PowerPoint & Google Slides
Leadership
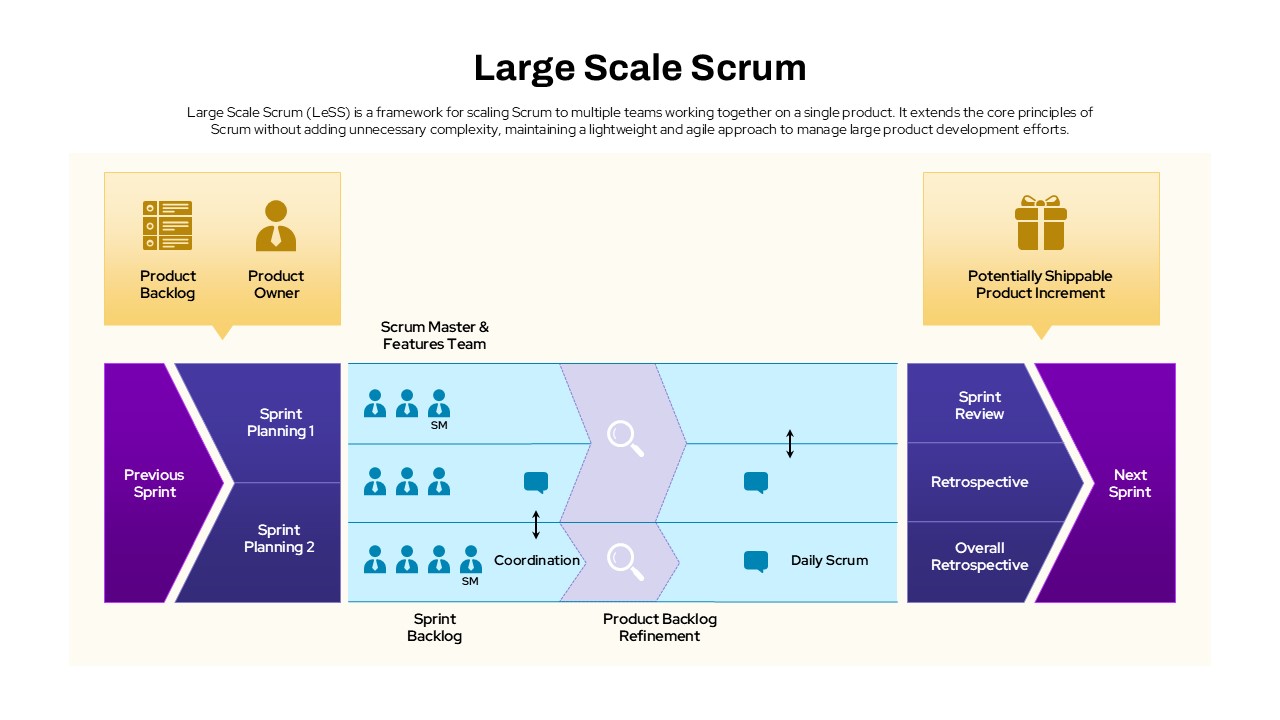
Large Scale Scrum Framework Process Template for PowerPoint & Google Slides
Scrum
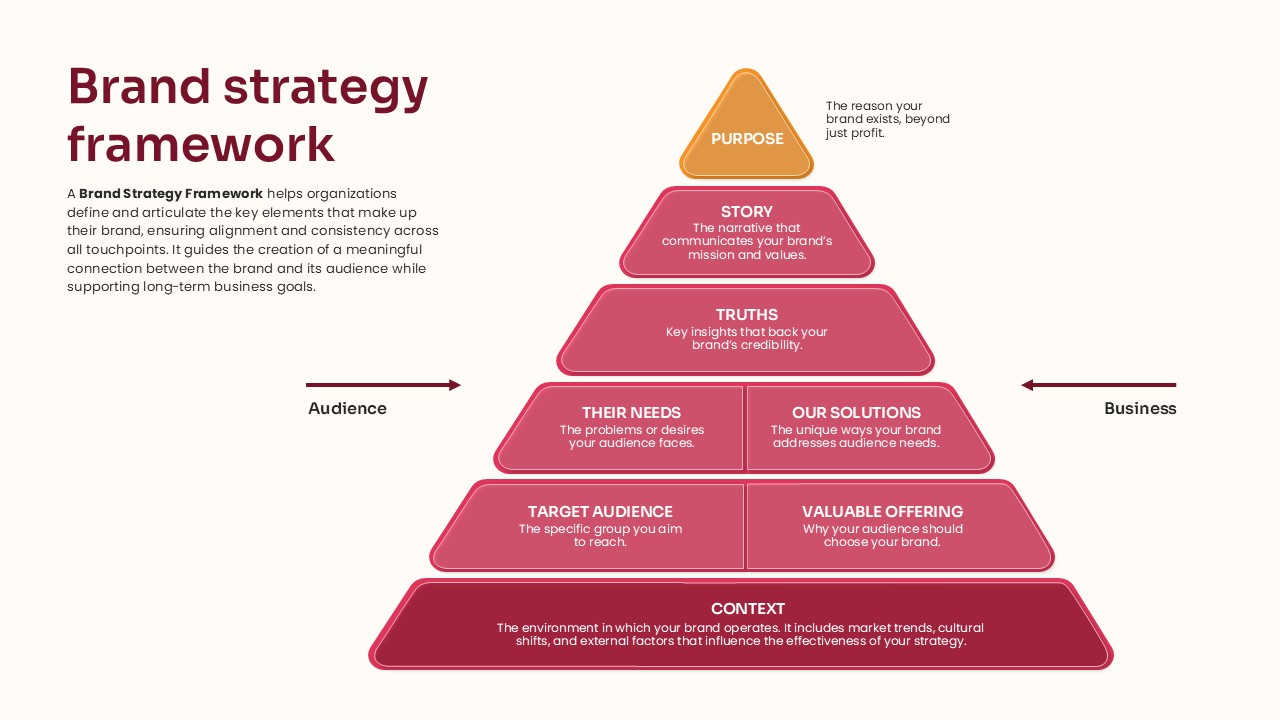
Pyramid Brand Strategy Framework Template for PowerPoint & Google Slides
Business Strategy
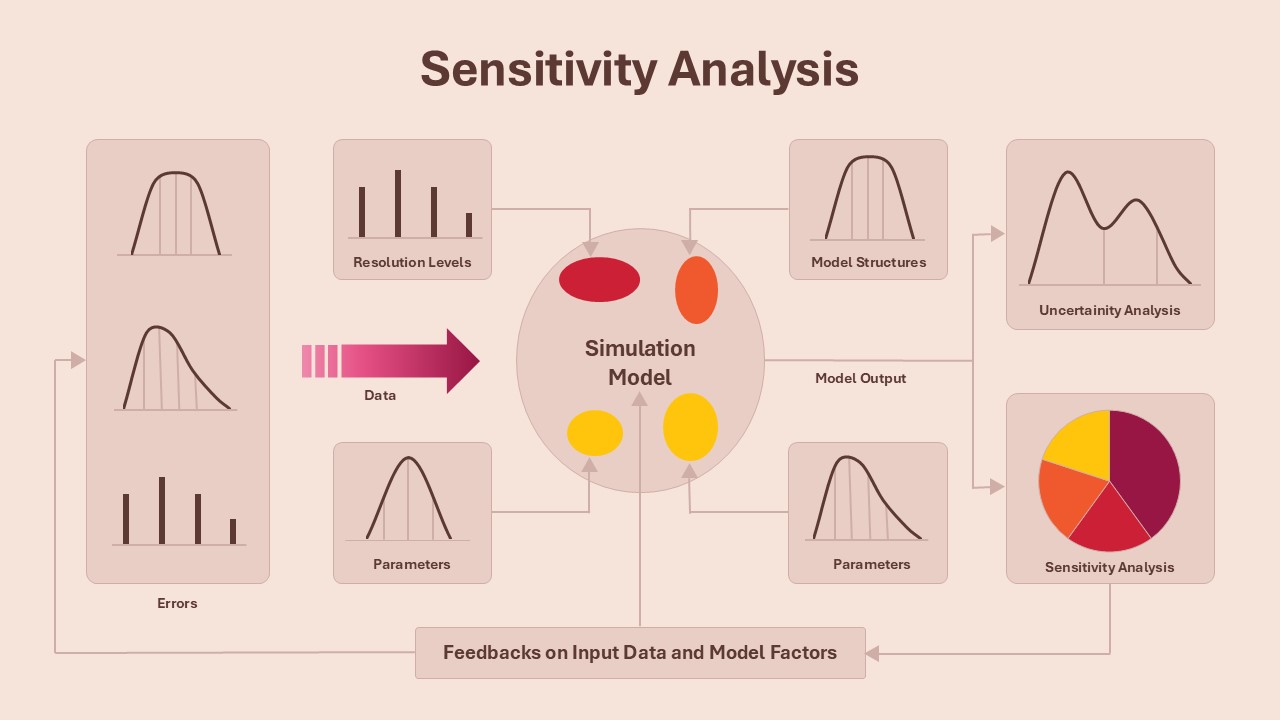
Sensitivity Analysis Framework template for PowerPoint & Google Slides
Business Strategy
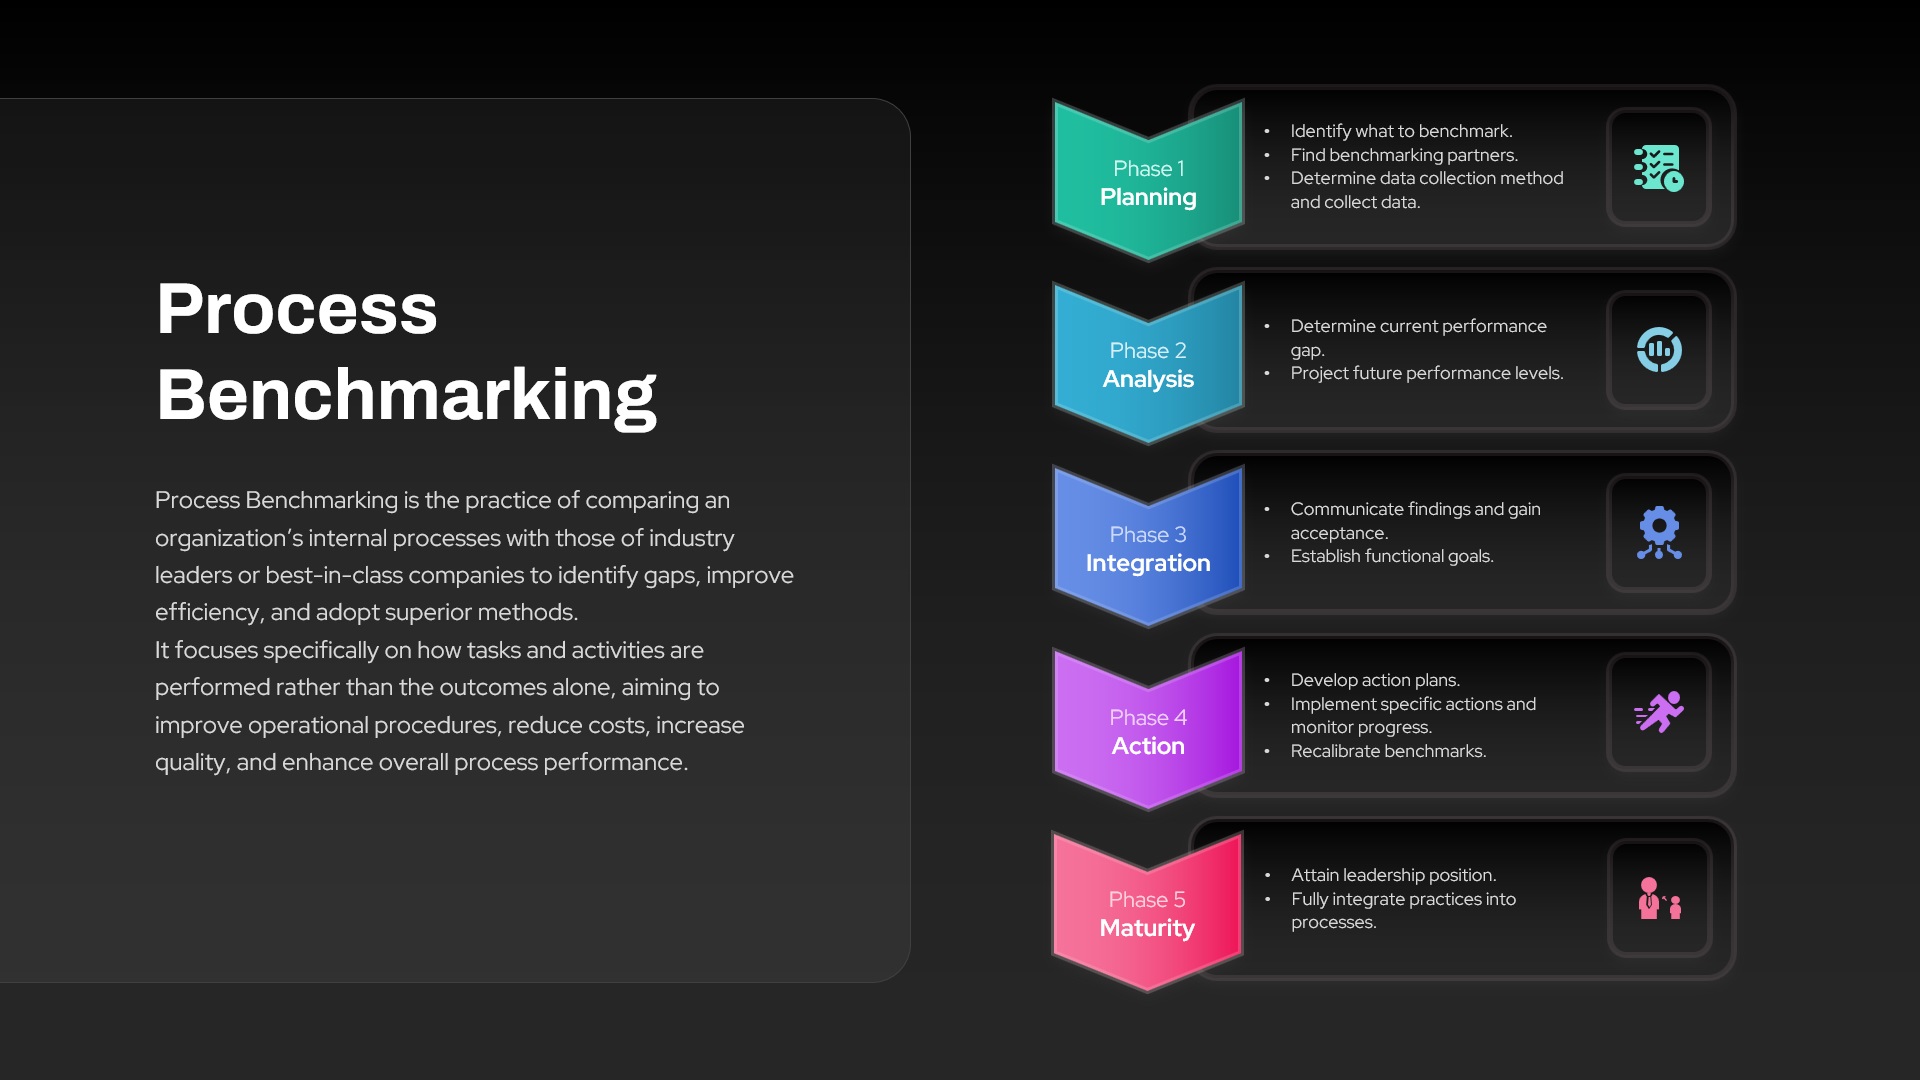
Process Benchmarking Five-Phase Framework Template for PowerPoint & Google Slides
Process
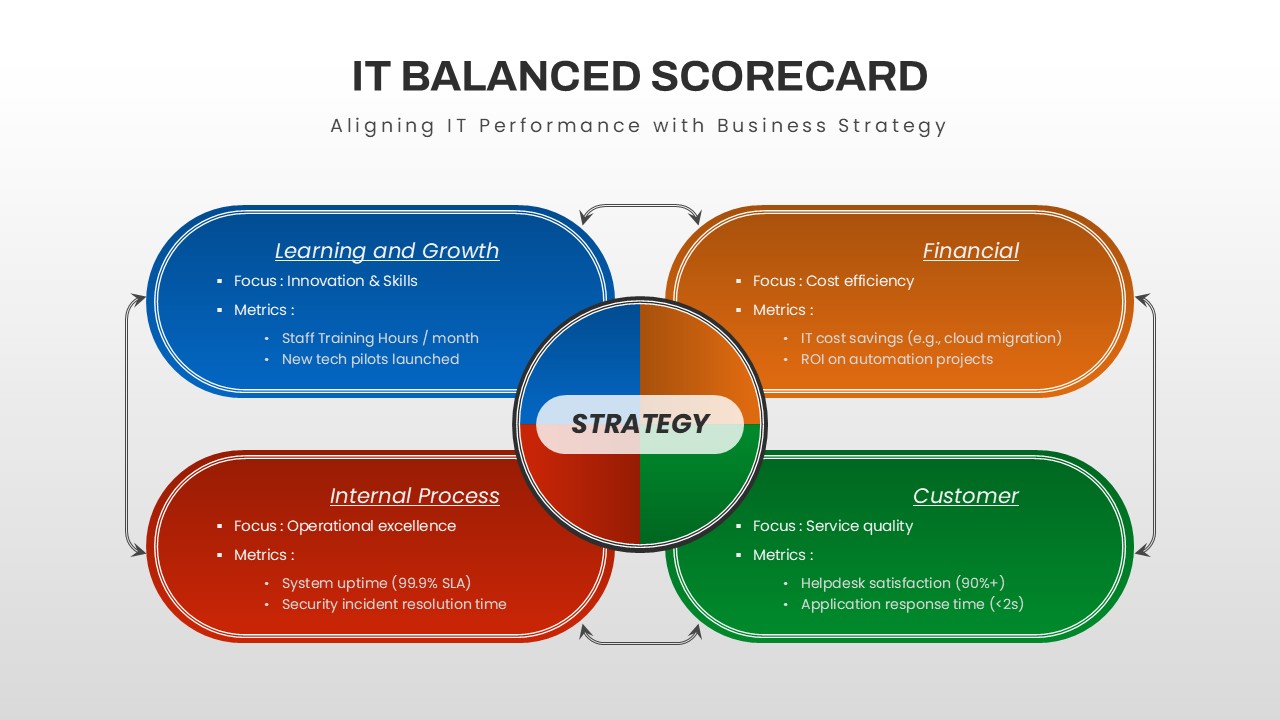
IT Balanced Scorecard Strategy Framework Template for PowerPoint & Google Slides
Business Strategy
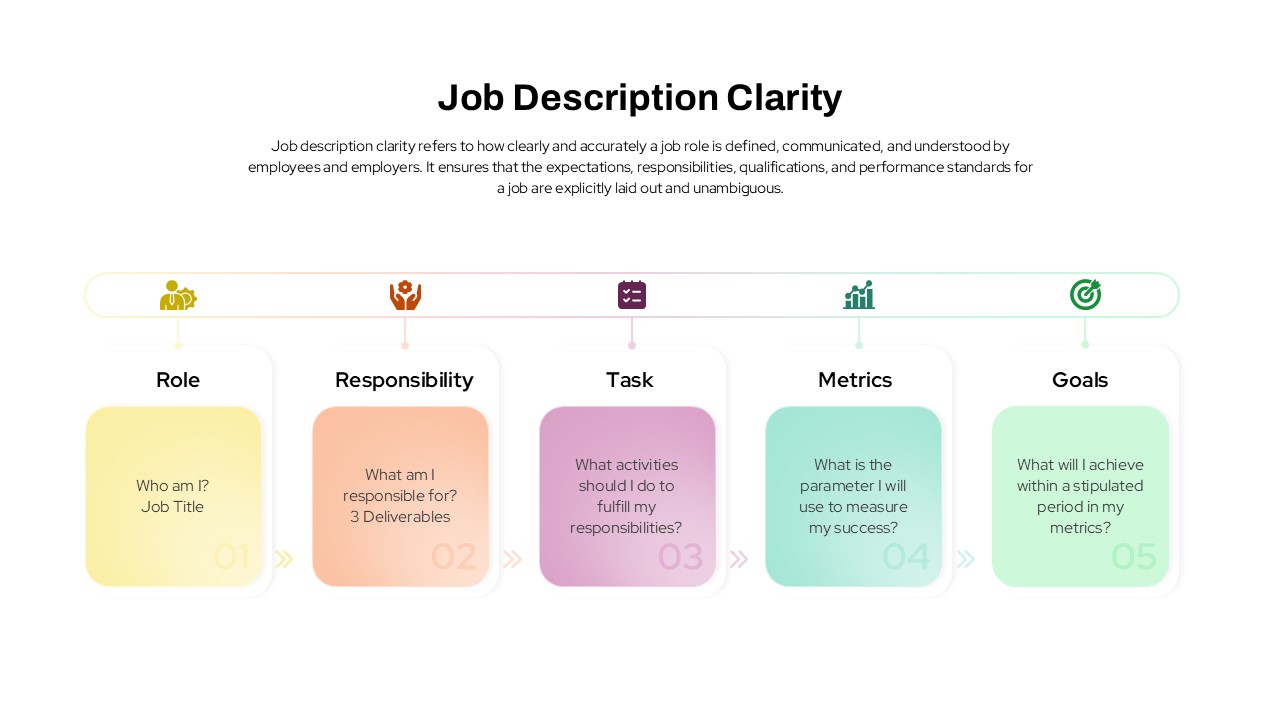
Job Description Clarity Framework template for PowerPoint & Google Slides
Business
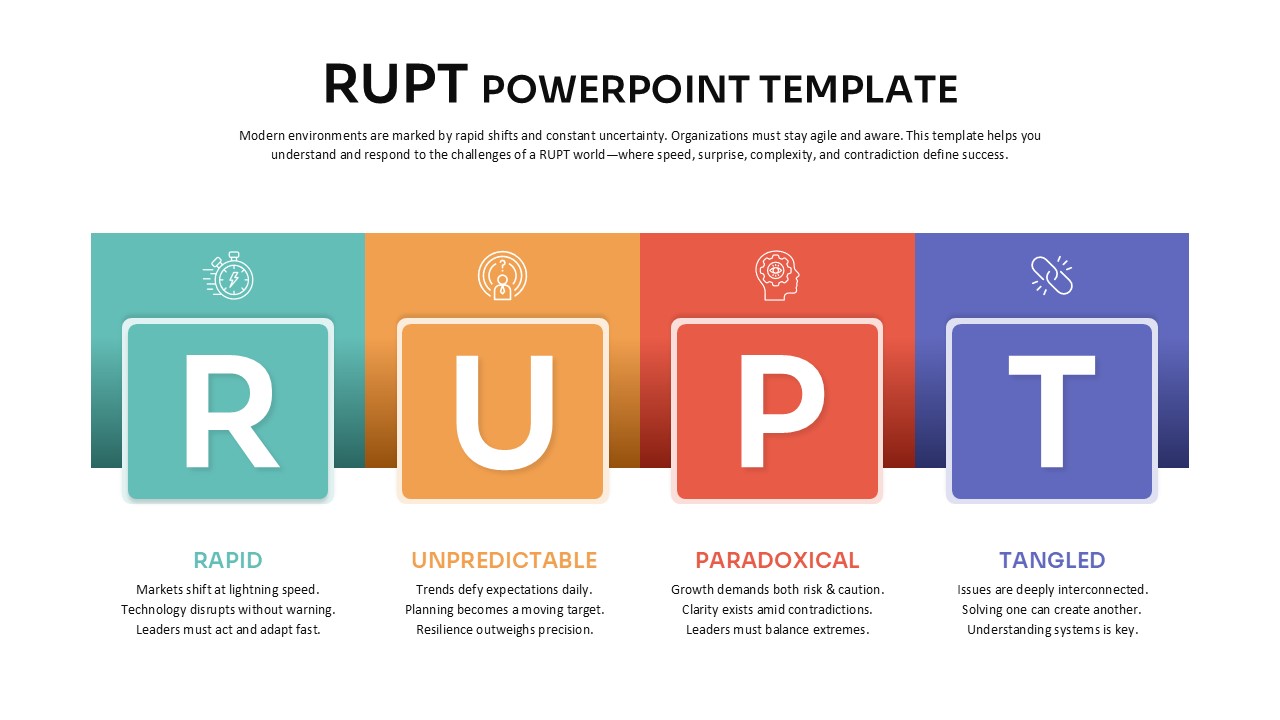
RUPT Framework template for PowerPoint & Google Slides
Business
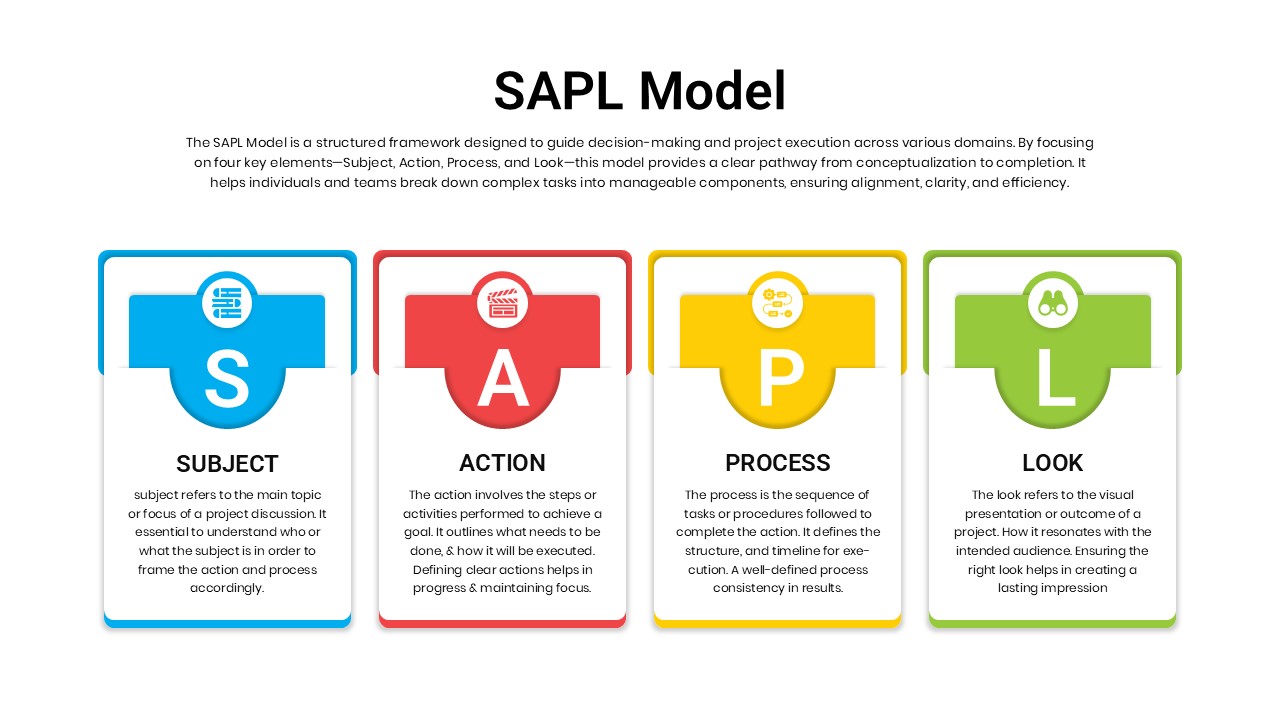
SAPL Model Framework template for PowerPoint & Google Slides
Business
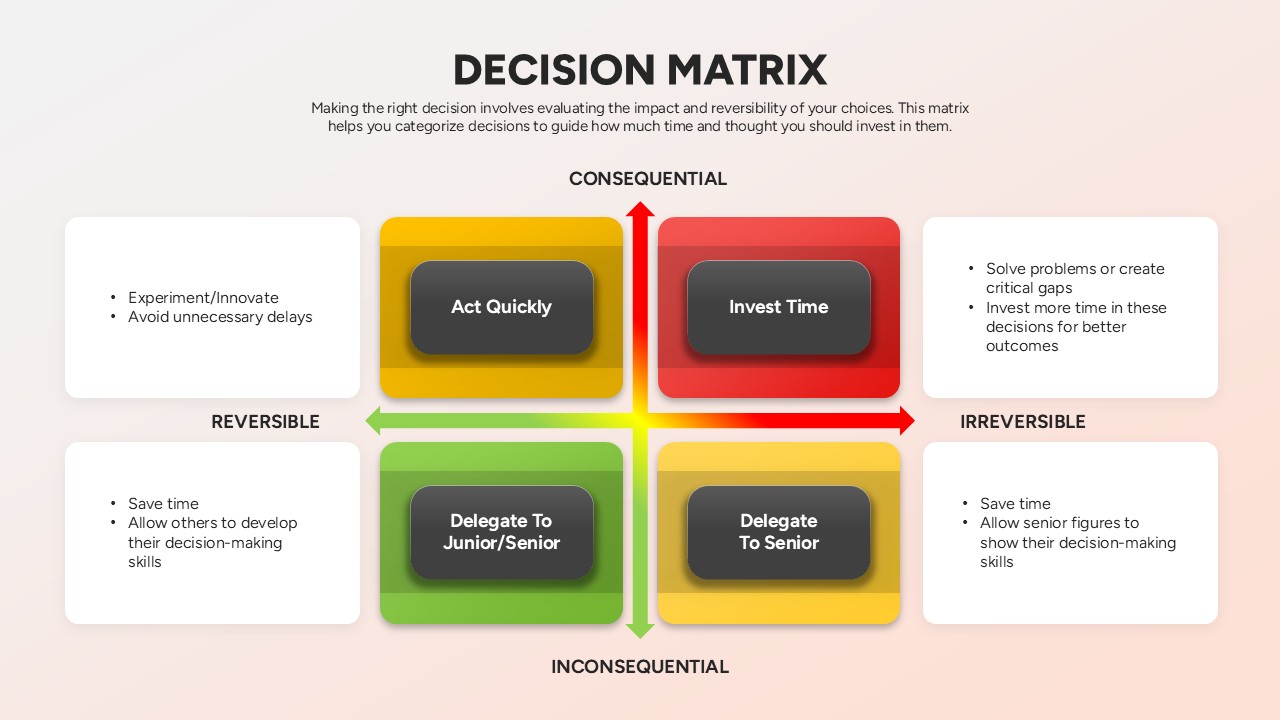
Decision Matrix Evaluation Framework Slide Template for PowerPoint & Google Slides
Leadership
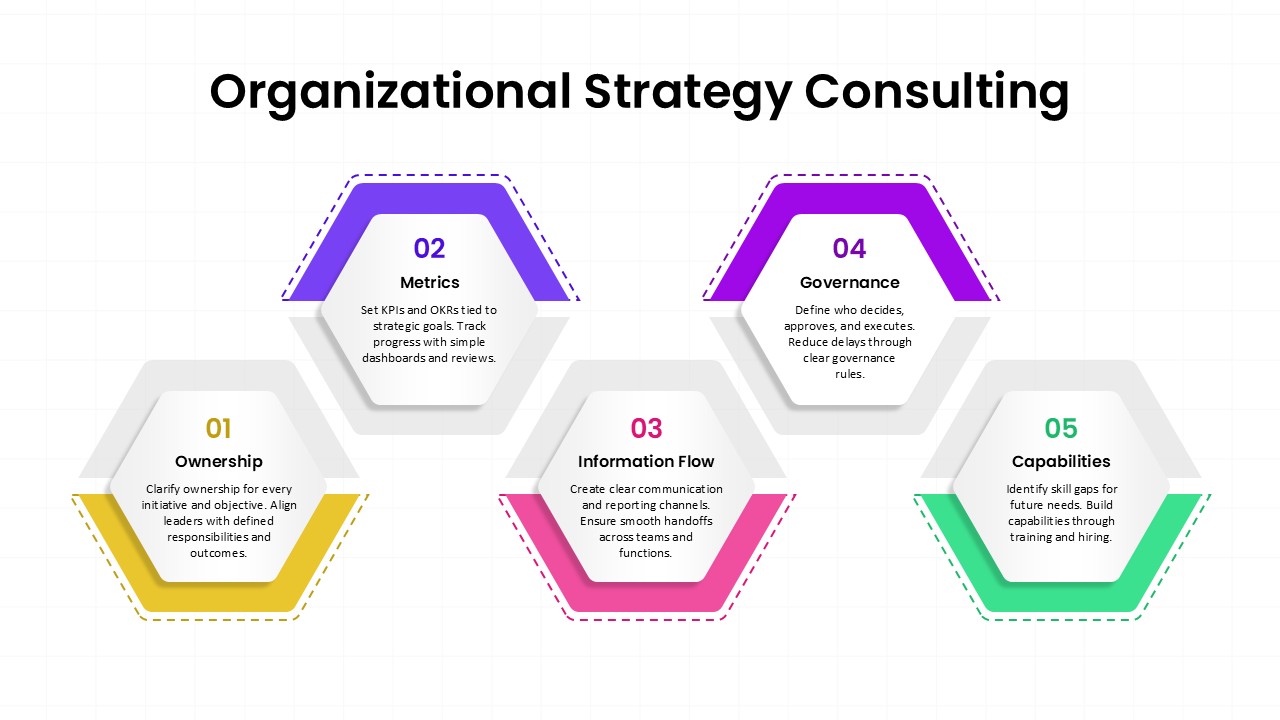
Organizational Strategy Consulting Framework Template for PowerPoint & Google Slides
Consulting
Financial Gap Analysis Framework Template for PowerPoint & Google Slides
Finance
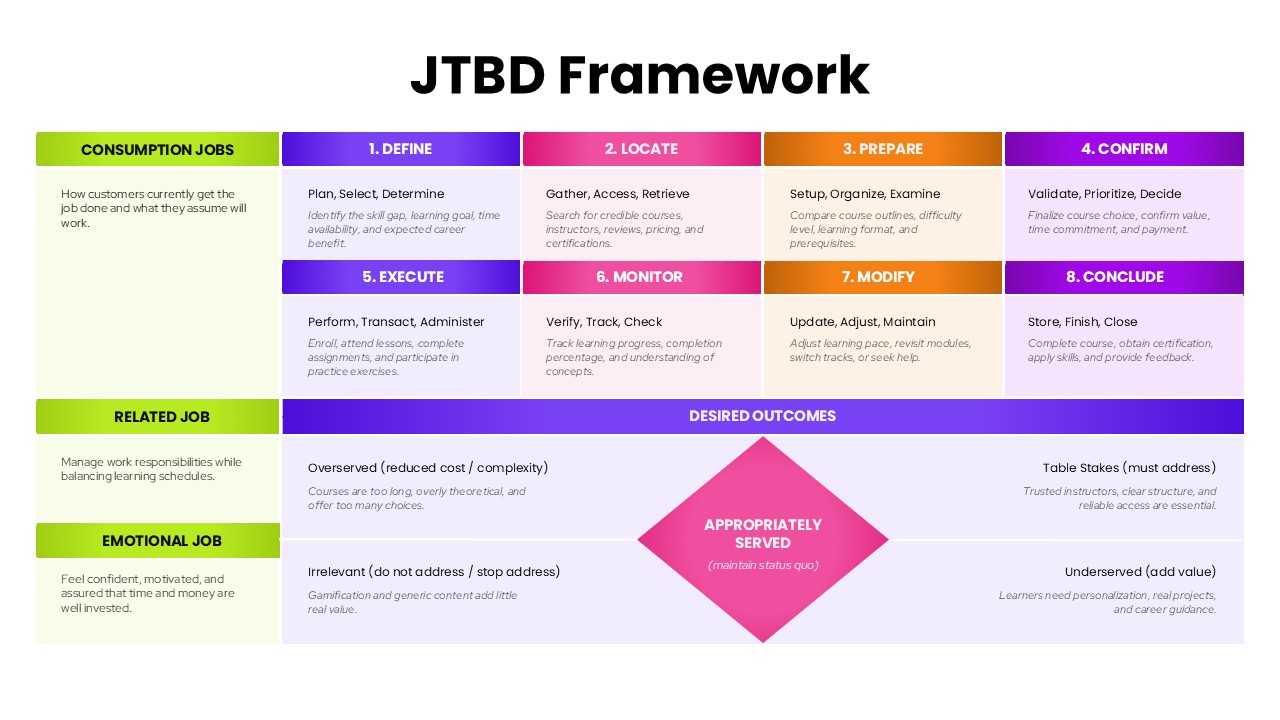
JTBD Framework Process and Outcomes Matrix Template for PowerPoint & Google Slides
Marketing