Magnifying Glass Research Metaphor Template for PowerPoint & Google Slides

Description
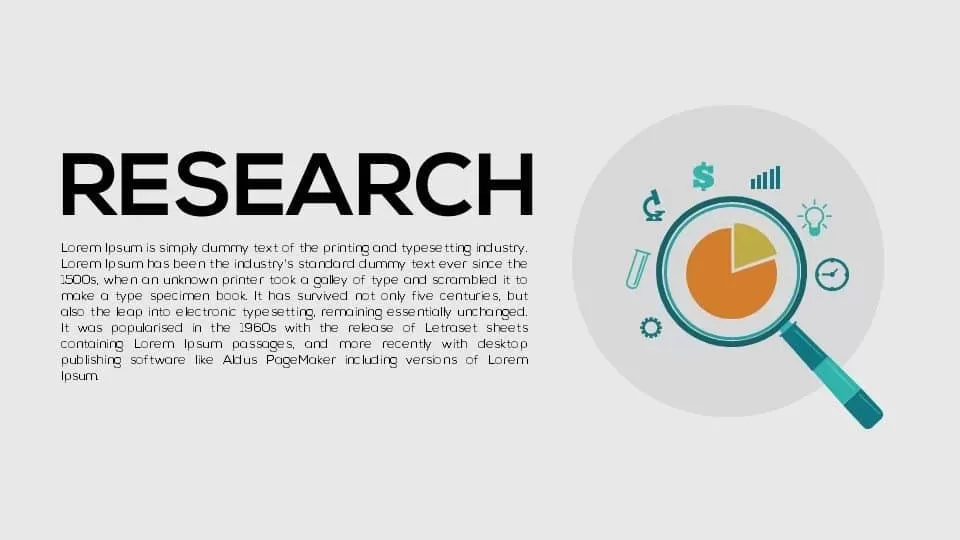
Leverage this research metaphor slide to spotlight key insights with a compelling visual narrative. On the right, a high-resolution vector magnifying glass hovers over a multicolored pie chart inside a muted gray circle, symbolizing in-depth analysis and data-driven discovery. Surrounding the chart are editable icon glyphs—dollar sign, bar chart, network nodes, and more—emphasizing financial metrics, performance indicators, and strategic connections. To the left, a spacious text area accommodates a bold headline and up to three paragraphs of explanatory content, making it easy to contextualize findings or summarize research objectives.
Built on master slides and fully vector-based, every element is editable for rapid customization: adjust pie-slice colors, swap out icons, resize the magnifier, or update text placeholders in seconds. The clean white background and minimalist typography ensure maximum readability, while balanced white space and subtle drop shadows enhance visual hierarchy. Semi-transparent gradient arrows on the slide margins hint at guided storytelling or carousel-style navigation, inviting your audience through each stage of analysis.
Ideal for market research, competitive intelligence, academic presentations, or product usability studies, this template transforms abstract data into a cohesive visual story. Duplicate the slide to compare quarterly results, regional breakdowns, or experimental cohorts without disrupting design integrity. With seamless compatibility across PowerPoint and Google Slides, you’ll maintain pixel-perfect clarity on any platform and eliminate formatting headaches during collaboration.
Who is it for
Market researchers, business analysts, data scientists, and product strategists will leverage this slide to present survey results, financial breakdowns, or UX research findings in executive briefings, stakeholder meetings, or academic lectures.
Other Uses
Repurpose this layout for competitive benchmarking, customer segmentation reports, KPI dashboards, or investment pitch decks. Swap the magnifying glass for a lens icon, adjust pie chart segments for new metrics, or reposition icons to highlight emerging trends.
Login to download this file

Item ID
SB00493
Related Templates

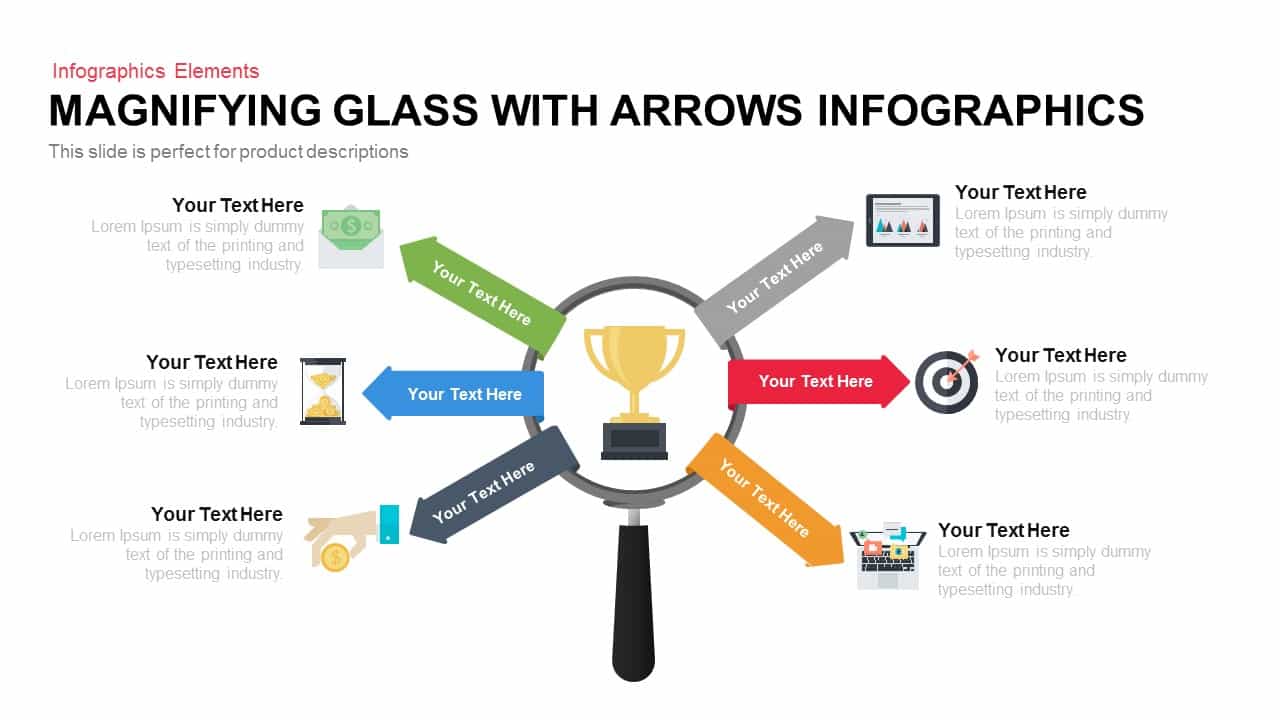
Magnifying Glass Arrows Infographic Template for PowerPoint & Google Slides
Arrow
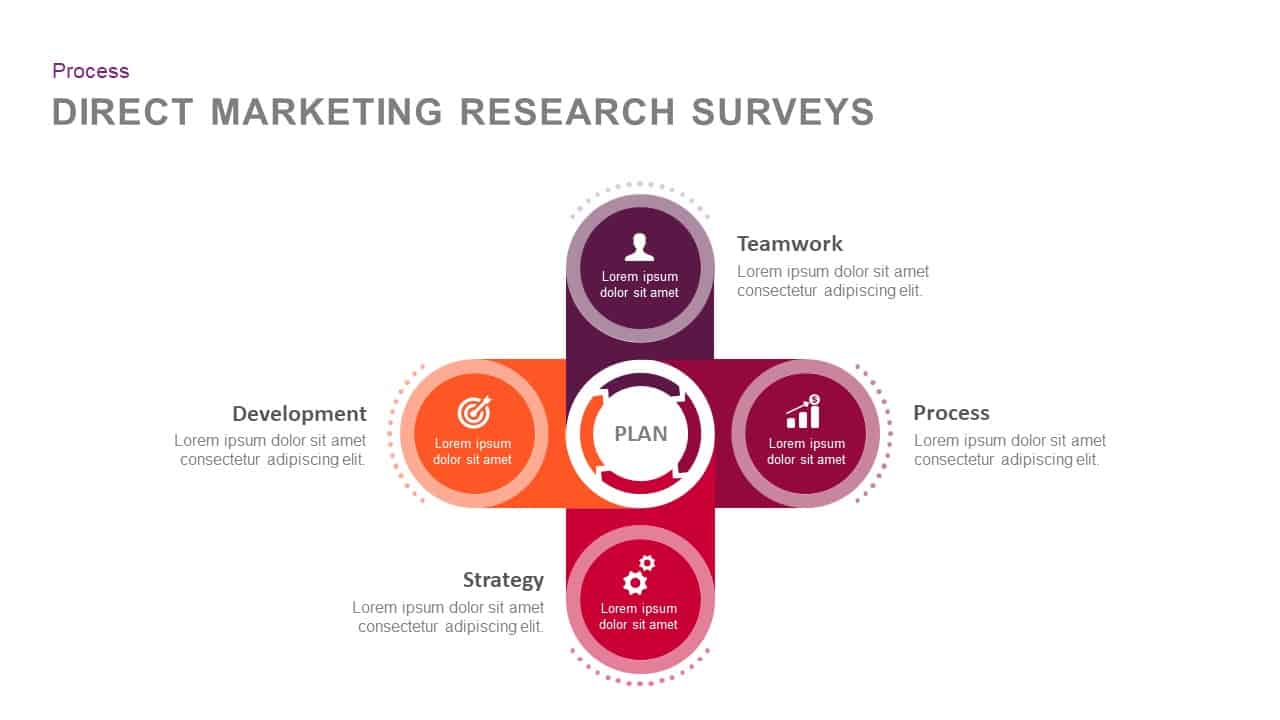
Direct Marketing Research Surveys template for PowerPoint & Google Slides
Marketing

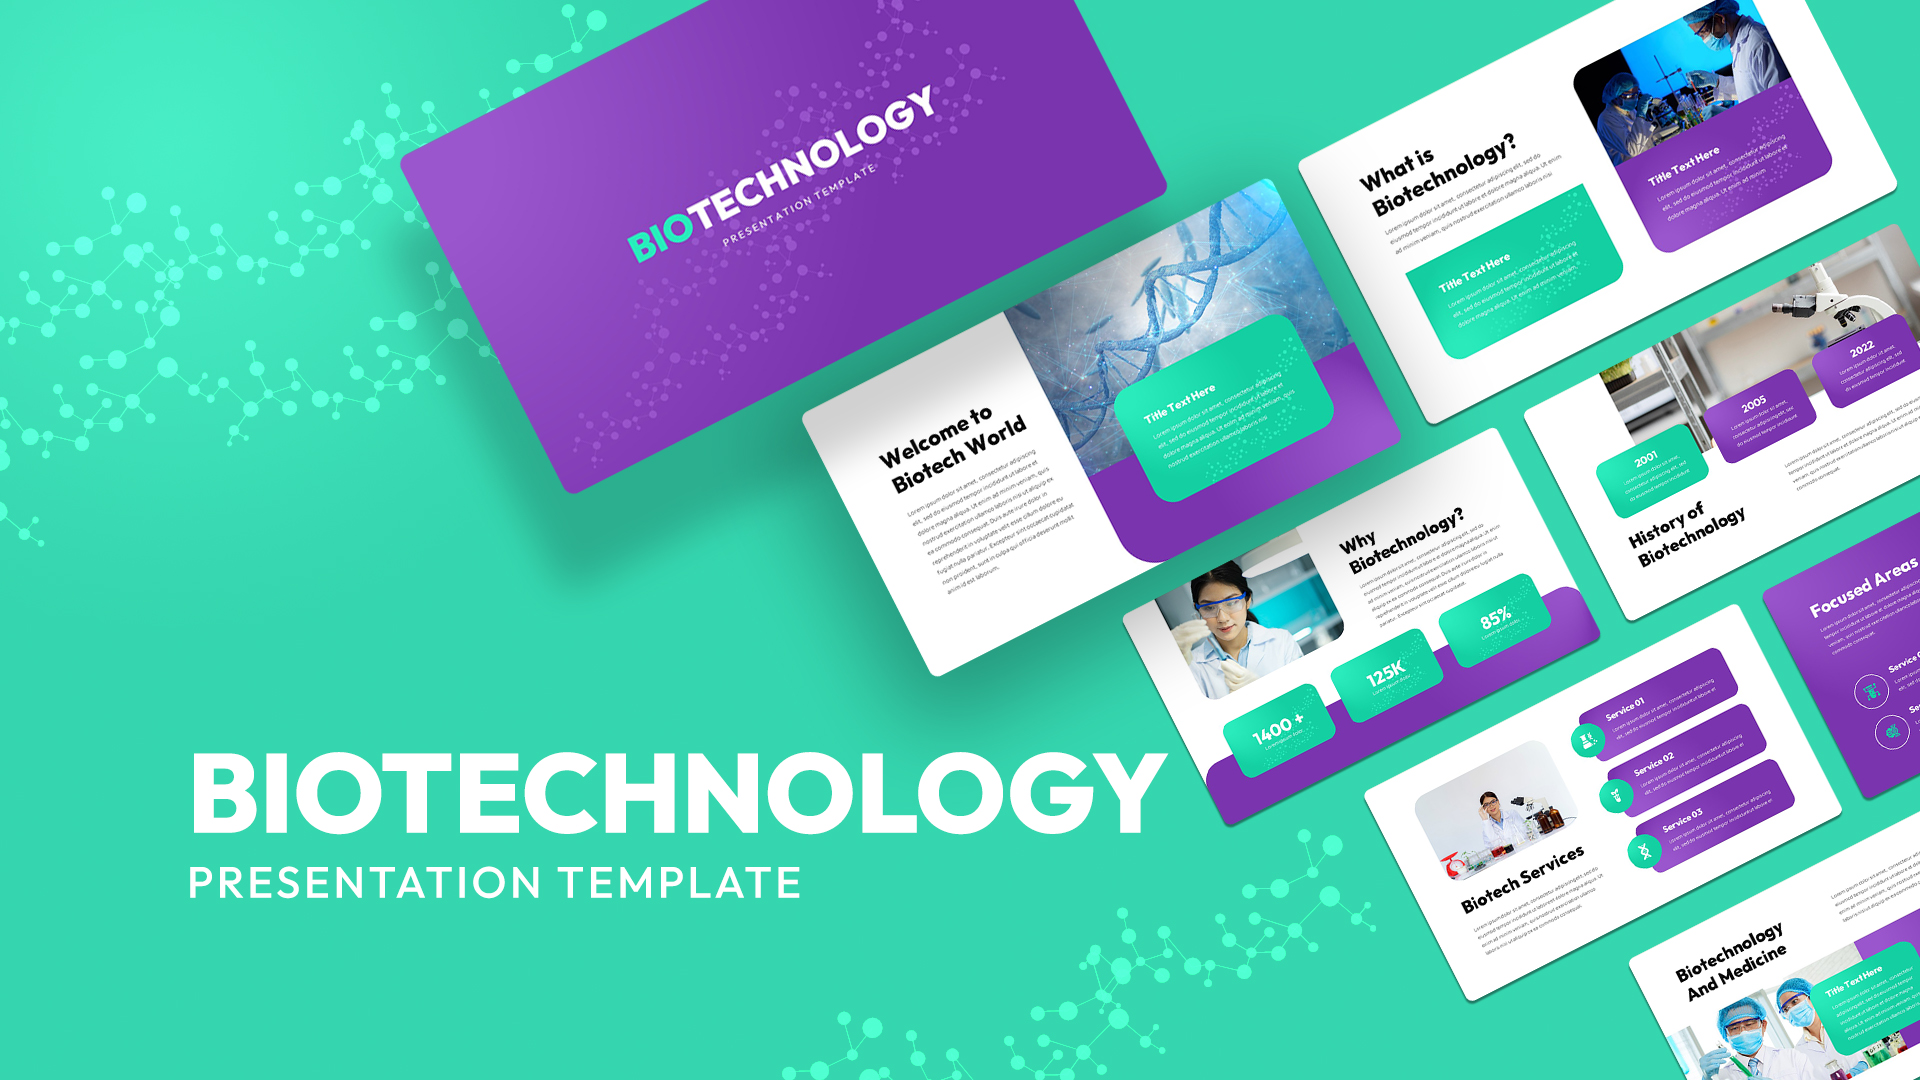
Modern Biotechnology Services & Research Template for PowerPoint & Google Slides
Health
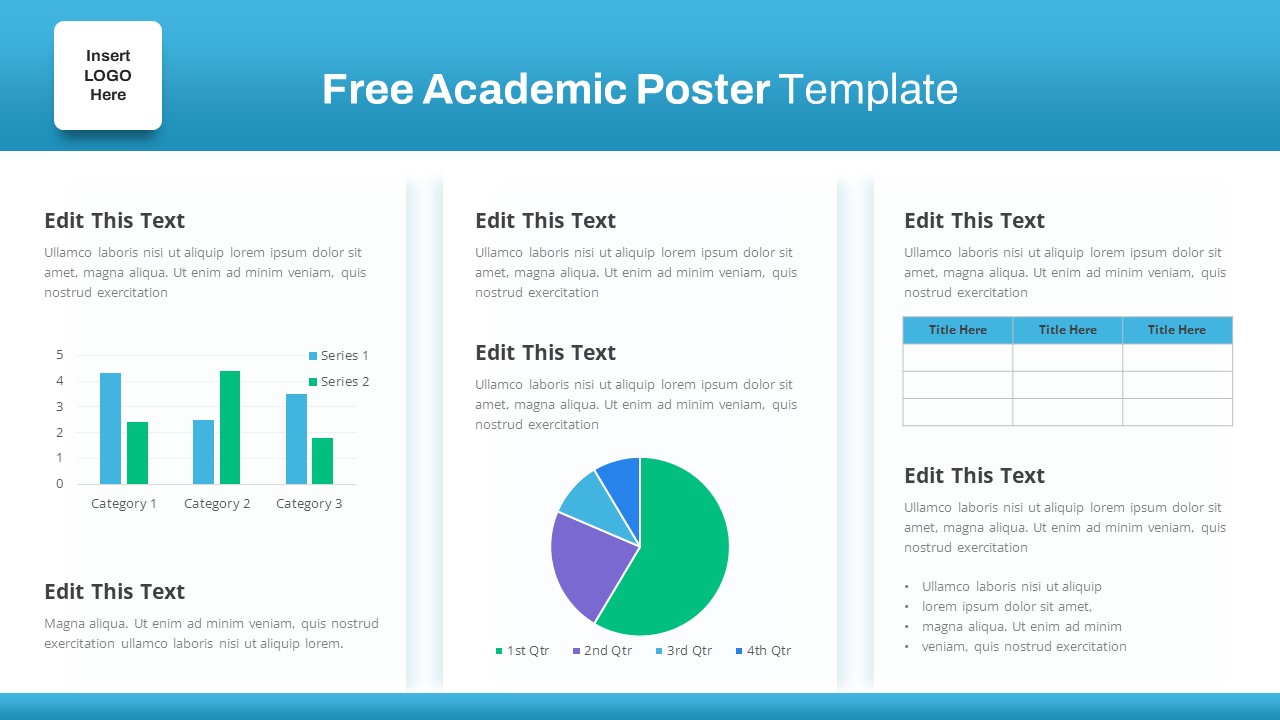
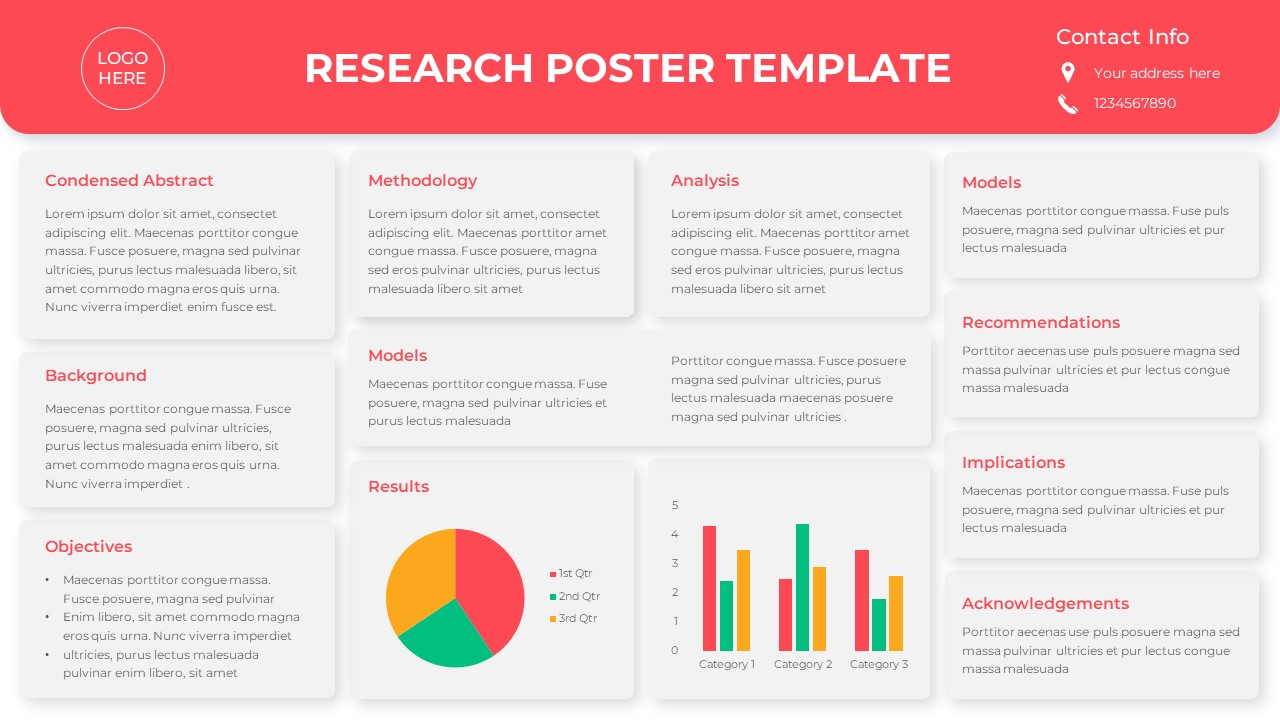
Free Academic Research Poster Design Template for PowerPoint & Google Slides
Bar/Column
Free
Free Research Poster with Charts Template for PowerPoint & Google Slides
Pie/Donut
Free
Multi-Phase Research Roadmap Infographic Template for PowerPoint & Google Slides
Roadmap
Free Research Presentation Slide Deck Template for PowerPoint & Google Slides
Decks
Free
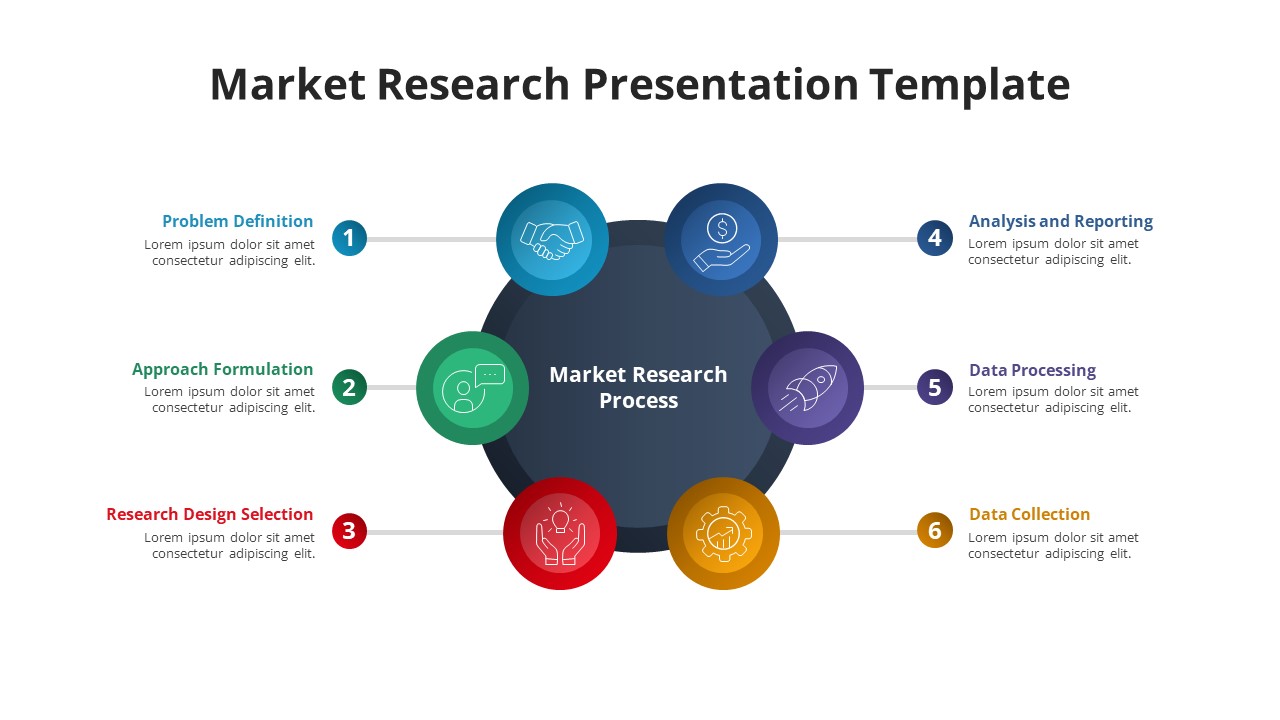
Free Six-Phase Market Research Process Template for PowerPoint & Google Slides
Process
Free
Free Thesis Research Presentation Template for PowerPoint & Google Slides
Decks
Free
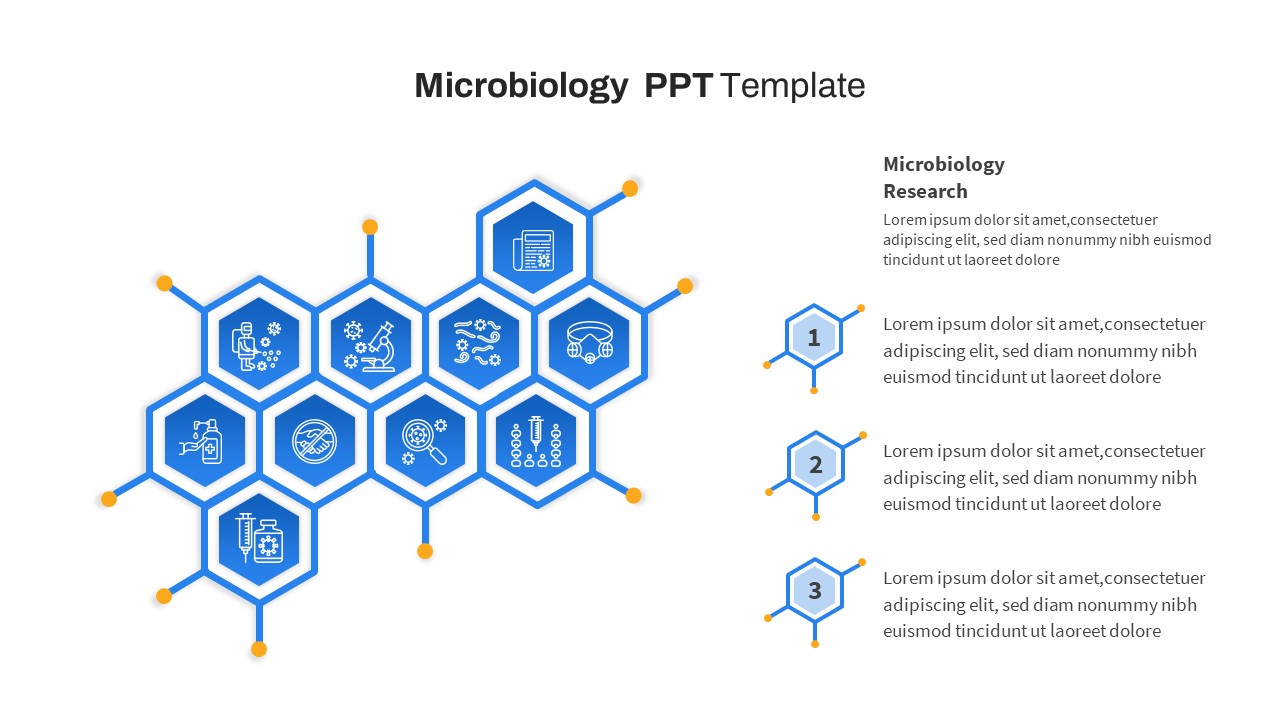
Free Hexagonal Microbiology Research Process Template for PowerPoint & Google Slides
Process
Free
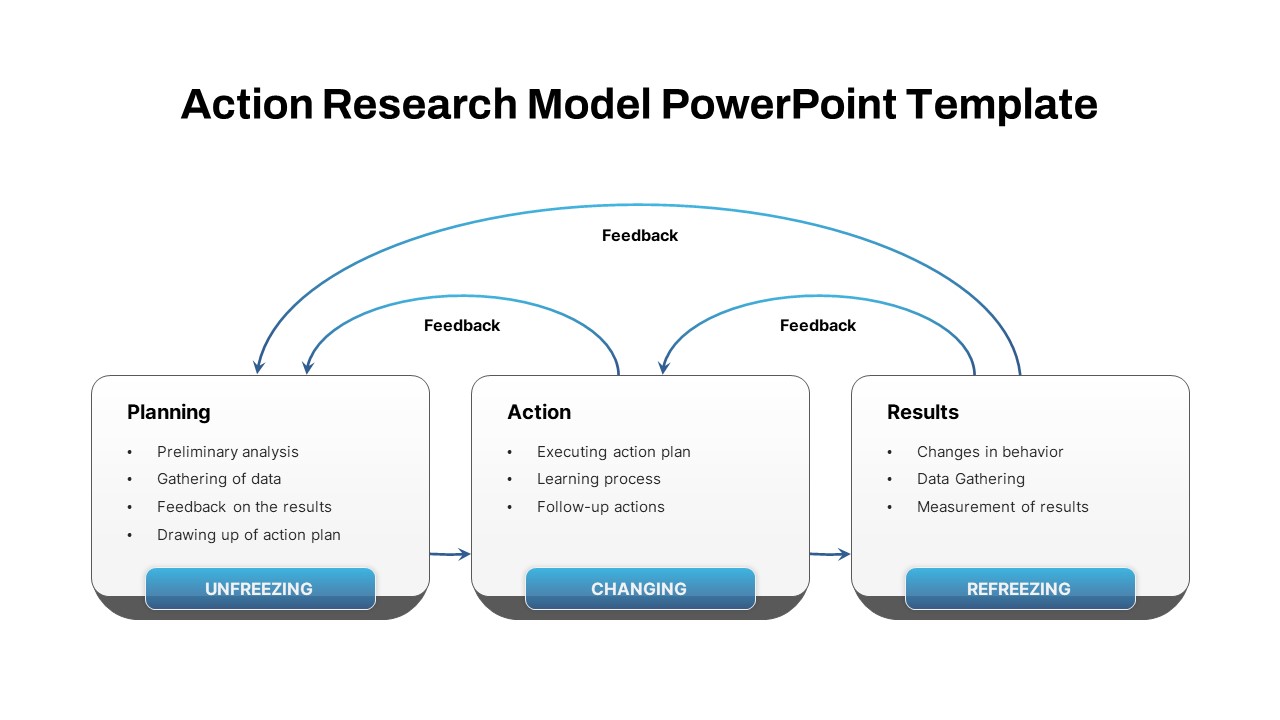
Action Research Feedback Process Model Template for PowerPoint & Google Slides
Process
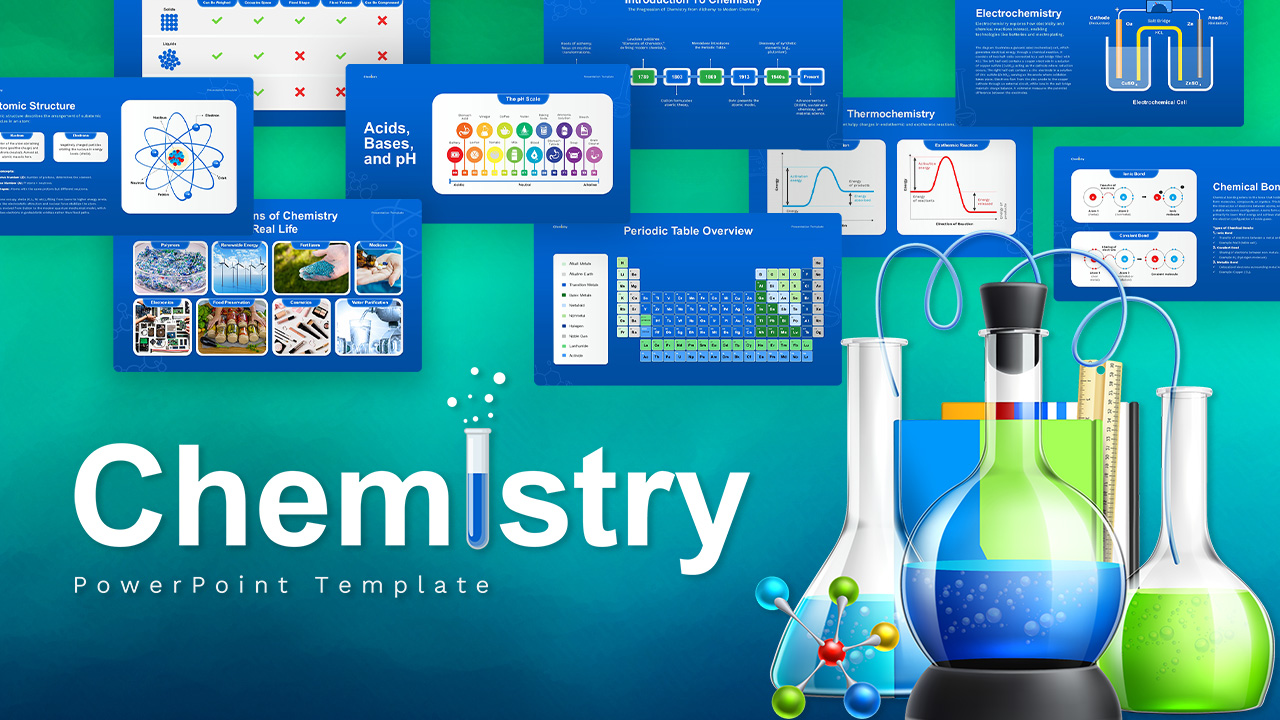
Chemistry Education & Research Template for PowerPoint & Google Slides
Pitch Deck
Academic Research Paper Presentation Template for PowerPoint & Google Slides
Pitch Deck
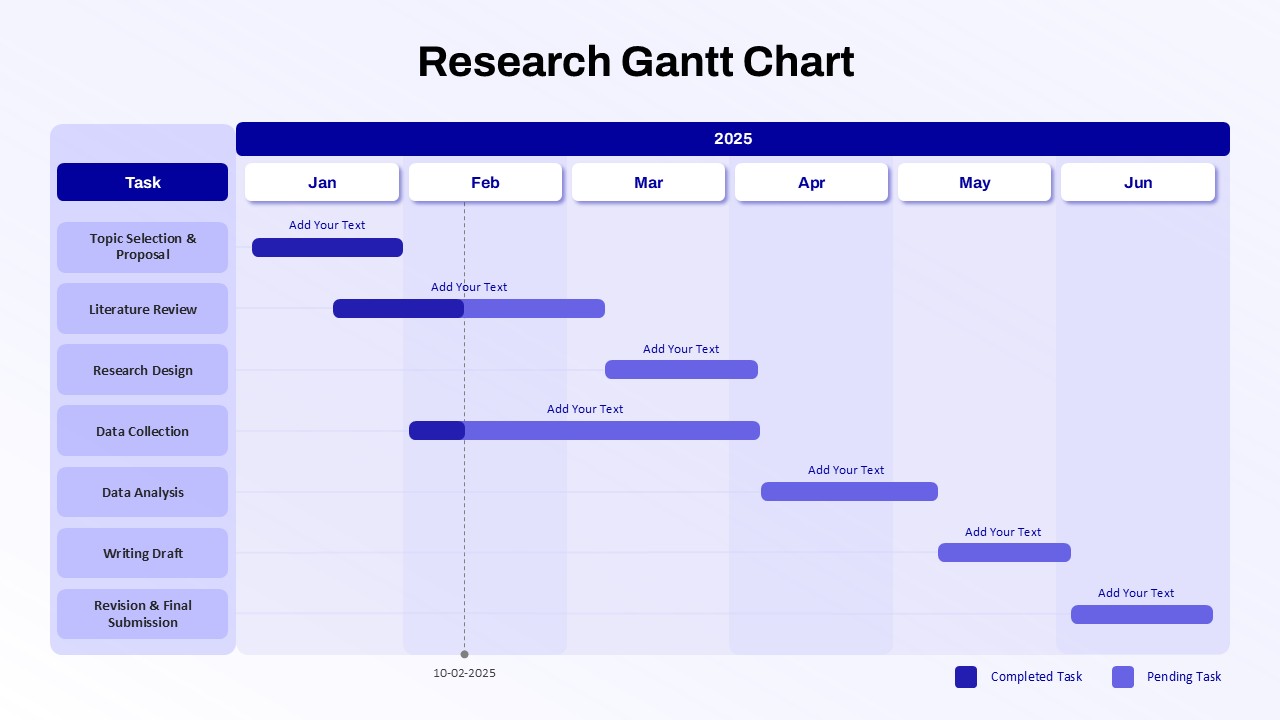
Research Gantt Chart template for PowerPoint & Google Slides
Project
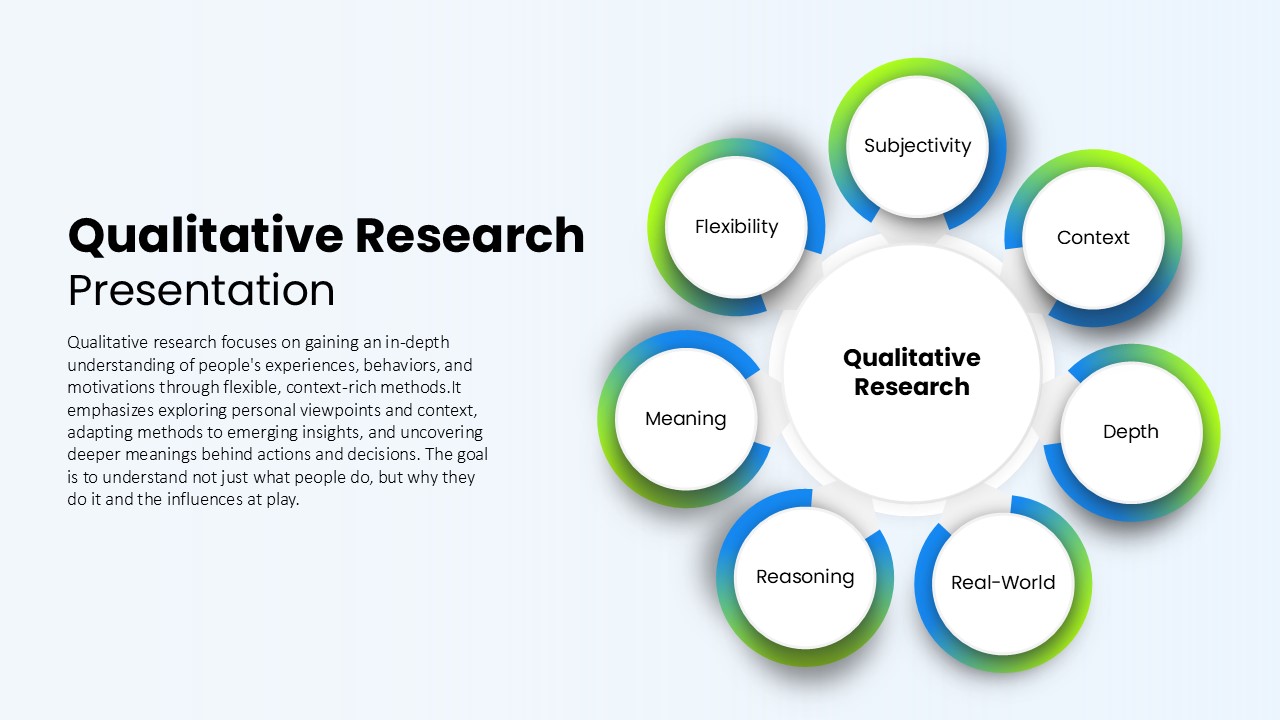
Qualitative Research Hub and Spoke Template for PowerPoint & Google Slides
Circular
Medical Research Concept infographic for PowerPoint & Google Slides
Medical
Research Project Proposal Deck for PowerPoint & Google Slides
Pitch Deck
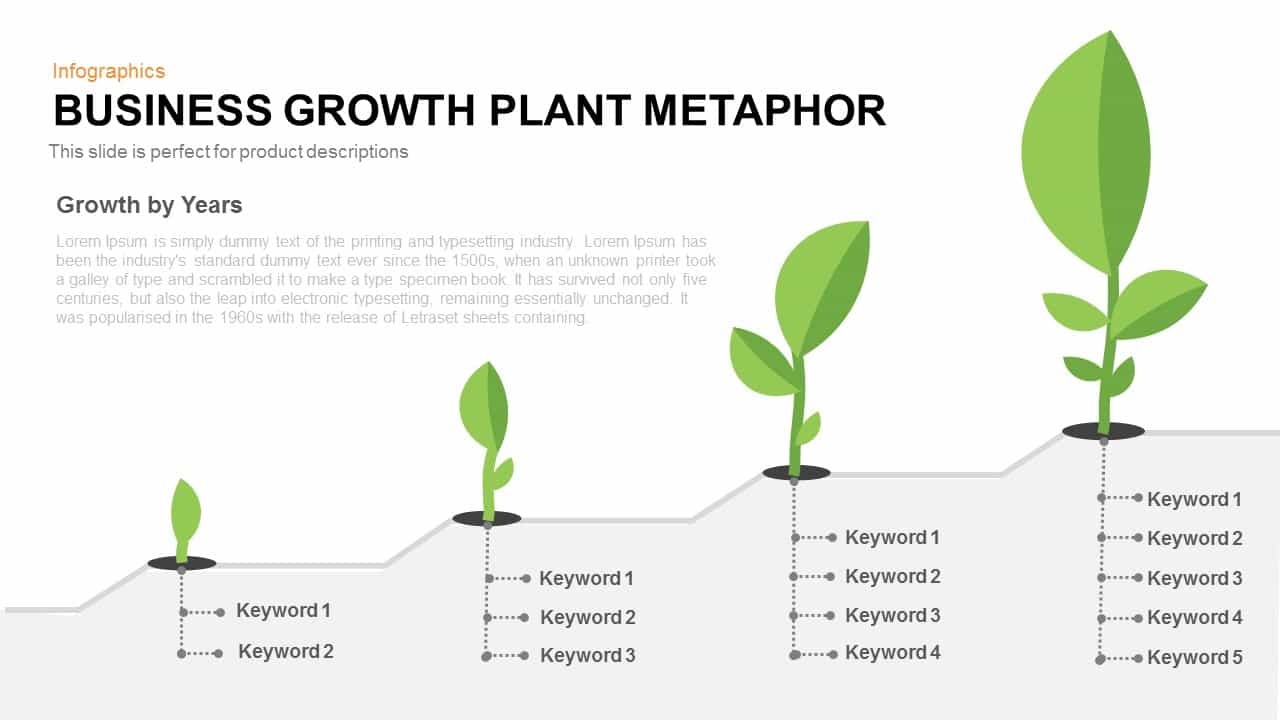
Business Growth Plant Metaphor Timeline Template for PowerPoint & Google Slides
Business Strategy

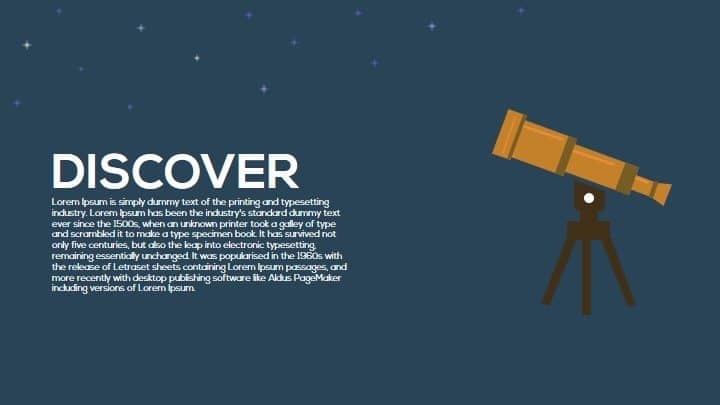
Discover Metaphor Concept Slide Template for PowerPoint & Google Slides
Infographics

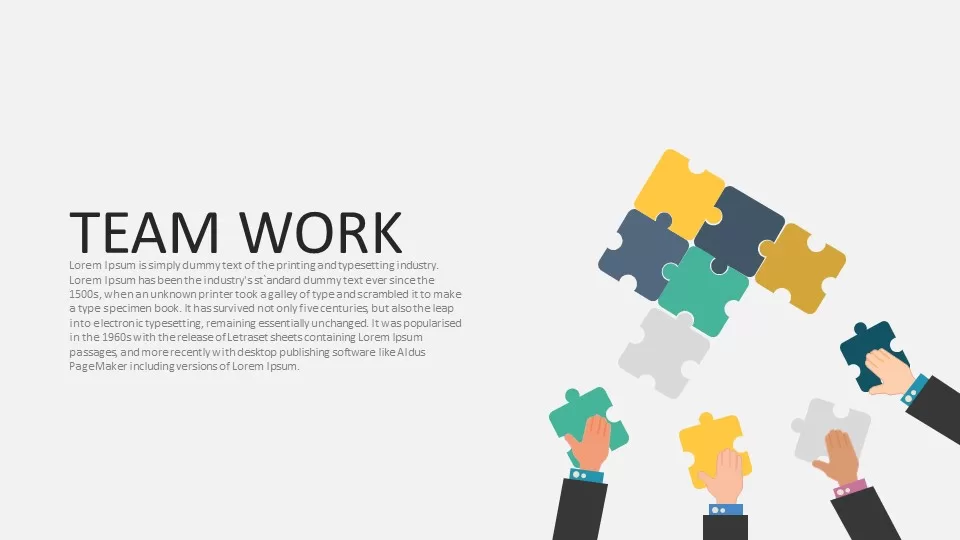
Teamwork Puzzle Metaphor Slide Template for PowerPoint & Google Slides
Our Team
Read Metaphor Concept Illustration Slide Template for PowerPoint & Google Slides
Infographics
Metaphor Light Bulb Idea Concept Template for PowerPoint & Google Slides
Infographics
Leadership Metaphor Presentation Slide Template for PowerPoint & Google Slides
Leadership
Megaphone Communication Metaphor Template for PowerPoint & Google Slides
Advertising
Metaphor Multitasking Illustration Template for PowerPoint & Google Slides
Business
Metaphor Knowledge Illustration Slide Template for PowerPoint & Google Slides
Infographics
Strength Metaphor Dumbbell Diagram Template for PowerPoint & Google Slides
Accomplishment
Rebuild Brick Wall Metaphor Slide Template for PowerPoint & Google Slides
Infographics
Efficiency KPI Dashboard Metaphor Template for PowerPoint & Google Slides
Infographics
Destination Roadmap Pin Metaphor Template for PowerPoint & Google Slides
Roadmap
Metaphor Speed Template for PowerPoint & Google Slides
Process
Scale Metaphor Metrics Comparison Template for PowerPoint & Google Slides
Charts
Key Metaphor Infographic Slide Template for PowerPoint & Google Slides
Process
Mustard and Navy Balance Scale Metaphor Template for PowerPoint & Google Slides
Comparison
Shield Metaphor Security and Protection Template for PowerPoint & Google Slides
Risk Management
Business Opportunity Metaphor Slide Template for PowerPoint & Google Slides
Opportunities Challenges
Productivity Metaphor Clock Icon Template for PowerPoint & Google Slides
Graphics
Explore Binoculars Metaphor Slide Template for PowerPoint & Google Slides
Process
Guide Metaphor Navigation Infographic Template for PowerPoint & Google Slides
Process
Office Workspace Metaphor Slide Template for PowerPoint & Google Slides
Business Proposal
Operation Process Metaphor Diagram Template for PowerPoint & Google Slides
Process
Professional Security Metaphor Diagram Template for PowerPoint & Google Slides
Information Technology
Navigation Compass Metaphor Slide Template for PowerPoint & Google Slides
Vision and Mission
Deadline Metaphor Timeline & Hourglass Template for PowerPoint & Google Slides
Project
Planning Metaphor Flowchart Slide Template for PowerPoint & Google Slides
Process
Product Shipping Metaphor Diagram Template for PowerPoint & Google Slides
Process
Competition Metaphor Podium Diagram Template for PowerPoint & Google Slides
Business
News Metaphor Media Communication Slide Template for PowerPoint & Google Slides
Business Report
Improvement Growth Arrow Metaphor Template for PowerPoint & Google Slides
Bar/Column
Process Improvement Metaphor Diagram Template for PowerPoint & Google Slides
Process
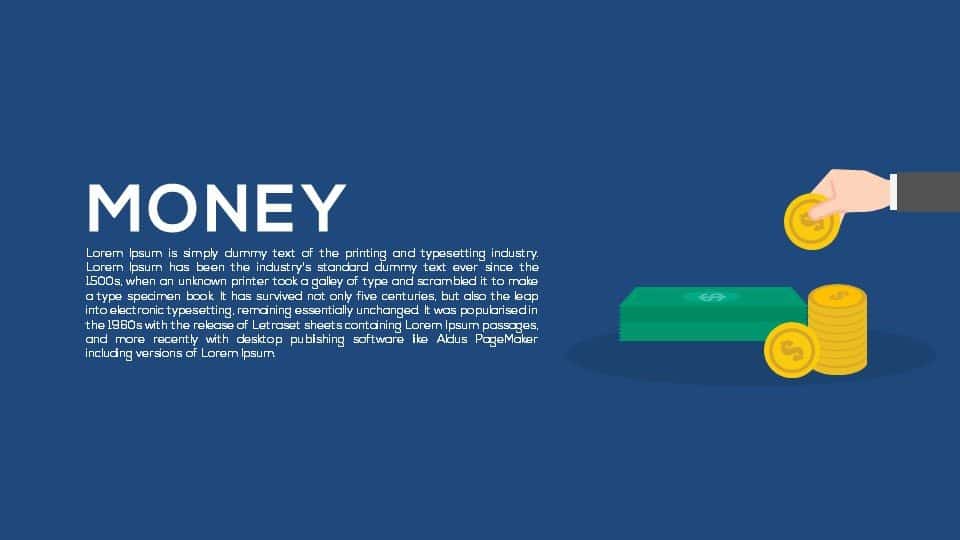
Money Metaphor Financial Overview Template for PowerPoint & Google Slides
Finance
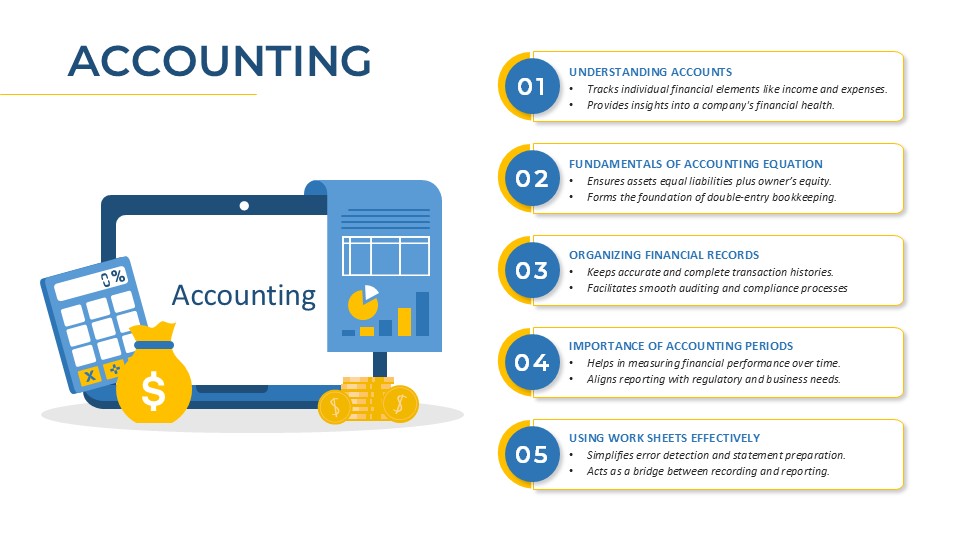
Accounting Process Metaphor Diagram Template for PowerPoint & Google Slides
Accounting
Dual Percentage Comparison Metaphor Template for PowerPoint & Google Slides
Comparison

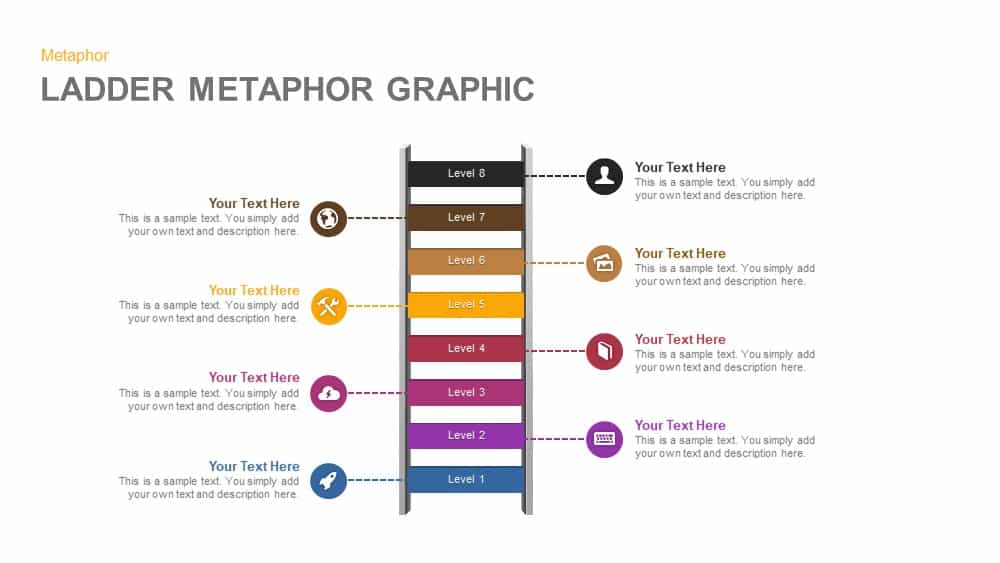
Eight-Level Ladder Metaphor Graphic Template for PowerPoint & Google Slides
Process
Business Decision-Making Metaphor Template for PowerPoint & Google Slides
Leadership
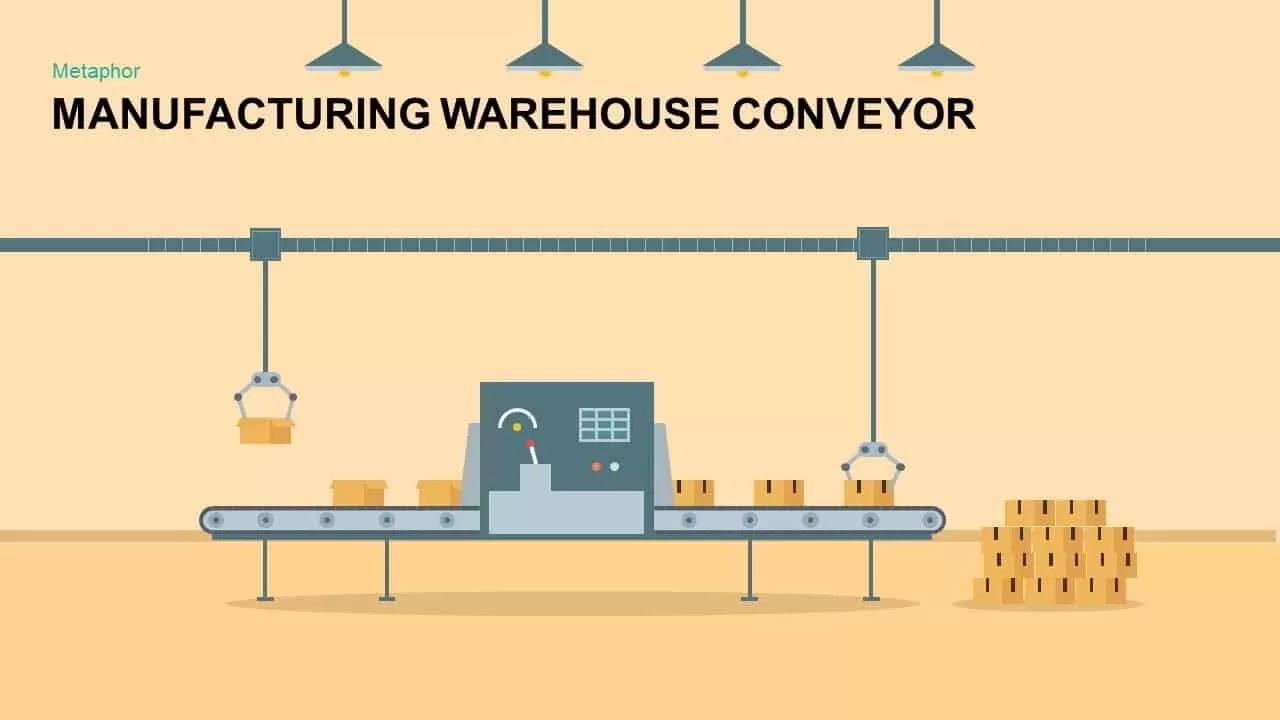
Warehouse Conveyor Process Metaphor Template for PowerPoint & Google Slides
Process
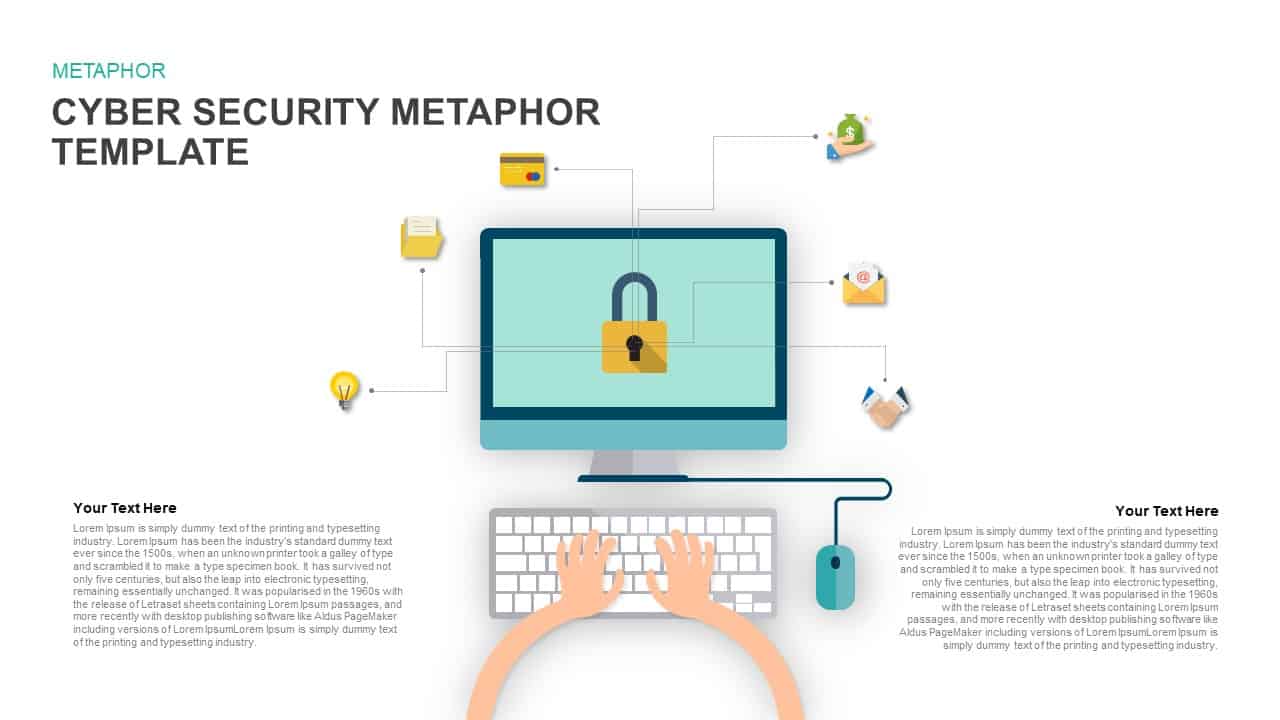
Cyber Security Metaphor Diagram Template for PowerPoint & Google Slides
Risk Management
Developer Icons Metaphor Slide Template for PowerPoint & Google Slides
Software Development
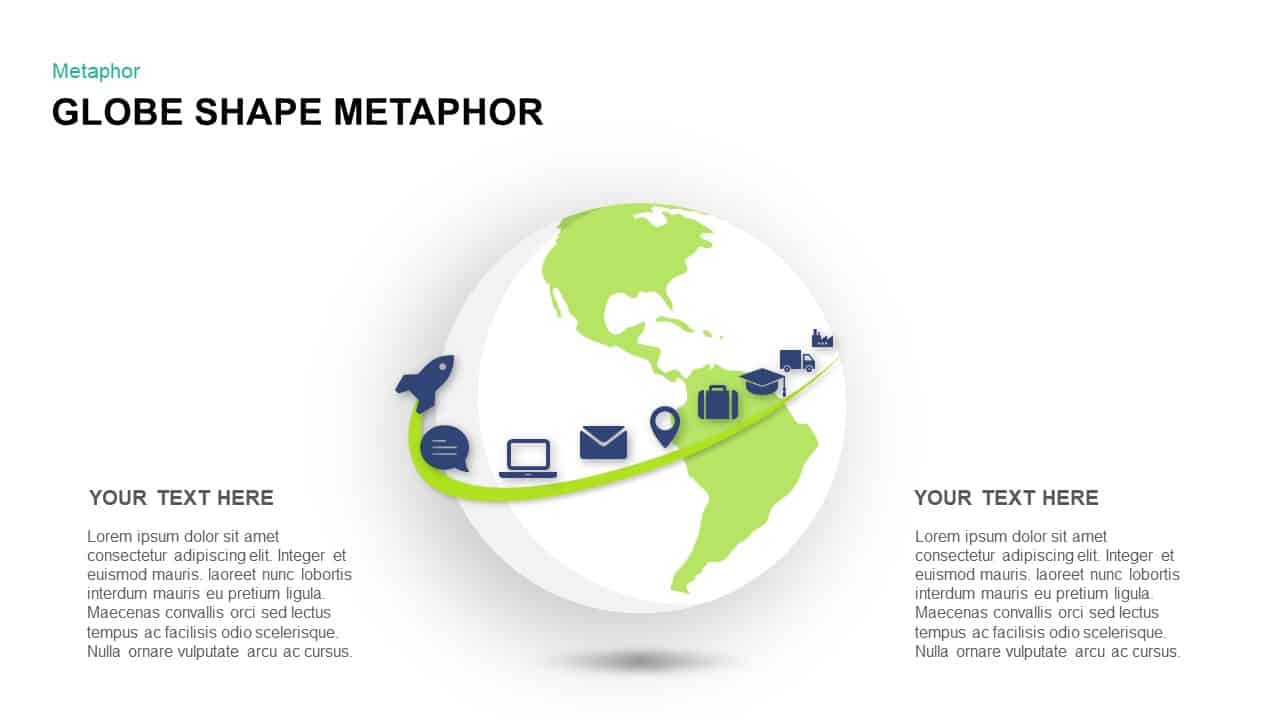
Global Business Pathway Metaphor Template for PowerPoint & Google Slides
Opportunities Challenges

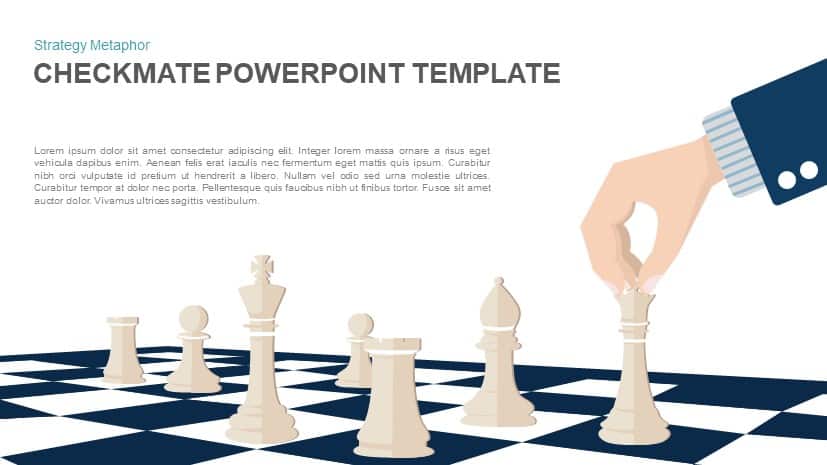
Checkmate Strategy Chess Metaphor Template for PowerPoint & Google Slides
Opportunities Challenges
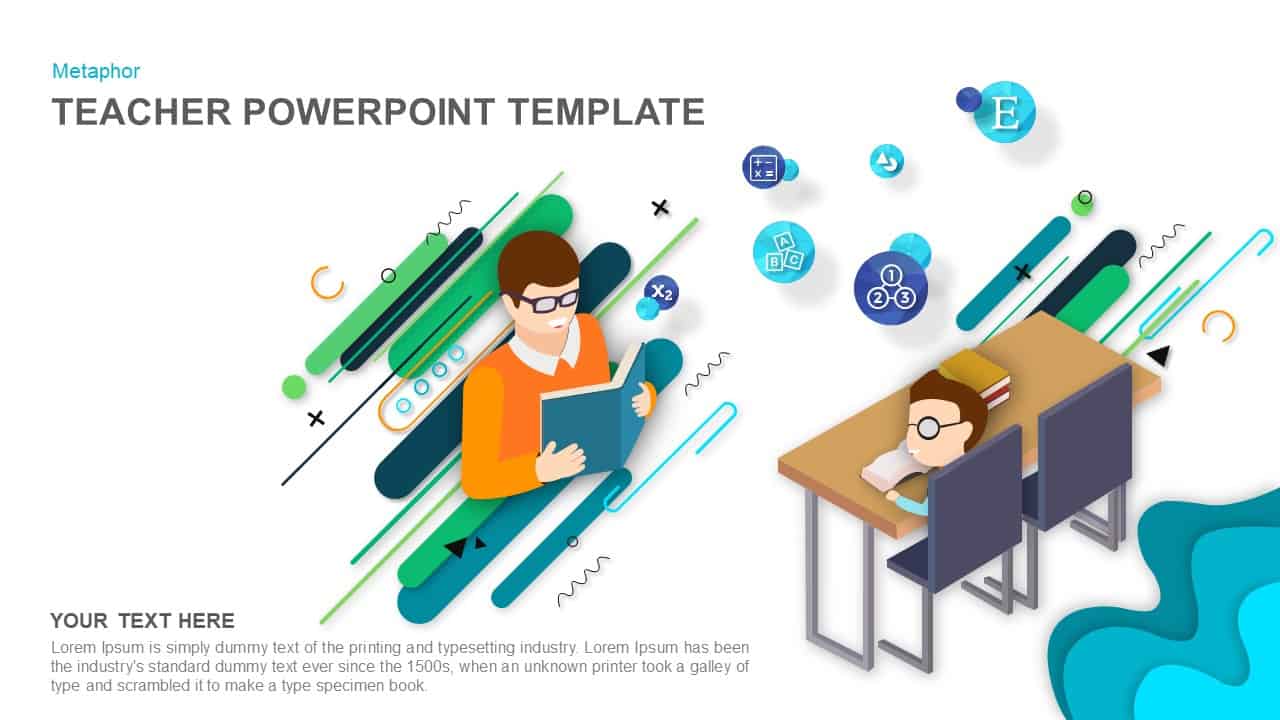
Teacher Illustration Metaphor Slide Template for PowerPoint & Google Slides
Process
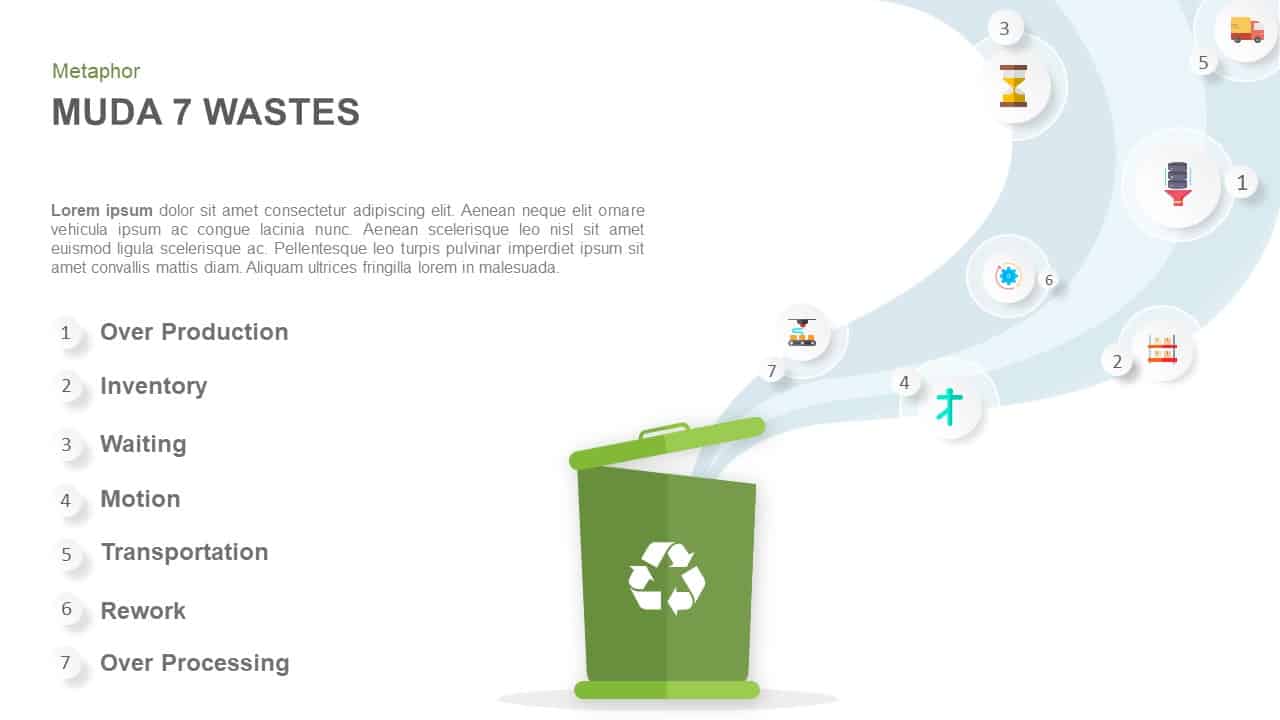
Muda 7 Wastes Recycling Bin Metaphor Template for PowerPoint & Google Slides
Process

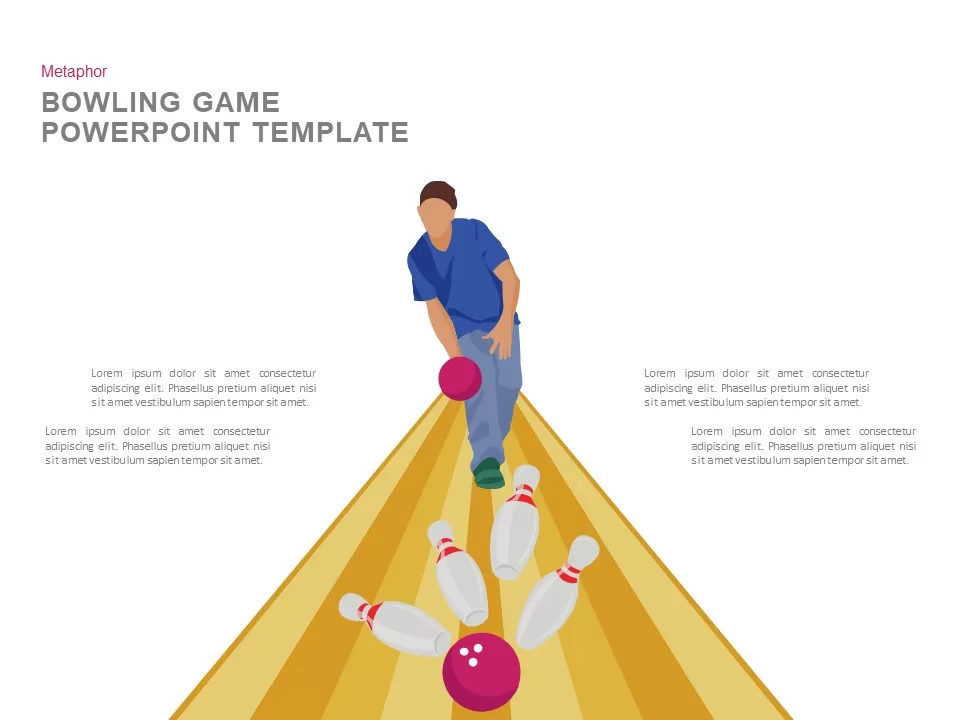
Bowling Game Illustration Metaphor Template for PowerPoint & Google Slides
Process
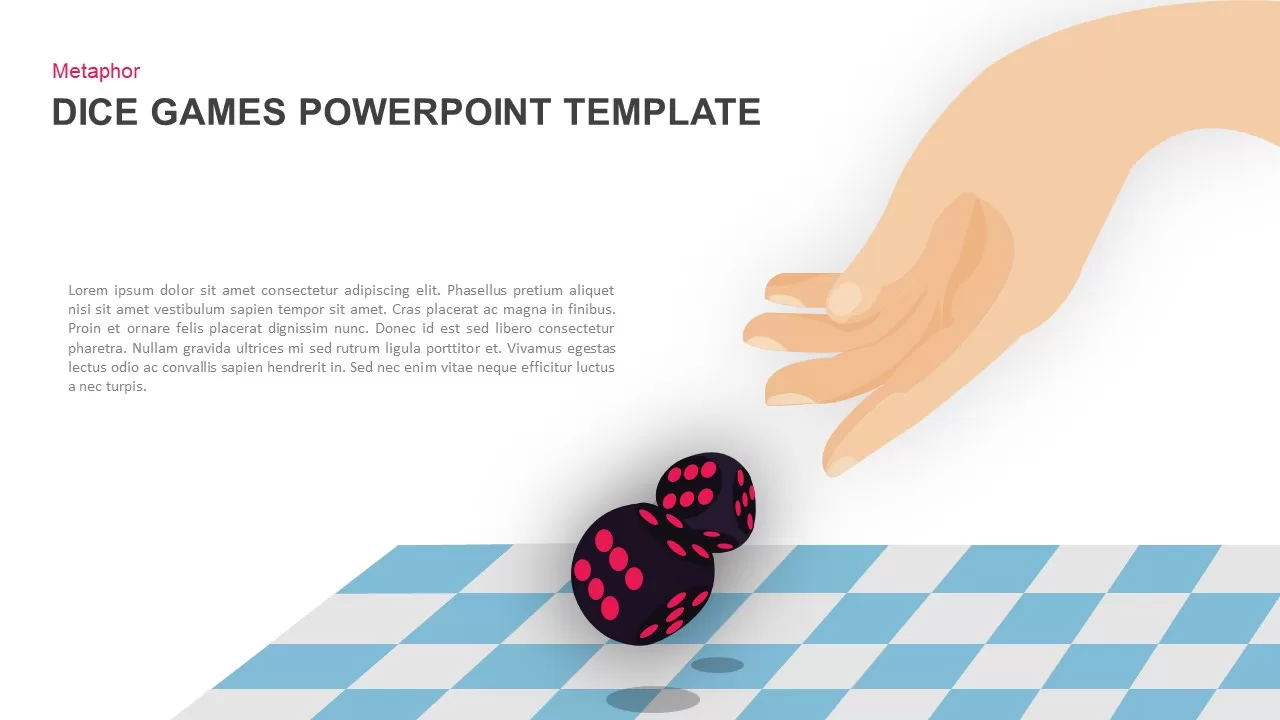
Dice Game Throwing Metaphor Slide Template for PowerPoint & Google Slides
Process
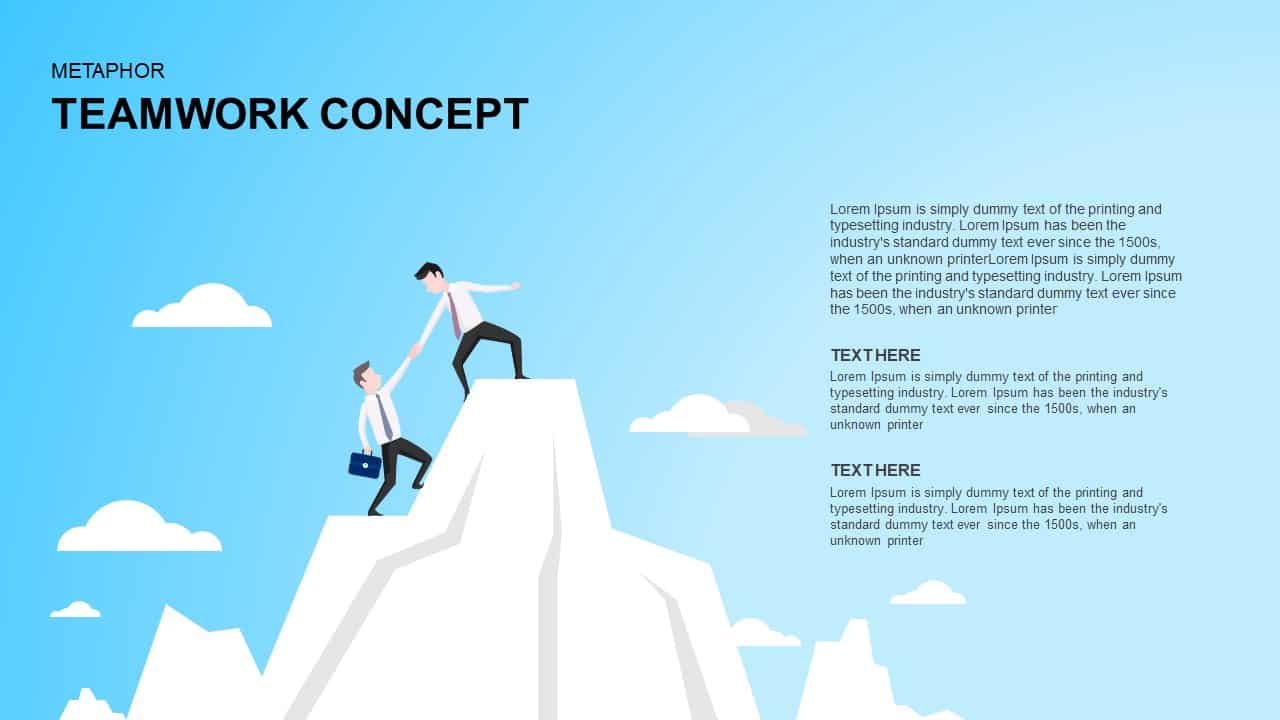
Teamwork Concept Metaphor Template for PowerPoint & Google Slides
Leadership
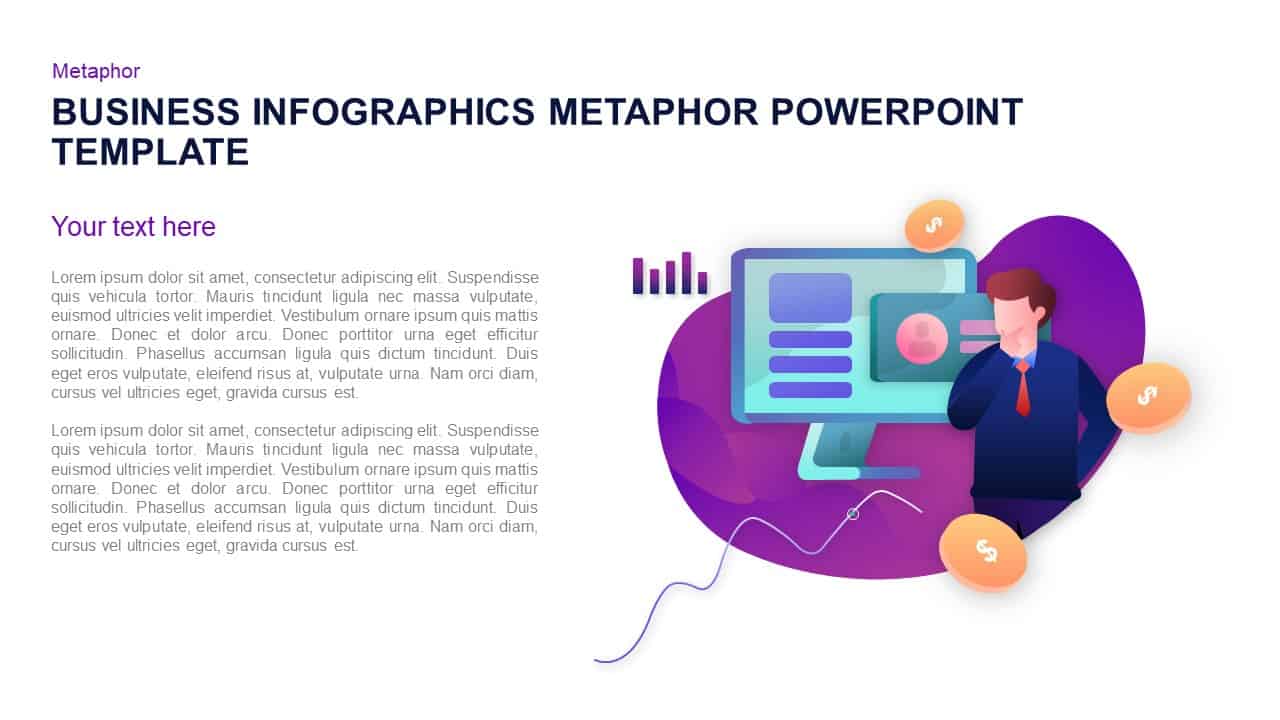
Business Growth Infographic Metaphor Template for PowerPoint & Google Slides
Revenue
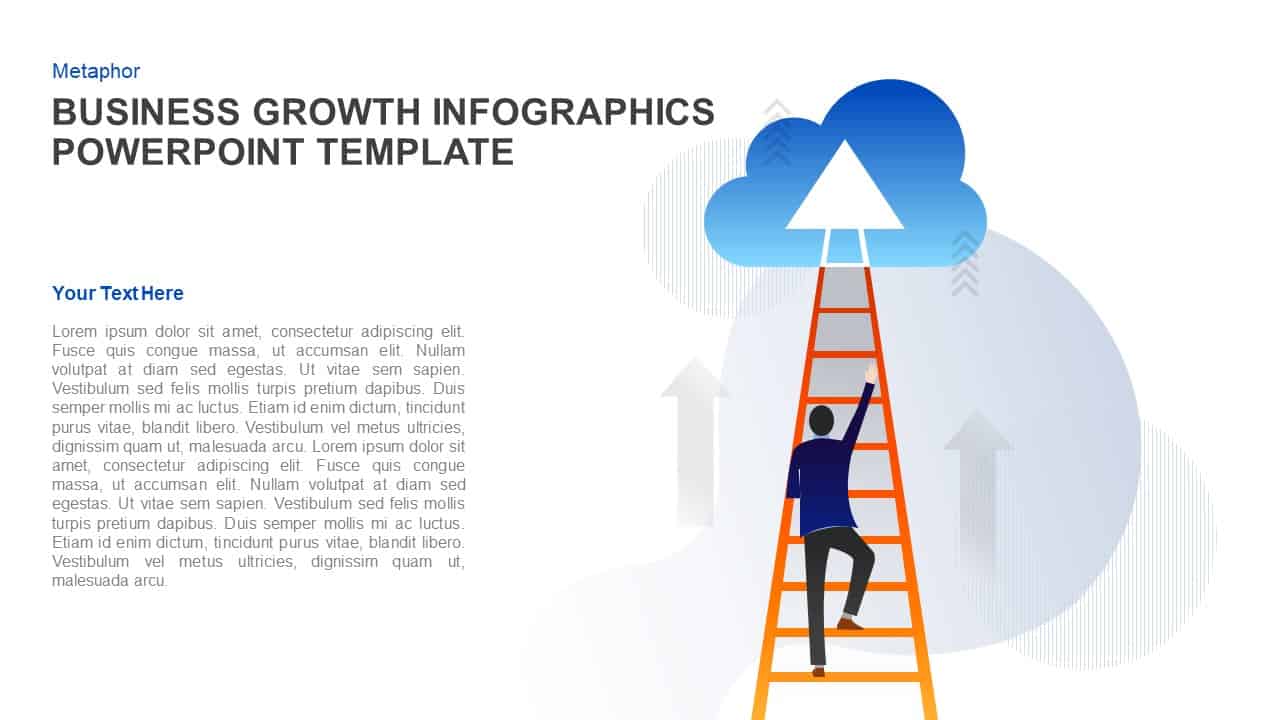
Business Growth Ladder to Cloud Metaphor Template for PowerPoint & Google Slides
Vision and Mission
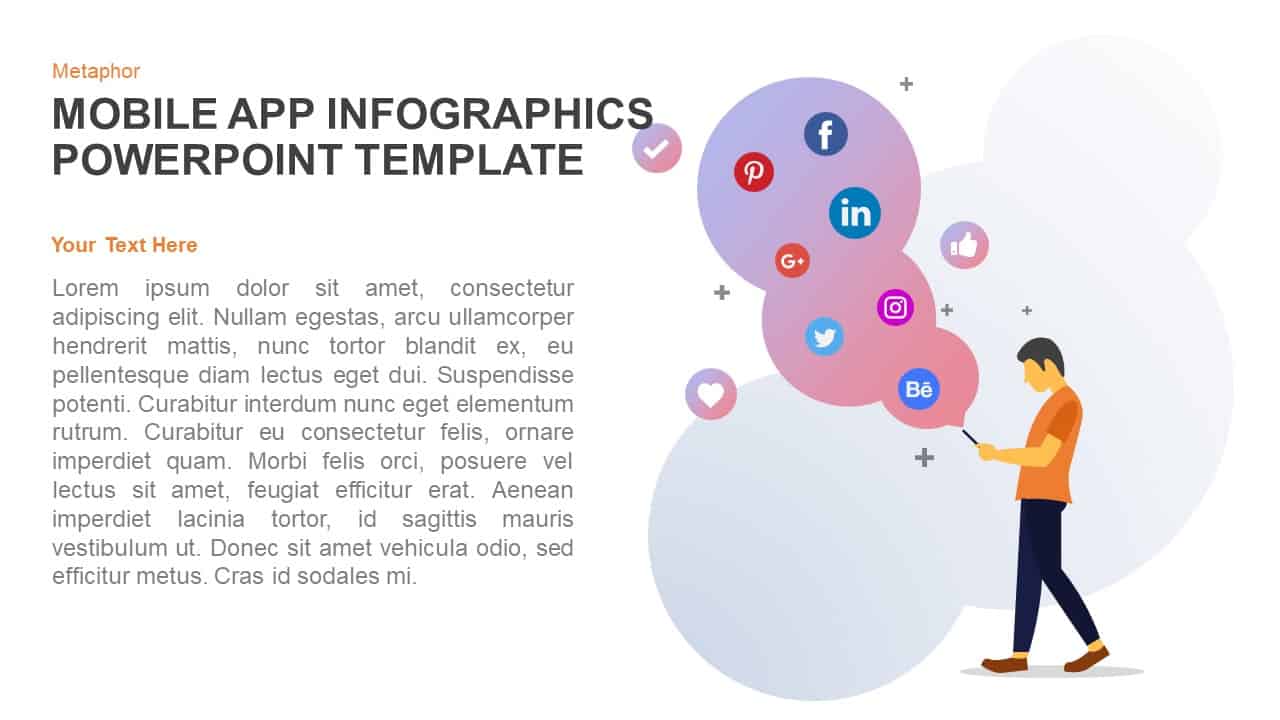
Mobile App Social Media Metaphor Template for PowerPoint & Google Slides
Infographics
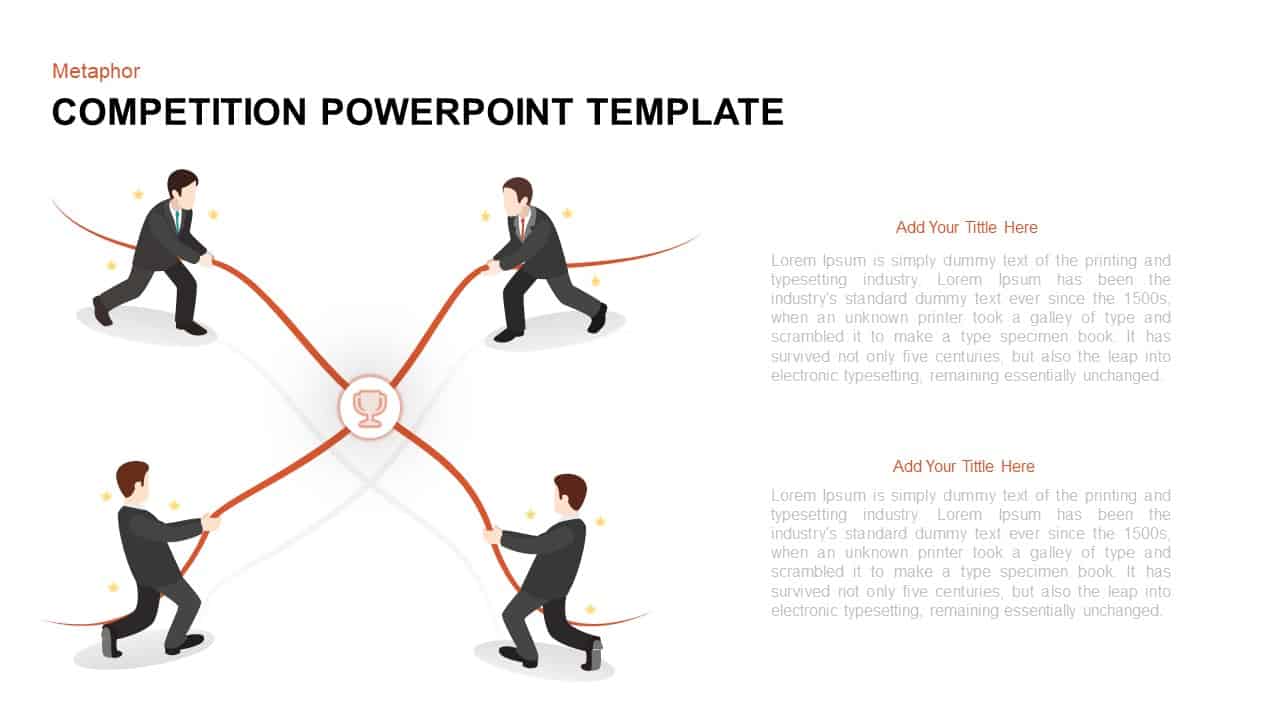
Competitive Tug-of-War Metaphor Template for PowerPoint & Google Slides
Business Strategy
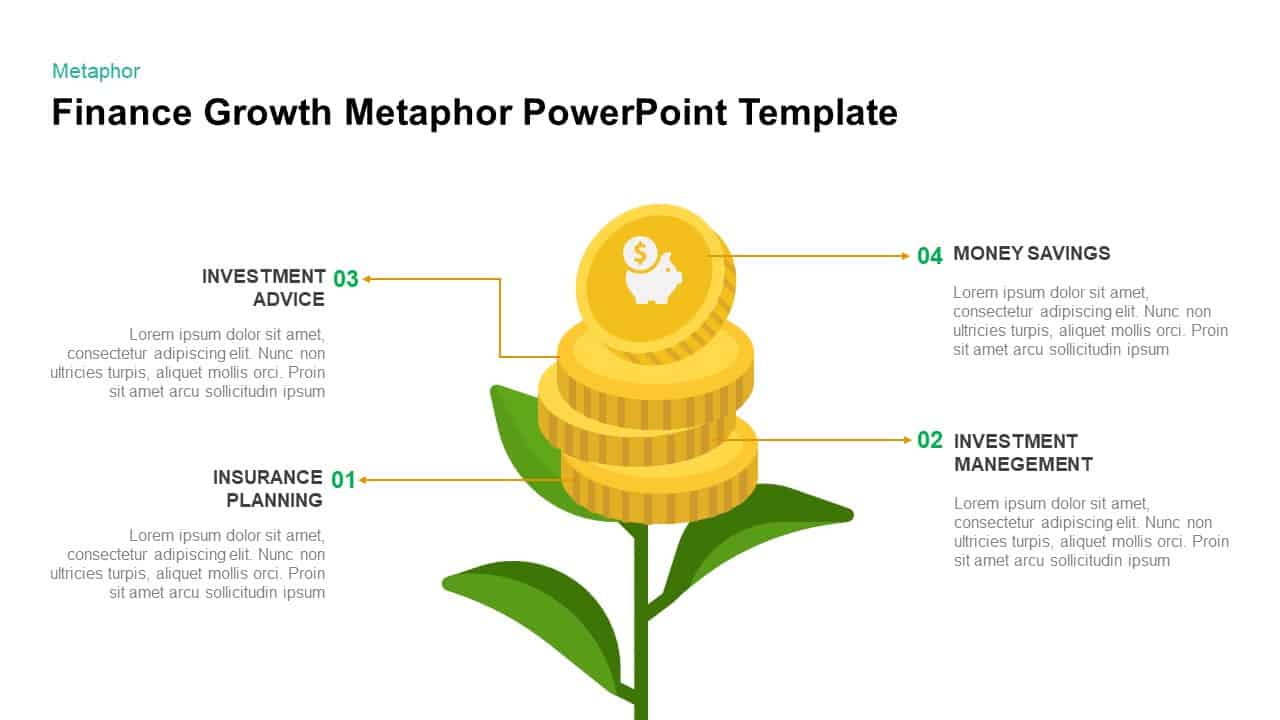
Finance Growth Plant Metaphor Slide Template for PowerPoint & Google Slides
Finance
Collaborative Teamwork Metaphor Illustration Template for PowerPoint & Google Slides
Leadership
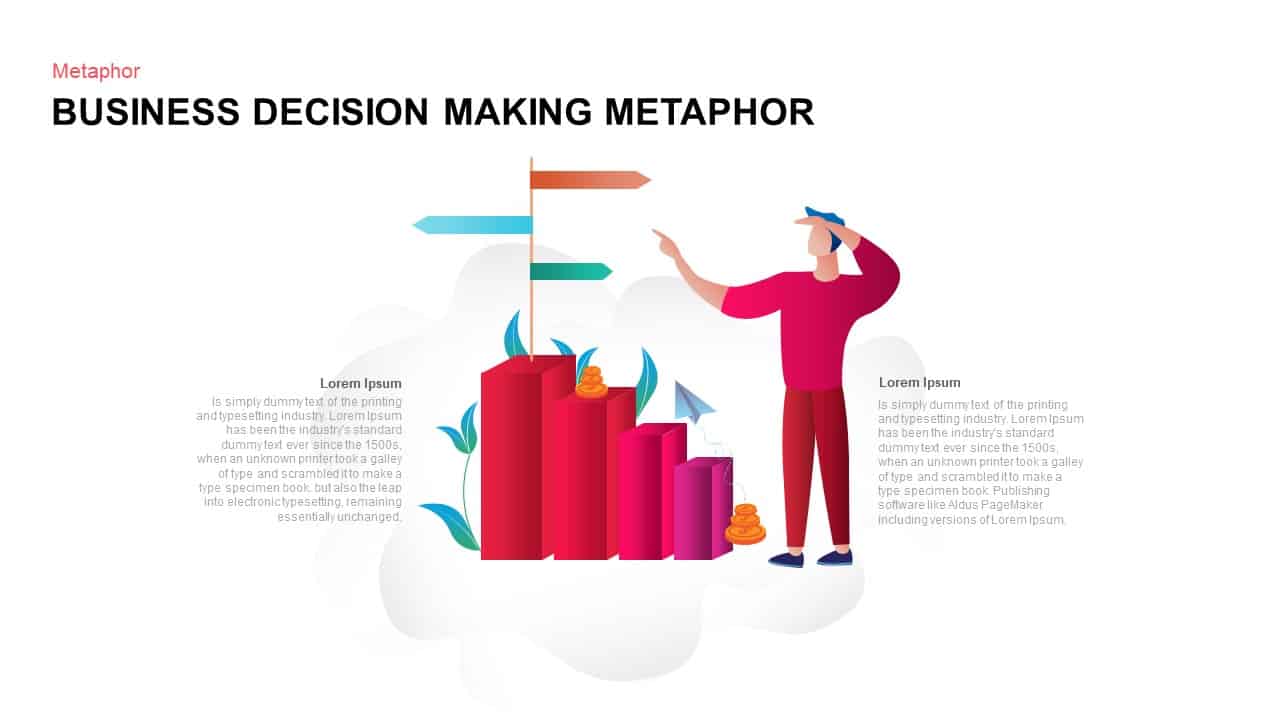
Business Decision Making Metaphor Template for PowerPoint & Google Slides
Arrow
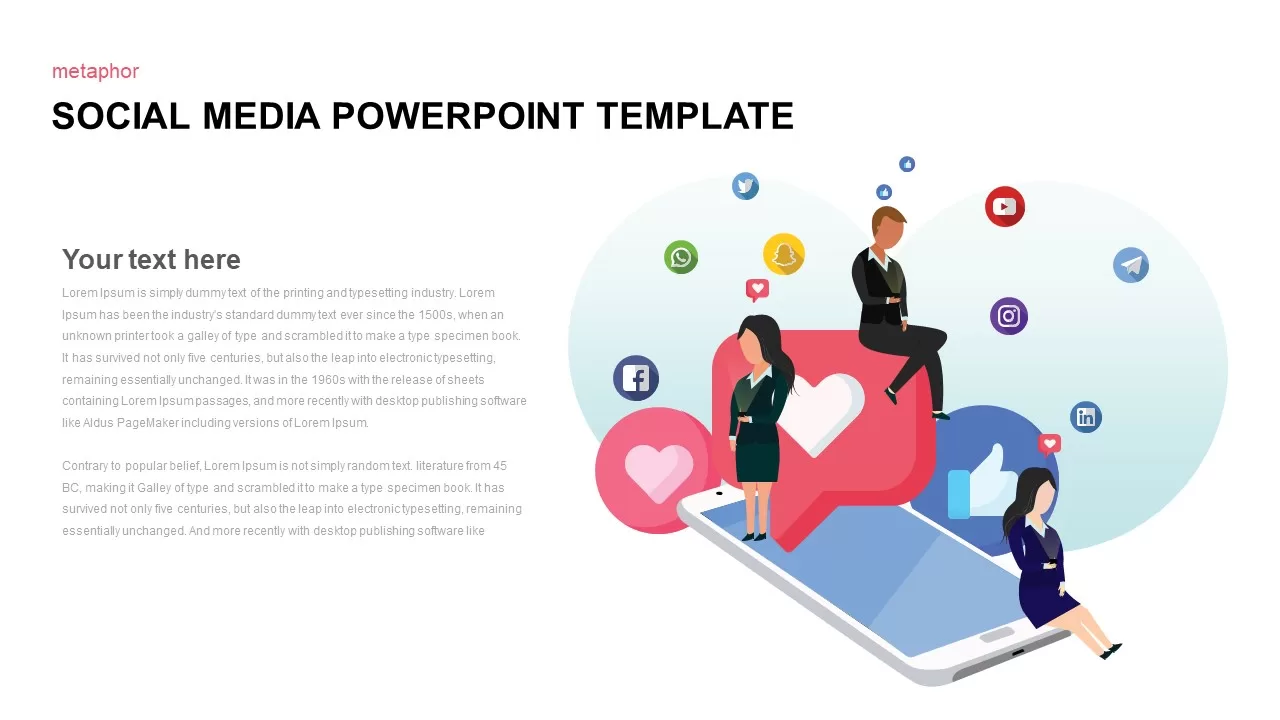
Social Media Metaphor Illustration Template for PowerPoint & Google Slides
Digital Marketing
Lead Generation Funnel Metaphor Template for PowerPoint & Google Slides
Marketing Funnel
SWOT Analysis Metaphor Illustration Template for PowerPoint & Google Slides
SWOT
Vibrant Digital Marketing Metaphor Template for PowerPoint & Google Slides
Advertising
Collaborative Teamwork Metaphor Slide Template for PowerPoint & Google Slides
Our Team
Customer Service Metaphor Infographic Template for PowerPoint & Google Slides
Customer Experience
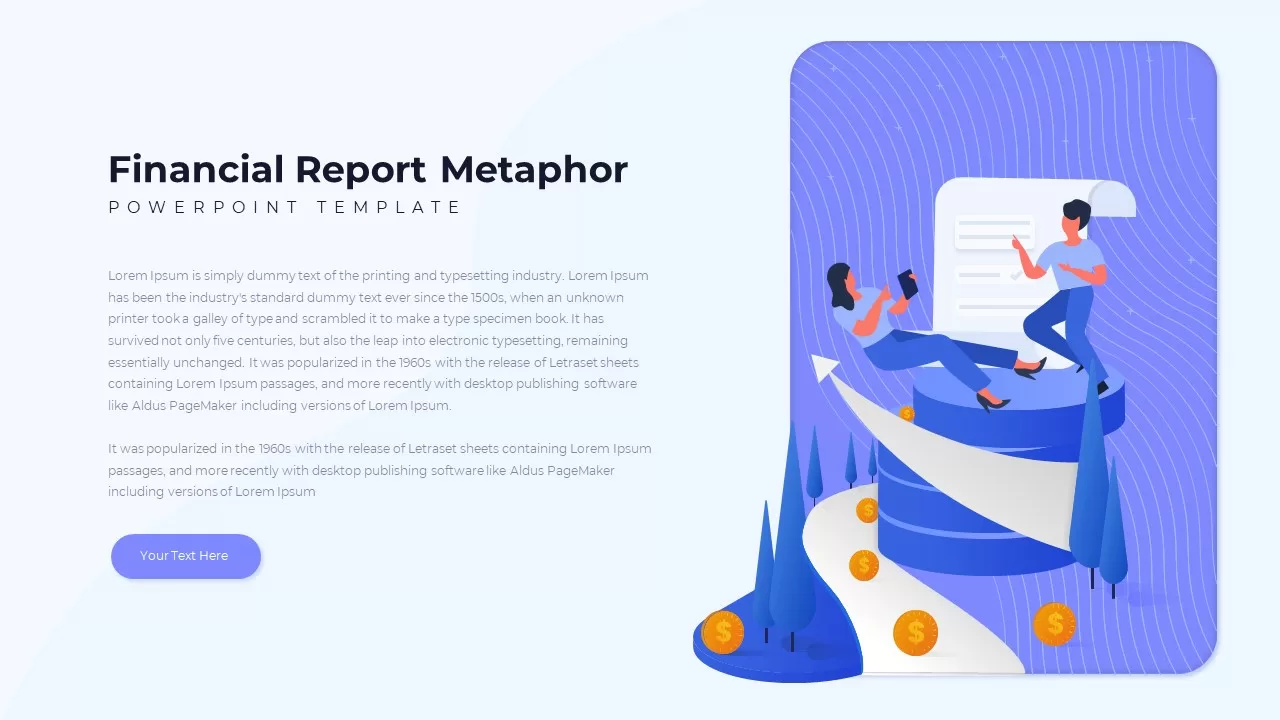
Financial Report Metaphor Illustration Template for PowerPoint & Google Slides
Finance
Business Growth Metaphor Chart Template for PowerPoint & Google Slides
Business
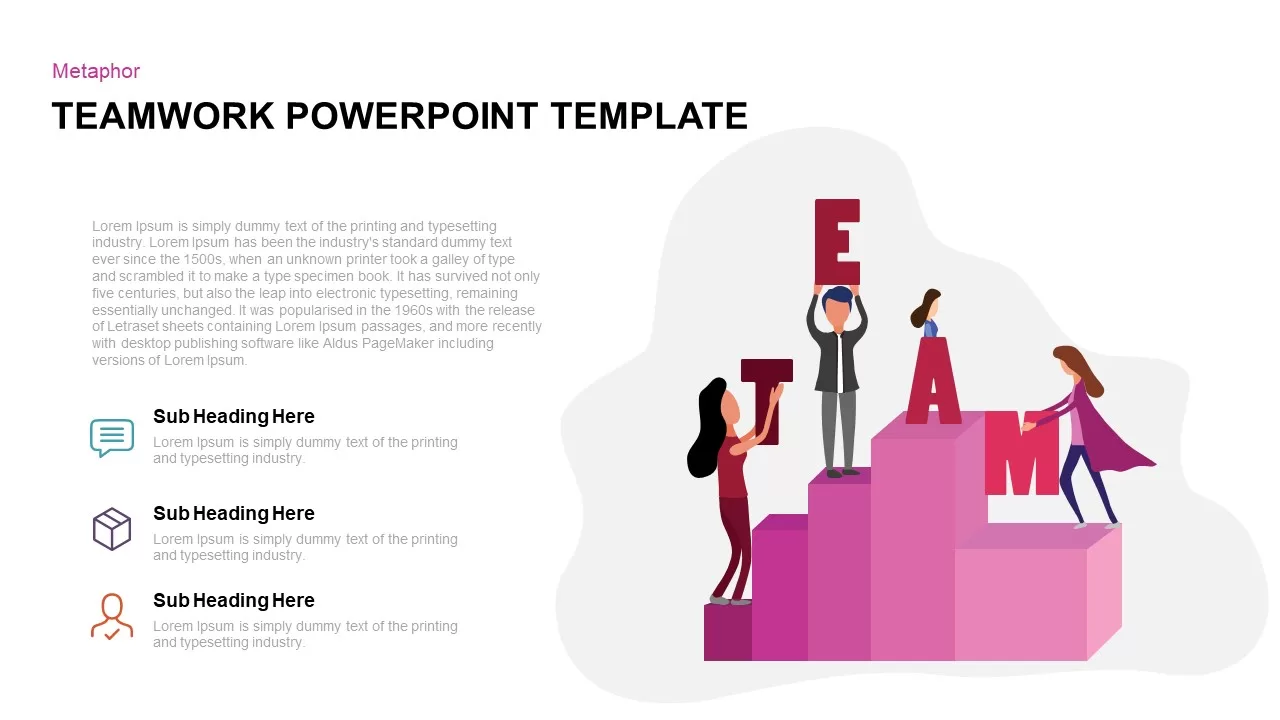
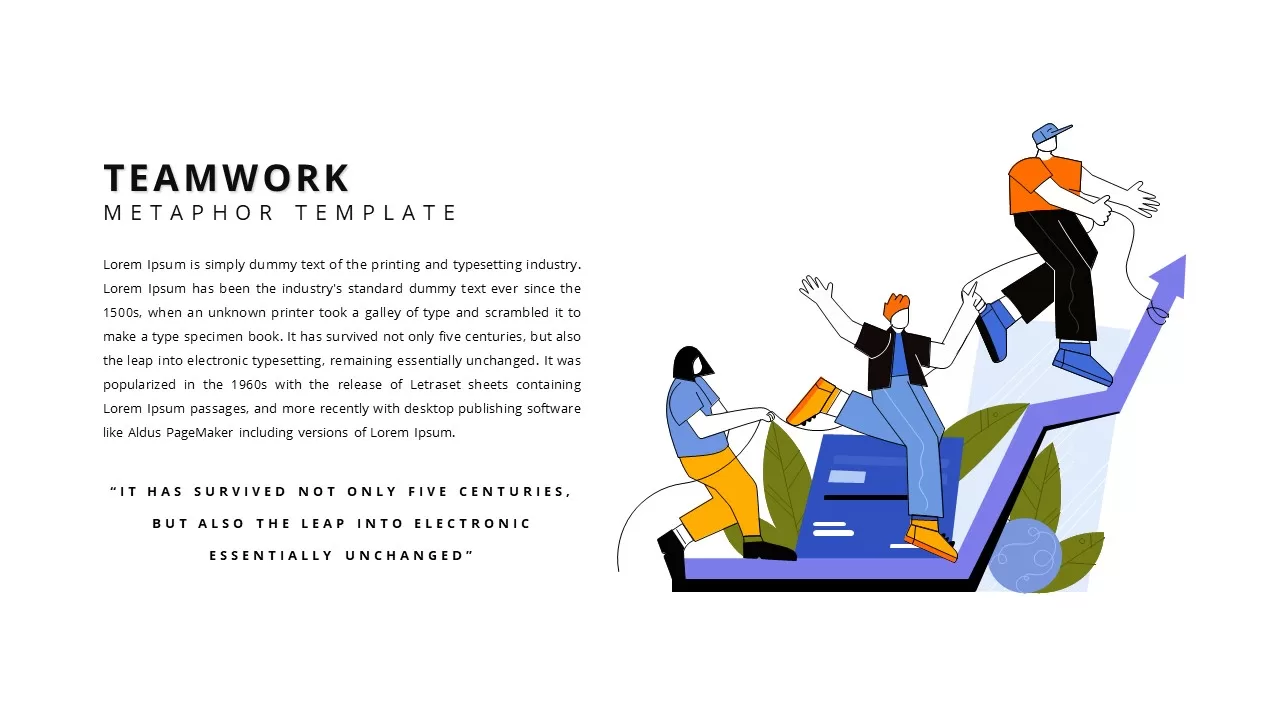
Teamwork Metaphor Illustration Template for PowerPoint & Google Slides
Leadership
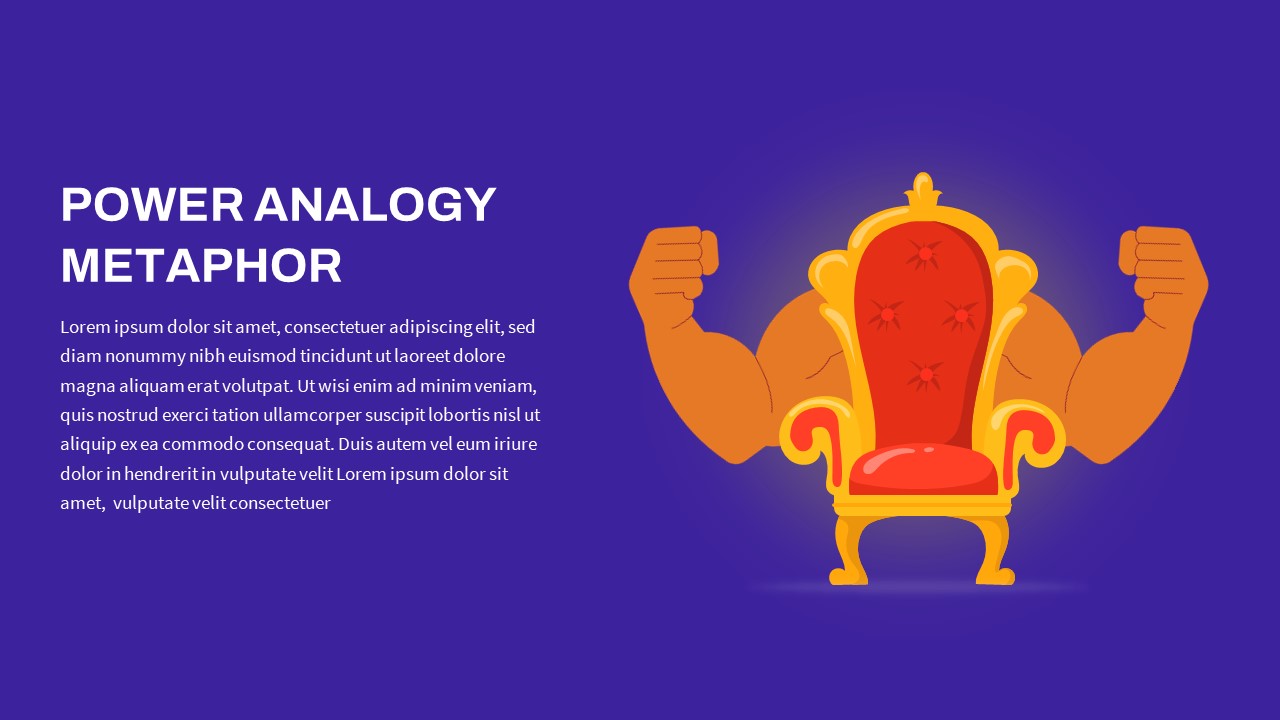
Creative Power Analogy Metaphor Slide Template for PowerPoint & Google Slides
Leadership
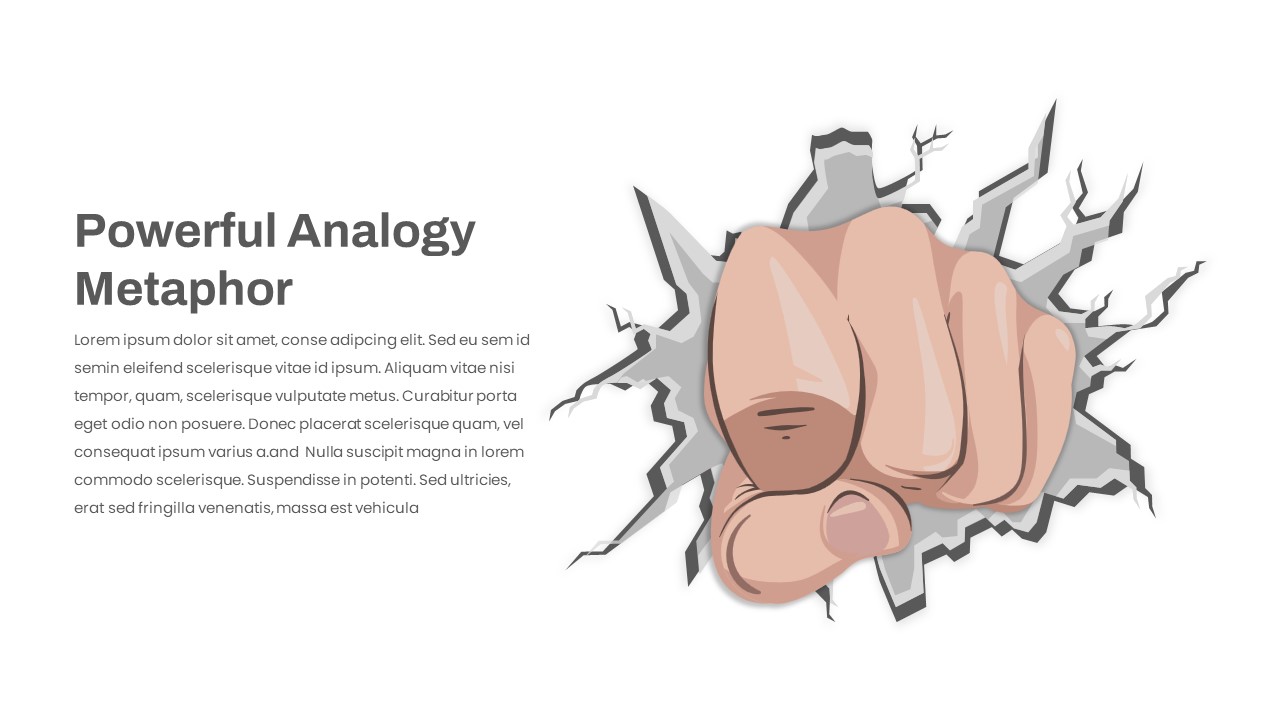
Powerful Visual Metaphor Analogy Slide Template for PowerPoint & Google Slides
Opportunities Challenges
Relay Race Metaphor for PowerPoint & Google Slides
Accomplishment
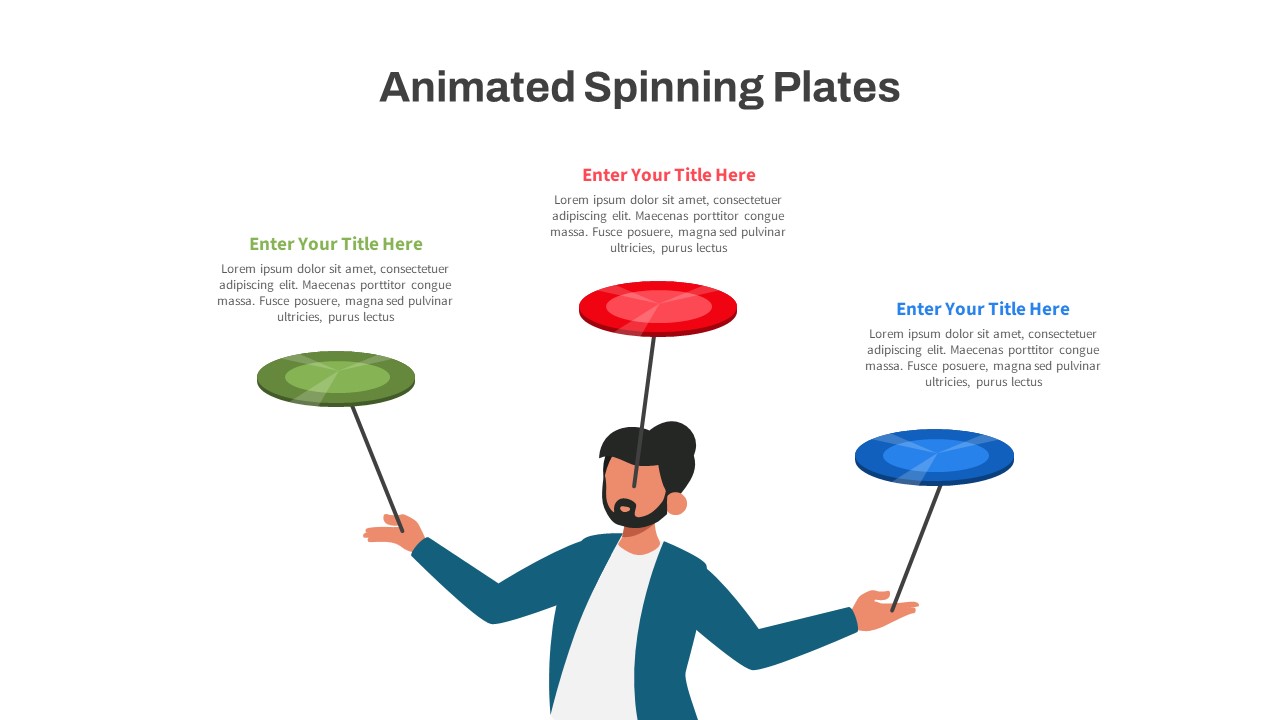
Animated Spinning Plates Metaphor Slide for PowerPoint & Google Slides
Infographics
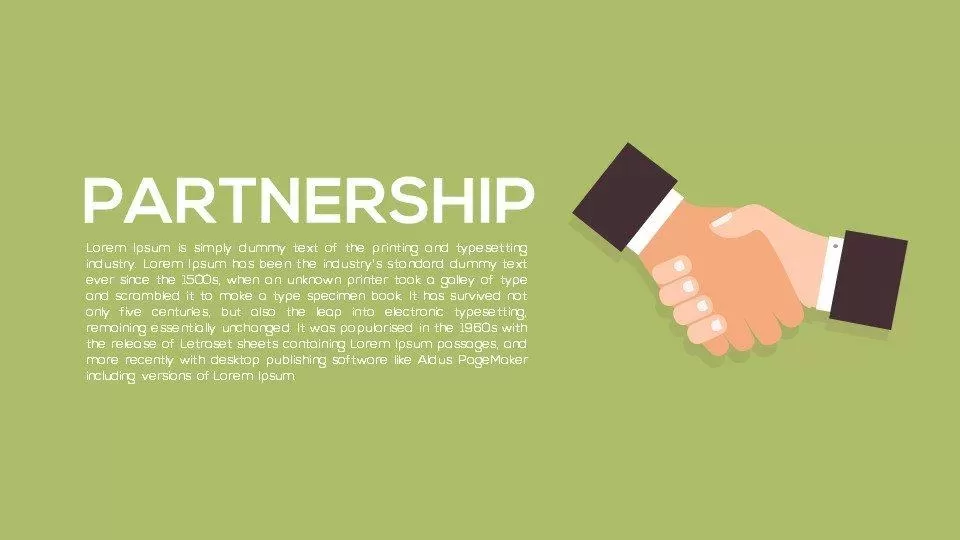
Metaphor Partnership PowerPoint Template and Keynote Template
Opportunities Challenges