KPI Presentation Templates for PowerPoint and Google Slides
![]() Filter
Filter
Filter
-
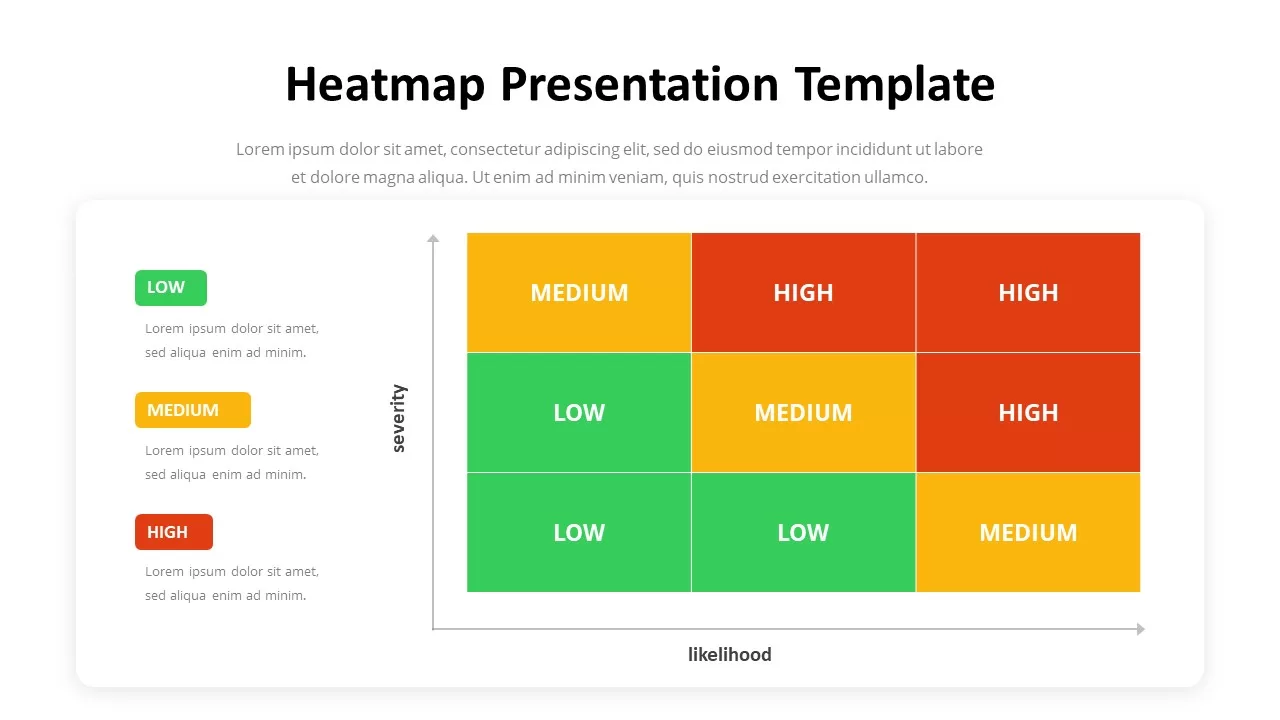
Heatmap Matrix Template for PowerPoint & Google Slides
Maps
-

Agriculture Infographics Slide with Progress Rings & Metrics Template for PowerPoint & Google Slides
Pie/Donut
-

Statistics & Global Metrics Infographic Template for PowerPoint & Google Slides
Bar/Column
-
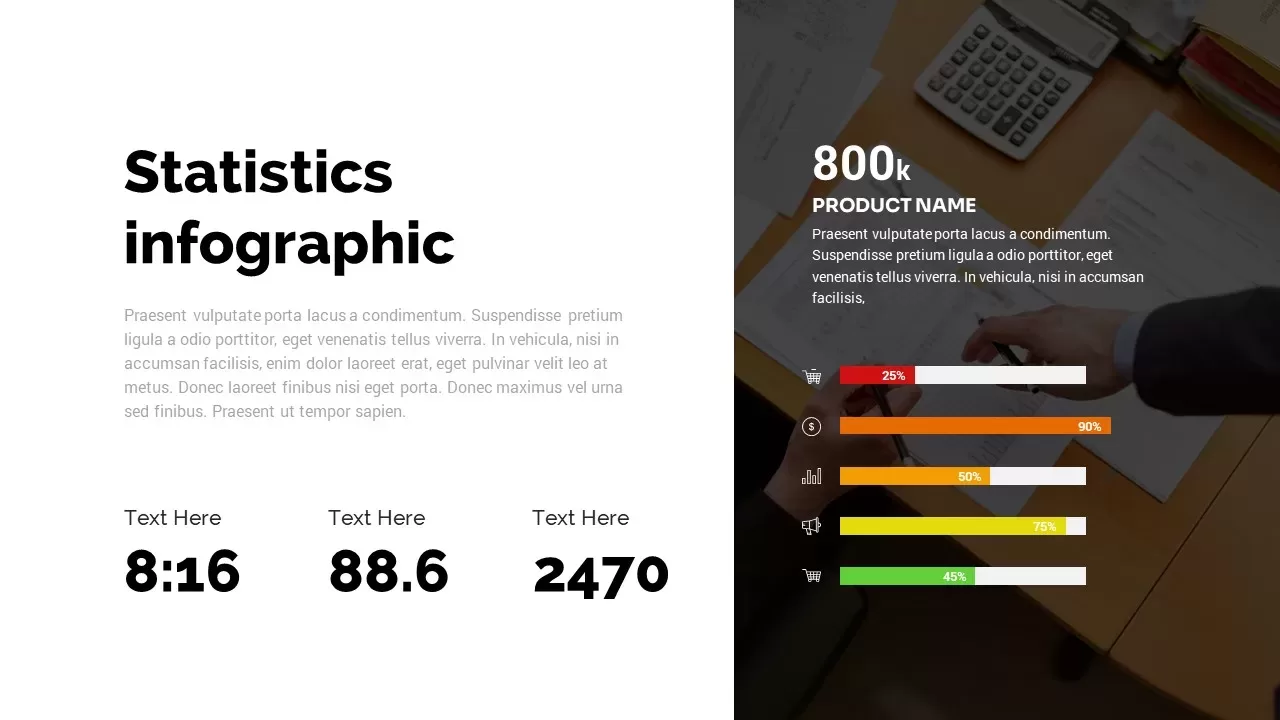
Statistics Infographic Template for PowerPoint & Google Slides
Bar/Column
-

Statistics Infographic & KPI Bar Chart Template for PowerPoint & Google Slides
Bar/Column
-

Circular Image Gallery & KPI Metrics Template for PowerPoint & Google Slides
Pie/Donut
-

Professional Team Collage & KPI Slide Template for PowerPoint & Google Slides
Business
-
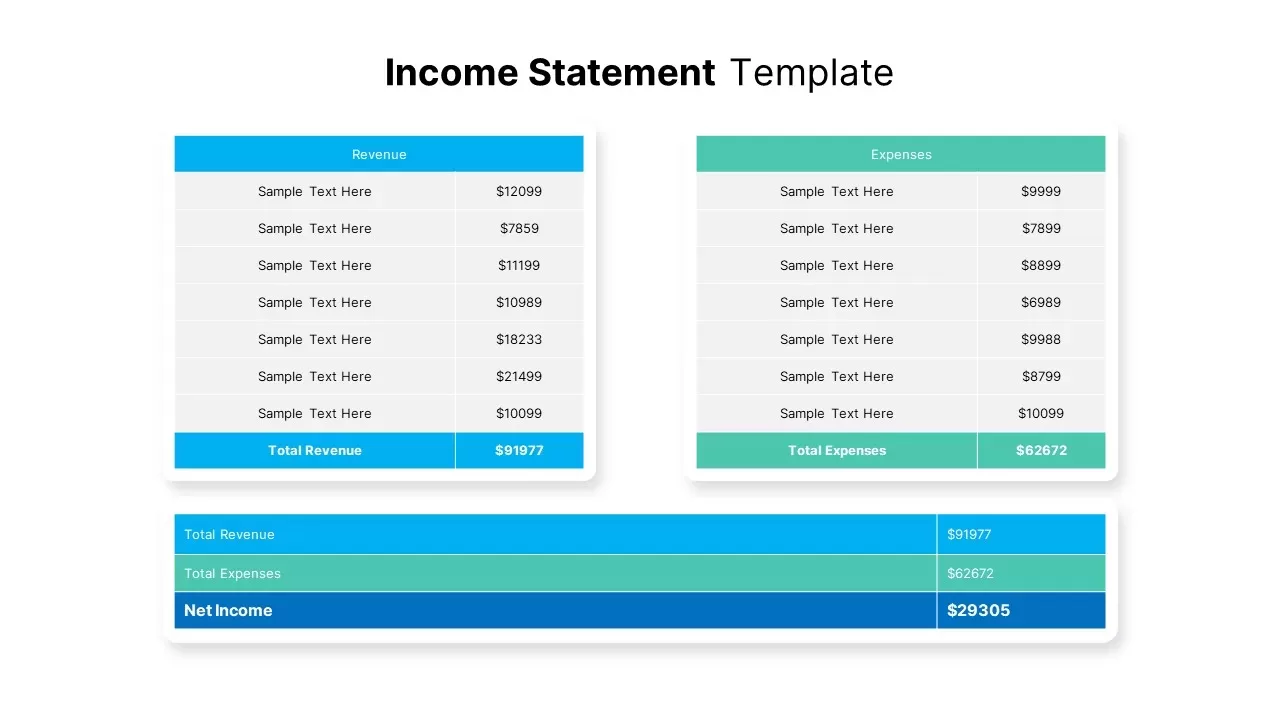
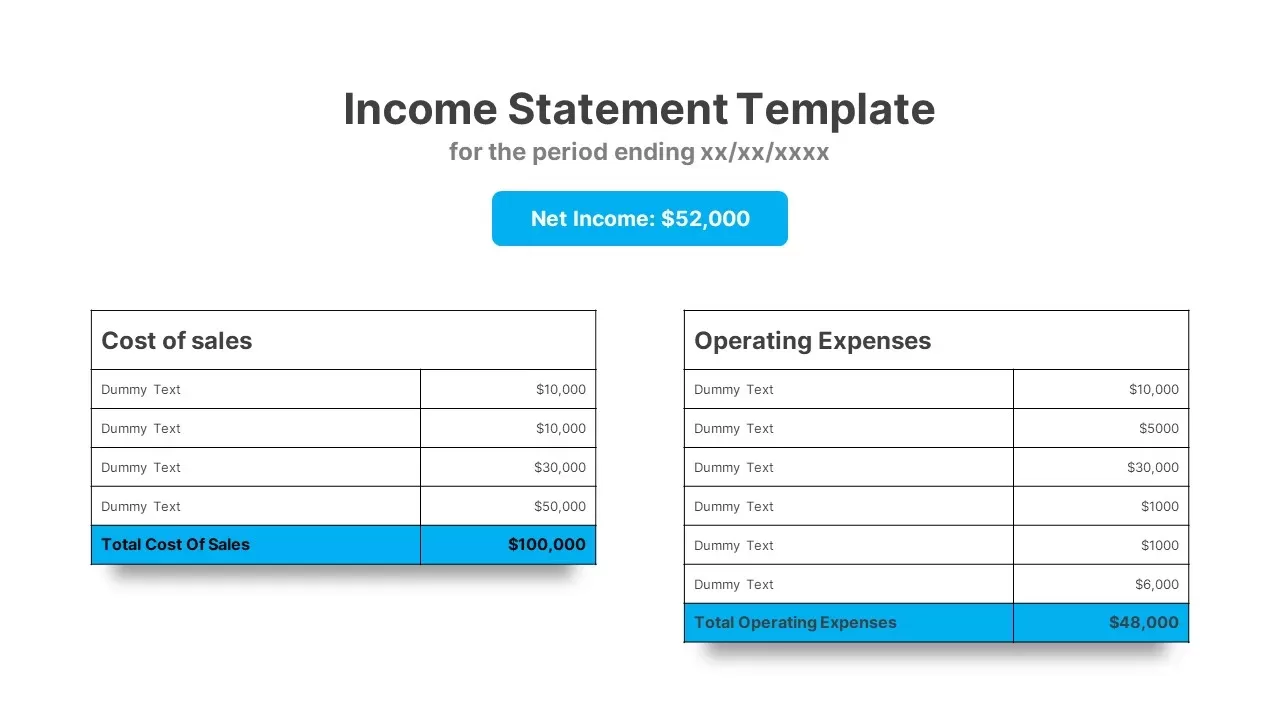
Income Statement Financial Summary Template for PowerPoint & Google Slides
Business Report
-
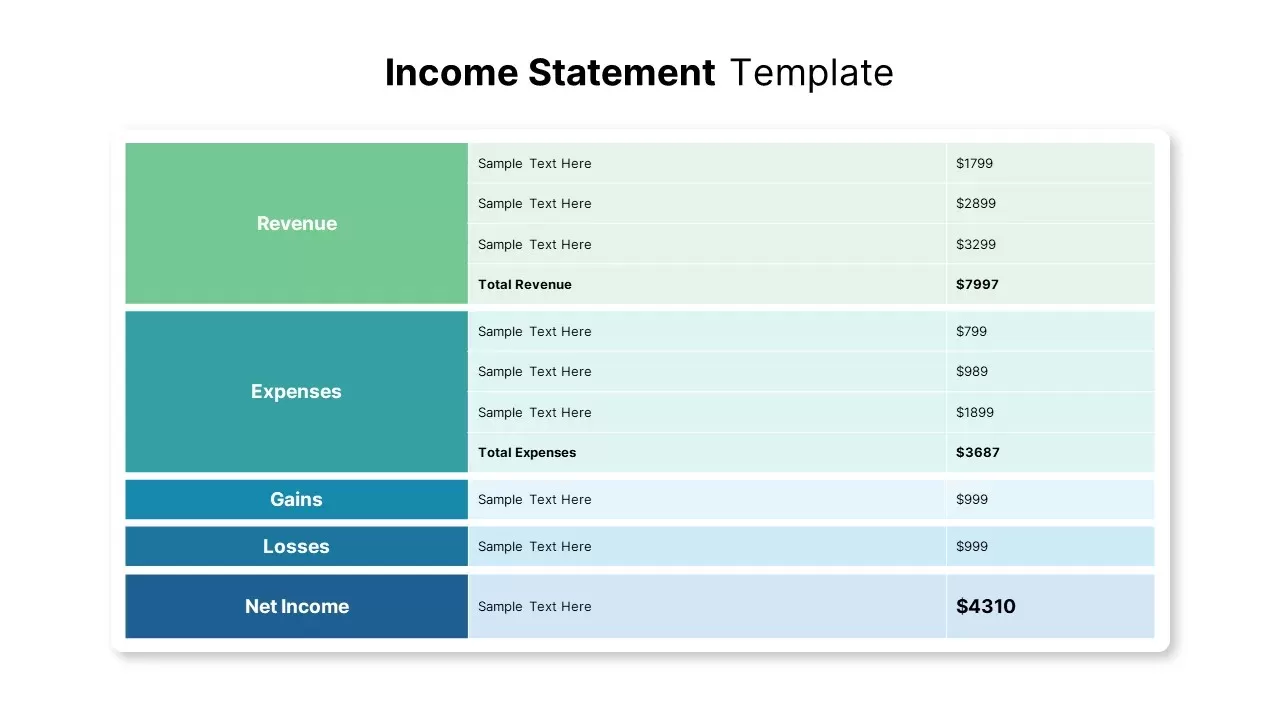
Income Statement Financial Report Template for PowerPoint & Google Slides
Business Report
-
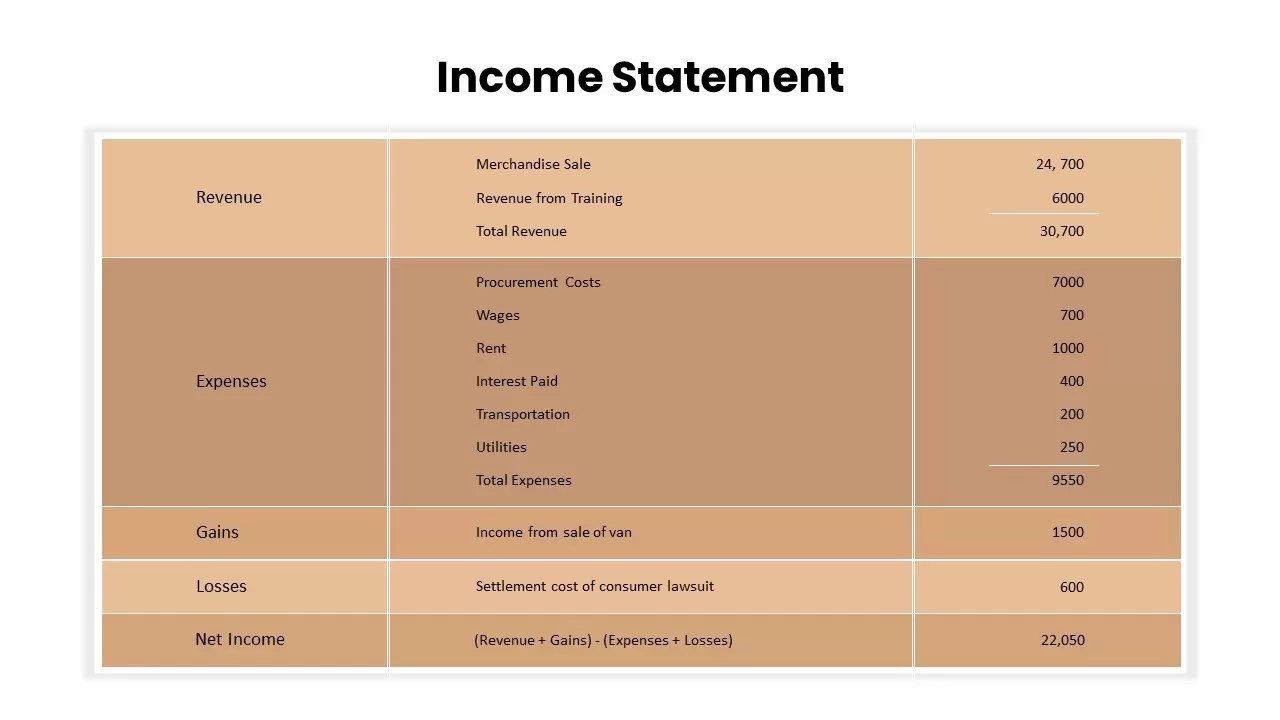
Income Statement Overview Table Template for PowerPoint & Google Slides
Finance
-

Statistics Infographic Template for PowerPoint & Google Slides
Infographics
-
Income Statement Financial Reporting Template for PowerPoint & Google Slides
Finance
-
Colorful Block Infographic Metrics Slide Template for PowerPoint & Google Slides
Infographics
-
KPI Dashboard Data Visualization Template for PowerPoint & Google Slides
Bar/Column
-
KPI Dashboard Data Overview Slide Template for PowerPoint & Google Slides
Bar/Column
-
KPI Dashboard Overview template for PowerPoint & Google Slides
Finance
-
KPI Dashboard template for PowerPoint & Google Slides
Business Report
-
North America Percentage Map Infographic Template for PowerPoint & Google Slides
World Maps
-
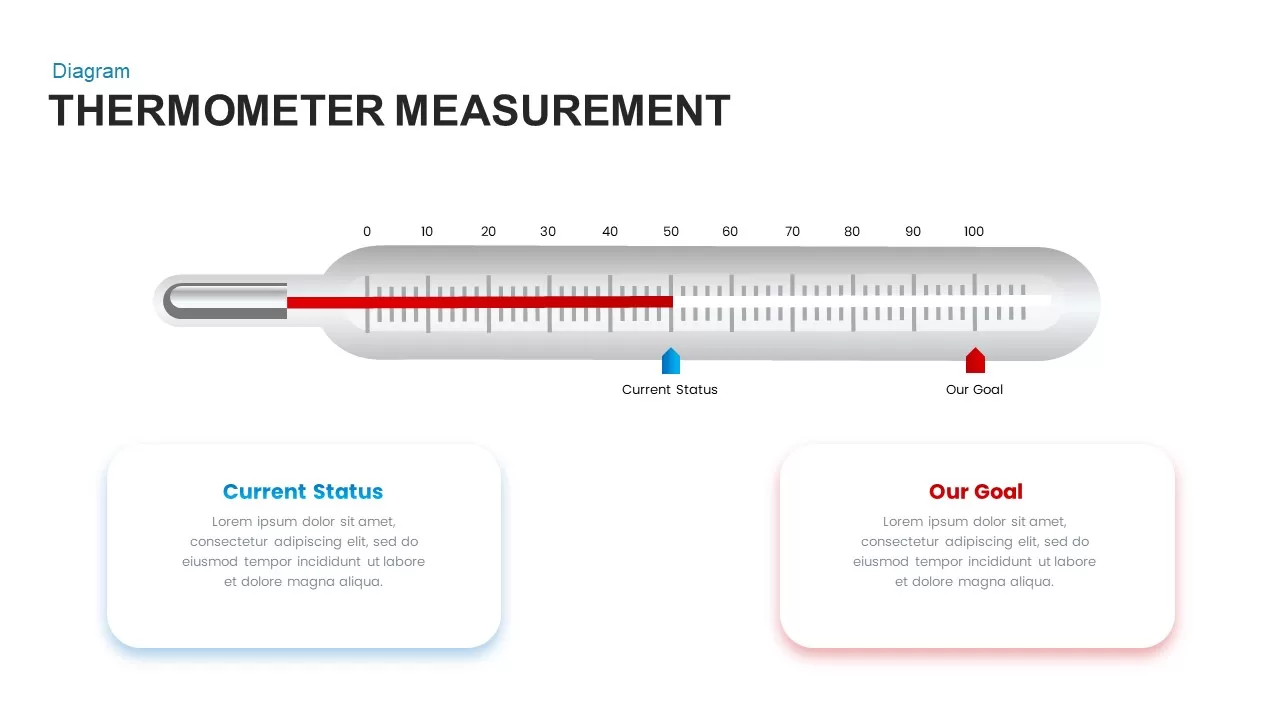
Thermometer Gauge Progress Measurement Template for PowerPoint & Google Slides
Comparison
-
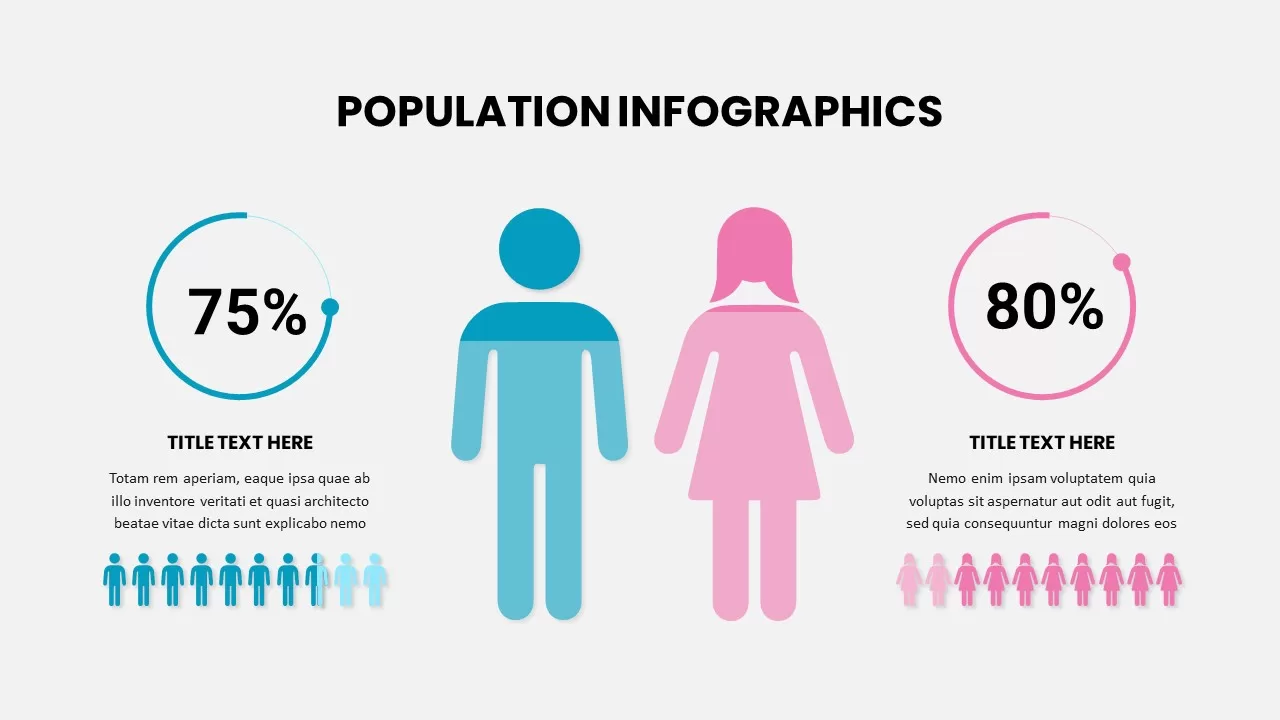
Population Infographic Template for PowerPoint & Google Slides
Comparison
-
Sales Plan Presentation Template for PowerPoint & Google Slides
Business Plan
-
Performance KPI Dashboard Slide Template for PowerPoint & Google Slides
Business Report
-
Comprehensive Recruitment Metrics Report Template for PowerPoint & Google Slides
Recruitment
-
Corporate Performance Management Template for PowerPoint & Google Slides
Pitch Deck
-
Dashboard Templates for PowerPoint & Google Slides
Bar/Column
-

Net Promoter Score Dashboard Template for PowerPoint & Google Slides
Customer Experience
-
Sales Growth Dashboard: KPI Gauge & Line Template for PowerPoint & Google Slides
Revenue
-
Mobile Infographics Data Visualization Template for PowerPoint & Google Slides
Infographics
-

Application Revenue Line Chart KPI Template for PowerPoint & Google Slides
Revenue
-
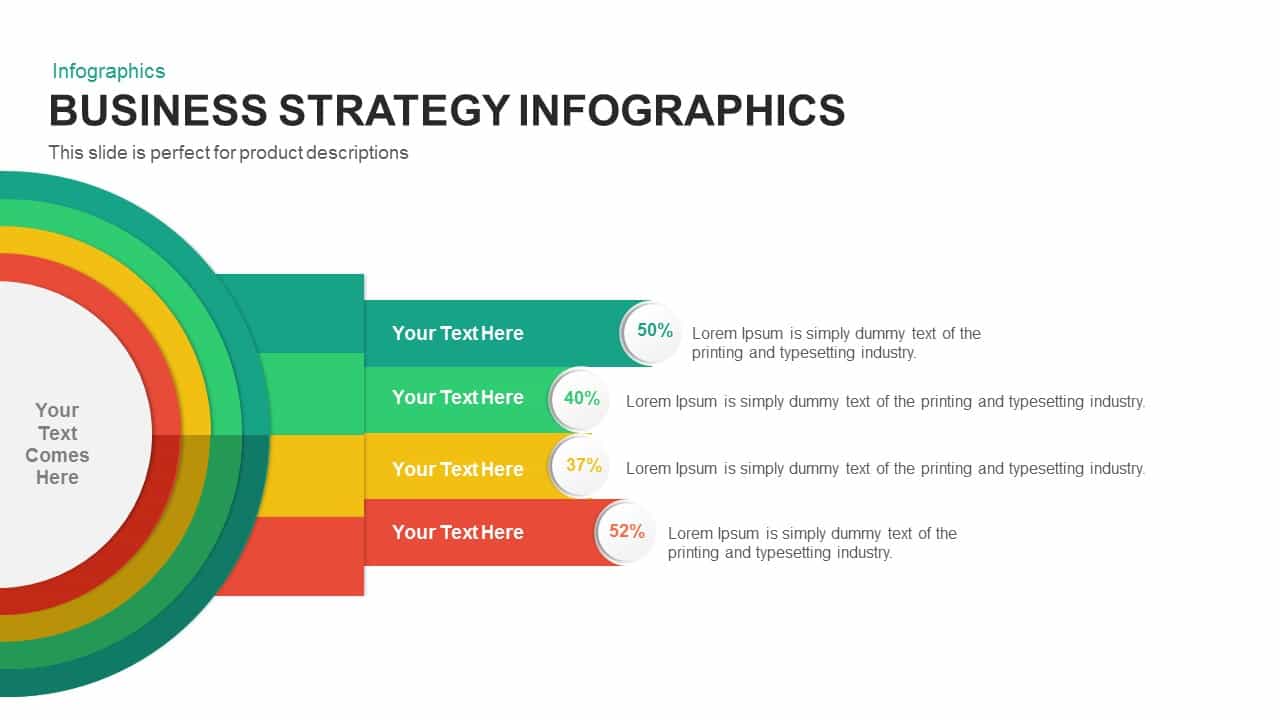
Business Strategy Infographics Diagram Template for PowerPoint & Google Slides
Business Strategy
-
Sales vs Budget Performance Chart Template for PowerPoint & Google Slides
Bar/Column
-
Mobile Usage Metrics template for PowerPoint & Google Slides
Comparison Chart
-
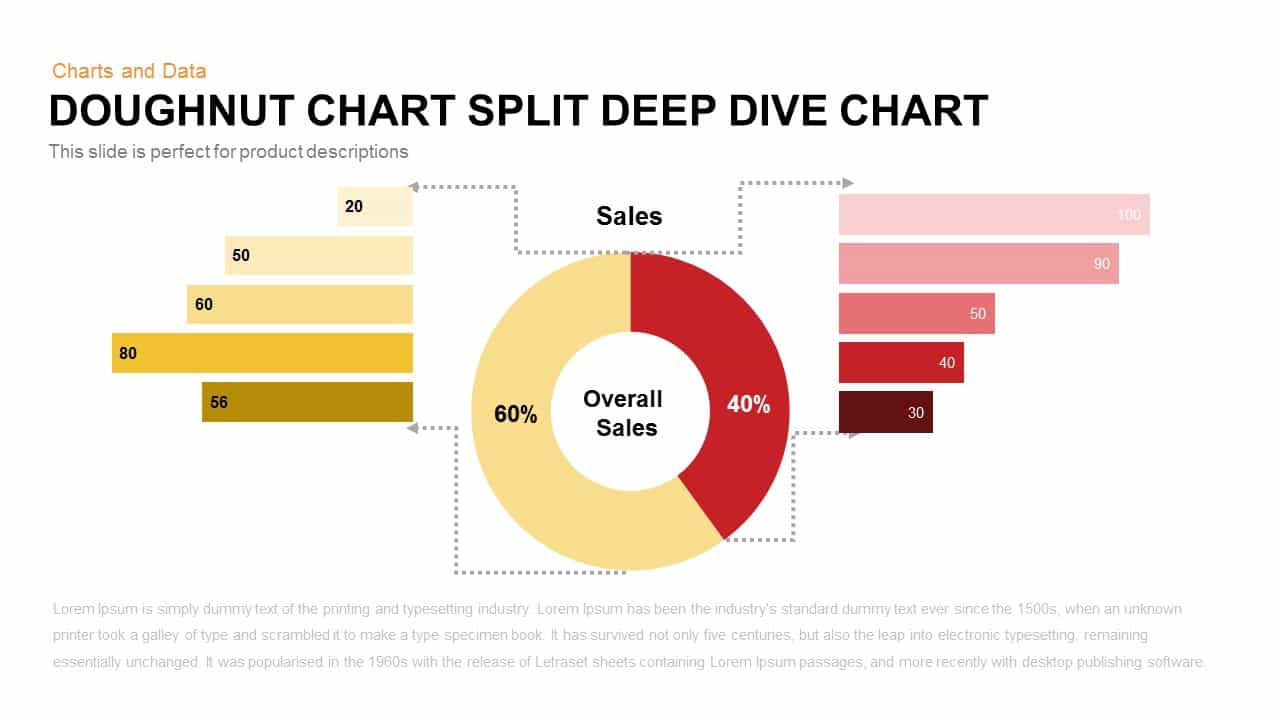
Split Doughnut Deep Dive Sales Analysis Template for PowerPoint & Google Slides
Pie/Donut
-
Bubble Head Metrics Infographic Template for PowerPoint & Google Slides
Circular
-
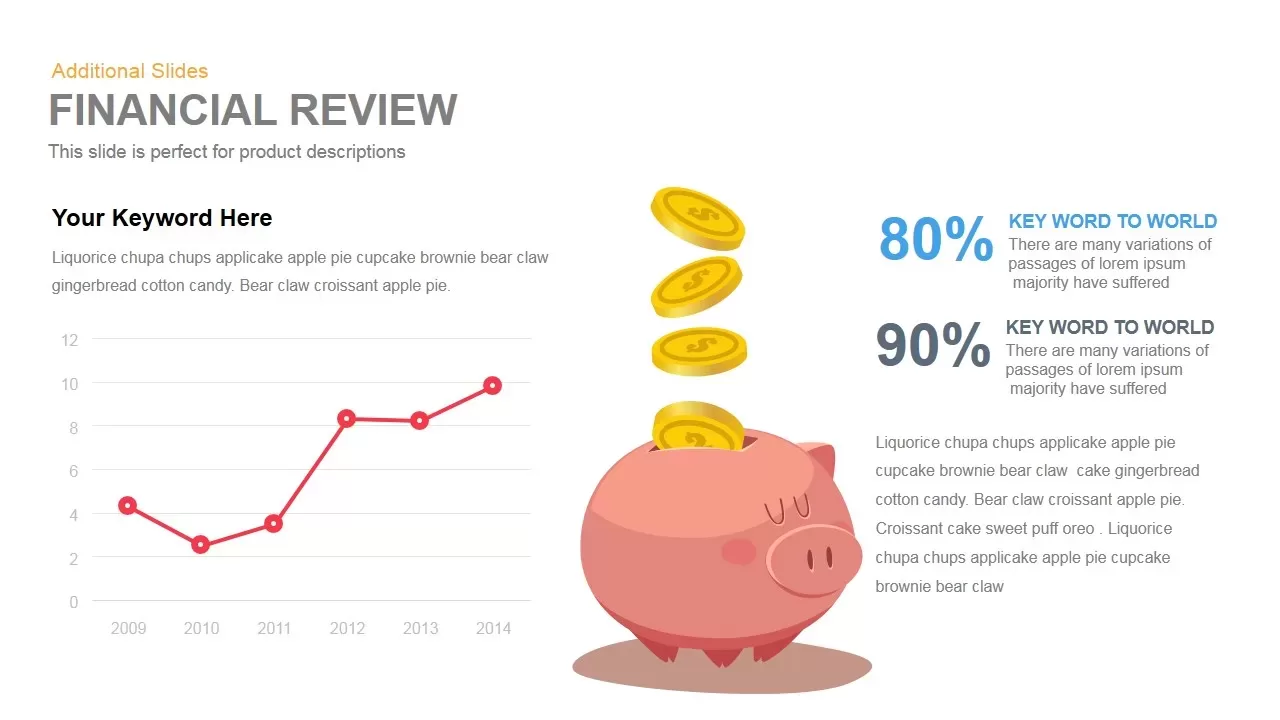
Financial Review template for PowerPoint & Google Slides
Finance