Hierarchy of Controls Slide Template for PowerPoint & Google Slides


Description
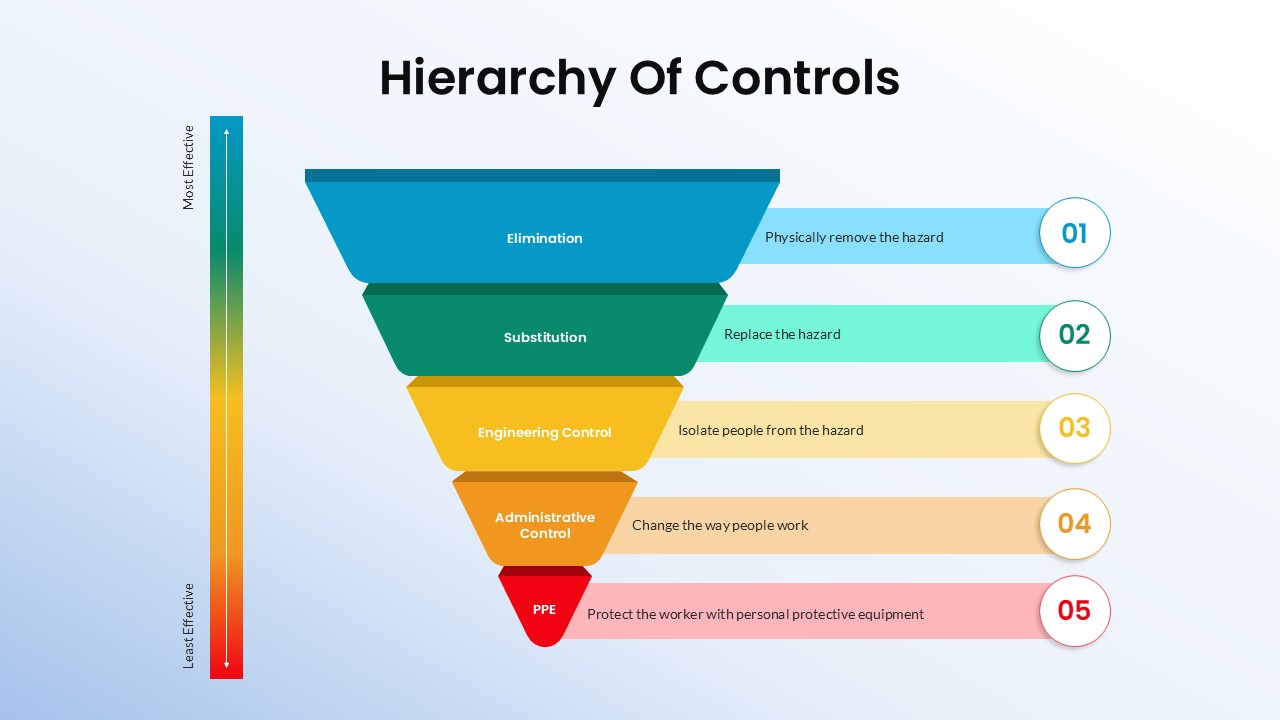
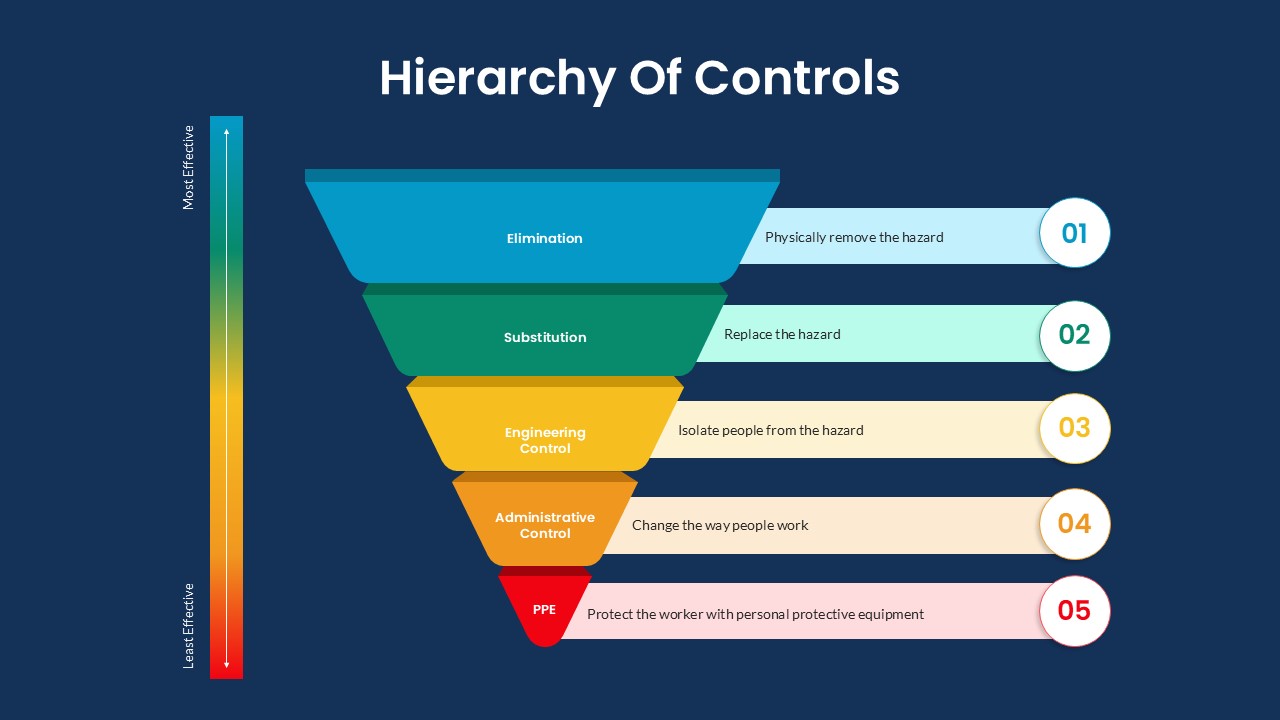
This slide visualizes the classic “Hierarchy of Controls” in a descending funnel: from the most effective strategies at the top (Elimination, Substitution) down to the least effective (PPE) at the bottom. Each tier is color-coded—blue, green, yellow, orange, red—and labeled with its control name. To the right of each funnel segment is a matching callout bar with a brief action statement (e.g. “Physically remove the hazard,” “Replace the hazard,” etc.) and a circled step number (01–05). On the left, a vertical gradient bar—from cool green at “Most Effective” to red at “Least Effective”—reinforces relative impact. A clean white-to-light-blue gradient background keeps focus on the content. Everything (text, colors, labels) is fully editable.
Who is it for
EHS managers, safety trainers, operational leaders, and risk-management teams who need to teach or review workplace hazard-control strategies.
Other Uses
- Safety training presentations
- Risk mitigation planning sessions
- Incident‐investigation debriefs
- ISO/OSH compliance workshops
Login to download this file

Item ID
SB05353
Related Templates

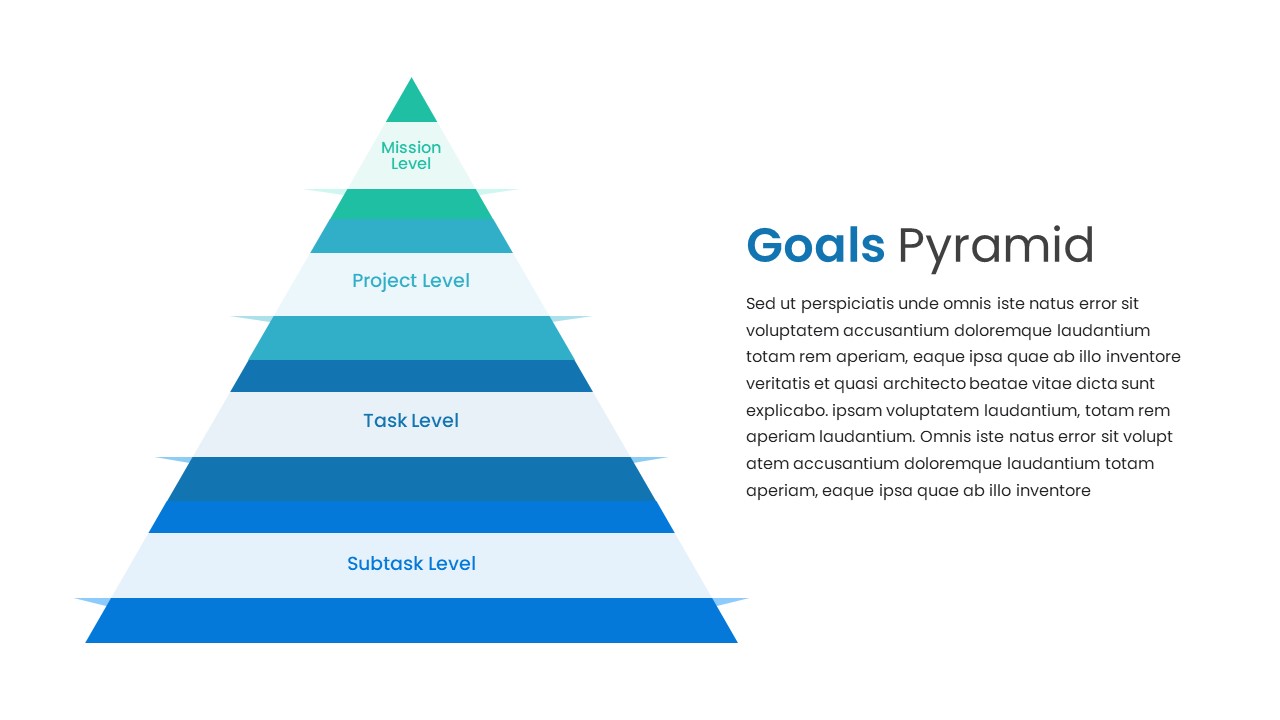
Goals Pyramid Hierarchy Slide Design Template for PowerPoint & Google Slides
Pyramid
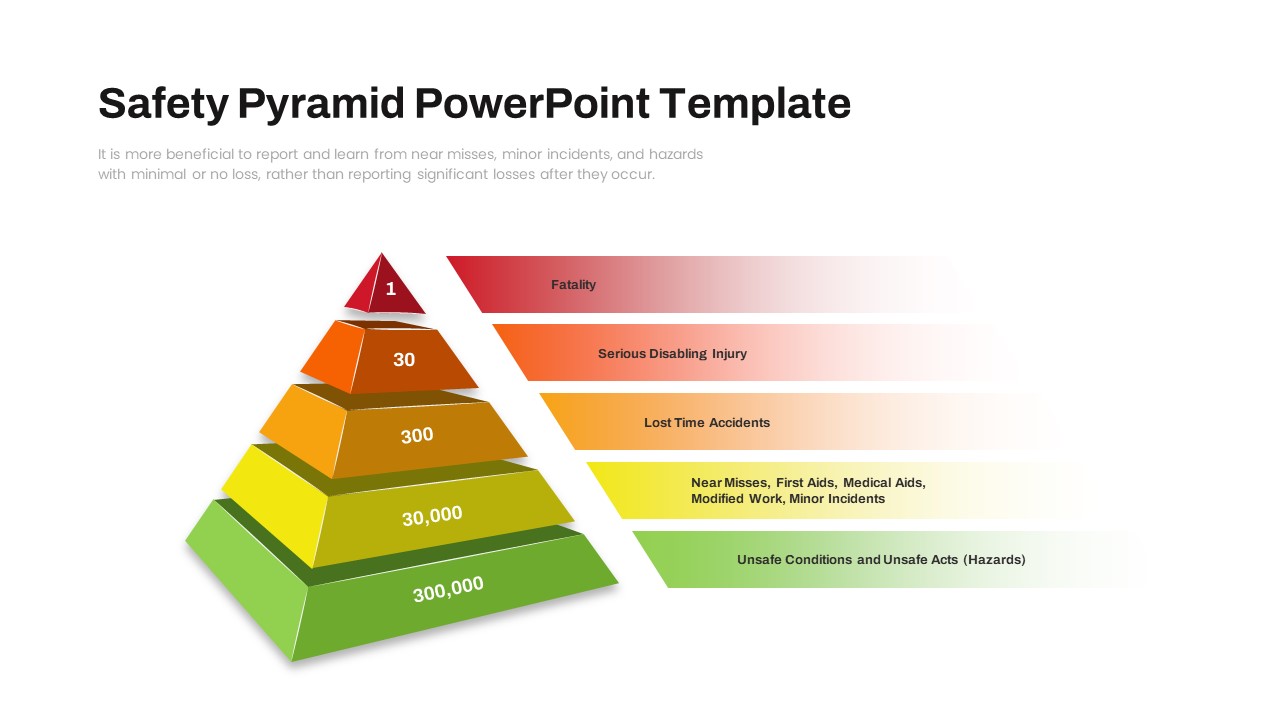
Safety Incident Pyramid Risk Hierarchy Slide for PowerPoint & Google Slides
Risk Management

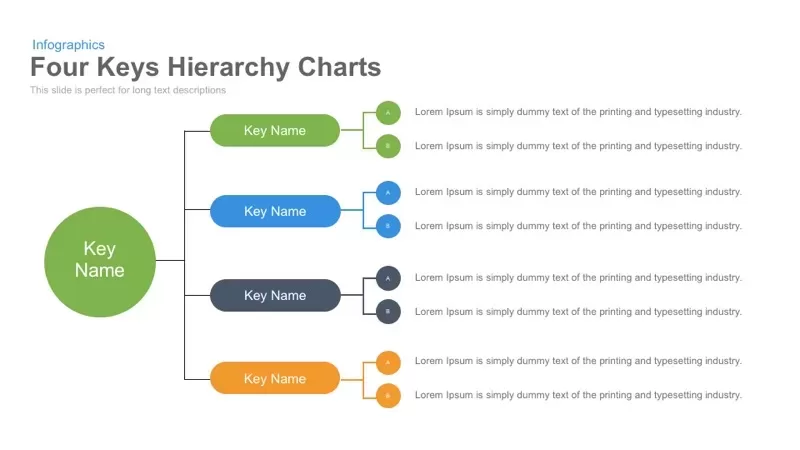
Four Keys Hierarchy Chart template for PowerPoint & Google Slides
Process
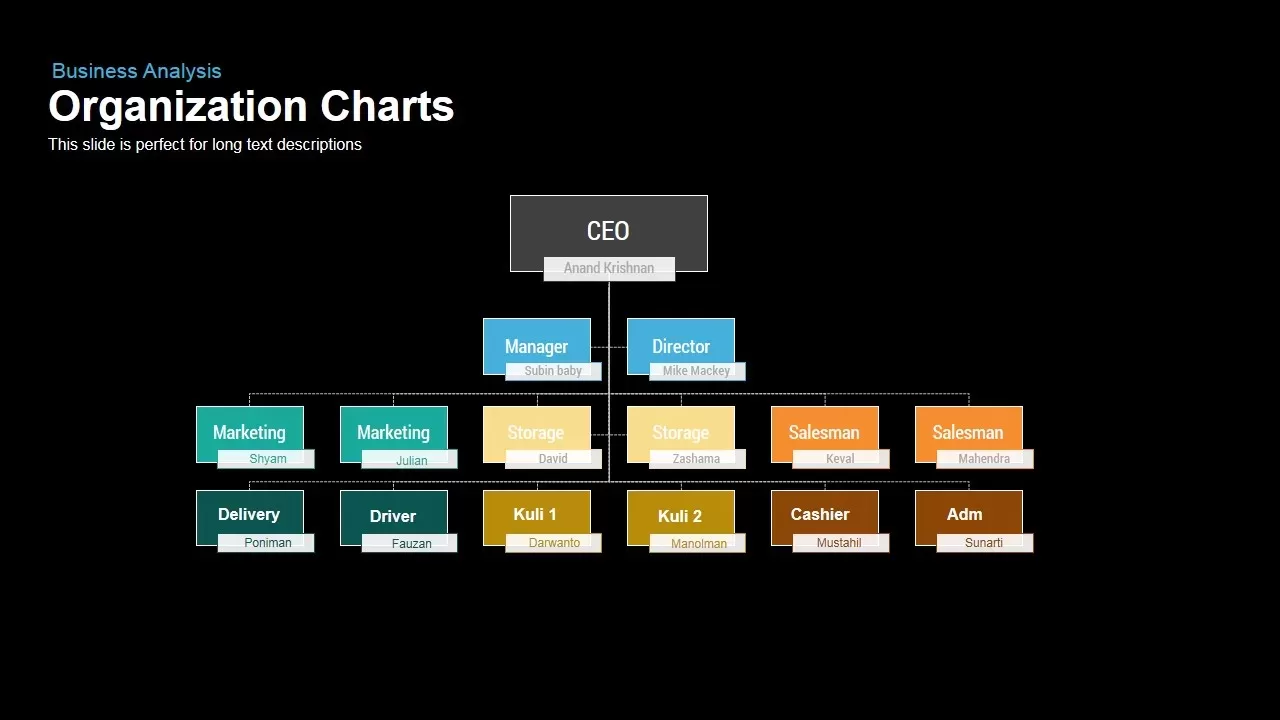
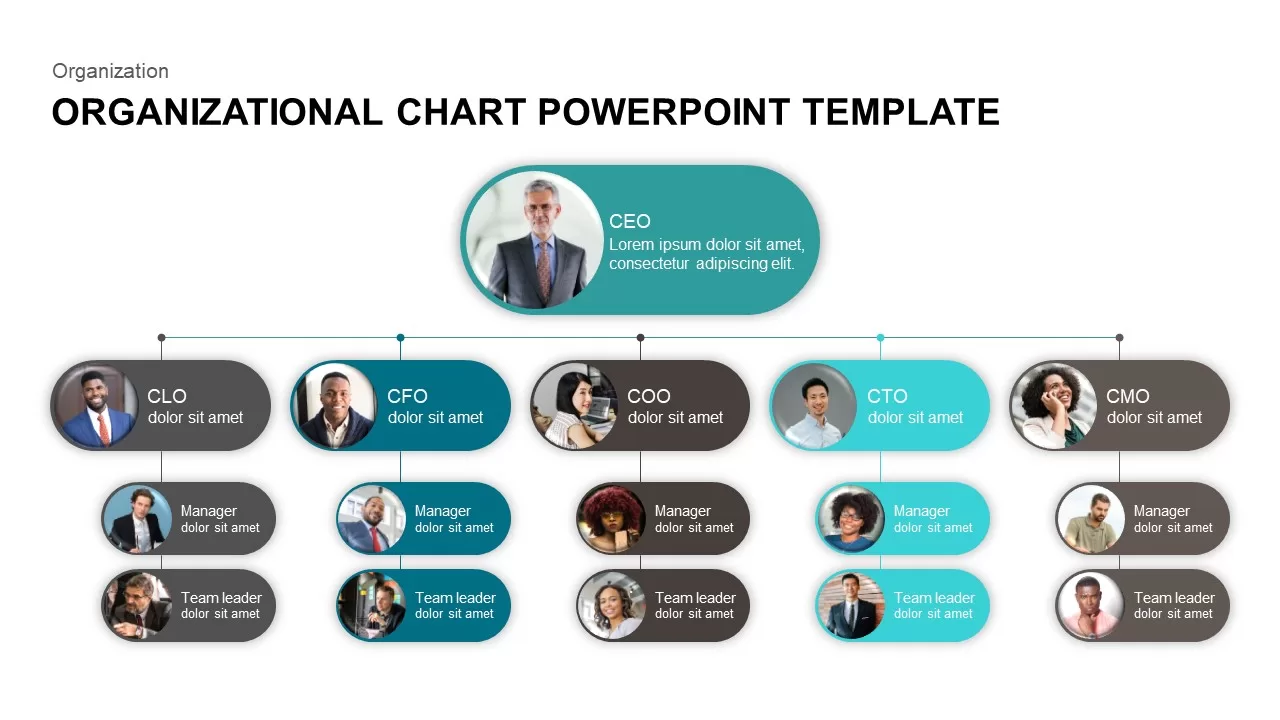
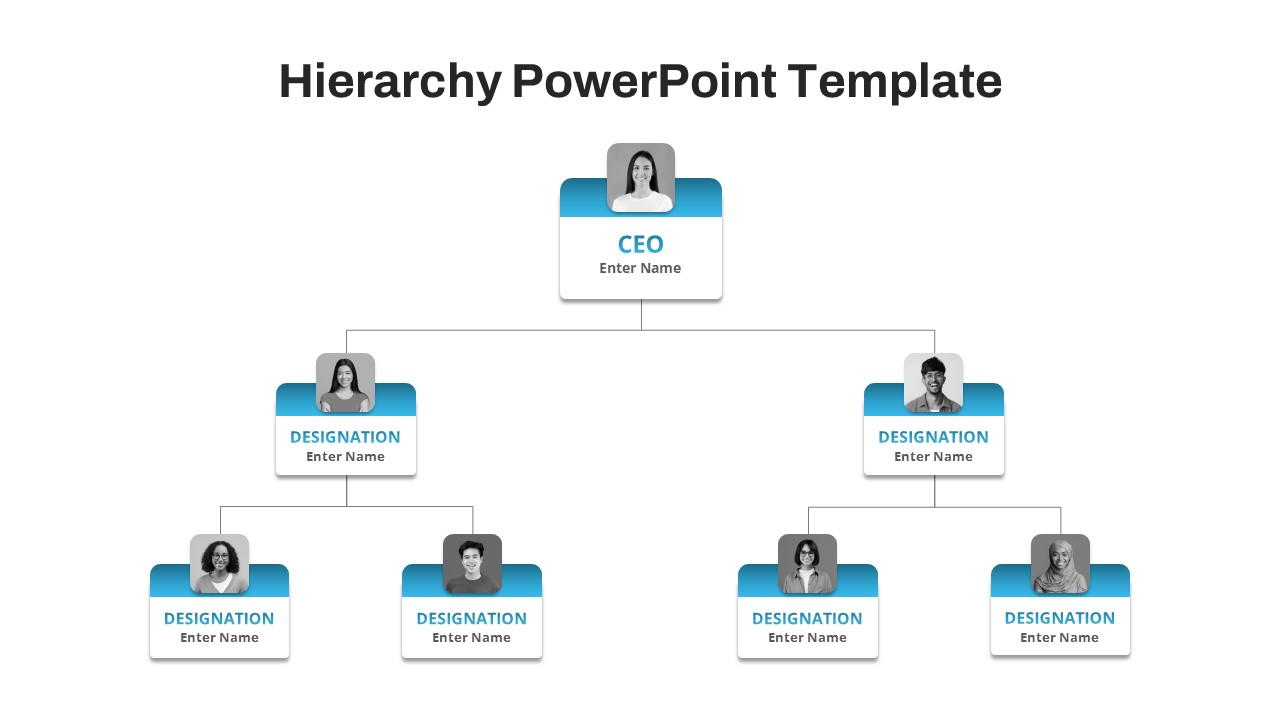
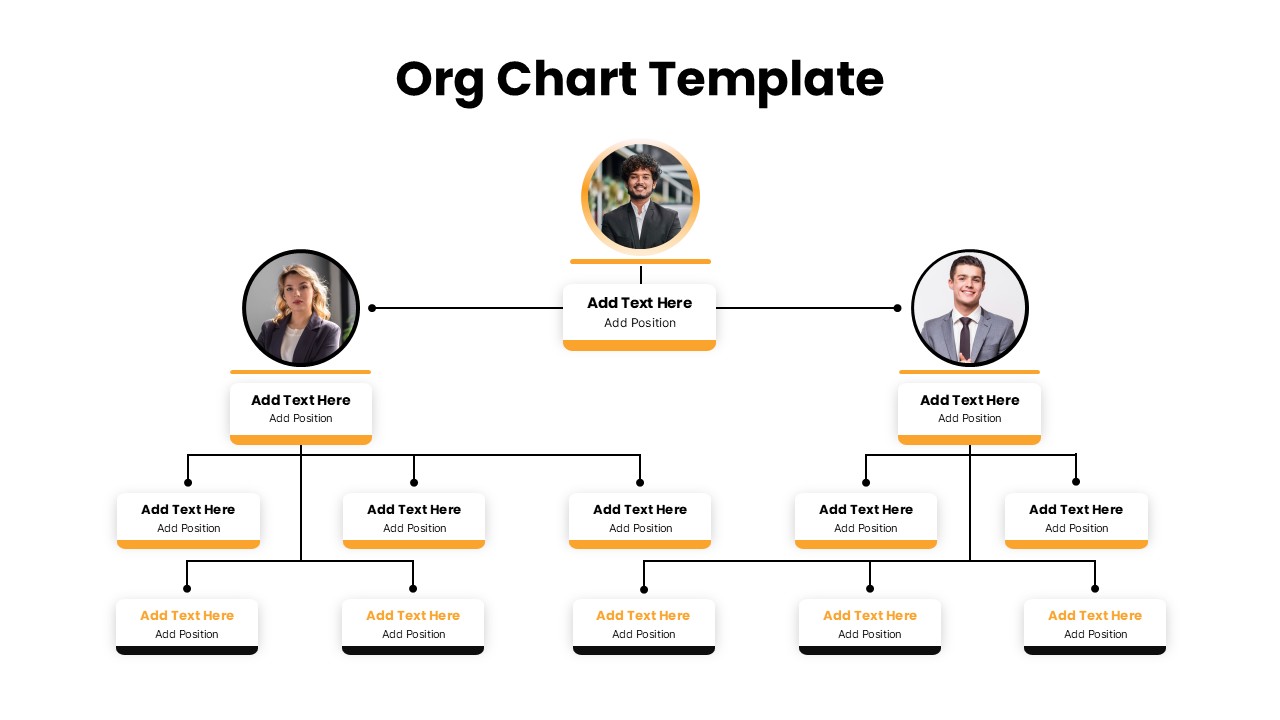
Business Organization Chart Hierarchy Template for PowerPoint & Google Slides
Org Chart
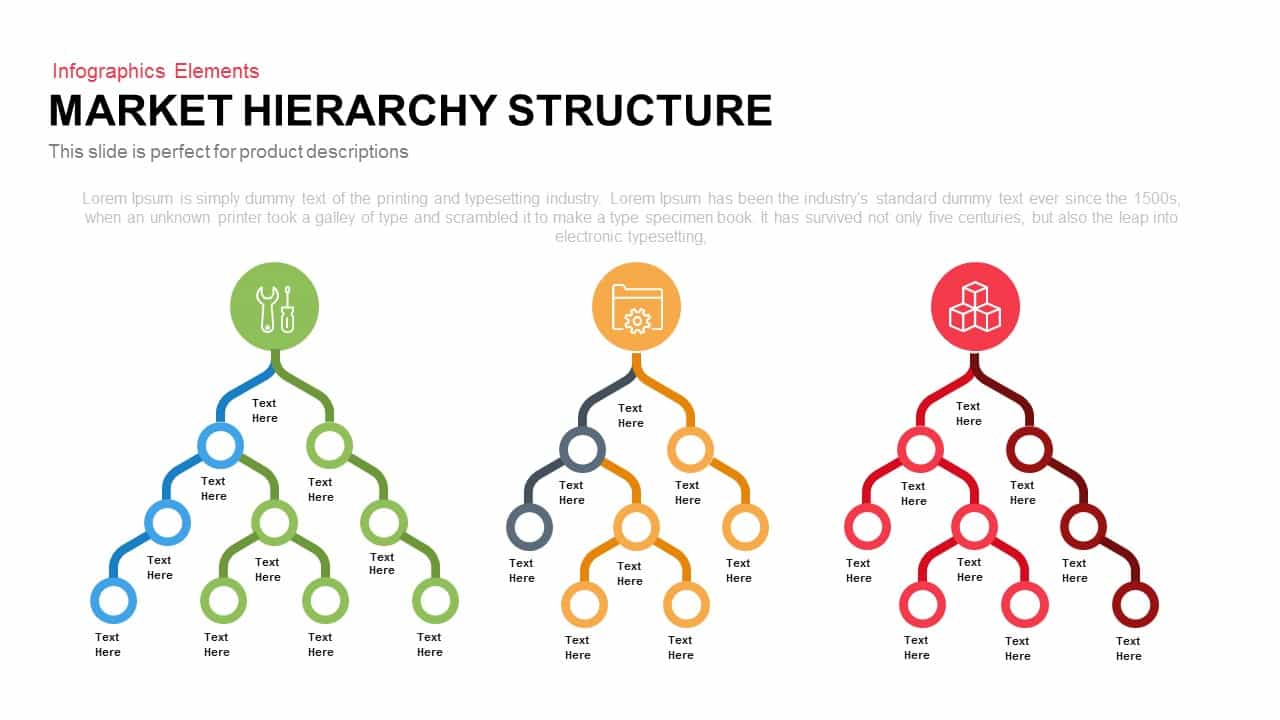
Market Hierarchy Structure Infographic template for PowerPoint & Google Slides
Org Chart
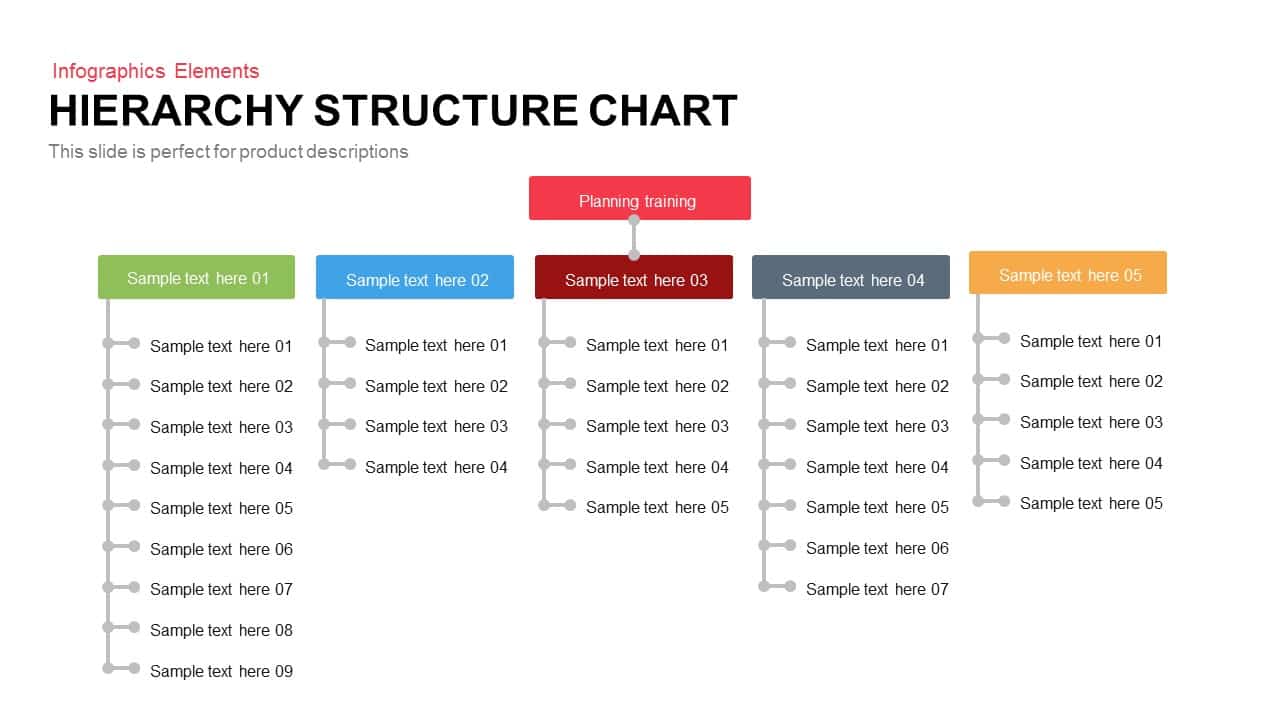
Five-Branch Hierarchy Structure Chart template for PowerPoint & Google Slides
Org Chart
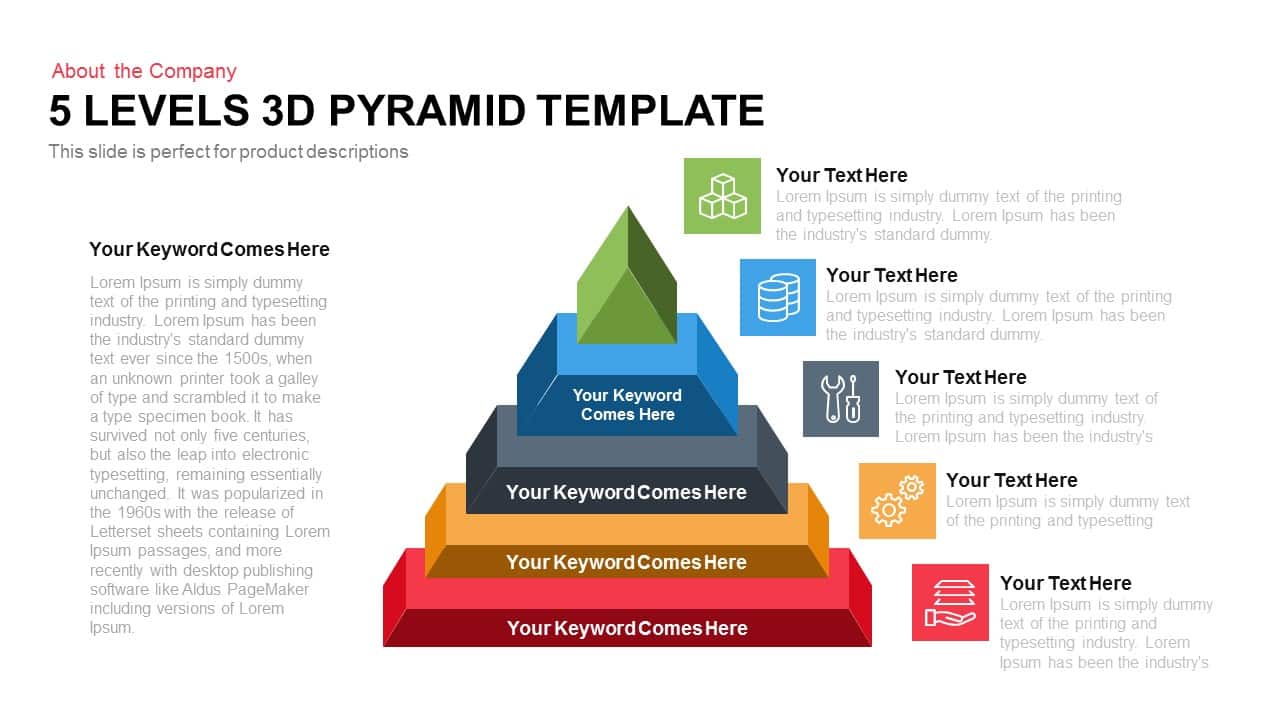
Five-Level 3D Pyramid Hierarchy Template for PowerPoint & Google Slides
Pyramid
Horizontal Multi-Level Hierarchy Chart template for PowerPoint & Google Slides
Org Chart

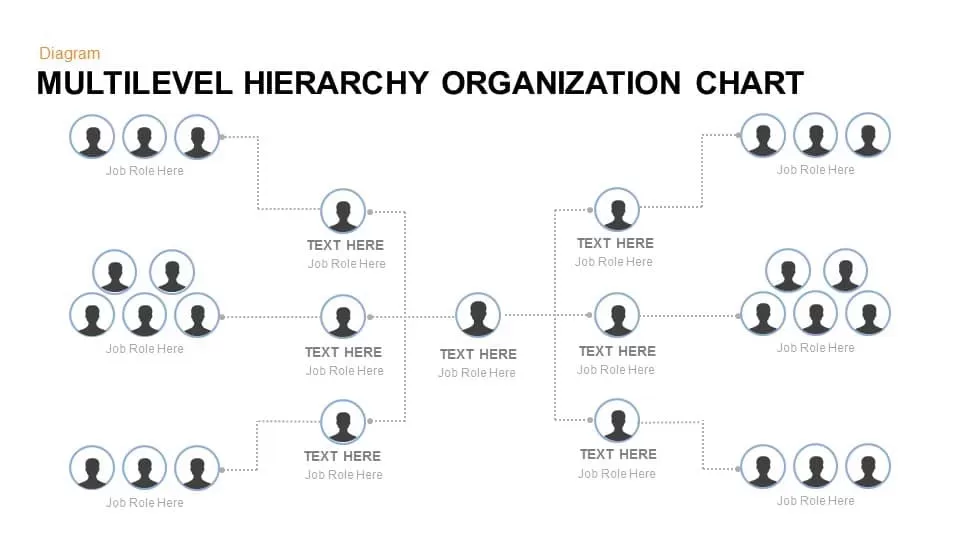
Multilevel Hierarchy Organization Chart template for PowerPoint & Google Slides
Org Chart
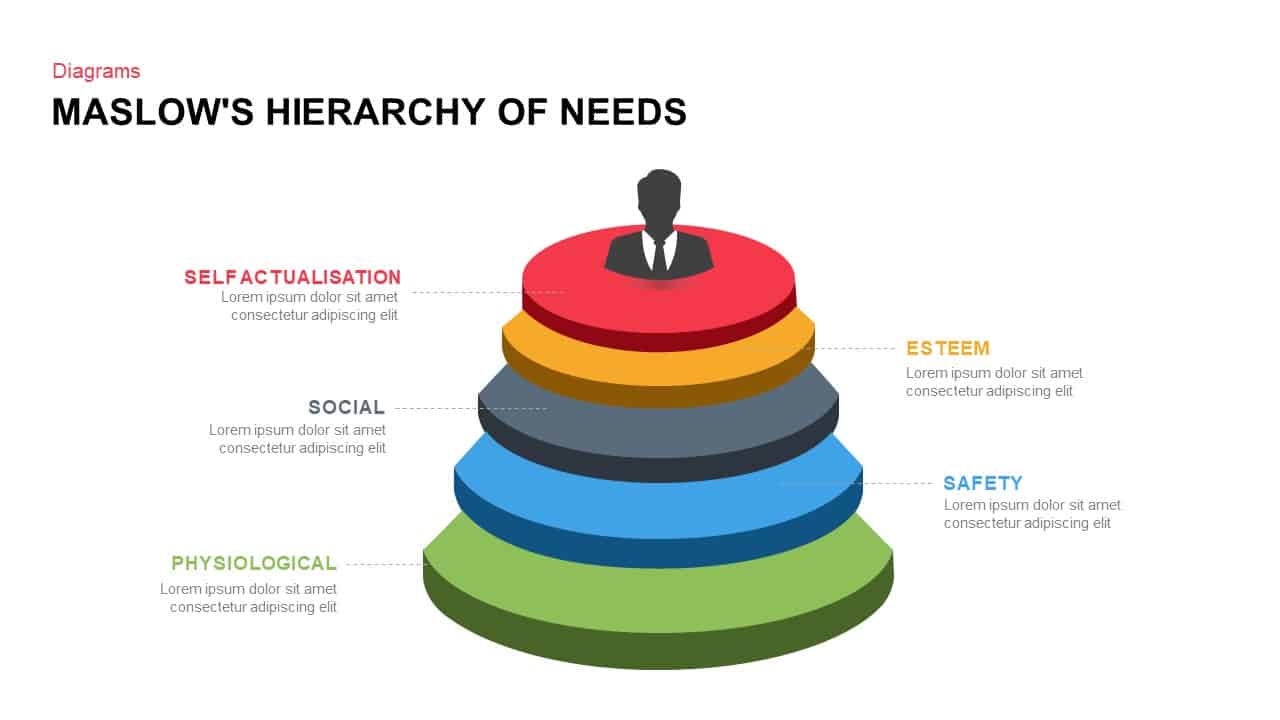
Maslow’s Hierarchy of Needs Pyramid Template for PowerPoint & Google Slides
Pyramid
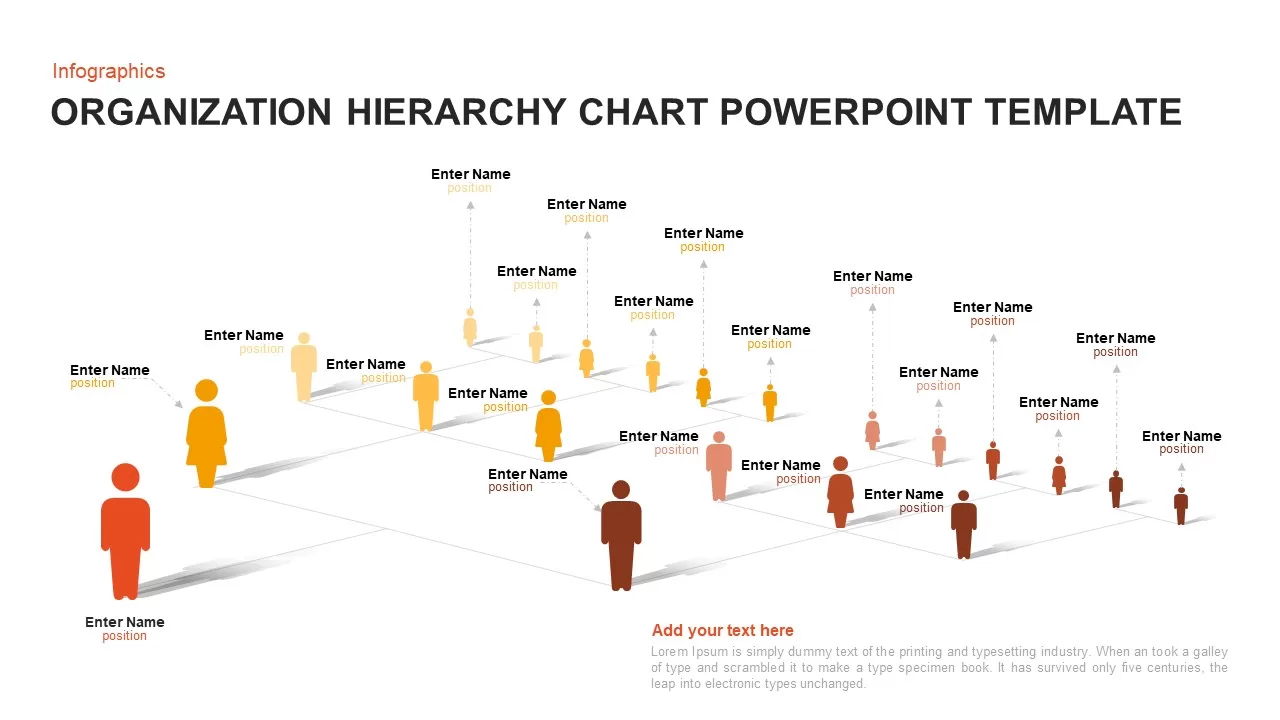
3D Organization Hierarchy Chart Template for PowerPoint & Google Slides
Org Chart
Corporate Organizational Chart Hierarchy Template for PowerPoint & Google Slides
Org Chart
Maslow’s Hierarchy of Needs Pyramid template for PowerPoint & Google Slides
Pyramid
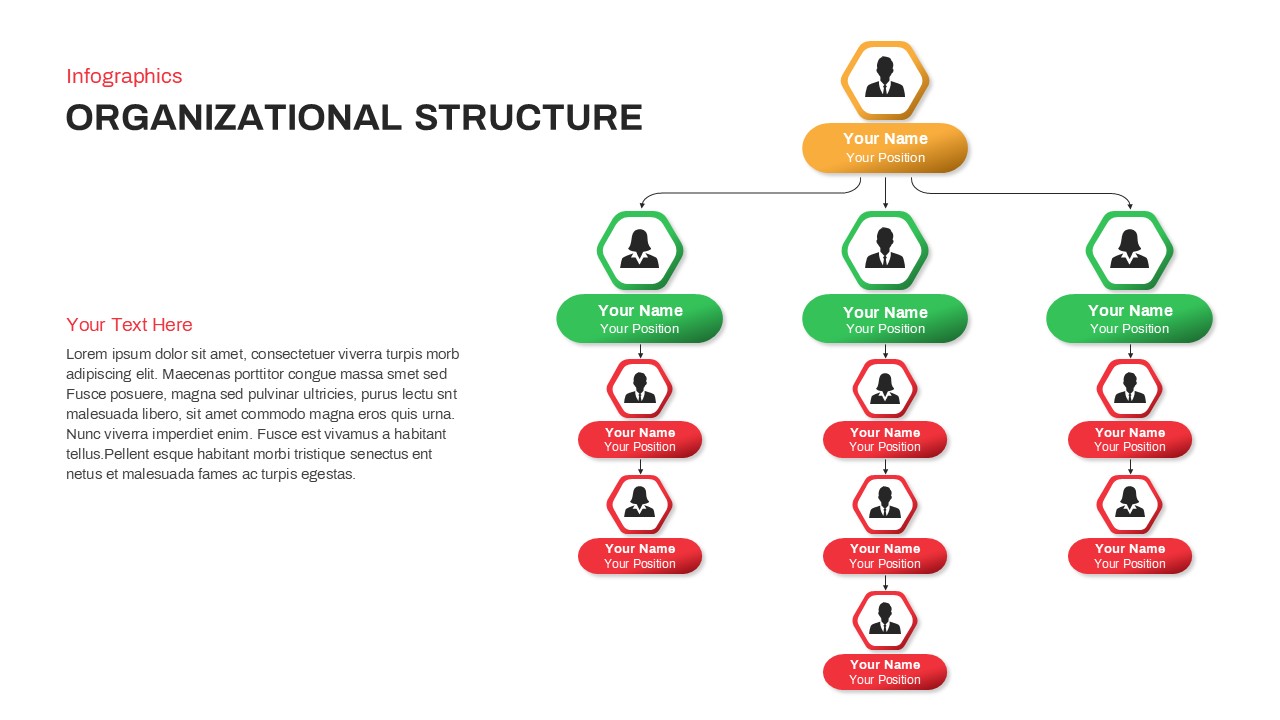
Organizational Structure Hierarchy Chart Template for PowerPoint & Google Slides
Org Chart
Modern Organizational Chart Hierarchy Template for PowerPoint & Google Slides
Org Chart
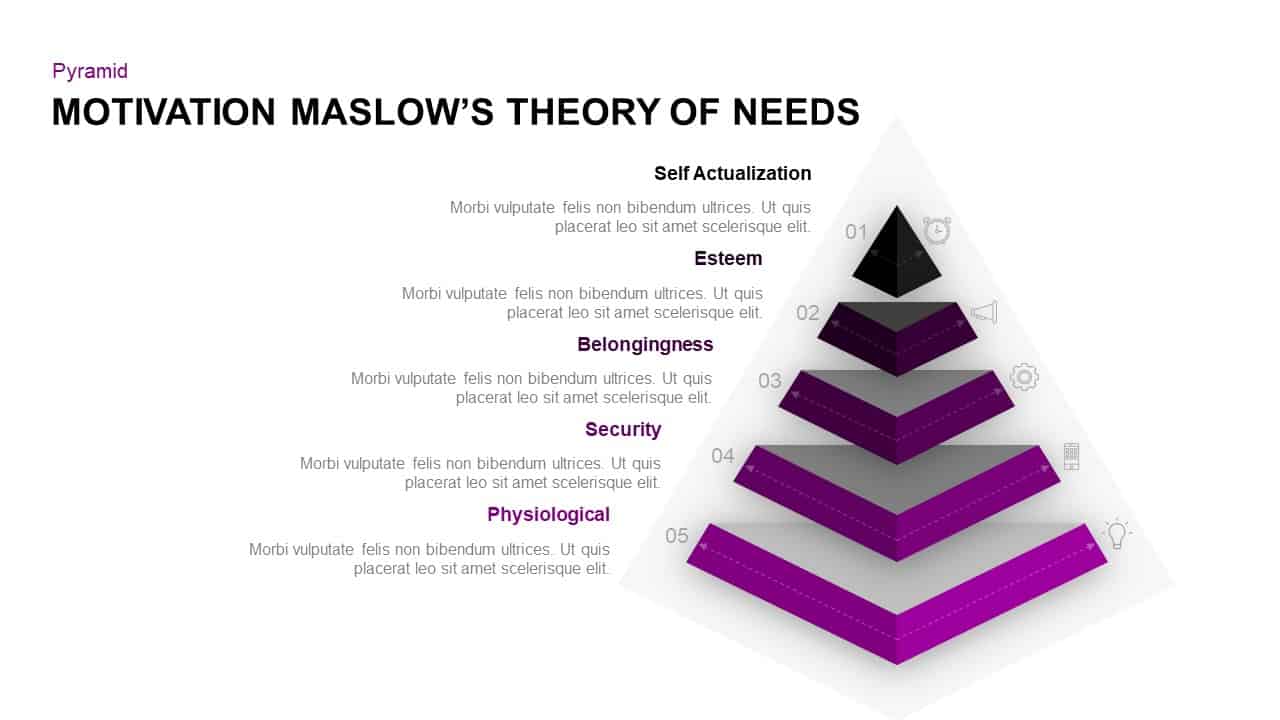
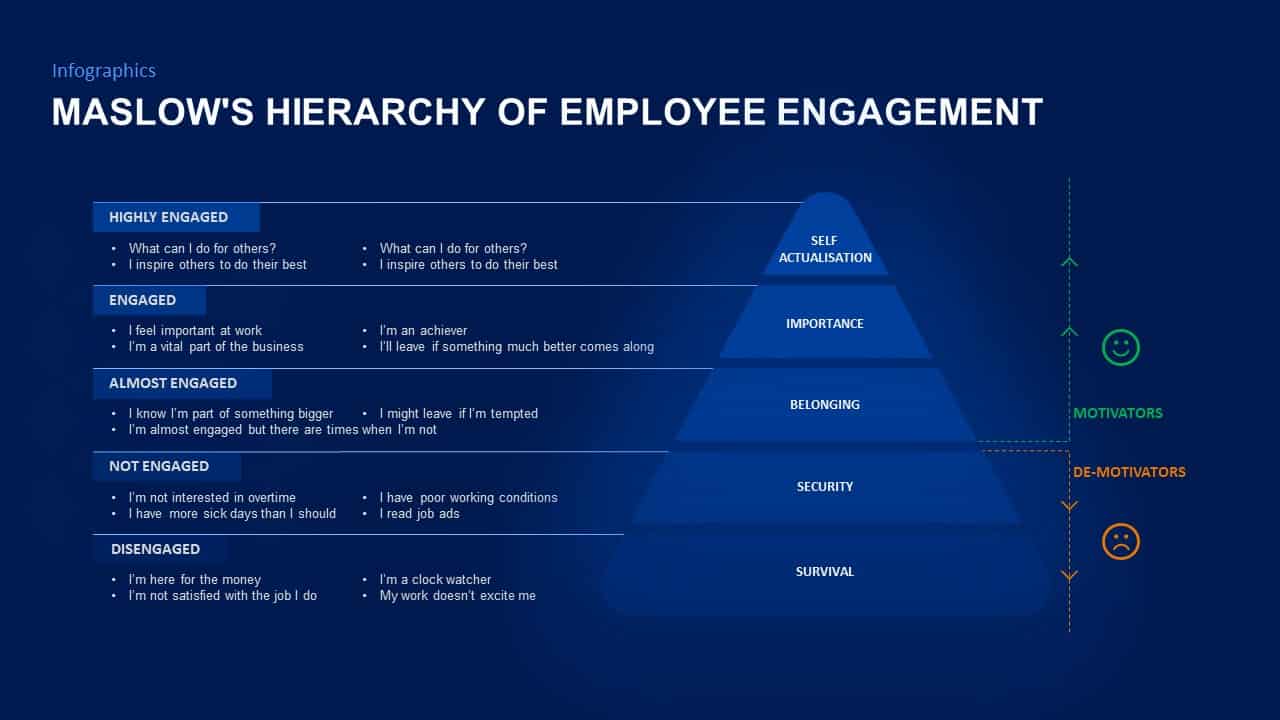
Maslow’s Employee Engagement Hierarchy Template for PowerPoint & Google Slides
Pyramid
Modern Organizational Hierarchy Diagram Template for PowerPoint & Google Slides
Org Chart
Risk Pyramid Hierarchy Analysis Template for PowerPoint & Google Slides
Pyramid
Free Corporate Hierarchy Organizational Chart Template for PowerPoint & Google Slides
Org Chart
Free
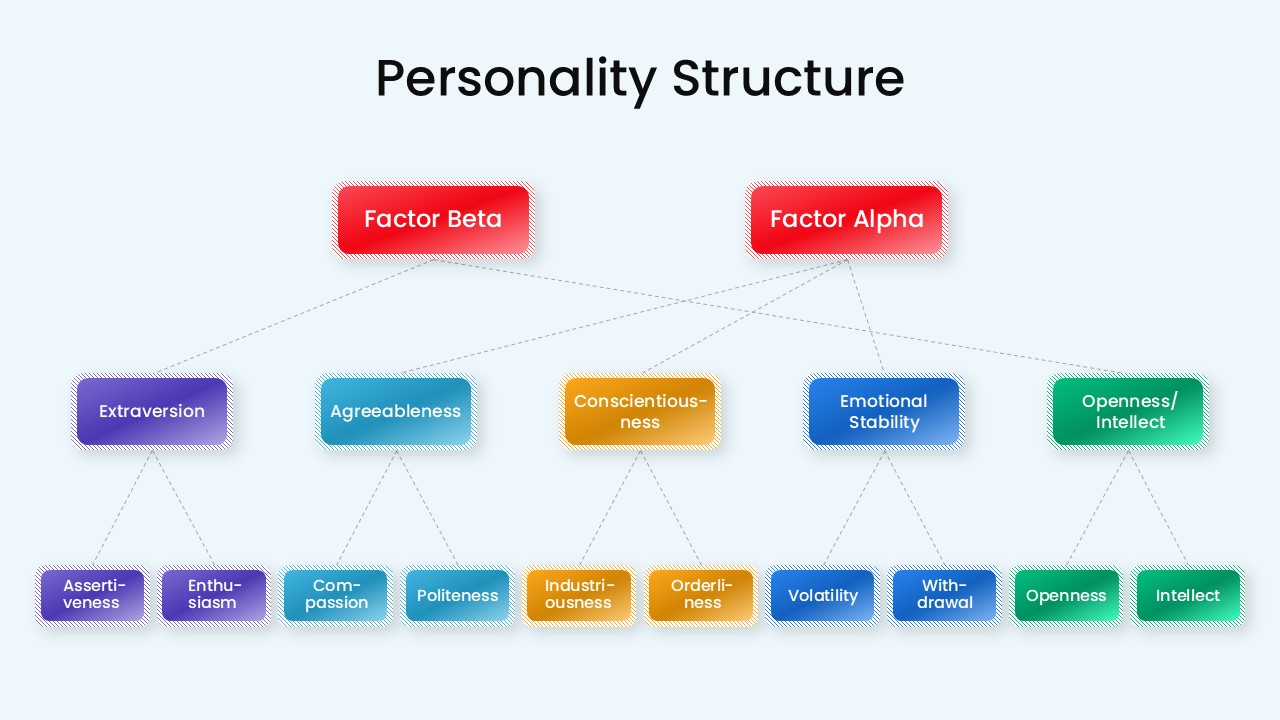
Personality Structure Hierarchy Diagram Template for PowerPoint & Google Slides
Org Chart
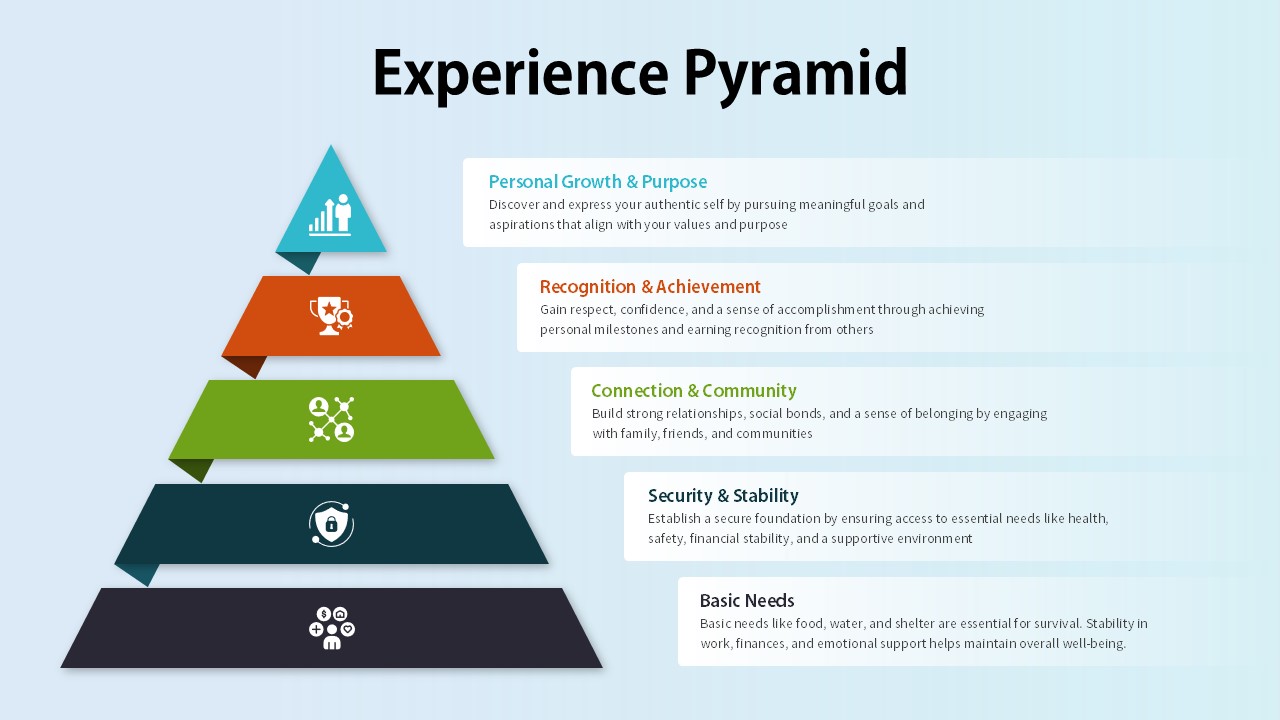
Experience Pyramid Hierarchy Diagram Template for PowerPoint & Google Slides
Pyramid
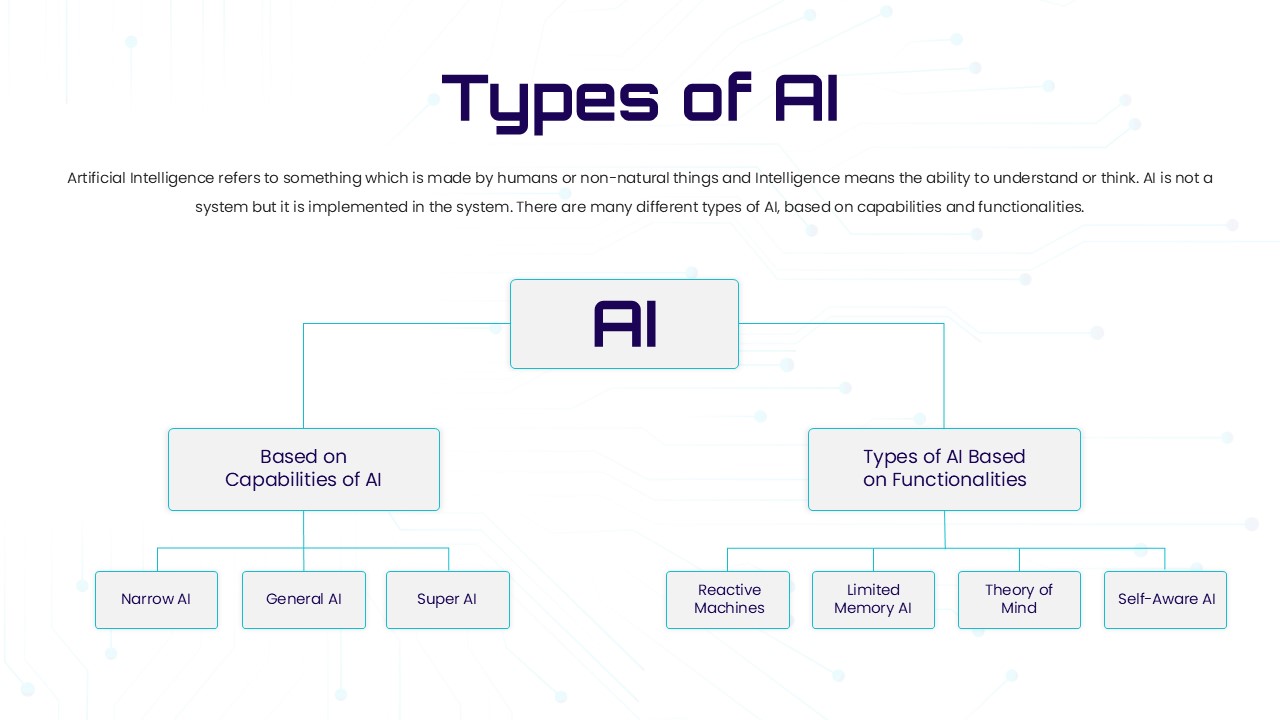
Types of AI Classification Hierarchy Template for PowerPoint & Google Slides
AI
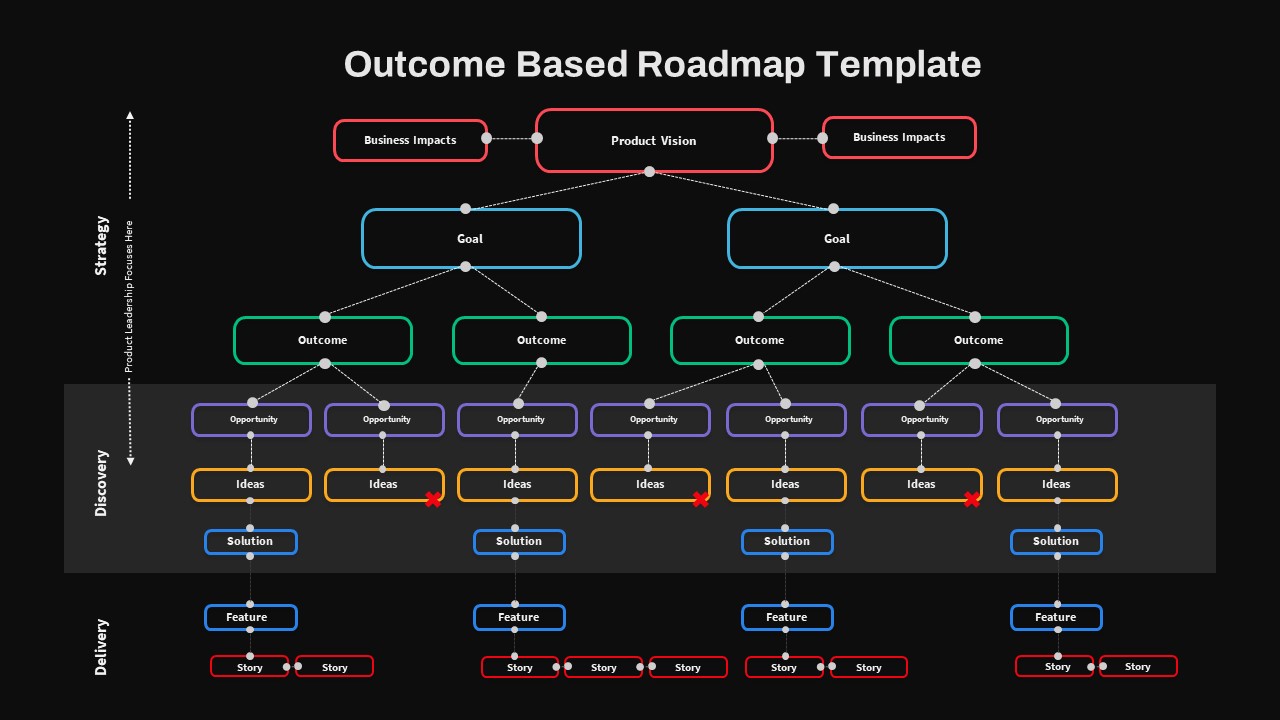
Outcome-Based Roadmap Hierarchy Template for PowerPoint & Google Slides
Roadmap
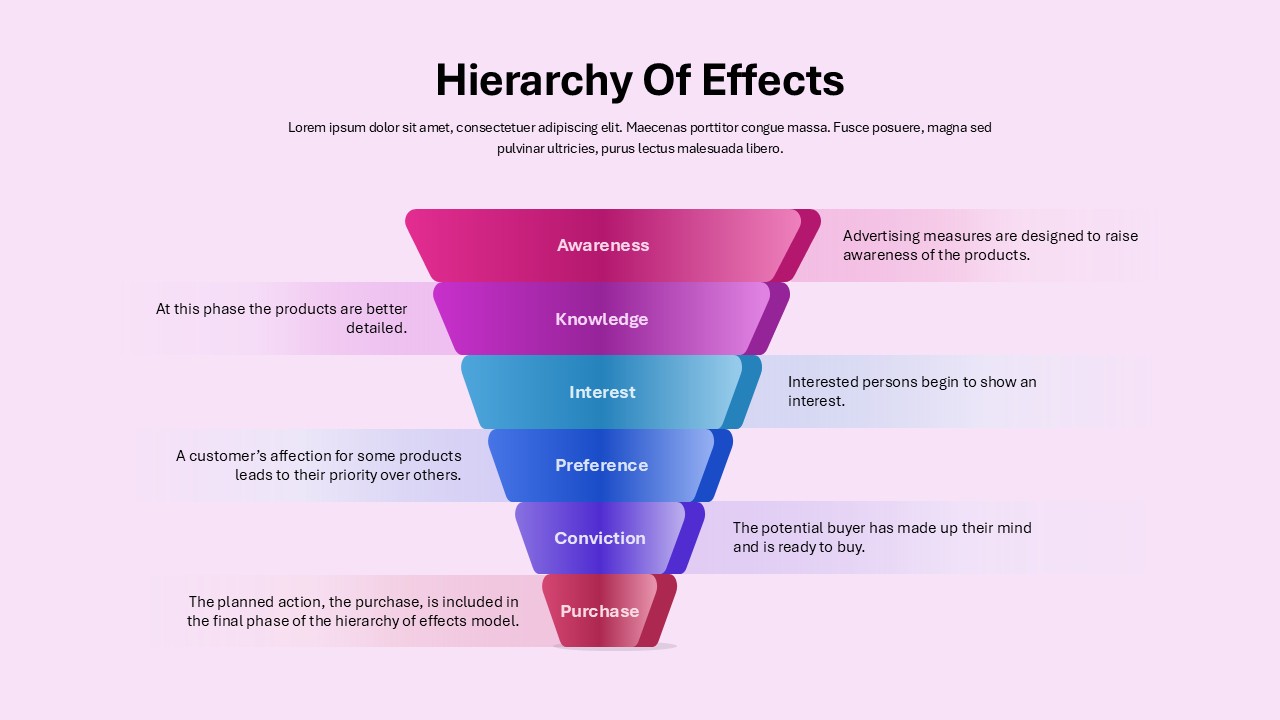
Marketing Funnel Hierarchy of Effects Template for PowerPoint & Google Slides
Marketing Funnel
Corporate Hierarchy Org Chart Template for PowerPoint & Google Slides
Org Chart
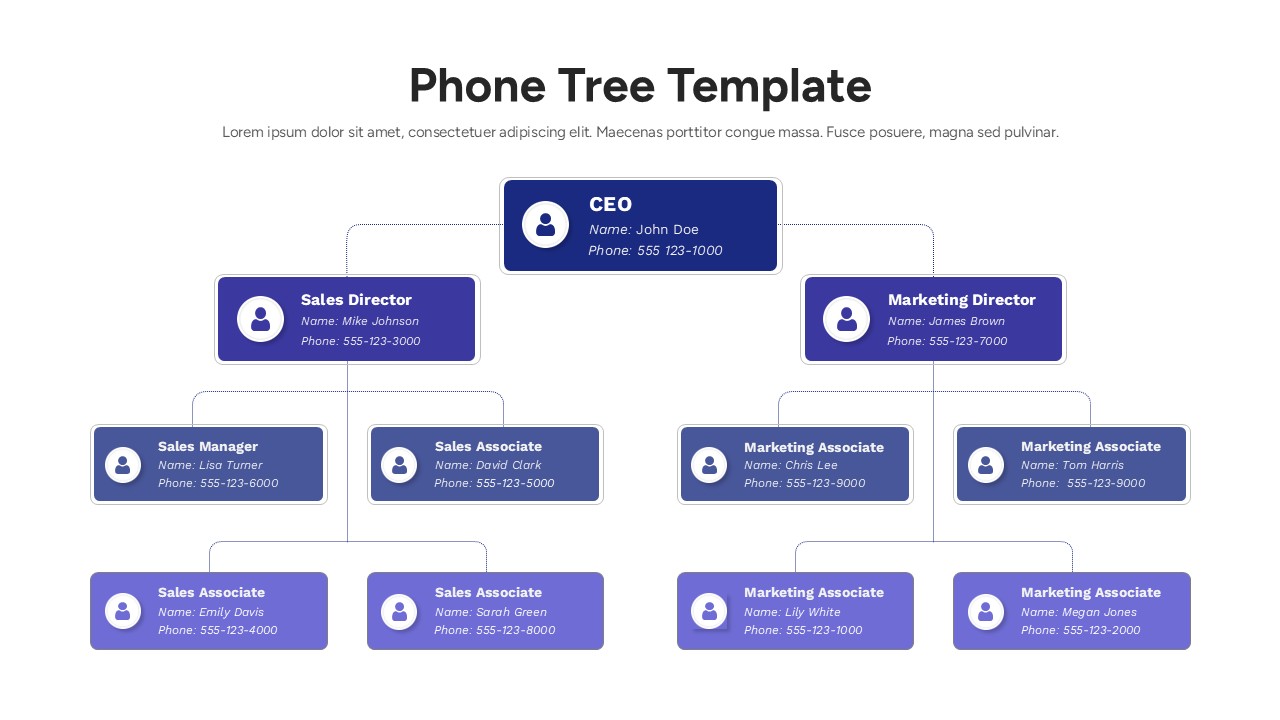
Corporate Phone Tree Hierarchy Template for PowerPoint & Google Slides
Org Chart
5 Level Hierarchy Pyramid Template for PowerPoint & Google Slides
Pyramid
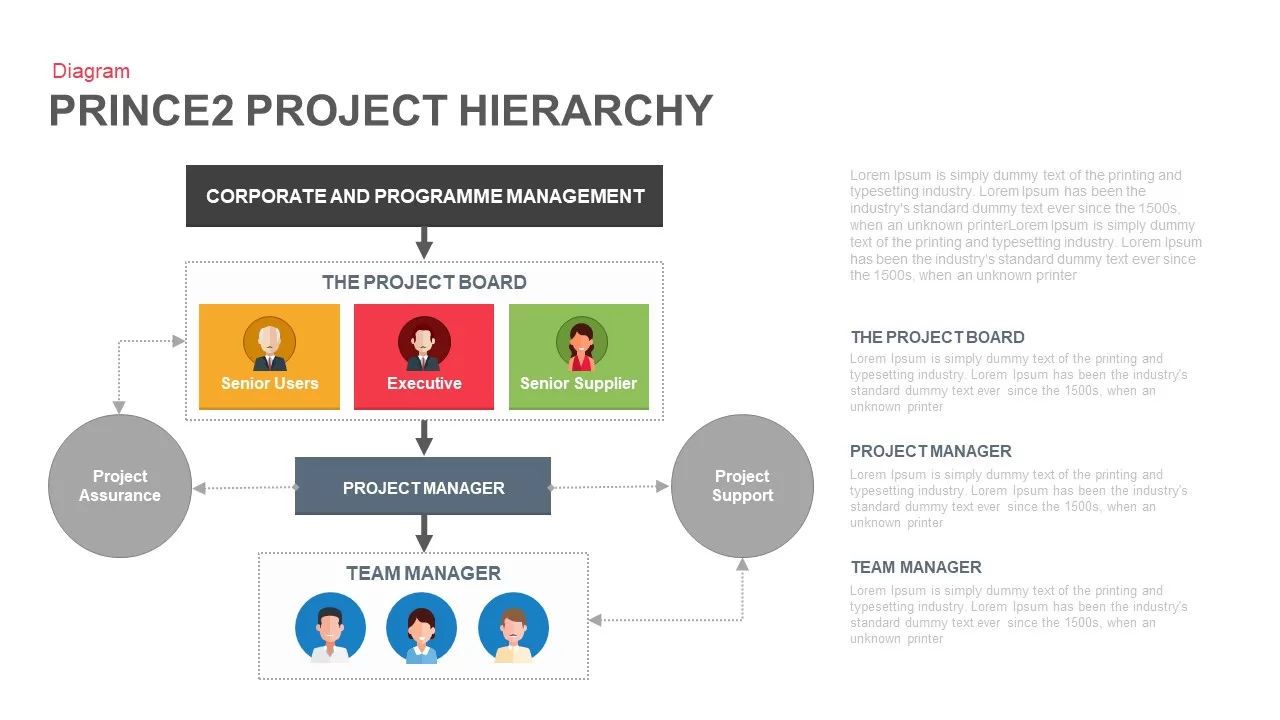
PRINCE2 Project Hierarchy Diagram for PowerPoint & Google Slides
Org Chart
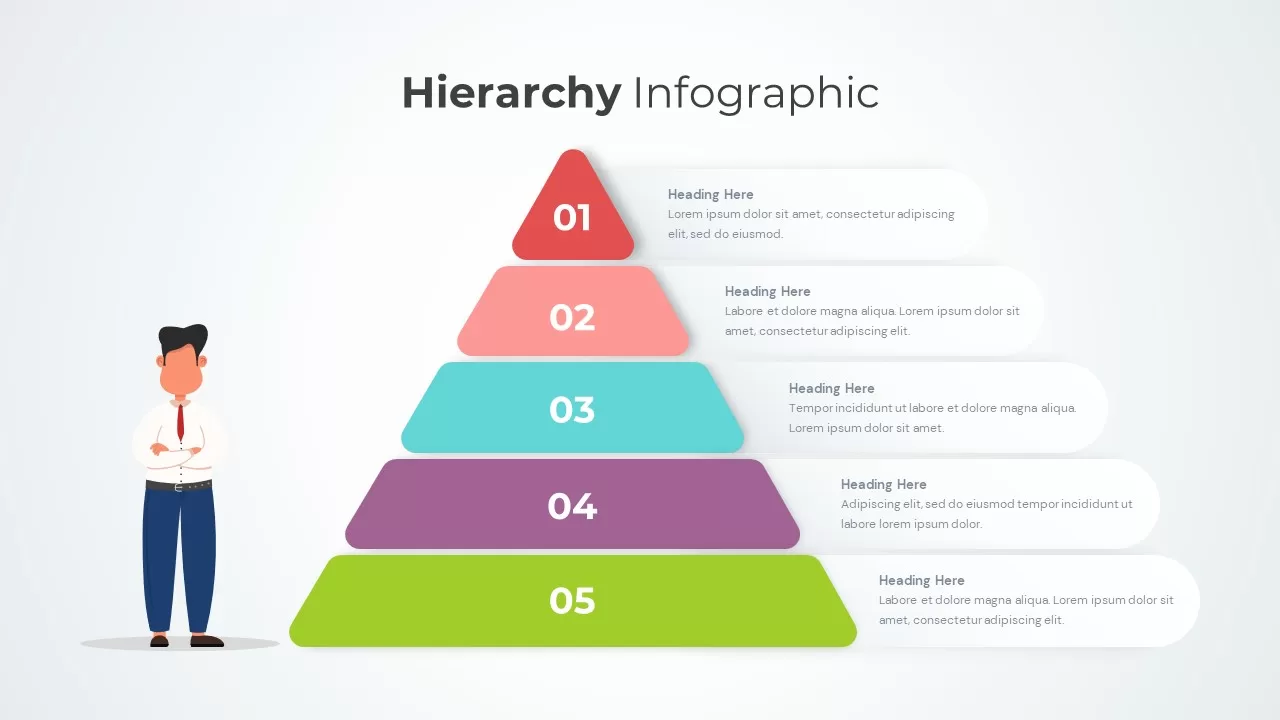
Hierarchy Infographic Design for PowerPoint & Google Slides
Business

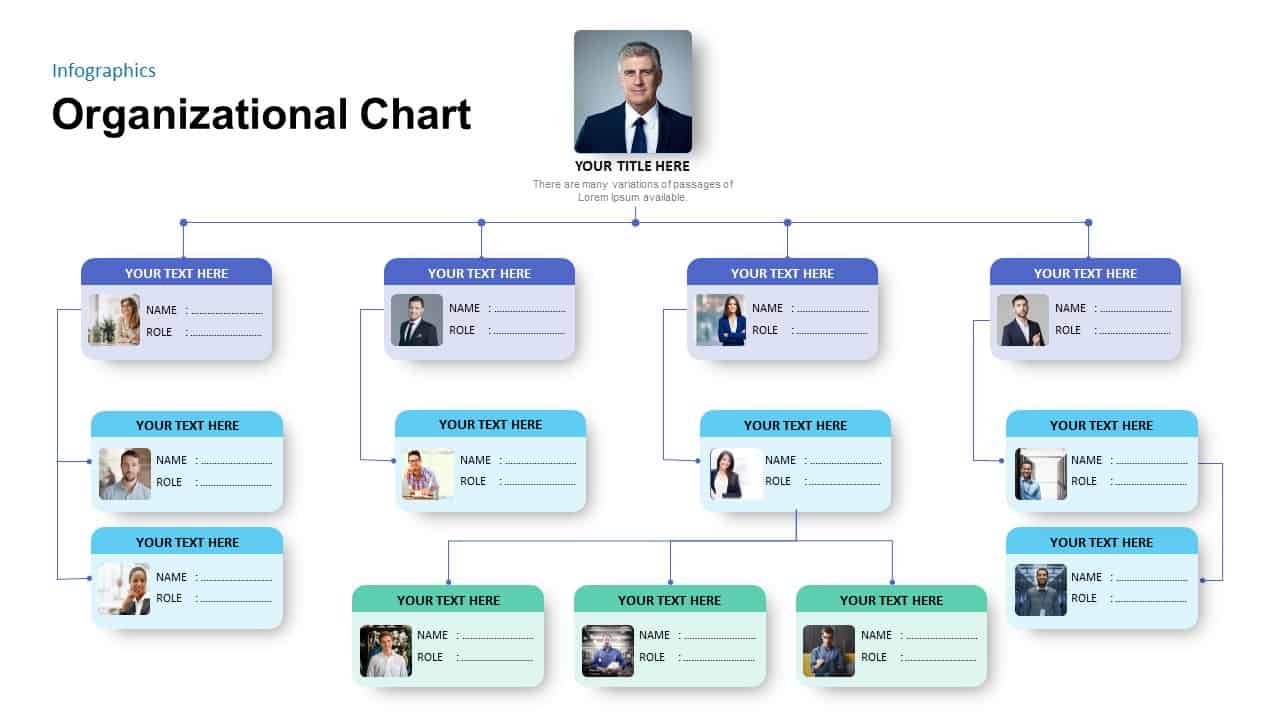
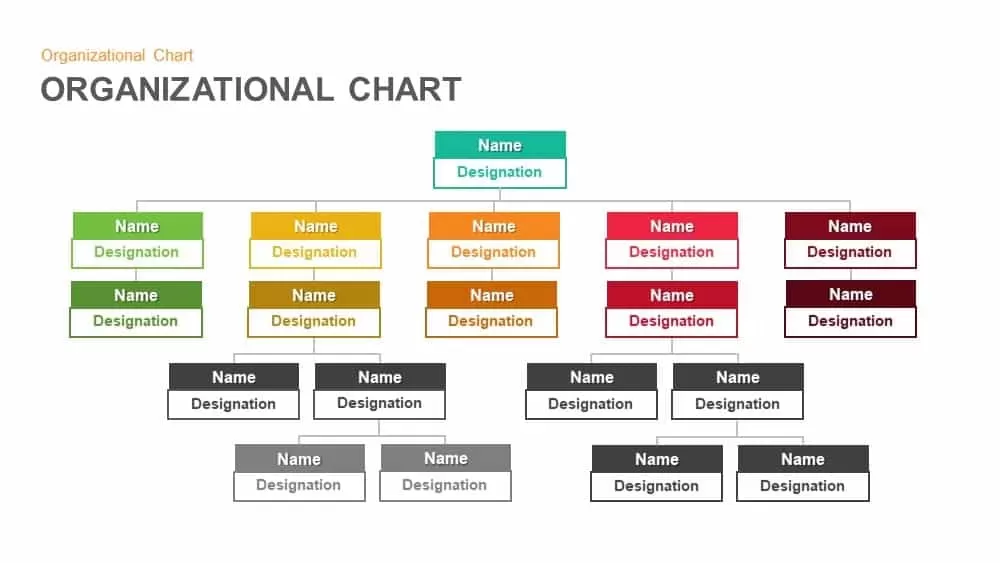
Organizational Chart Hierarchy Templates for PowerPoint and Keynote
Org Chart