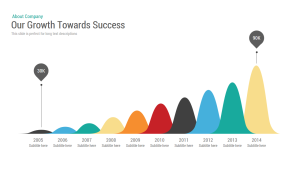
Growth Timeline template for PowerPoint & Google Slides


Description
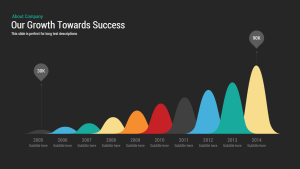
This Growth Timeline template leverages a series of overlapping, colored area peaks to represent annual performance from 2005 to 2014. Each peak rises progressively, culminating in a prominent 90K marker for the final year, and features a pinpoint callout for key milestones such as 30K and 90K. The design includes a customizable title and subtitle area at the top for context setting, plus a horizontal axis with year labels and subtitle placeholders.
Built on master slides, every element is fully editable in PowerPoint and Google Slides. Adjust peak shapes, recolor theme accents, swap callout markers, and update fonts globally via theme controls. Vector assets ensure crisp visuals on HD projectors, retina displays, and virtual meeting platforms. The layout supports both 16:9 widescreen and 4:3 aspect ratios, maintaining alignment and visual hierarchy without manual tweaking. Hidden variation slides offer alternate color palettes, subplot arrangements, and optional data grids for deeper analysis. Drag-and-drop placeholders simplify data updates, while entrance animations and morph transitions help guide audience focus from early-stage growth to peak success. Subtle drop shadows beneath the area peaks add depth, and free web fonts guarantee typographic consistency across devices.
Who is it for
Business analysts, financial planners, marketing managers, and product teams who need to showcase multi-year growth trends or performance benchmarks. Consultants and educators can also use this slide to illustrate historical data patterns and strategic progress in stakeholder presentations.
Other Uses
Repurpose this template for sales revenue reports, website traffic analyses, resource allocation over time, population growth studies, or any time-based KPI tracking. Swap area peaks for line or bar charts to create alternate timeline visualizations with minimal effort.
Login to download this file

Item ID
SB00039
Related Templates

Growth Arrow for Progress & Growth template for PowerPoint & Google Slides
Arrow

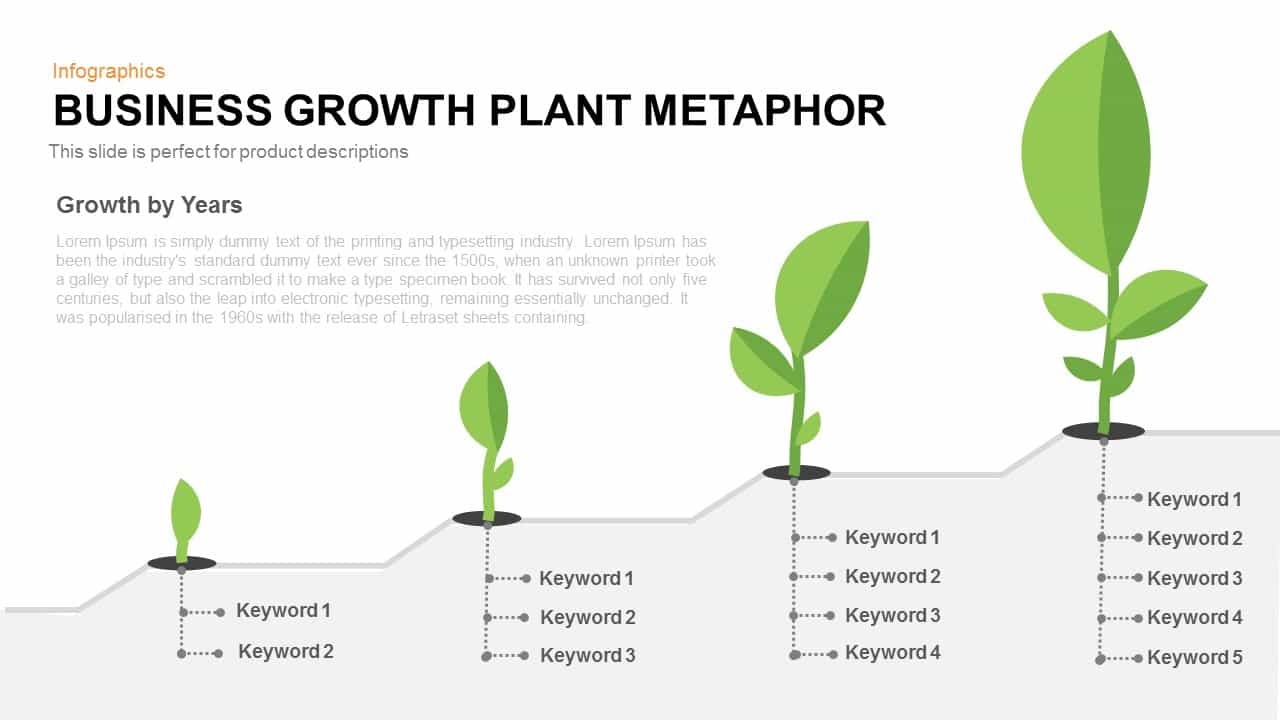
Business Growth Plant Metaphor Timeline Template for PowerPoint & Google Slides
Business Strategy
Five-Step Growth Timeline Infographic Template for PowerPoint & Google Slides
Timeline
5-Stage Financial Growth Timeline Template for PowerPoint & Google Slides
Timeline
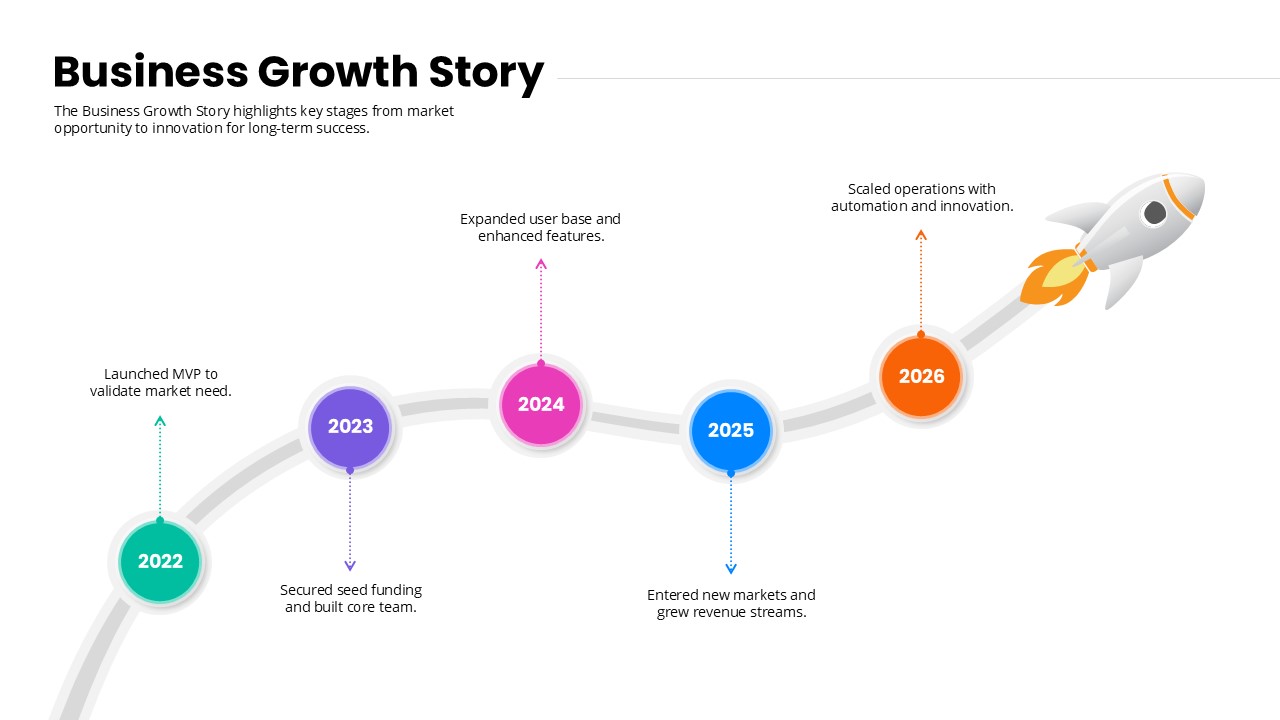
Business Growth Story timeline template for PowerPoint & Google Slides
Timeline
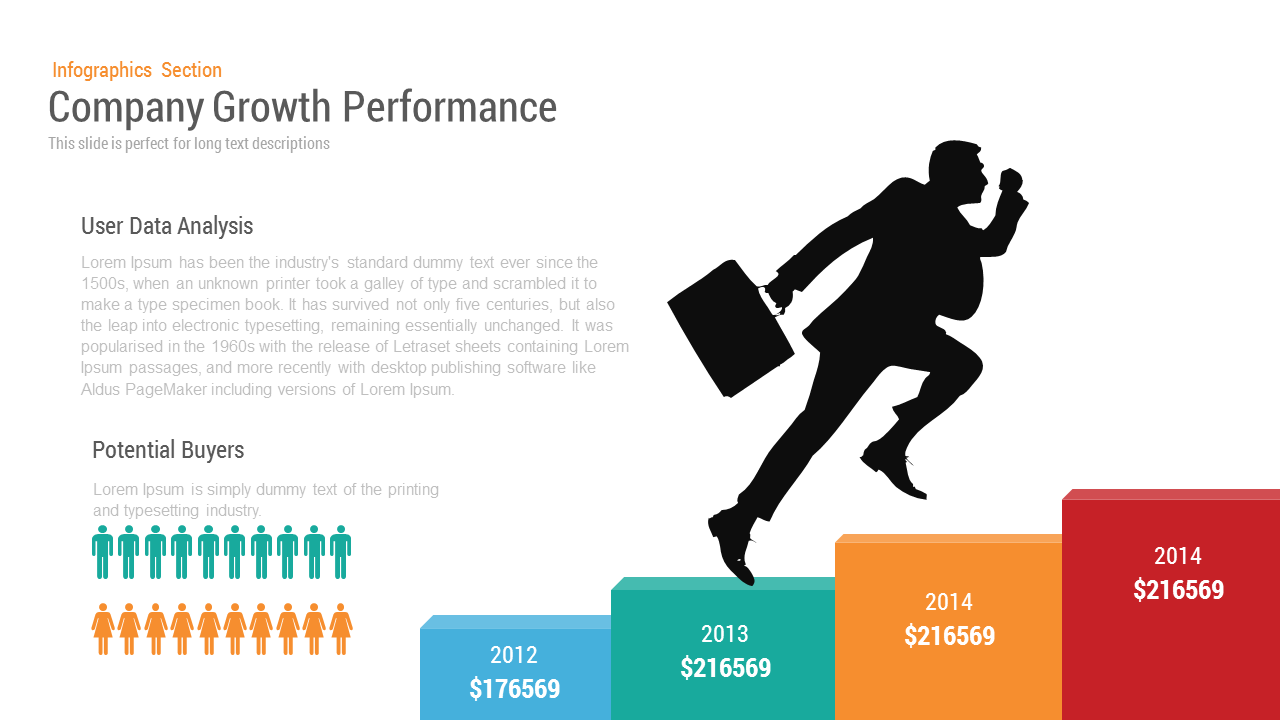
Company Growth template for PowerPoint & Google Slides
Charts
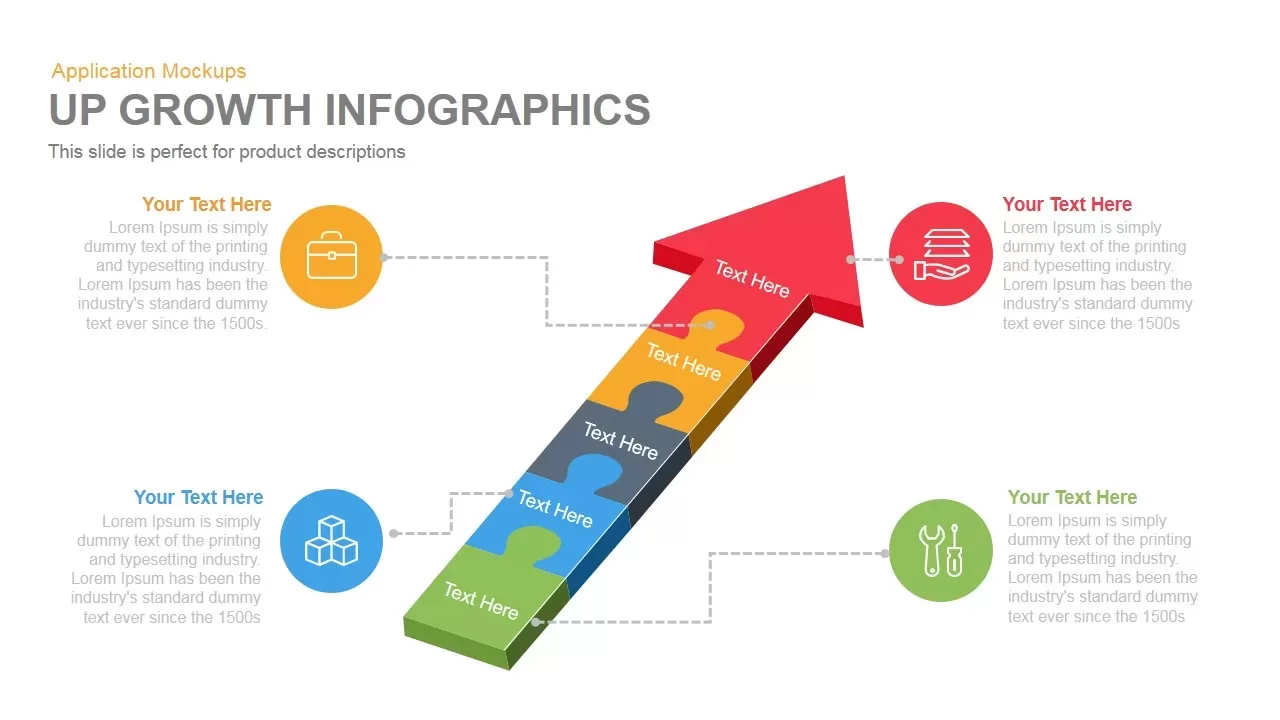
Growth Infographics template for PowerPoint & Google Slides
Arrow
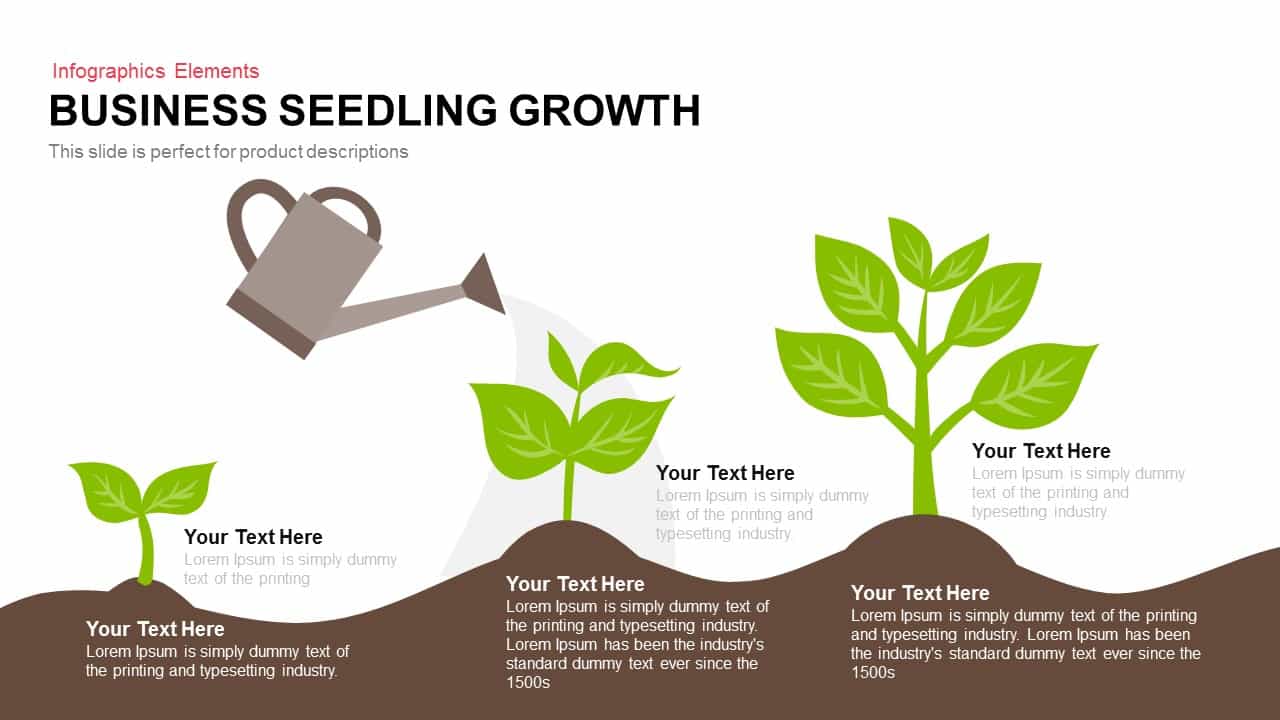
Business Seedling Growth Template for PowerPoint & Google Slides
Infographics
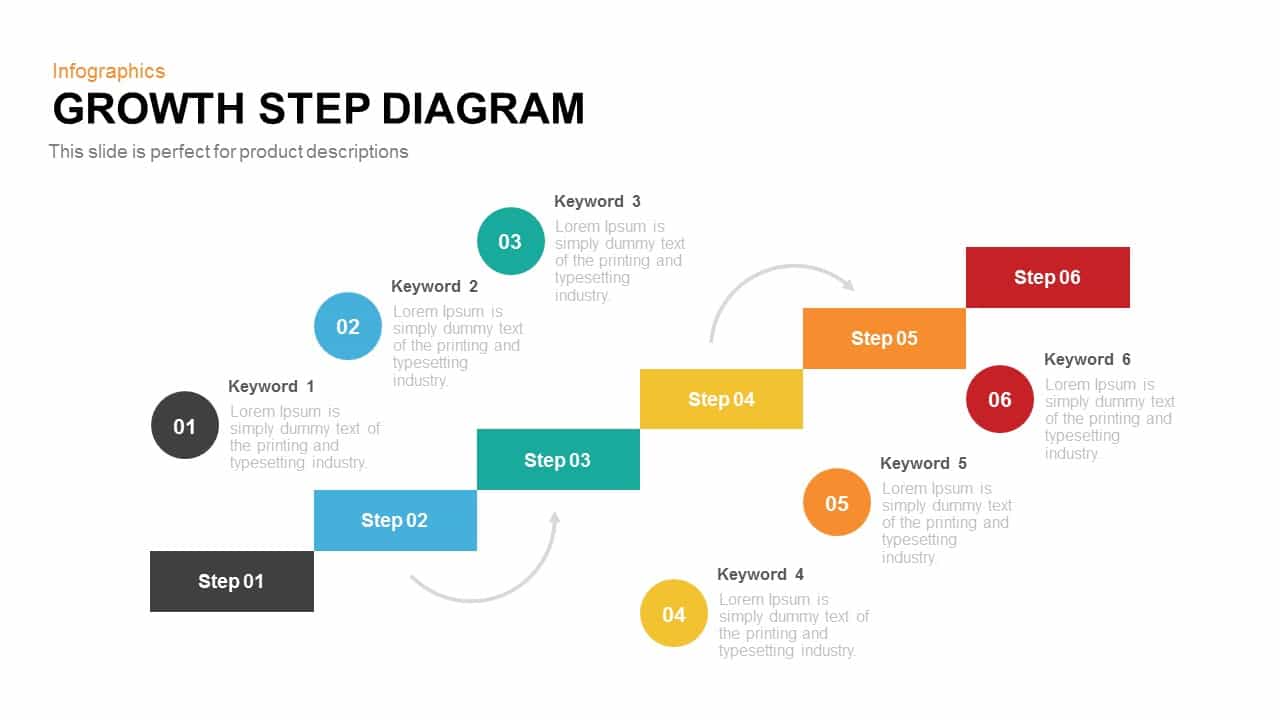
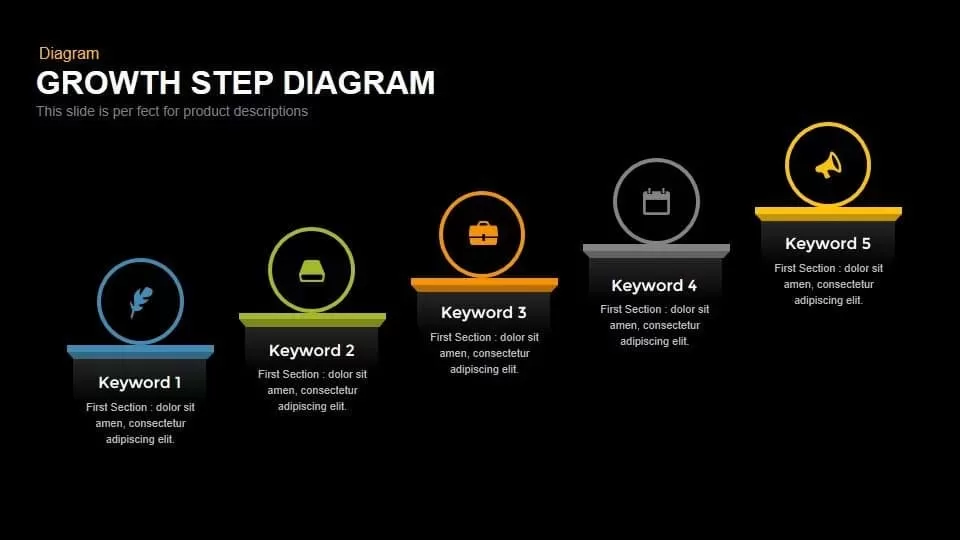
Growth Step Diagram template for PowerPoint & Google Slides
Infographics
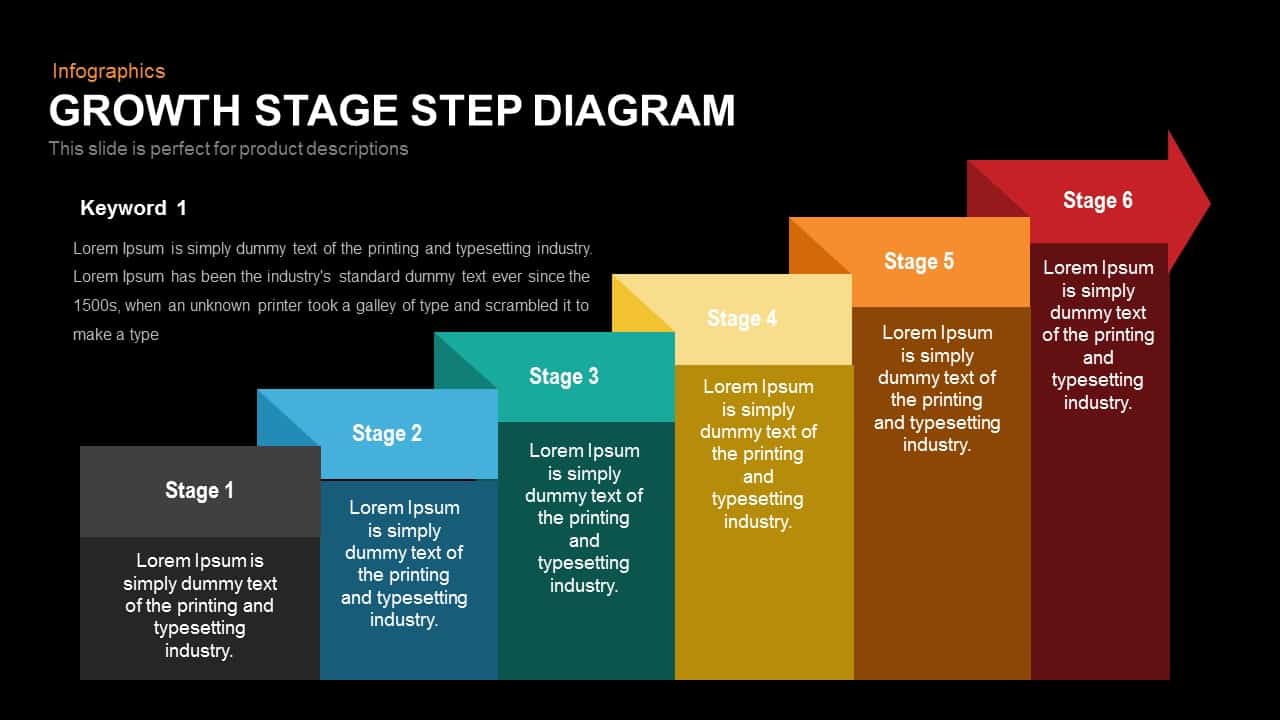
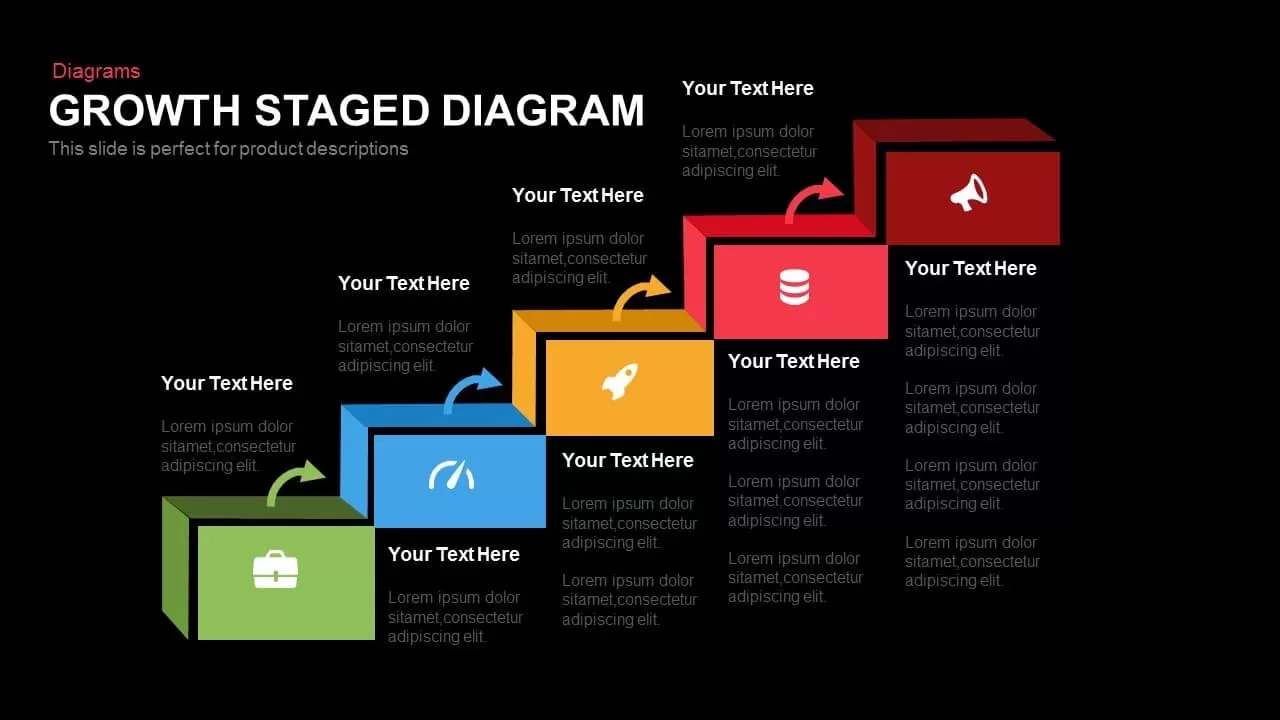
Growth Stage Diagram template for PowerPoint & Google Slides
Process
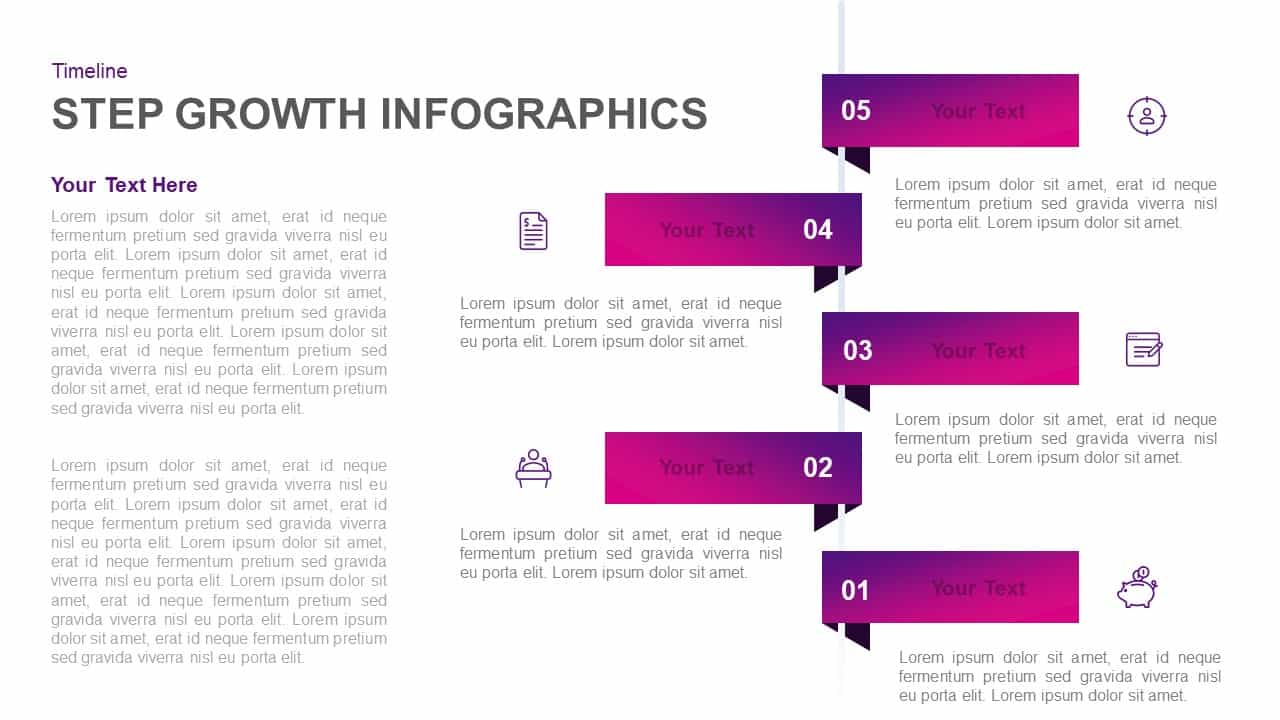
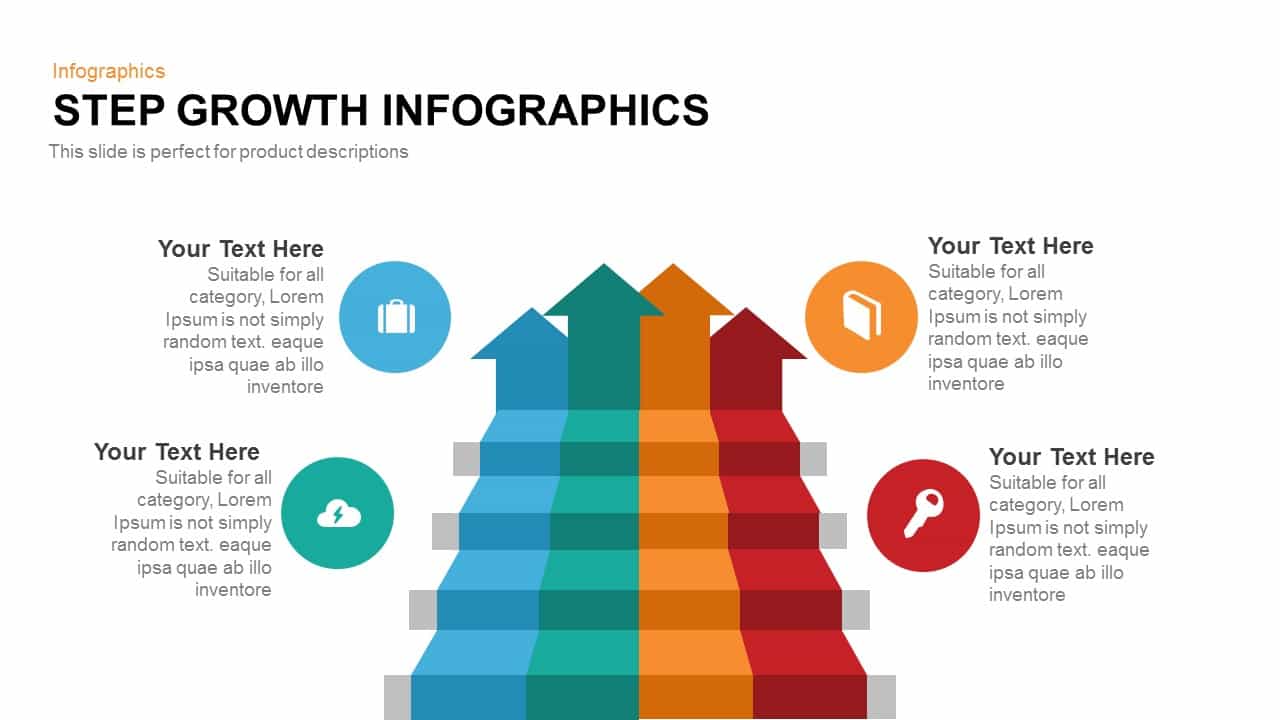
Modern Step Growth Infographics Template for PowerPoint & Google Slides
Process
Five 3D Growth Arrow Infographic Slide Template for PowerPoint & Google Slides
Arrow
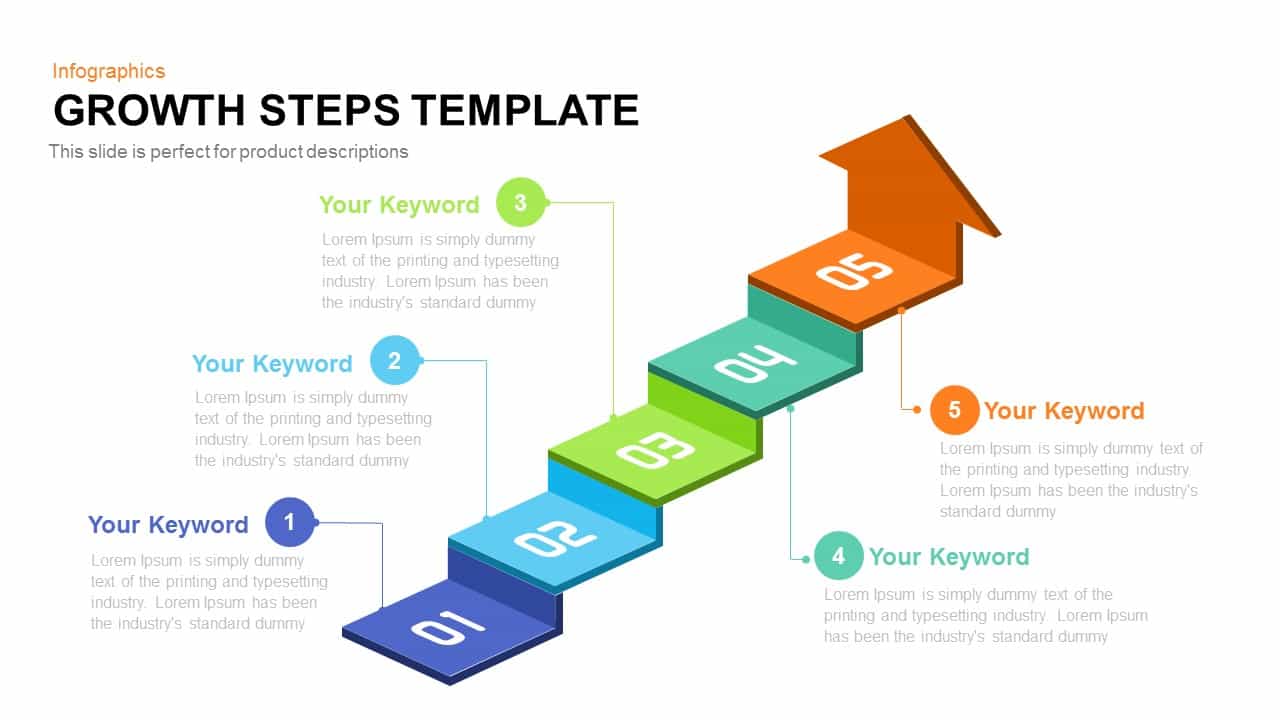
5-Step Growth Staircase Infographic Template for PowerPoint & Google Slides
Process
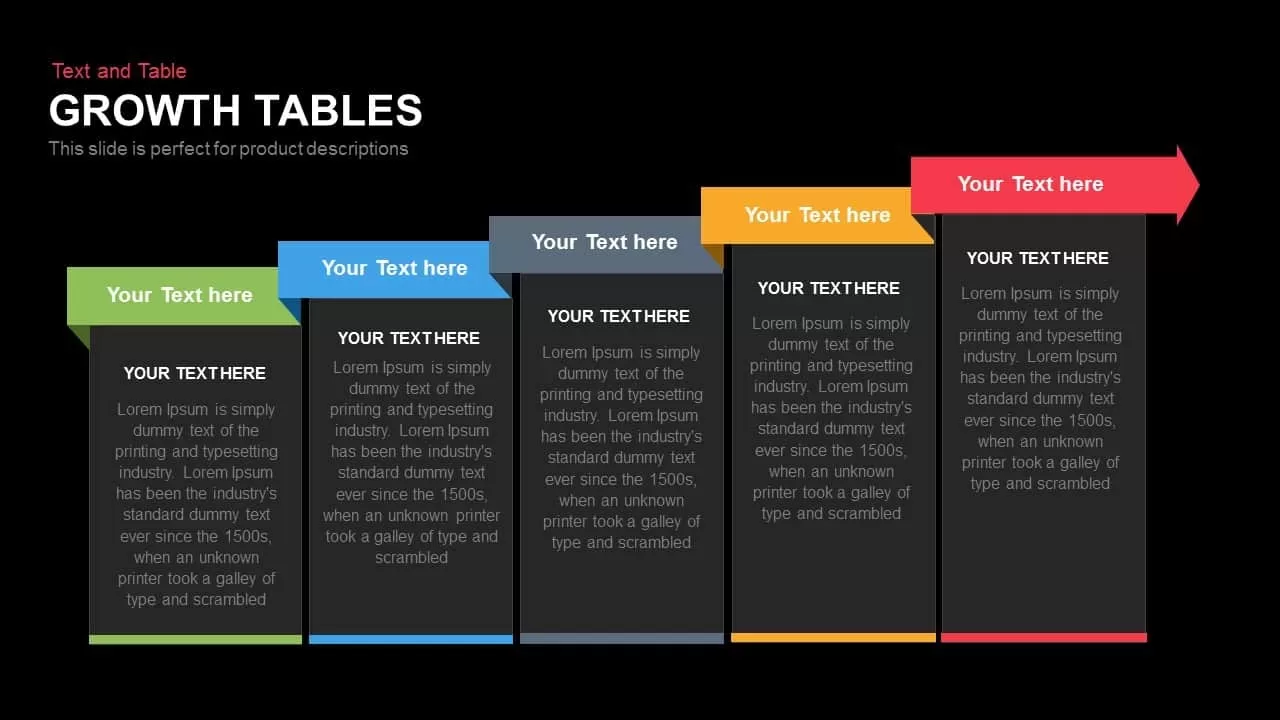
Growth Tables Slide template for PowerPoint & Google Slides
Process

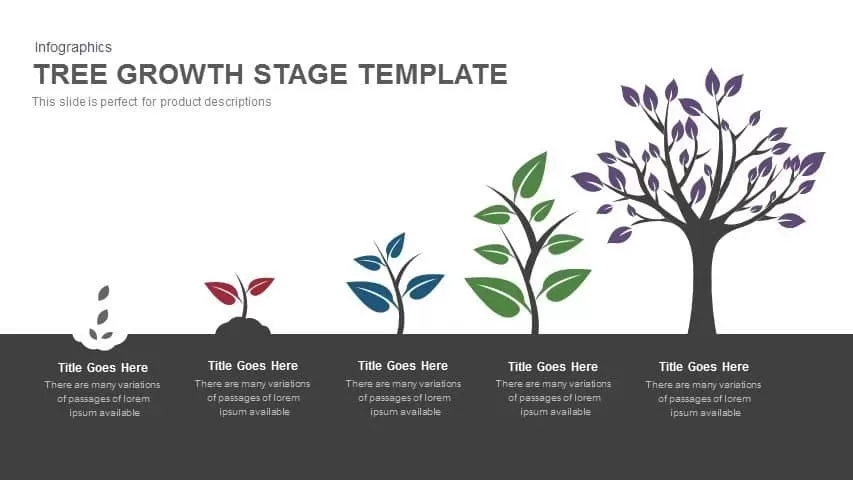
Tree Growth Stage Infographic Template for PowerPoint & Google Slides
Timeline
Five-Step Growth Stage Staircase Diagram Template for PowerPoint & Google Slides
Process

Modern Five-Step Growth Diagram Template for PowerPoint & Google Slides
Process
Improvement Growth Arrow Metaphor Template for PowerPoint & Google Slides
Bar/Column
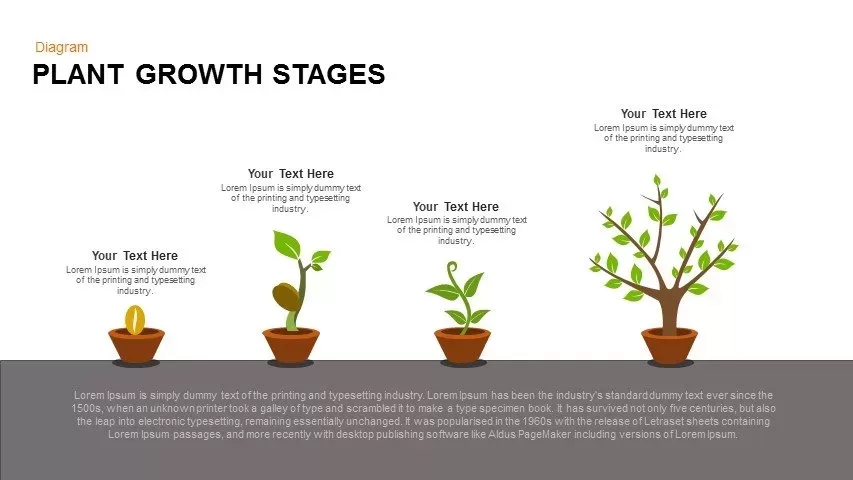
Editable Plant Growth Stages Diagram Template for PowerPoint & Google Slides
Process
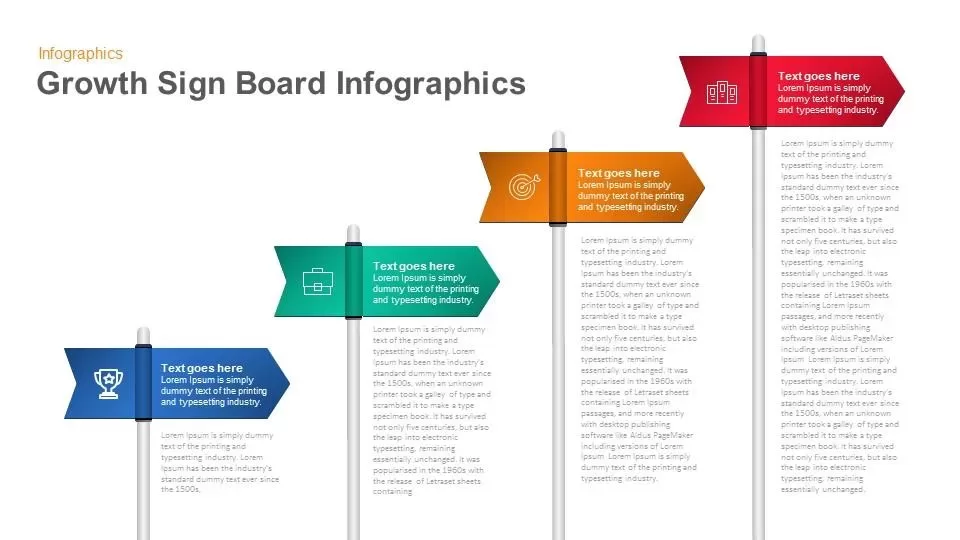
Growth Sign Board Infographics template for PowerPoint & Google Slides
Timeline
Five-Stage Growth Arrow Infographic Template for PowerPoint & Google Slides
Arrow
Ansoff Matrix Growth Strategy Model Template for PowerPoint & Google Slides
BCG
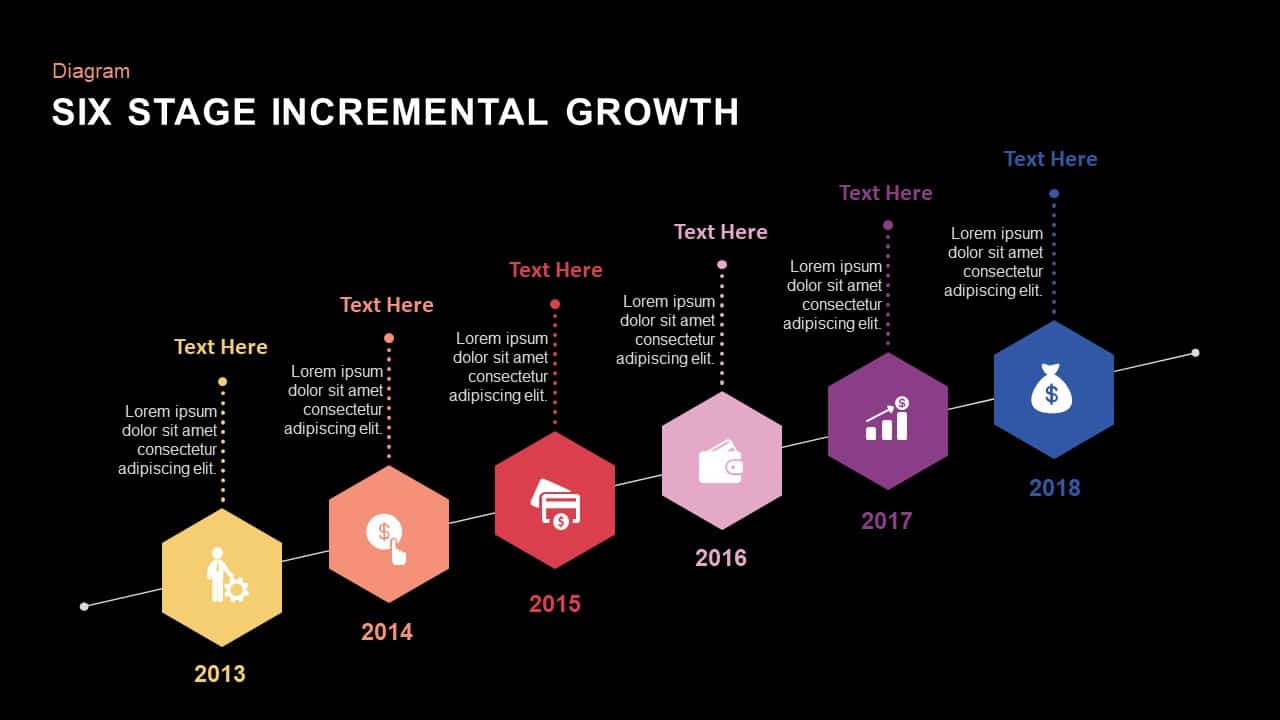
Six Stage Incremental Growth template for PowerPoint & Google Slides
Timeline
4 Step Revenue Growth Flow Diagram Template for PowerPoint & Google Slides
Process
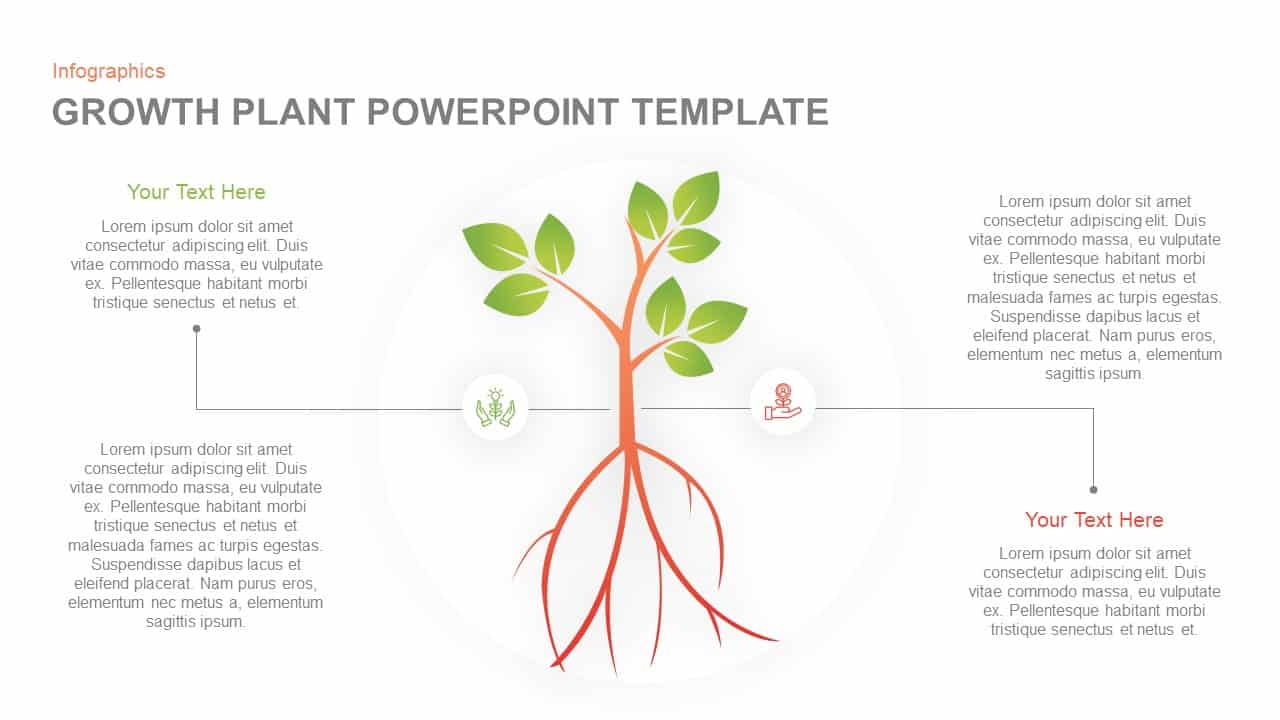
Growth Plant Infographics template for PowerPoint & Google Slides
Process
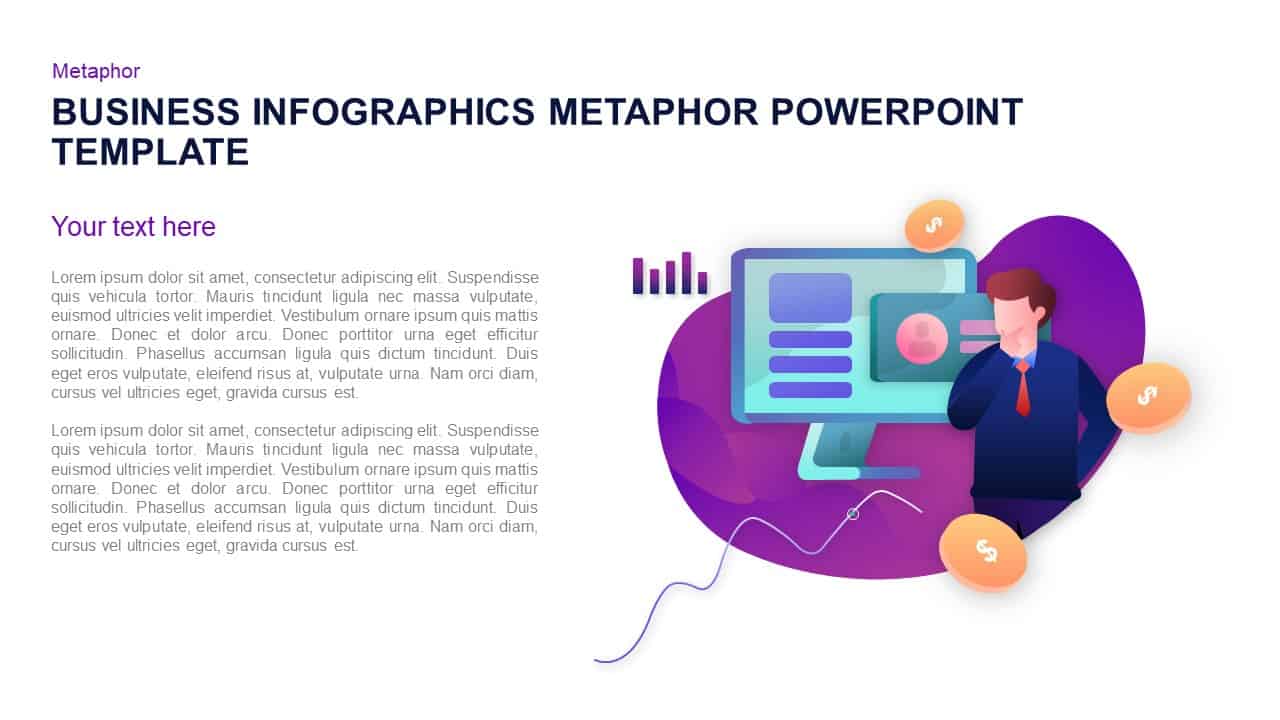
Business Growth Infographic Metaphor Template for PowerPoint & Google Slides
Revenue
Dynamic Growth Arrow Step Infographic Template for PowerPoint & Google Slides
Process
Plant Growth Lifecycle Infographic Template for PowerPoint & Google Slides
Process
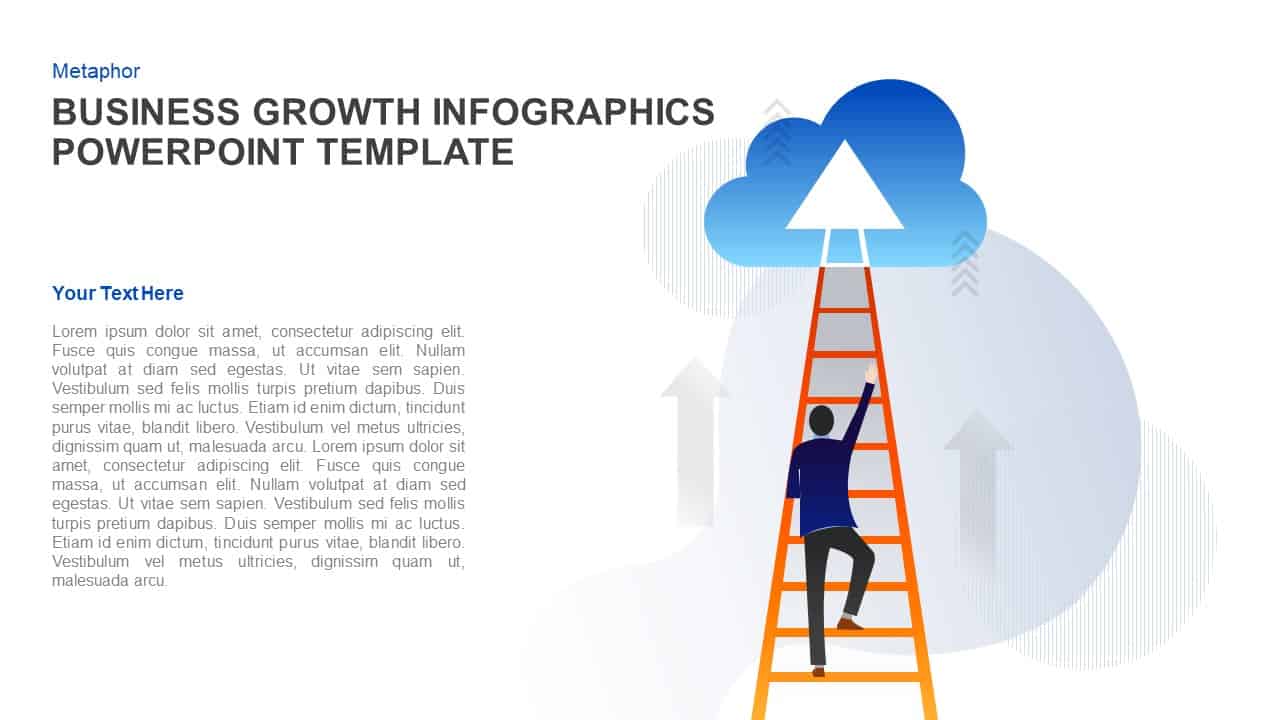
Business Growth Ladder to Cloud Metaphor Template for PowerPoint & Google Slides
Vision and Mission
Business Growth Infographics Template for PowerPoint & Google Slides
Roadmap
Five-Step Growth Infographic Slide Template for PowerPoint & Google Slides
Process
4-Step Growth & Success Infographics Template for PowerPoint & Google Slides
Accomplishment
5-Step Growth Arrow Infographics Template for PowerPoint & Google Slides
Arrow
Greiner Growth Model Six-Phase Diagram Template for PowerPoint & Google Slides
Business Models
Sales Growth Dashboard: KPI Gauge & Line Template for PowerPoint & Google Slides
Revenue
Finance Growth Plant Metaphor Slide Template for PowerPoint & Google Slides
Finance

Ansoff Growth Matrix Strategy Diagram Template for PowerPoint & Google Slides
Business Strategy
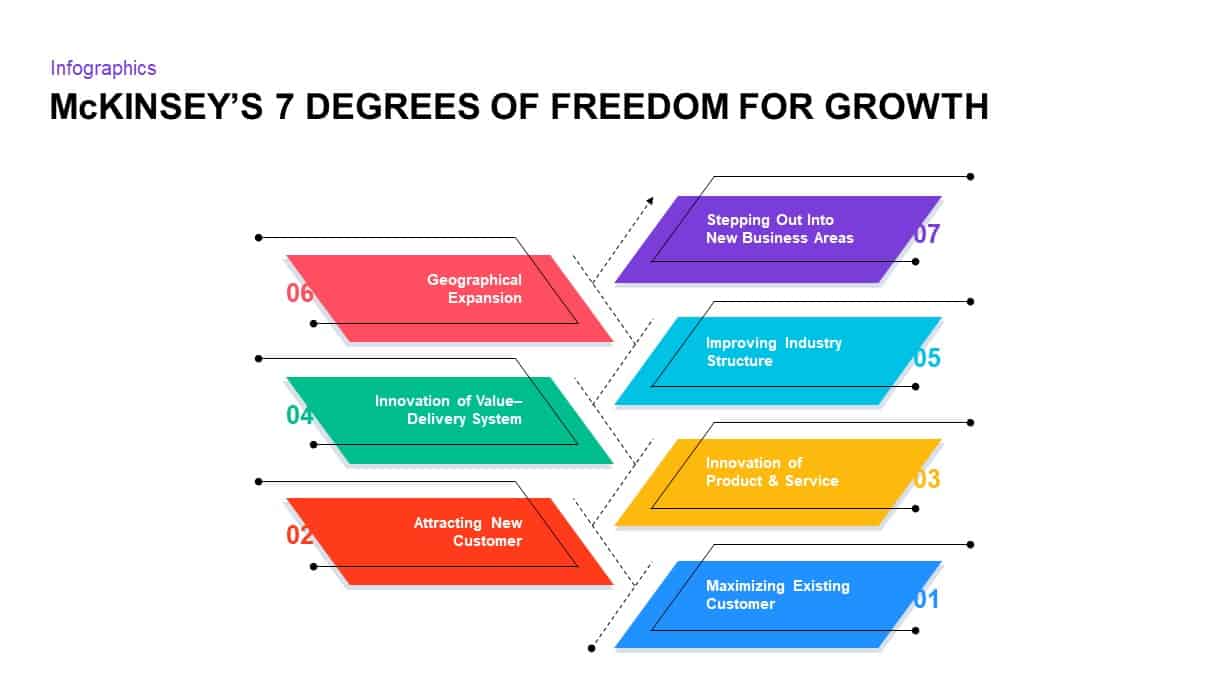
McKinsey’s 7 Degrees of Freedom Growth Template for PowerPoint & Google Slides
Process
Greiner’s Growth Model Curve template for PowerPoint & Google Slides
Infographics
Business Growth Plant Infographics Pack Template for PowerPoint & Google Slides
Process
Business Growth Metaphor Chart Template for PowerPoint & Google Slides
Business
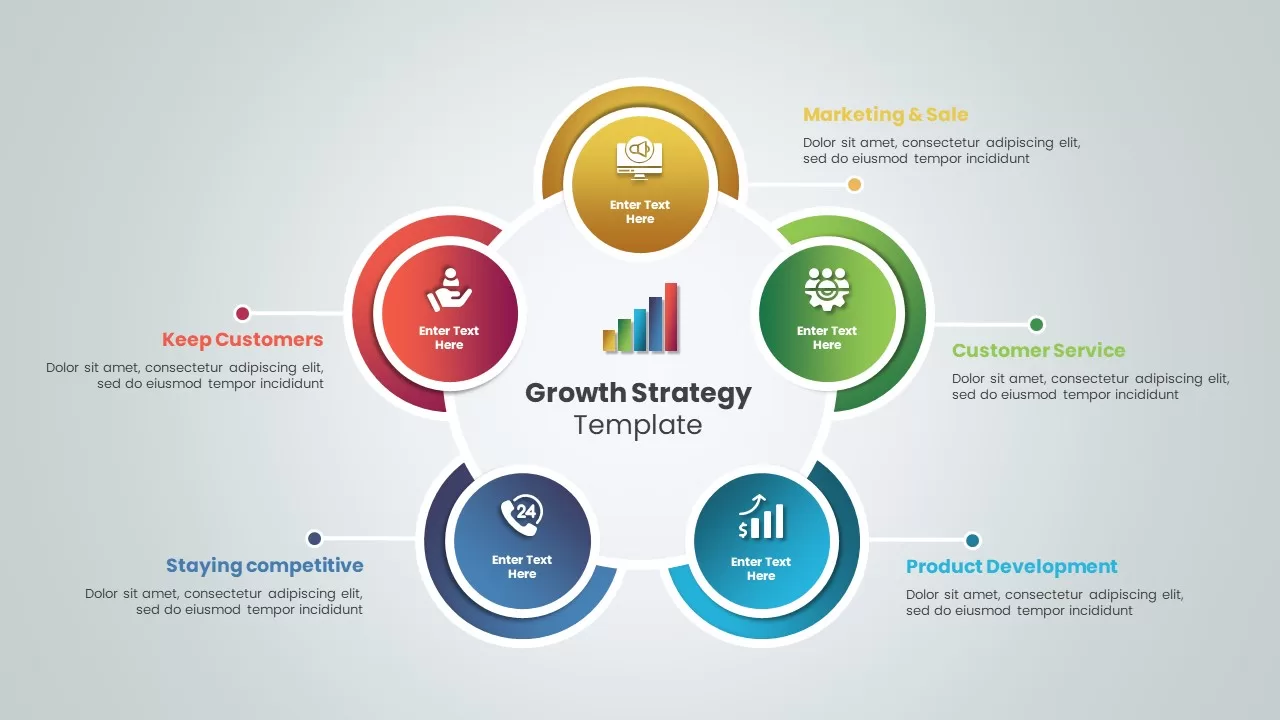
Growth Strategy Circular Diagram Template for PowerPoint & Google Slides
Circular
Data-driven GDP Growth Infographic Pack Template for PowerPoint & Google Slides
Infographics
3D Curved Arrow Growth Process Slide Template for PowerPoint & Google Slides
Process
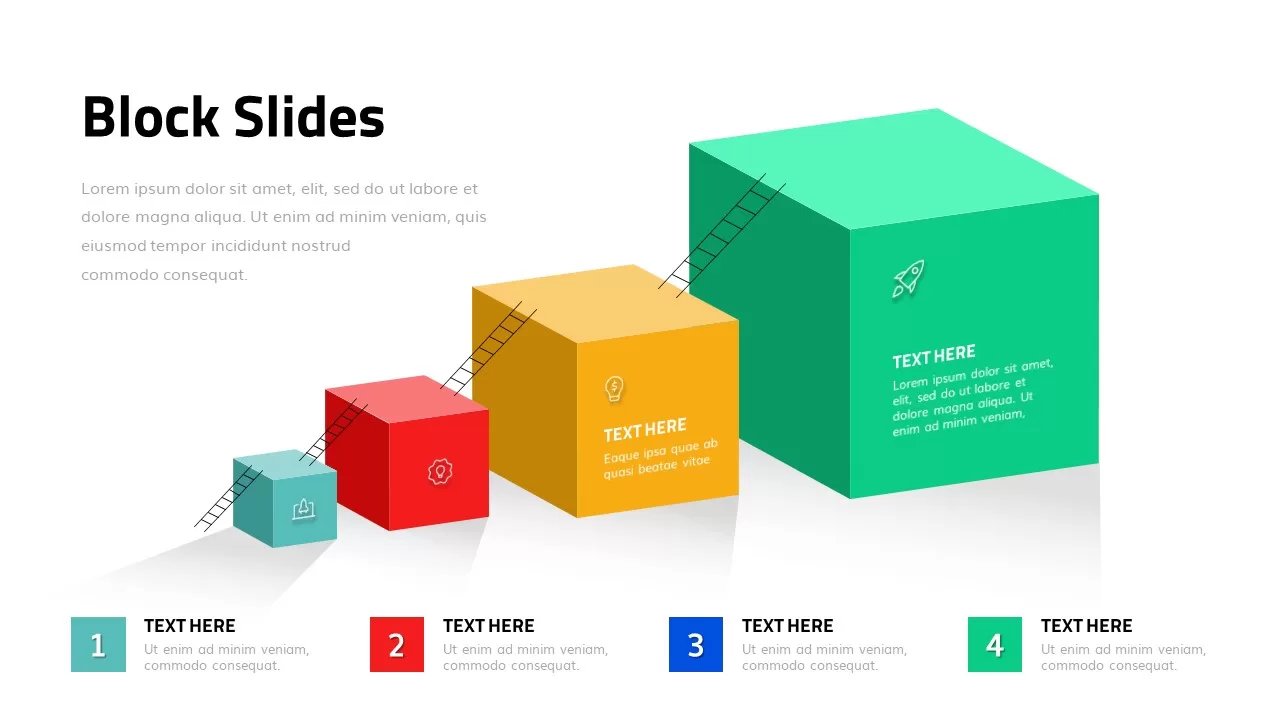
3D Growth Blocks Template for PowerPoint & Google Slides
Process
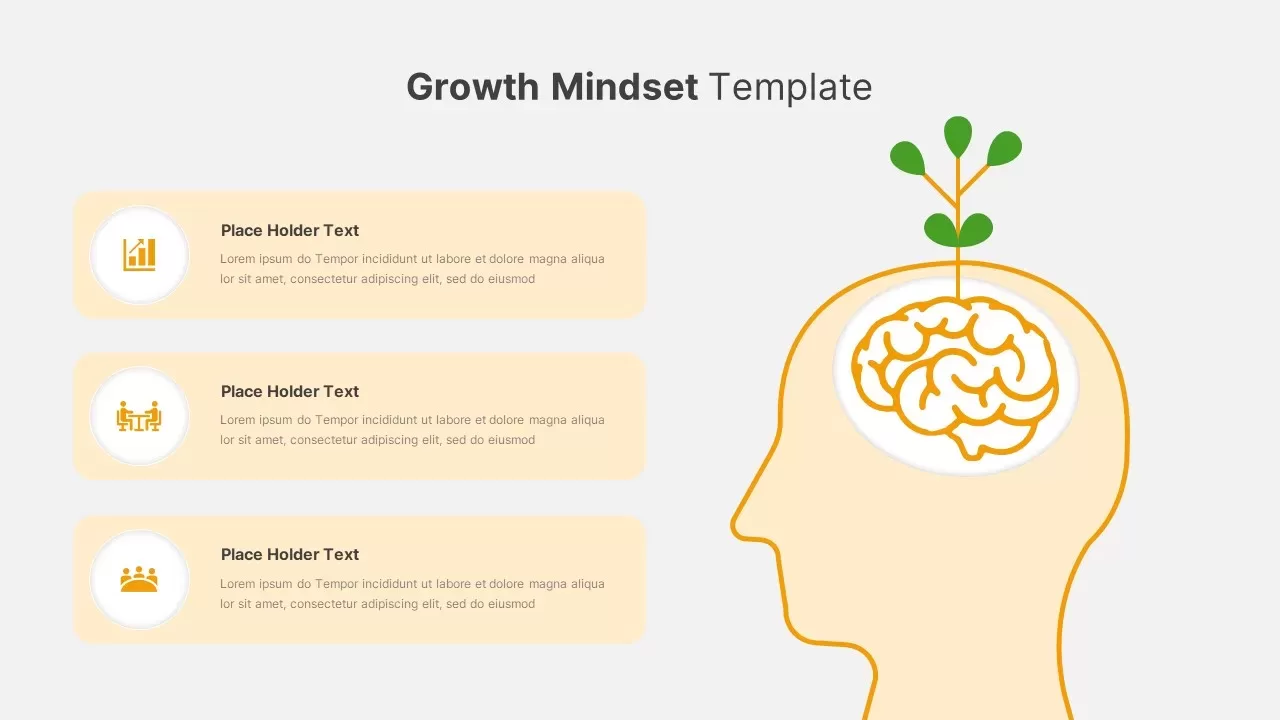
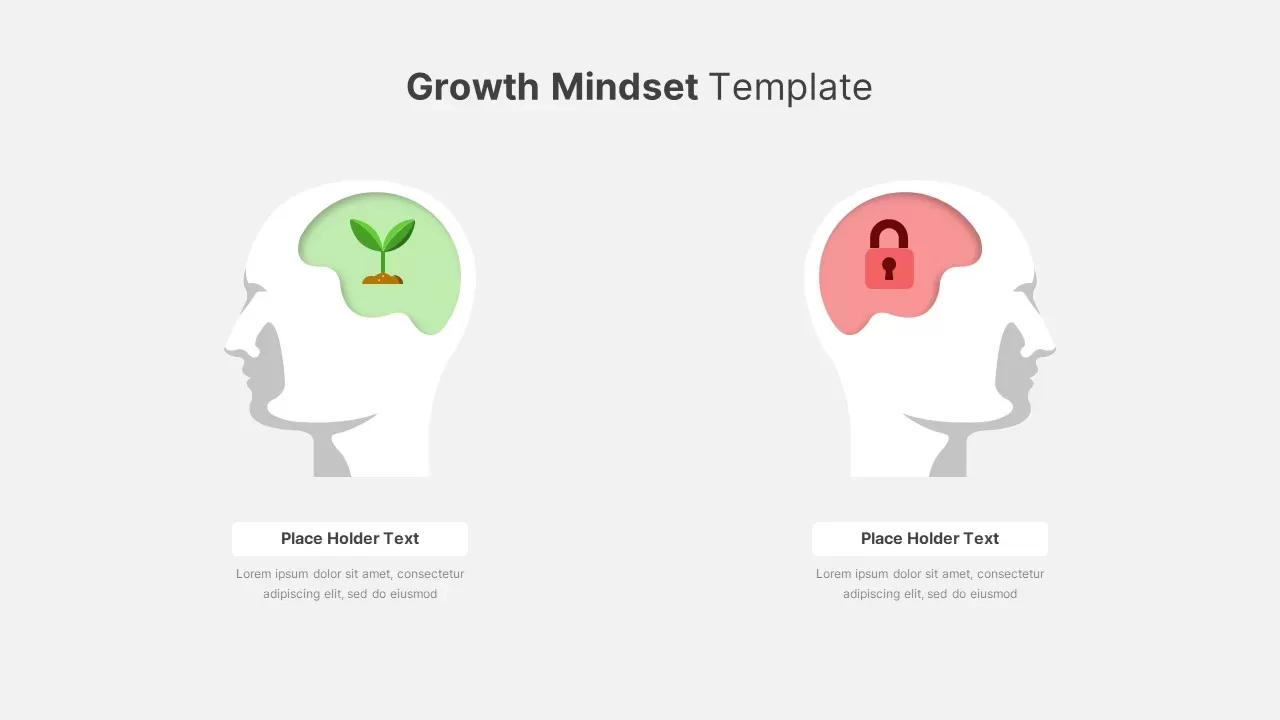
Growth Mindset Illustration Template for PowerPoint & Google Slides
Goals
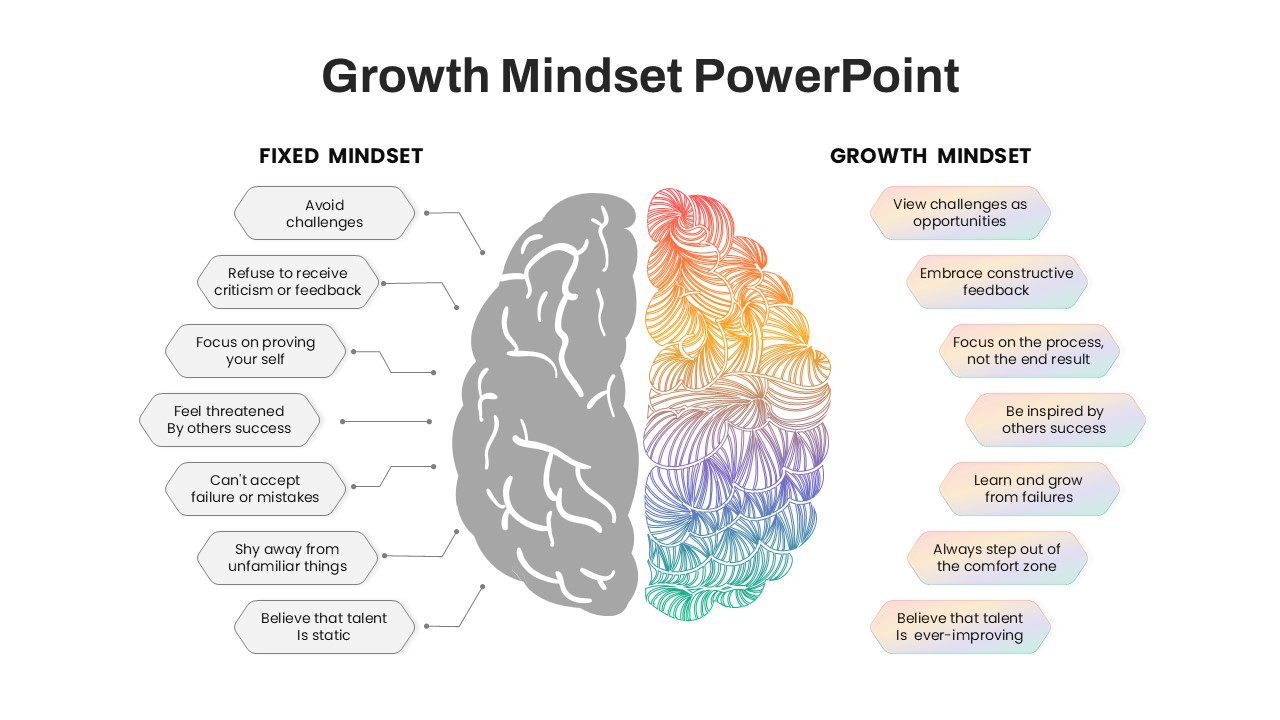
Growth vs Fixed Mindset Diagram Template for PowerPoint & Google Slides
Comparison
Abraham Maslow Growth Quote Slide Template for PowerPoint & Google Slides
Vision and Mission
Three-Stage S Curve Growth Diagram Template for PowerPoint & Google Slides
Process
Growth Curve Line Chart Visualization Template for PowerPoint & Google Slides
Charts
Dynamic Investment & Finance Growth Template for PowerPoint & Google Slides
Finance
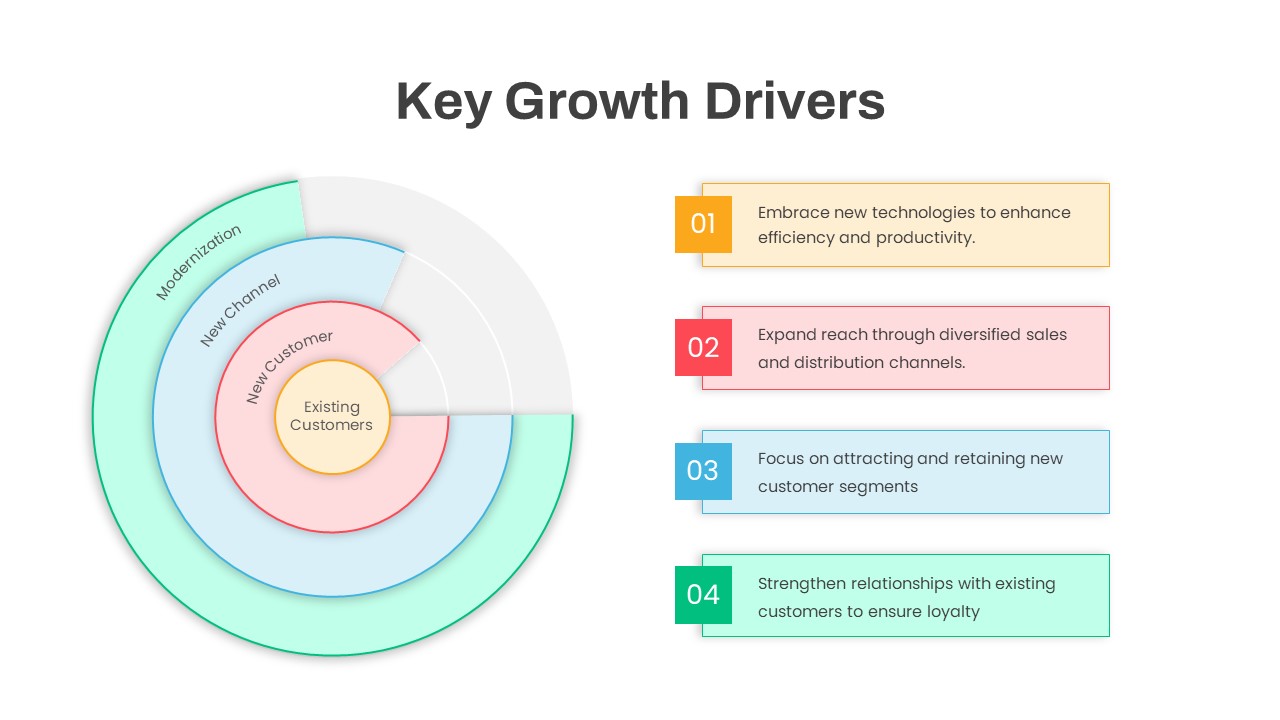
Circular Key Growth Drivers Diagram Template for PowerPoint & Google Slides
Circular
Business Growth Strategies Matrix Template for PowerPoint & Google Slides
Comparison

Growth Plant Nurture Business Development Template for PowerPoint & Google Slides
Decks
Annual Growth Trend Analysis Chart template for PowerPoint & Google Slides
Business Report
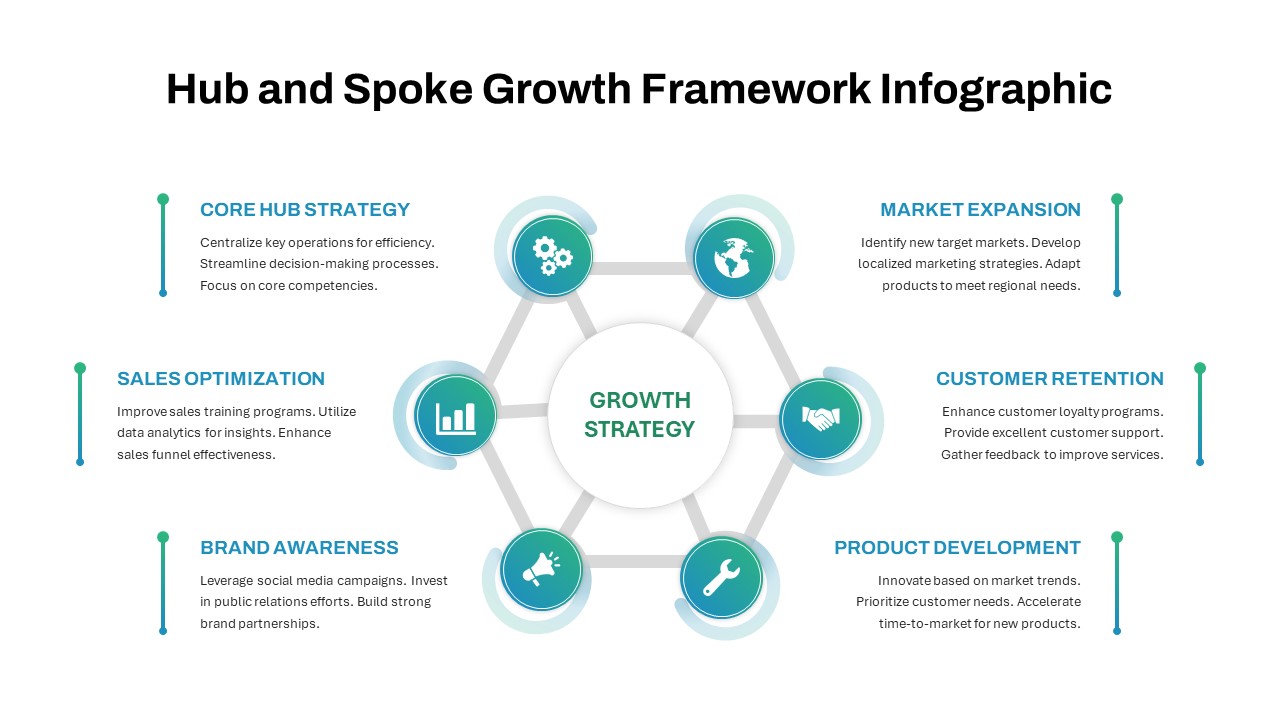
Hub and Spoke Growth Framework Template for PowerPoint & Google Slides
Circular

Quarterly Net Interest Income Growth Template for PowerPoint & Google Slides
Bar/Column
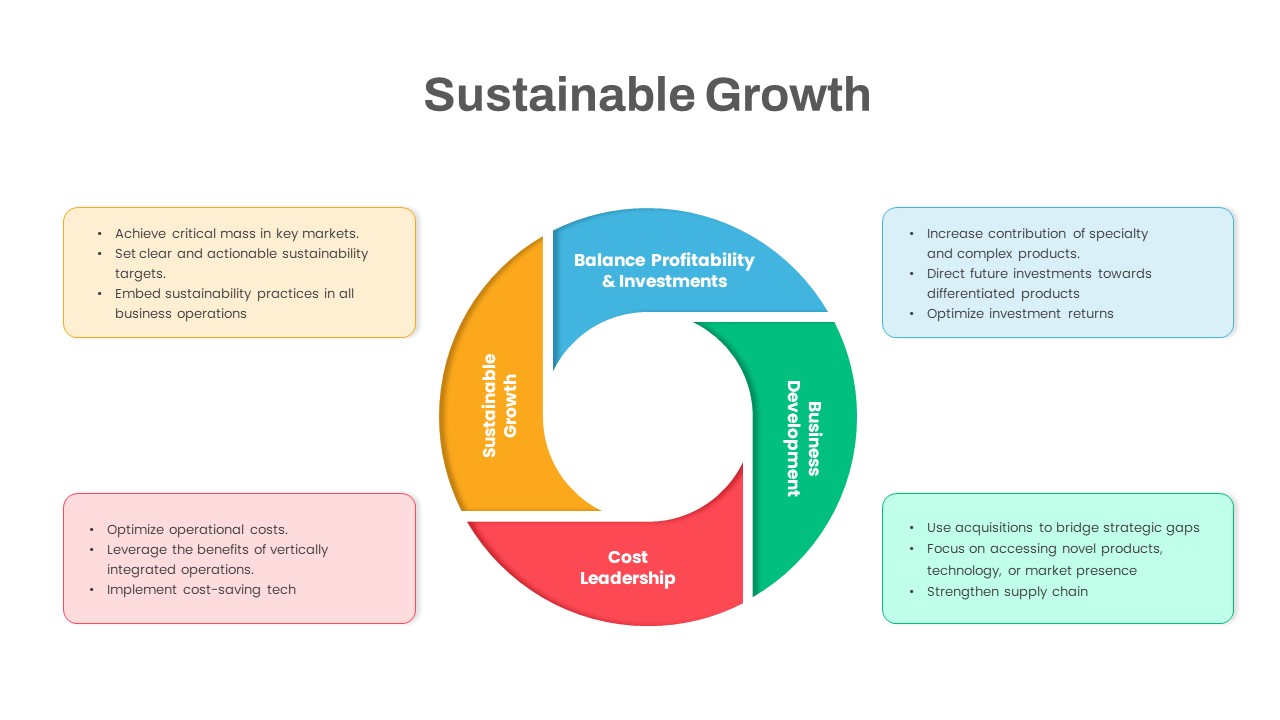
Sustainable Growth Circular Diagram Template for PowerPoint & Google Slides
Circular
Fixed vs Growth Mindset Matrix Template for PowerPoint & Google Slides
Comparison
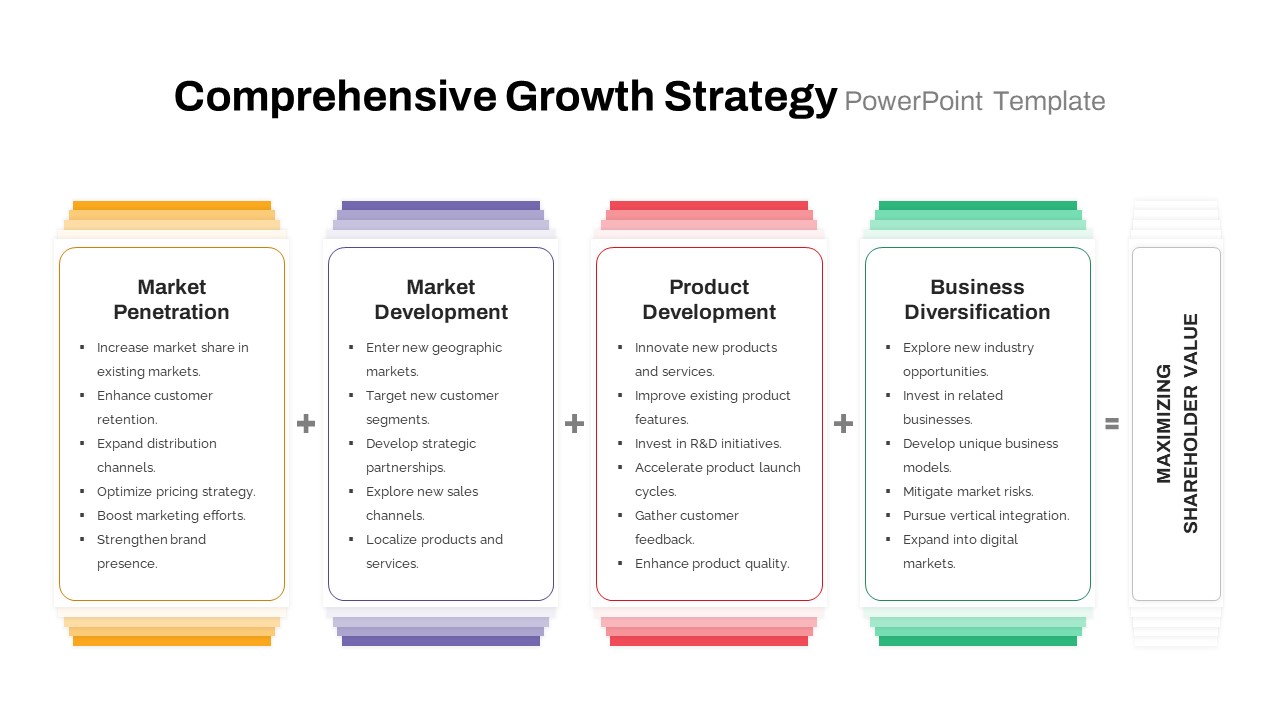
Comprehensive Growth Strategy Cards Template for PowerPoint & Google Slides
Infographics
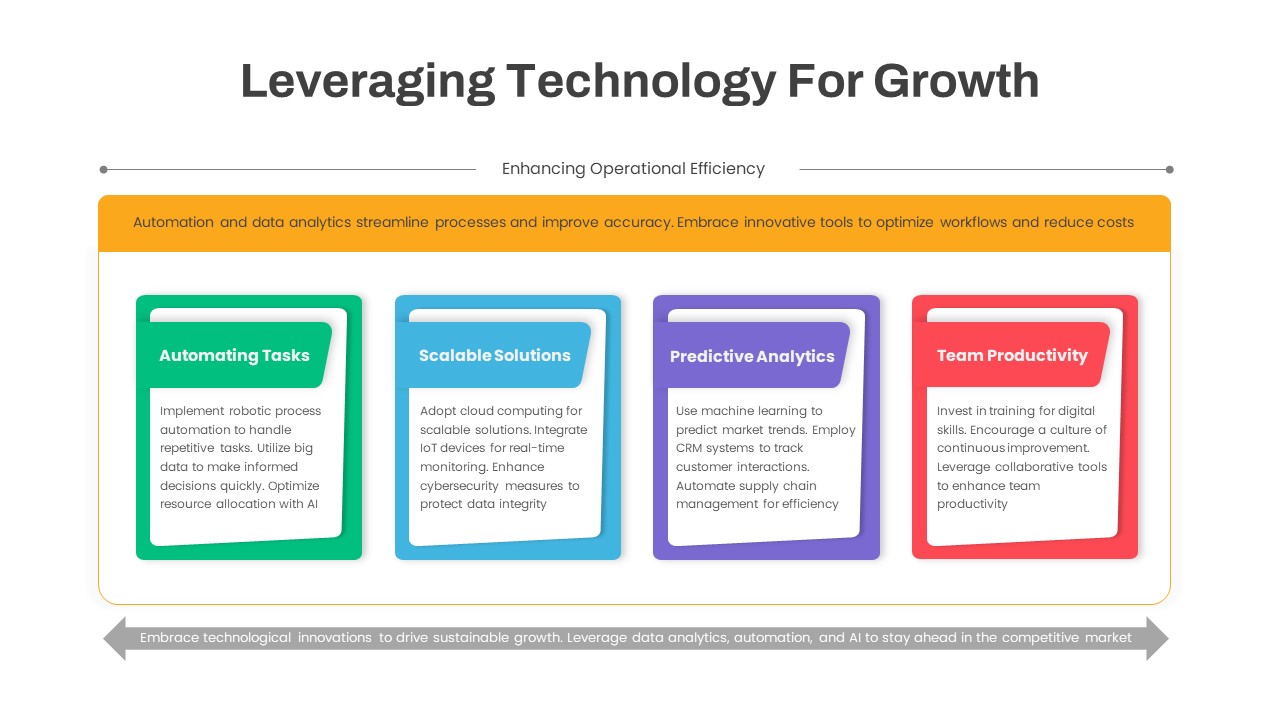
Leveraging Technology for Growth Slide Template for PowerPoint & Google Slides
Information Technology
Ansoff Growth Matrix Professional Template for PowerPoint & Google Slides
Comparison
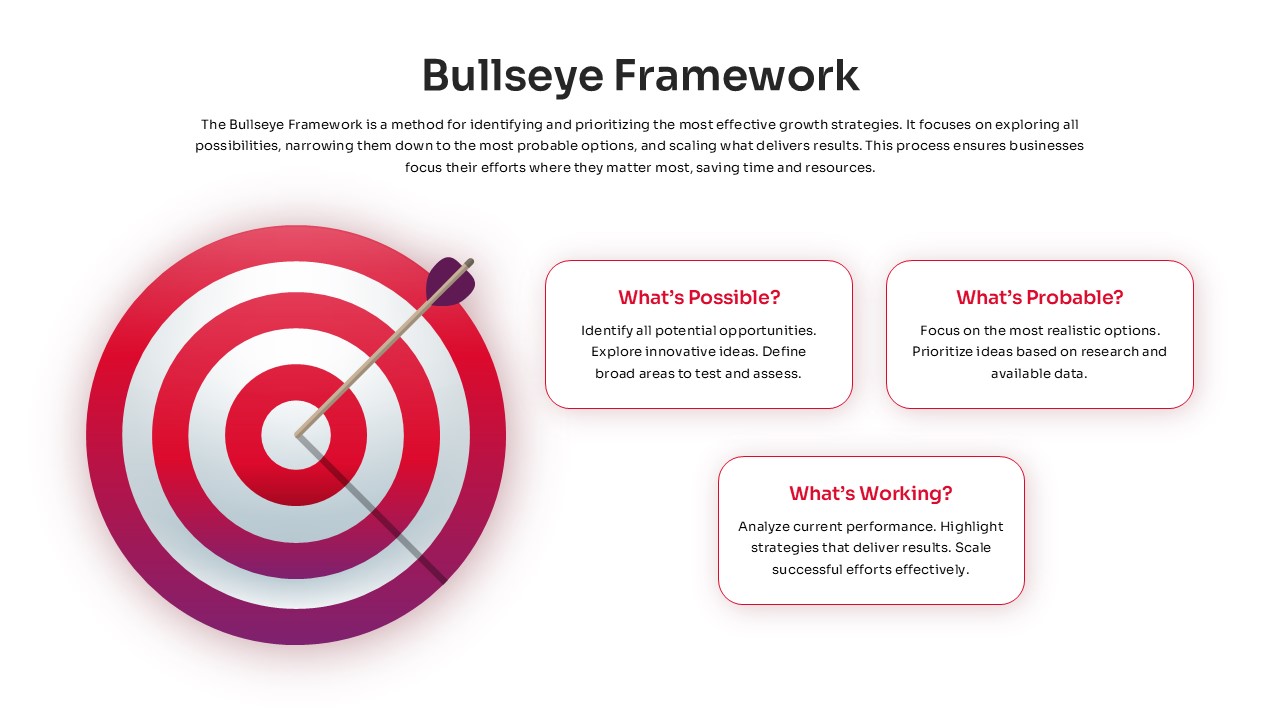
Bullseye Framework Growth Strategy Template for PowerPoint & Google Slides
Business Strategy
Modern Growth Hacking Venn Diagram Template for PowerPoint & Google Slides
Circular
Seeds Growth Cycle Business Model Template for PowerPoint & Google Slides
Process
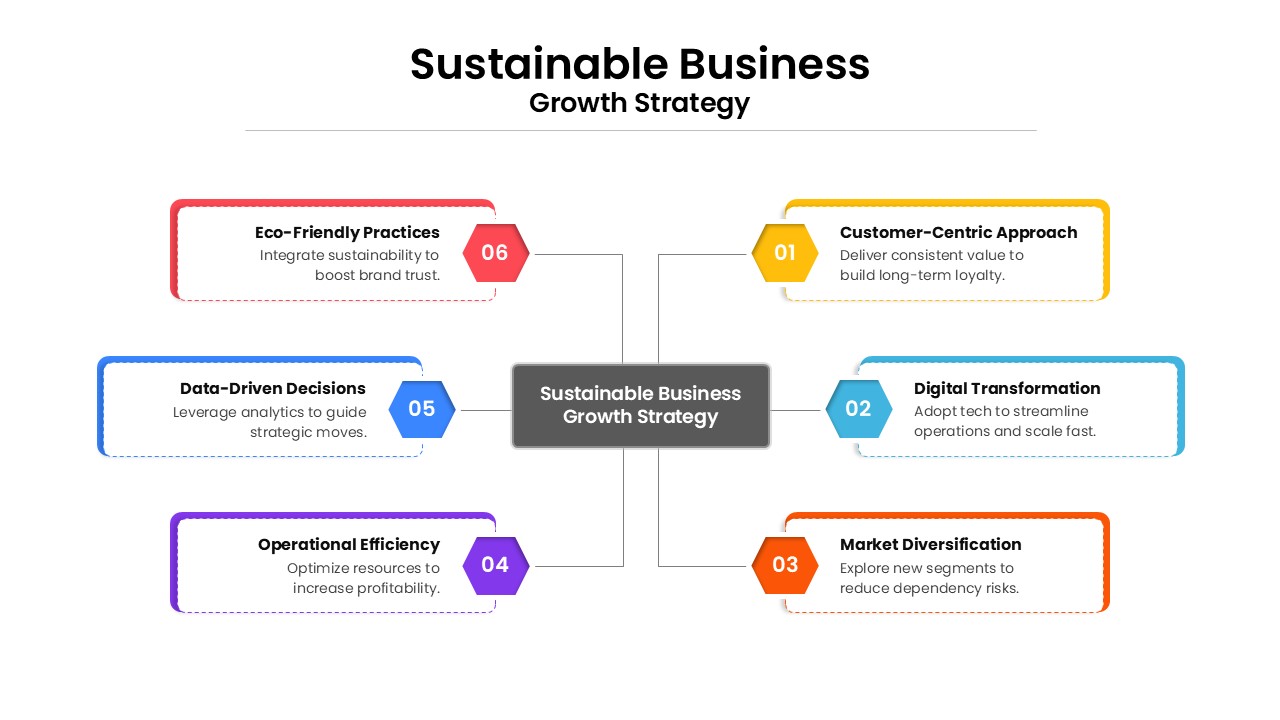
Sustainable Business Growth Strategy Template for PowerPoint & Google Slides
Process
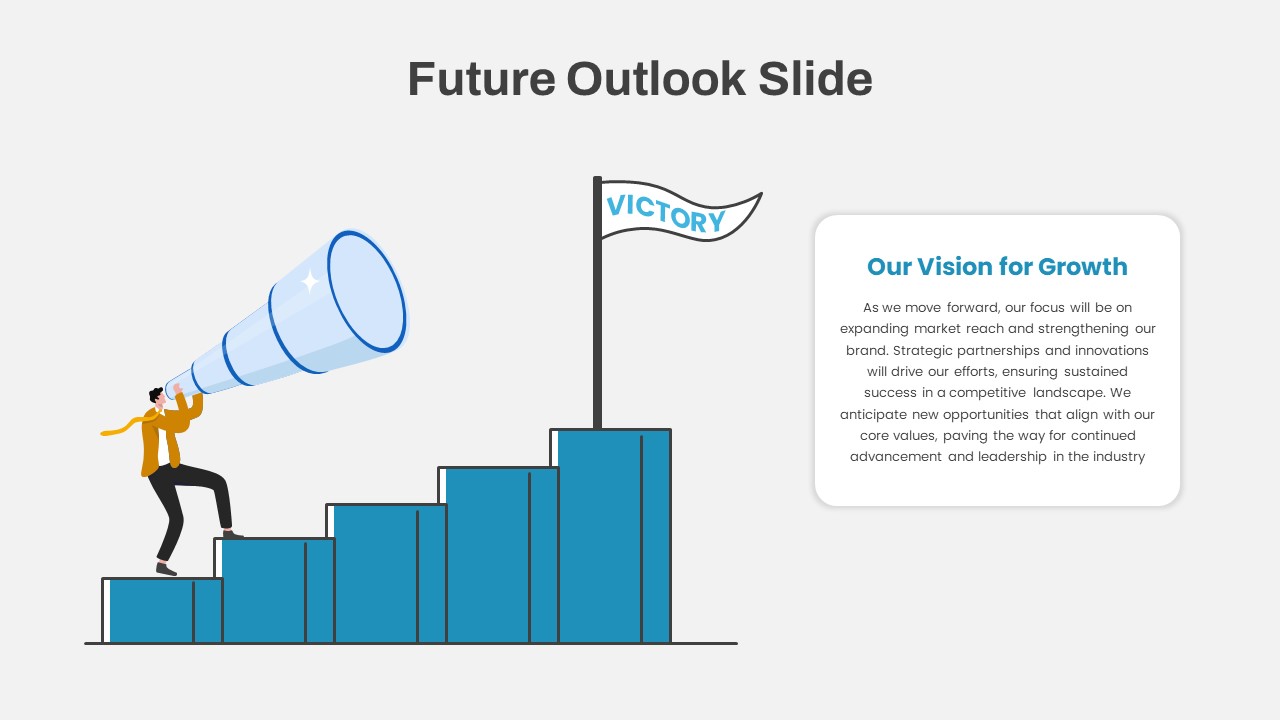
Future Outlook and Growth Strategy Slide Template for PowerPoint & Google Slides
Infographics
Sales Growth Comparison Chart & Table Template for PowerPoint & Google Slides
Bar/Column
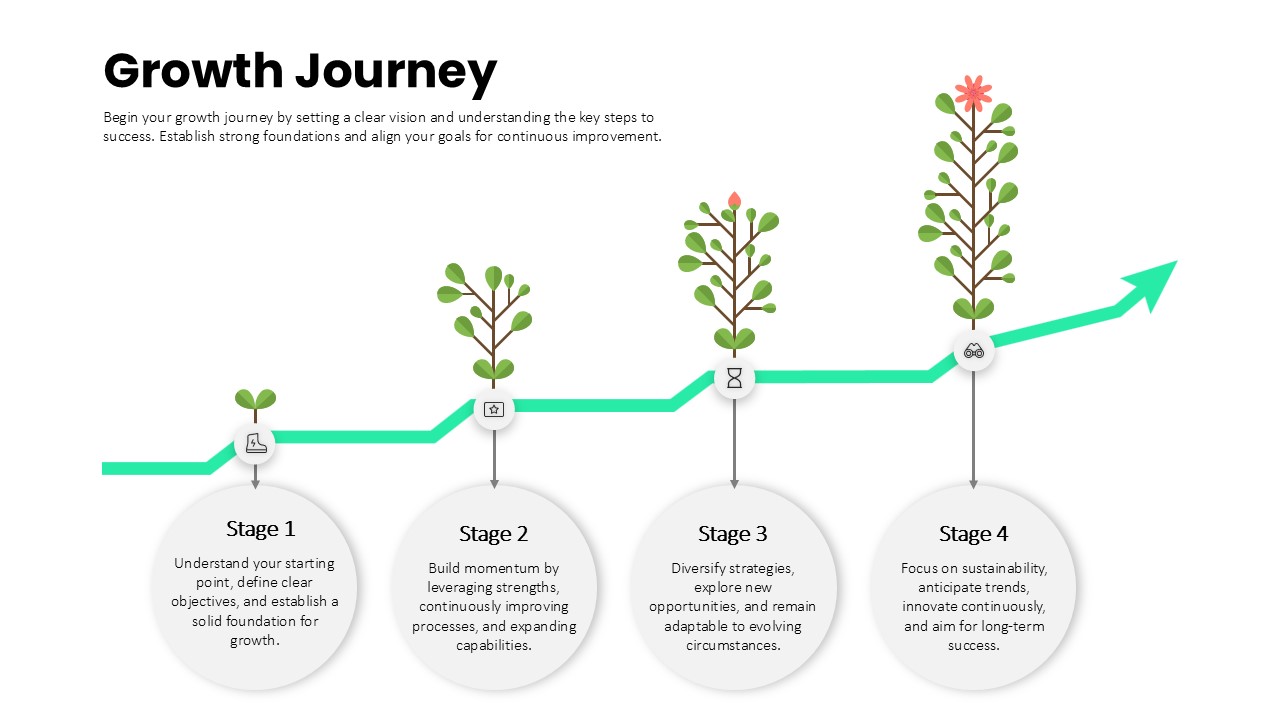
Growth Journey Stages Process template for PowerPoint & Google Slides
Business Strategy
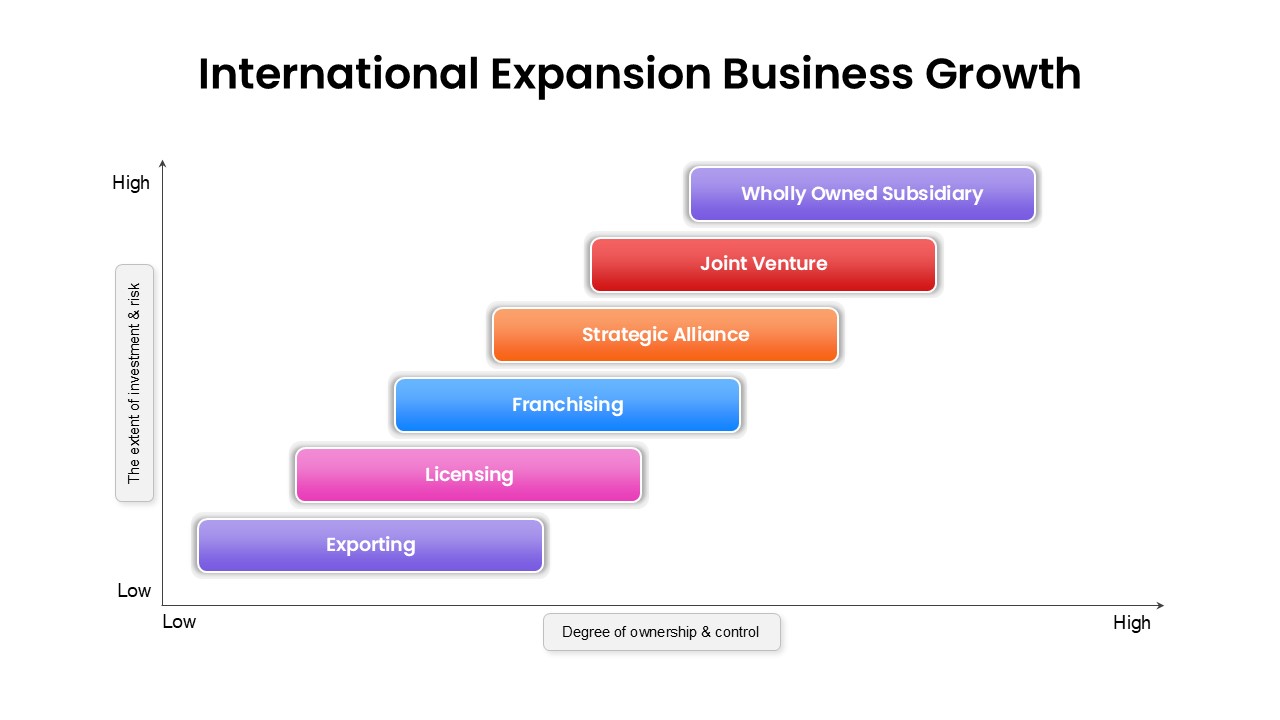
International Expansion Business Growth template for PowerPoint & Google Slides
Business Strategy
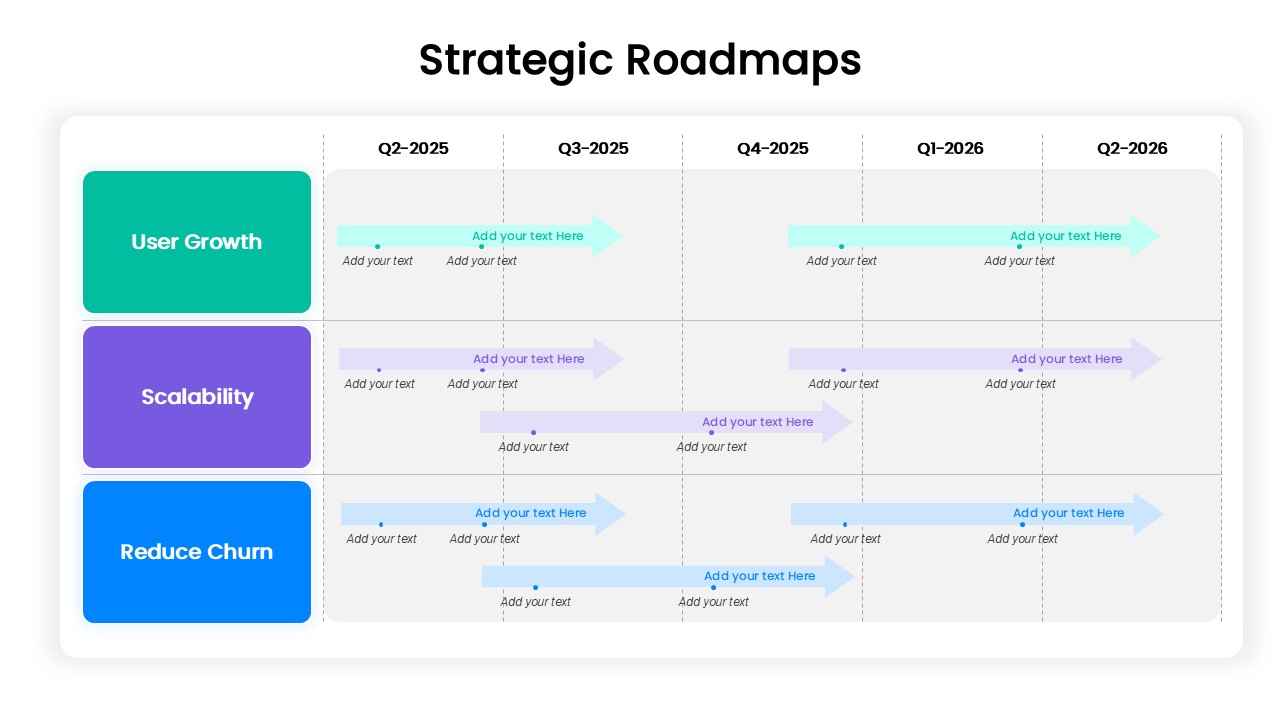
Strategic Roadmap for User Growth, Scalability, and Reducing Churn template for PowerPoint & Google Slides
Business
Flywheel Growth Cycle Diagram Template for PowerPoint & Google Slides
Circular
Personal Growth Overview Template for PowerPoint & Google Slides
Business
Ansoff Growth Matrix Template for PowerPoint & Google Slides
Business Strategy
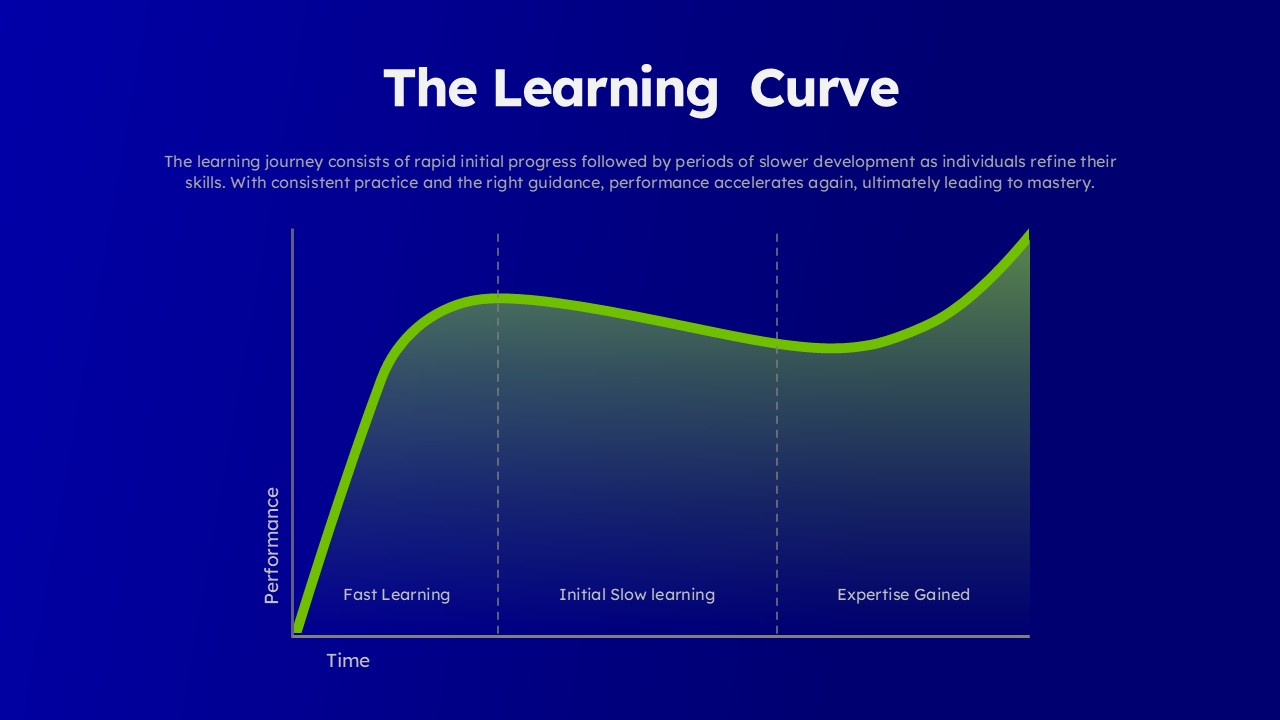
Learning Curve Performance Growth Chart Template for PowerPoint & Google Slides
Employee Performance
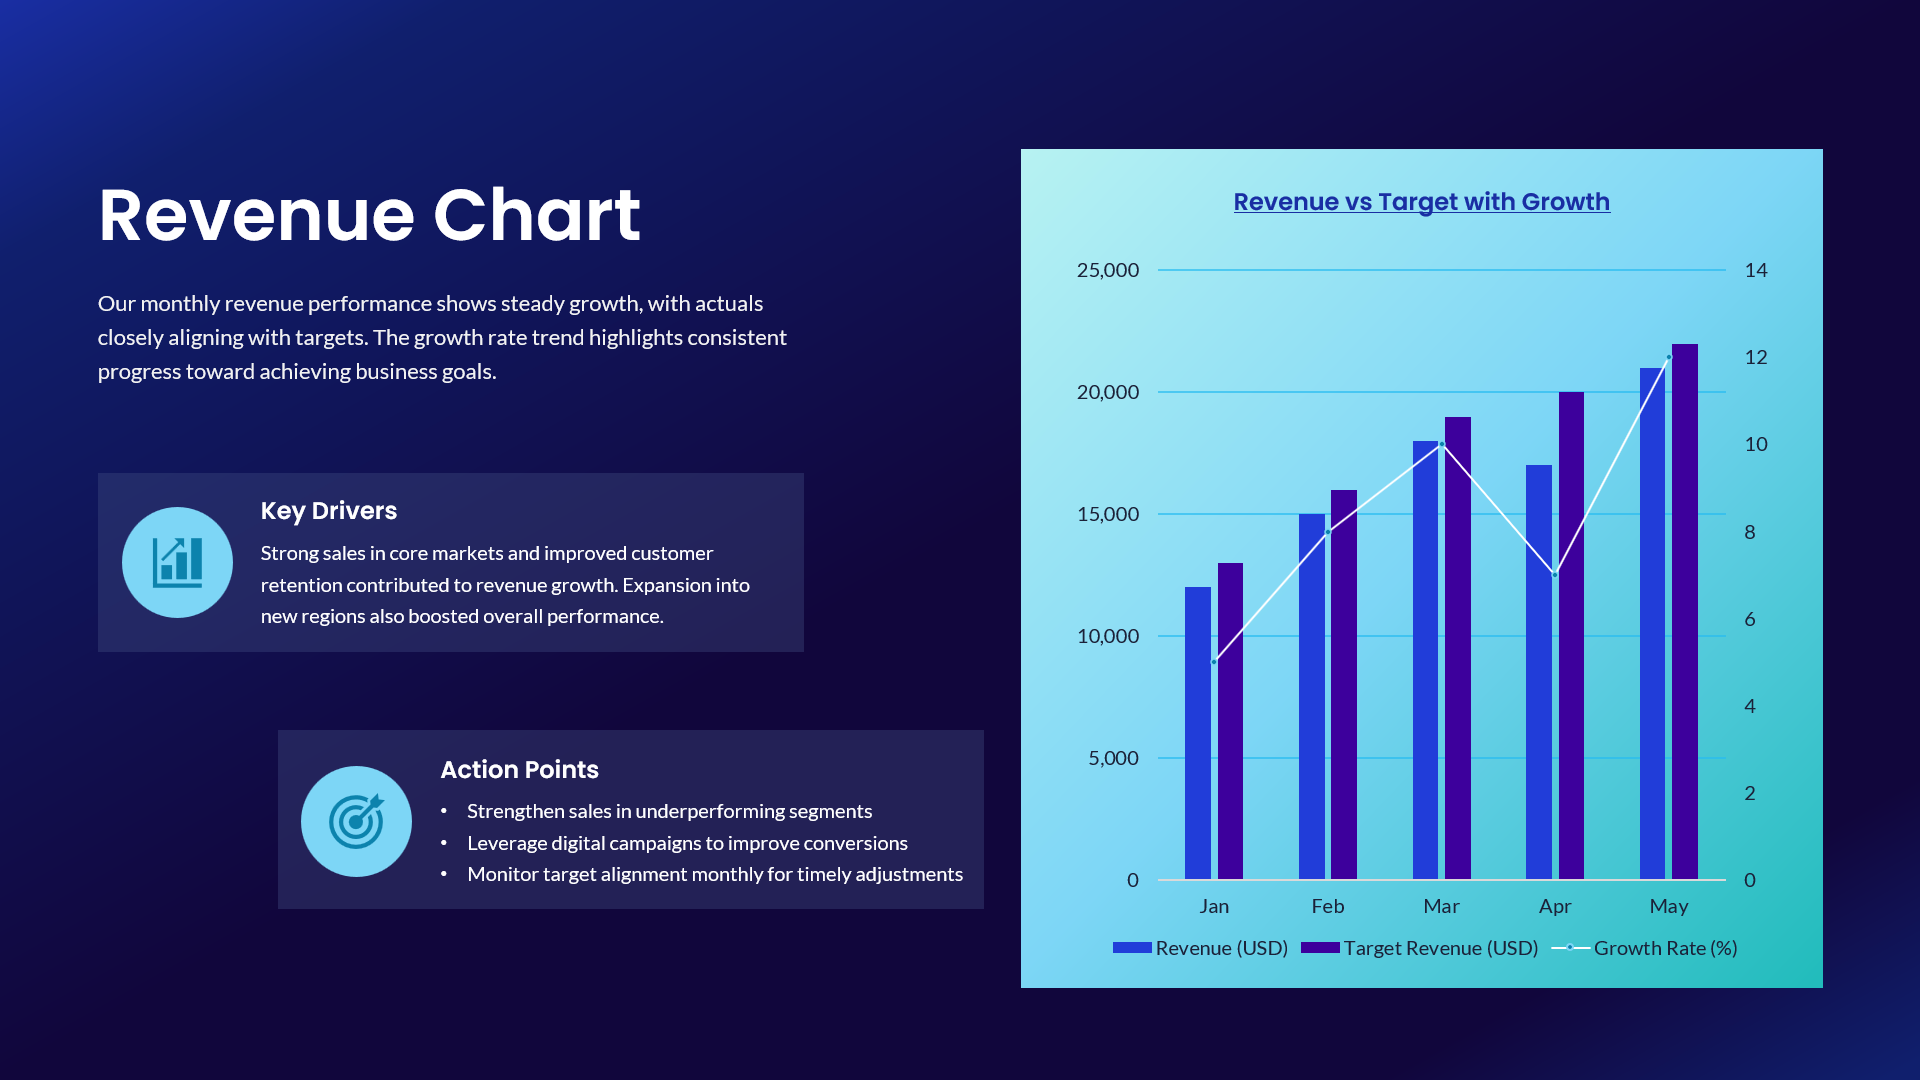
Revenue vs Target Growth Chart Template for PowerPoint & Google Slides
Revenue
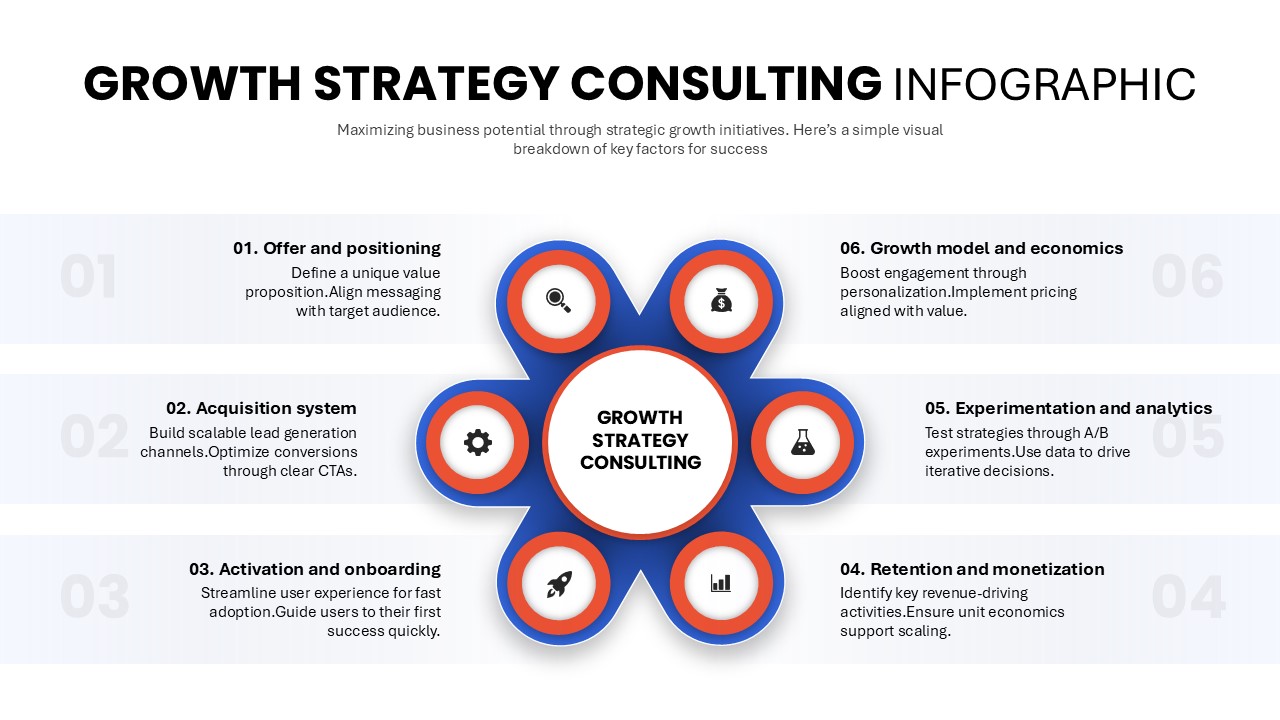
Growth Strategy Consulting Infographic Template for PowerPoint & Google Slides
Process
Success and Growth Stair Arrow Diagram for PowerPoint & Google Slides
Process
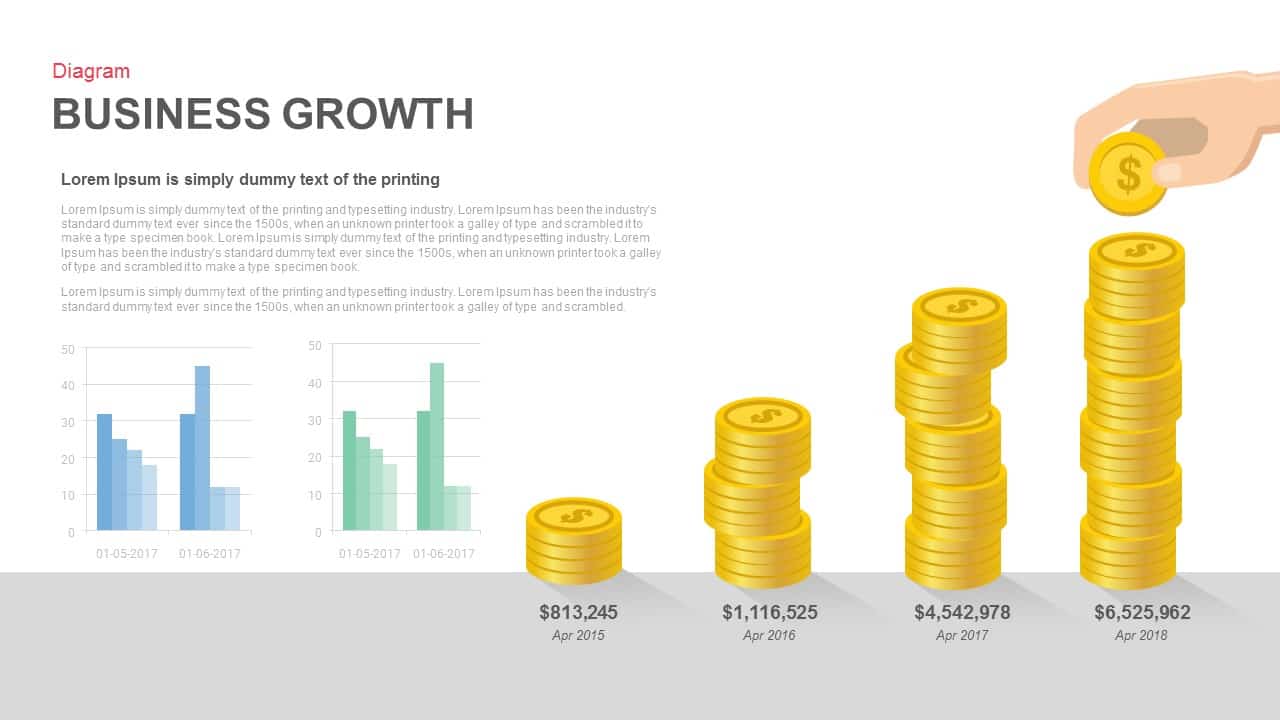
Business Growth Diagram for PowerPoint & Google Slides
Business Models
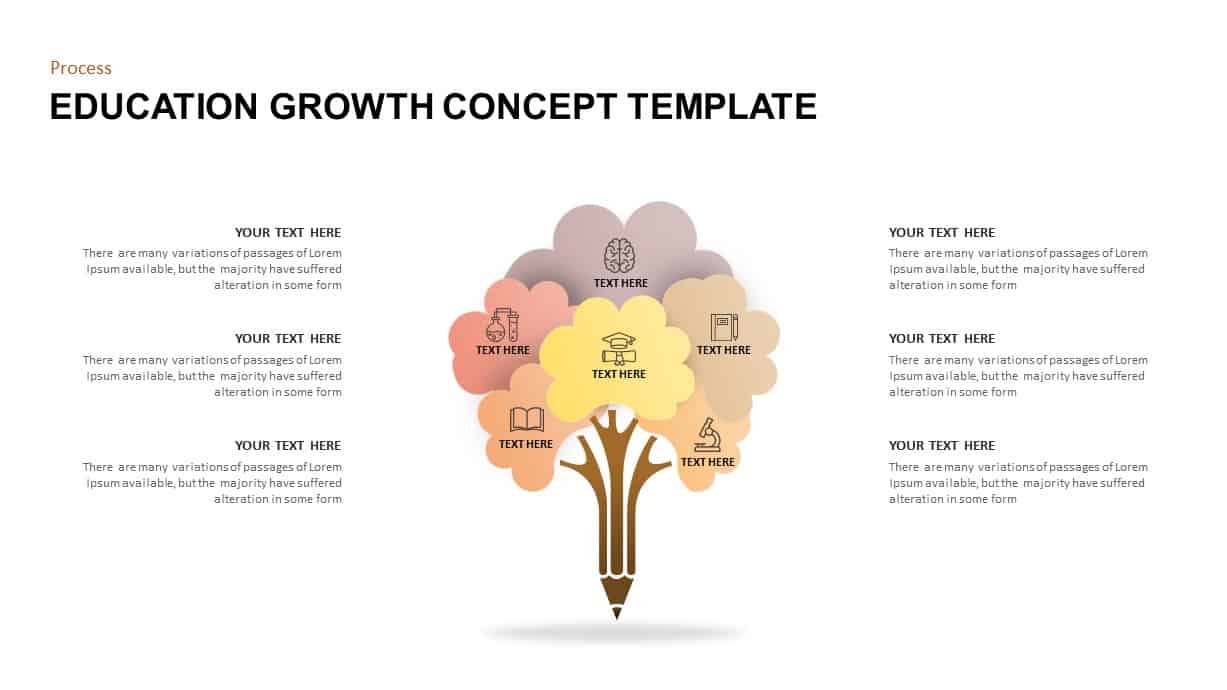
Education Growth Concept Diagram for PowerPoint & Google Slides
Process
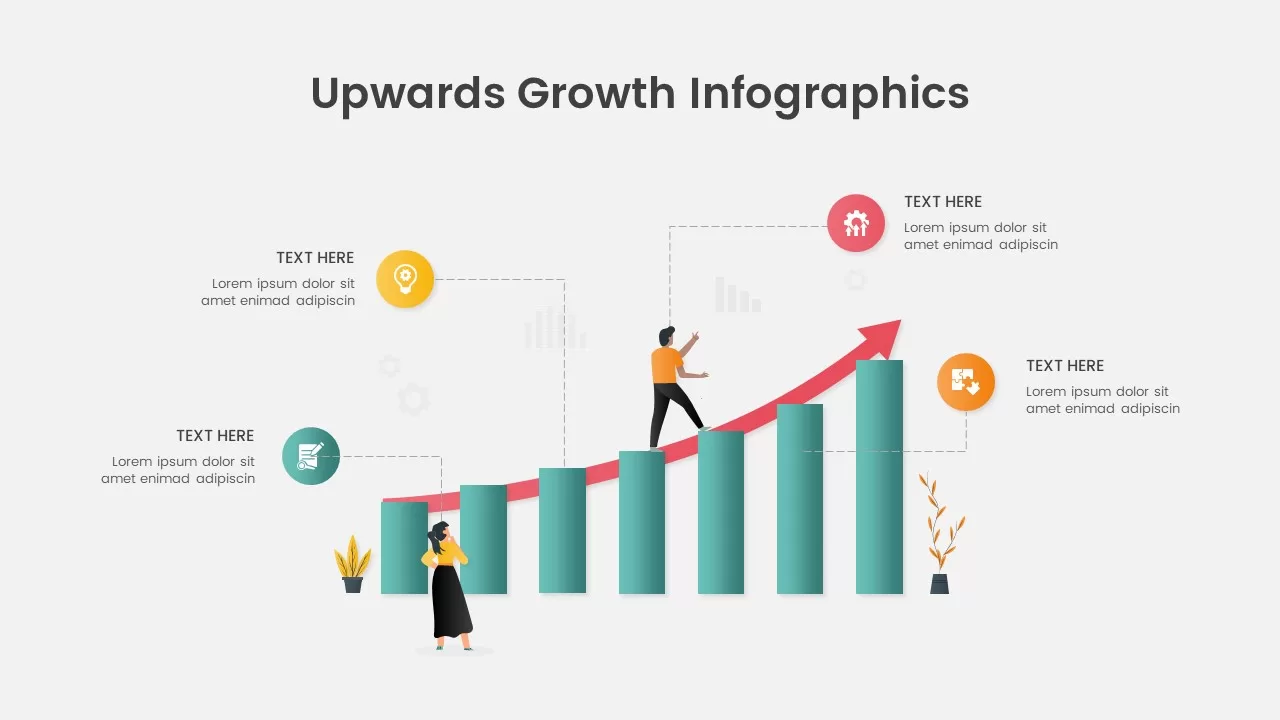
Upwards Growth Infographics for PowerPoint & Google Slides
Infographics
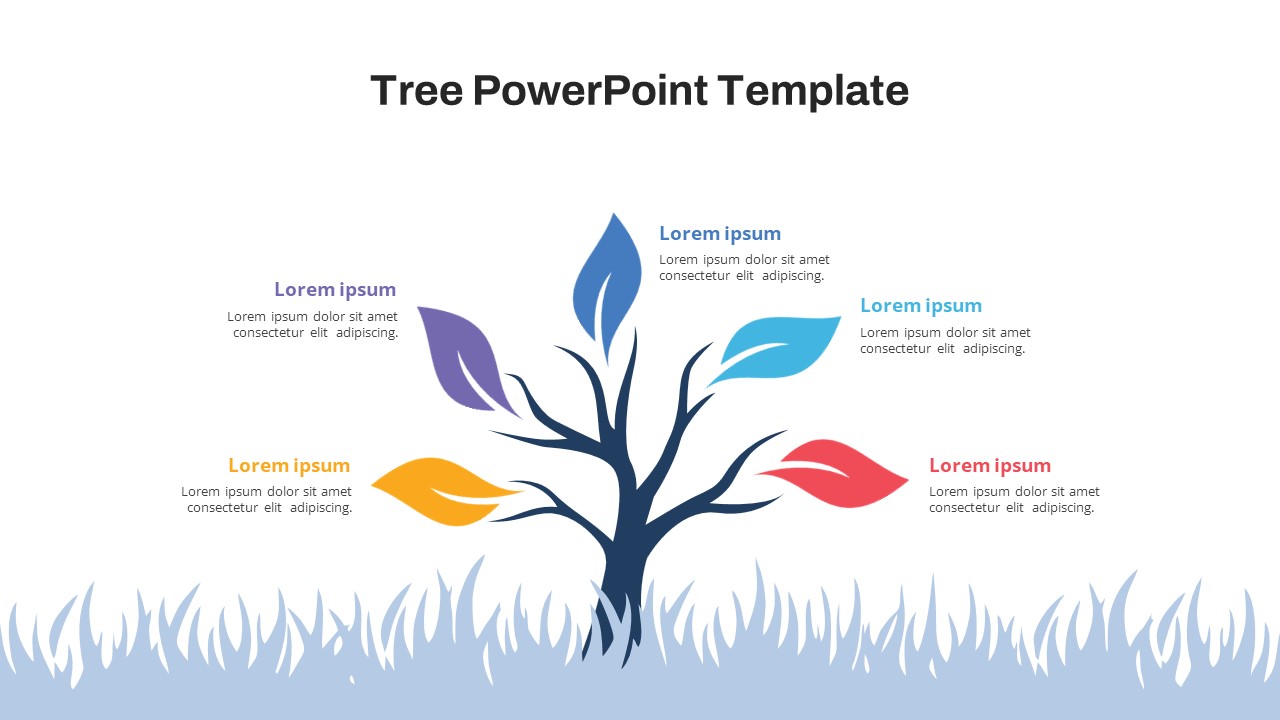
Free Colorful Tree Diagram for Growth & Strategy in PowerPoint & Google Slides
Infographics
Free
Business Growth and Partnership Background for PowerPoint & Google Slides
Business
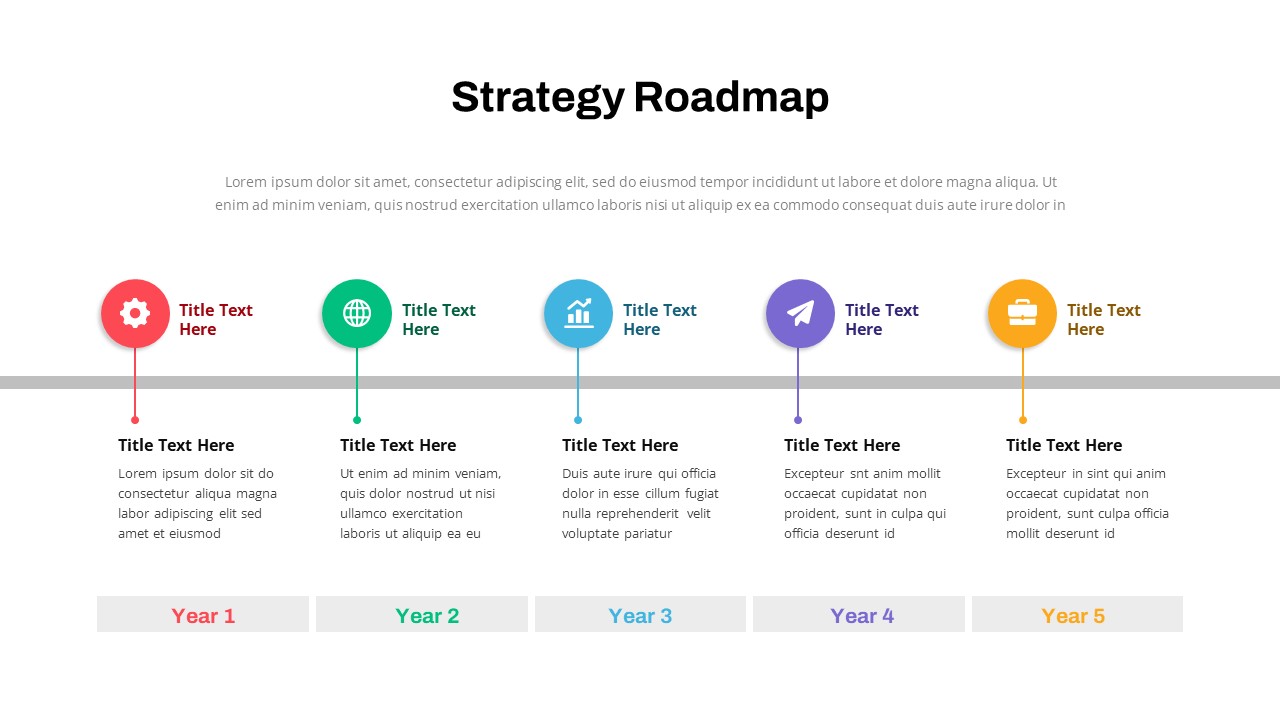
Strategy Roadmap Timeline Slides Template for PowerPoint & Google Slides
Roadmap
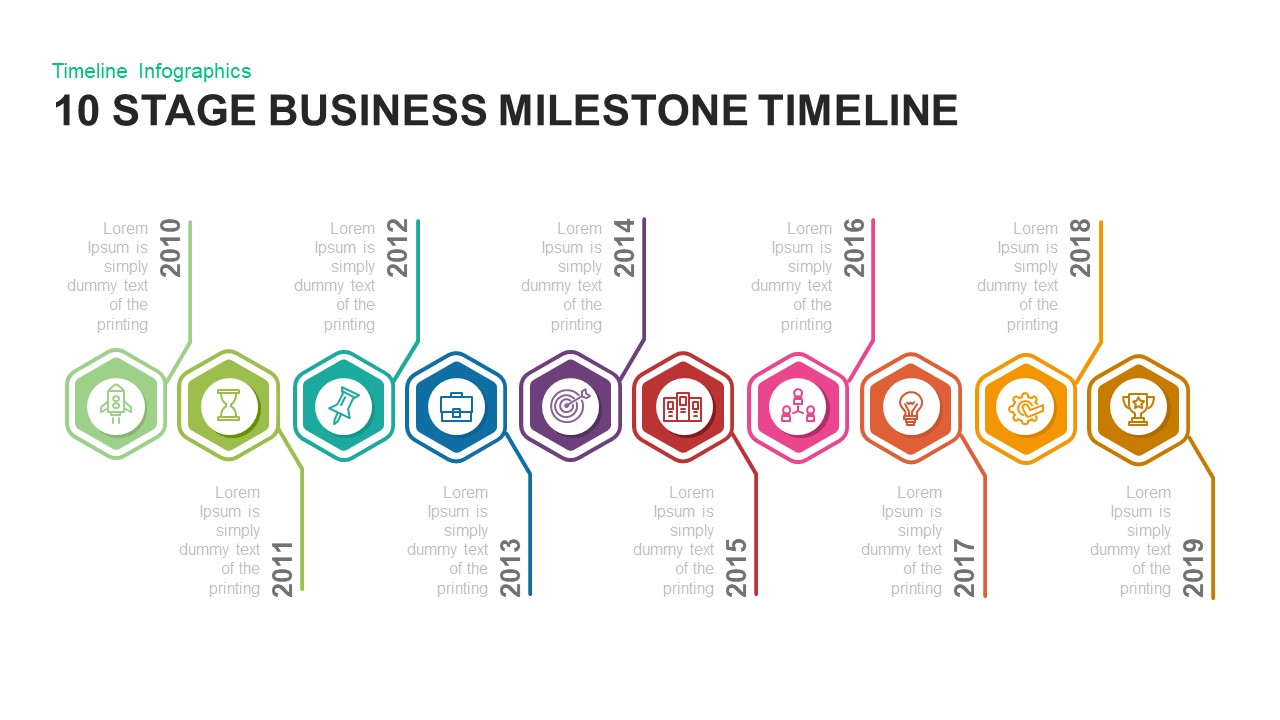
10 Stage Business Milestone Timeline PowerPoint Template for PowerPoint & Google Slides
Timeline
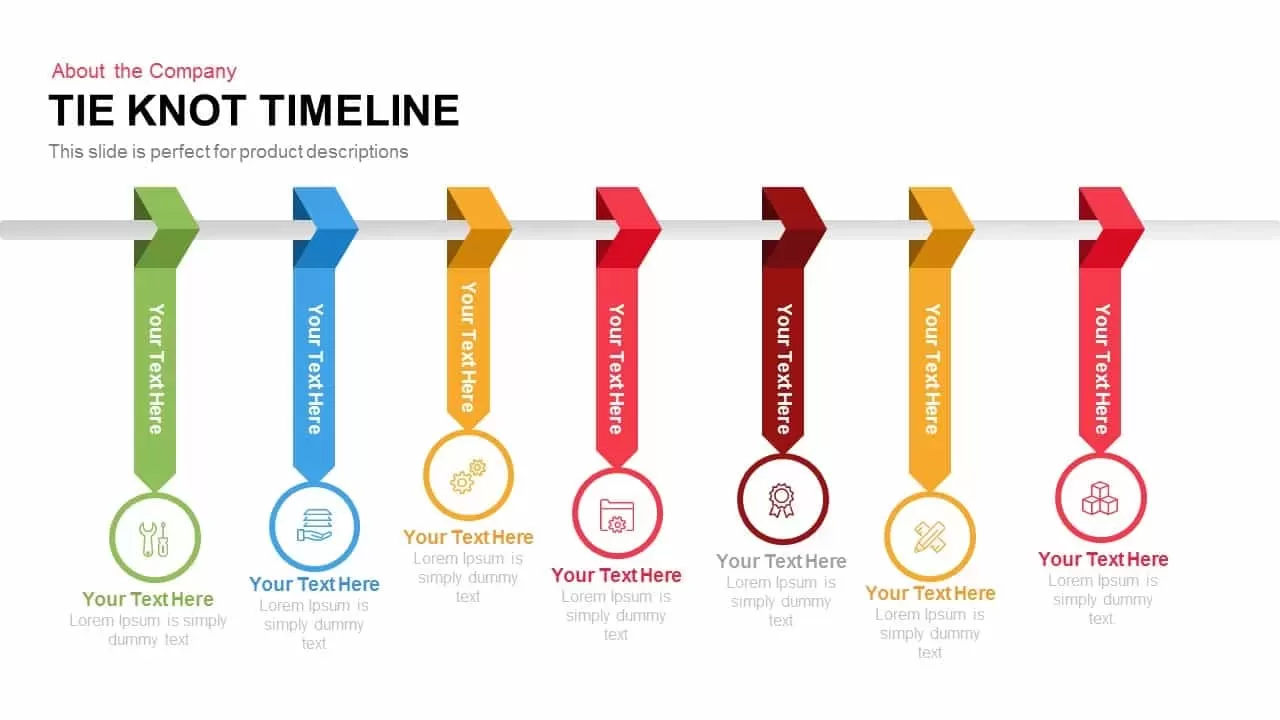
Tie Knot Timeline template for PowerPoint & Google Slides
Timeline
Curved Road Map Timeline Infographic Template for PowerPoint & Google Slides
Roadmap
Road Map Timeline Presentation template for PowerPoint & Google Slides
Roadmap
Sales Promotion Timeline template for PowerPoint & Google Slides
Timeline
Animated 4 Step Shelf Timeline Template for PowerPoint & Google Slides
Infographics
Workstream Timeline template for PowerPoint & Google Slides
Roadmap
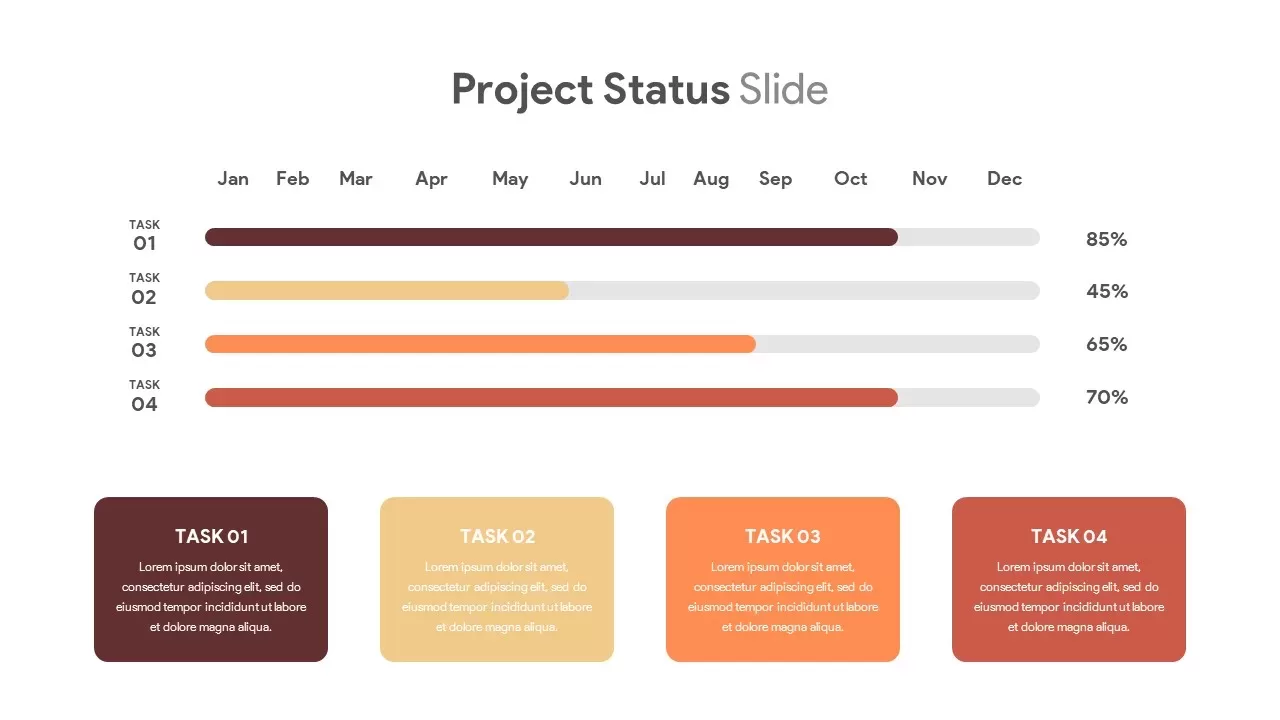
Horizontal Timeline Project Status Template for PowerPoint & Google Slides
Project Status
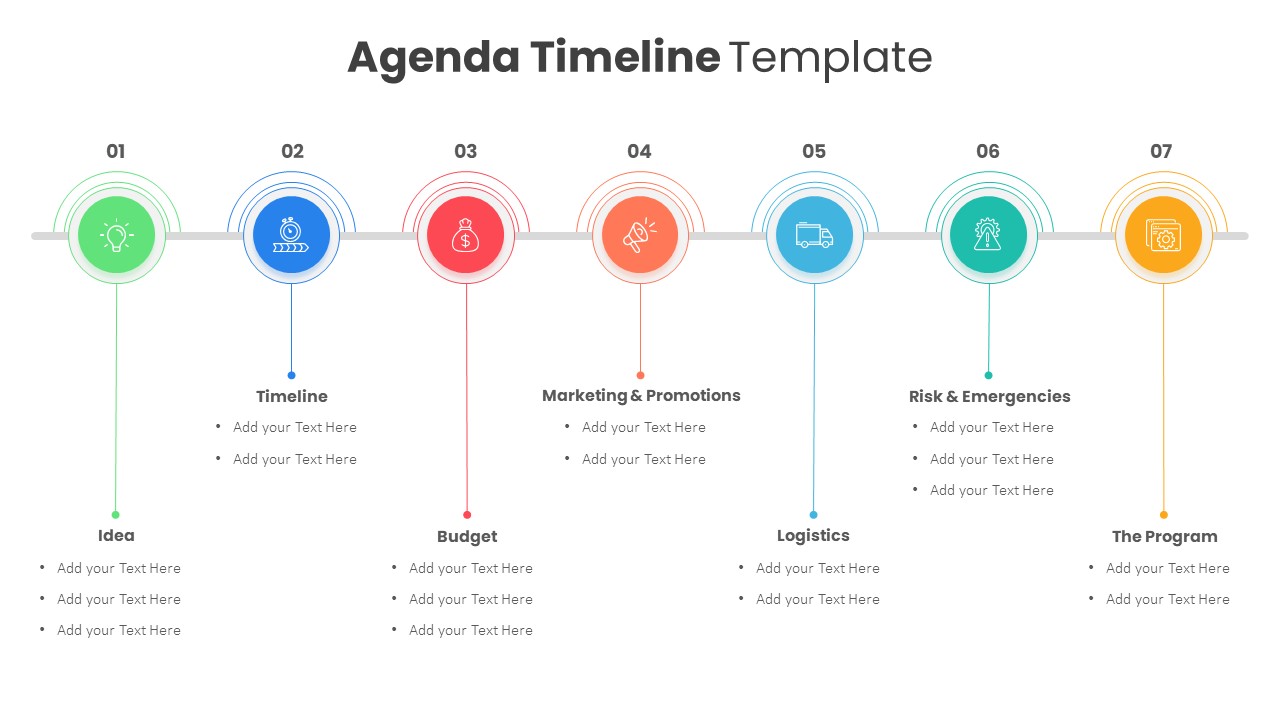
Colorful Agenda Timeline Infographic Template for PowerPoint & Google Slides
Agenda
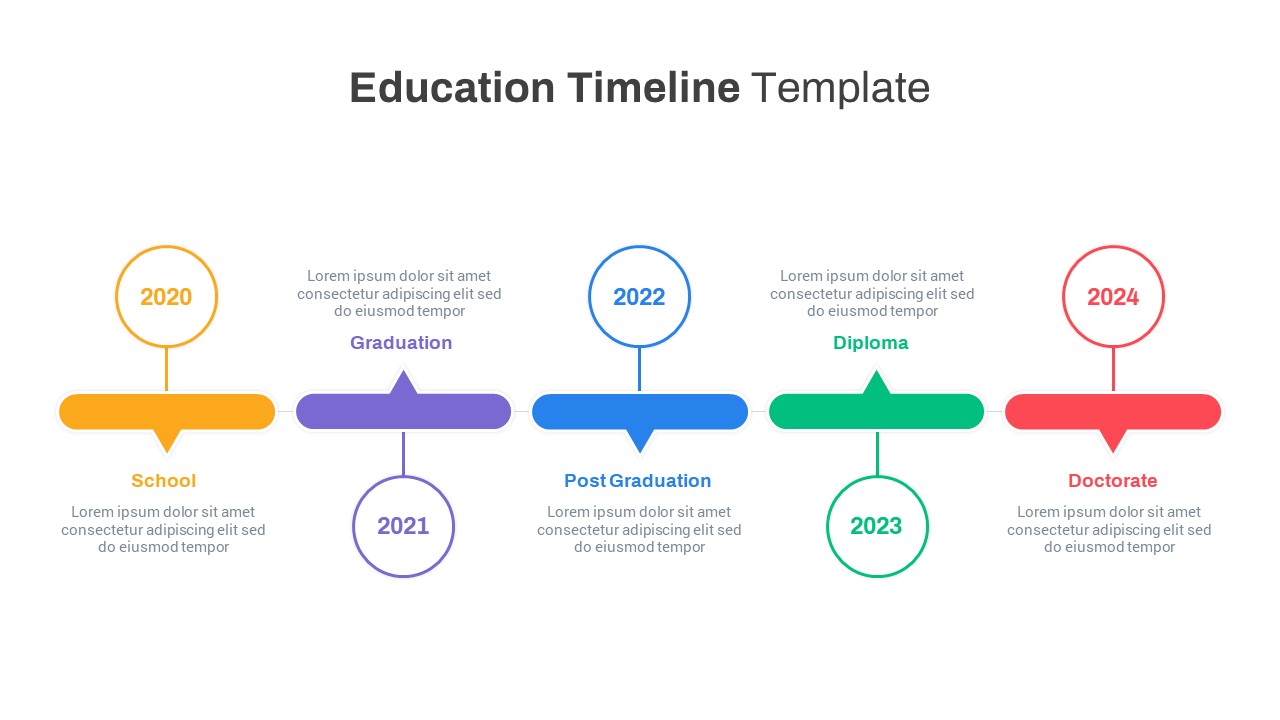
Colorful Five-Stage Education Timeline Template for PowerPoint & Google Slides
Timeline
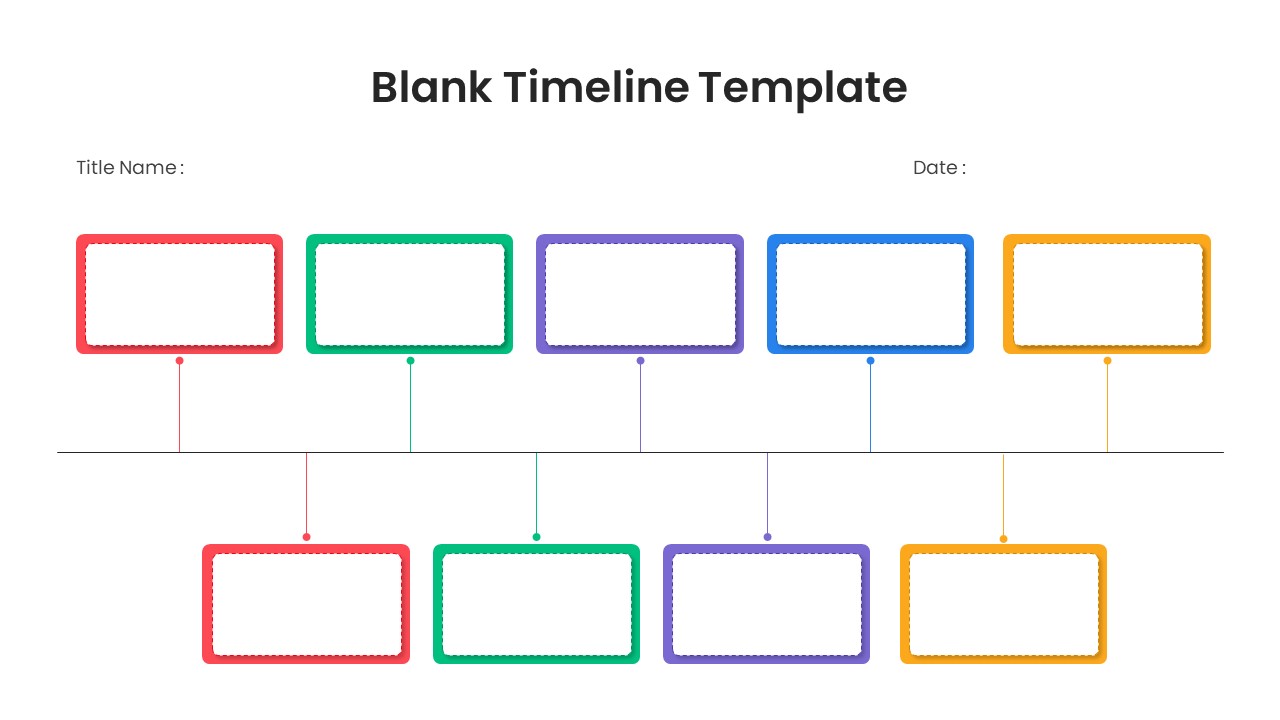
Blank Two-Tier Color-Coded Timeline Template for PowerPoint & Google Slides
Timeline
Interactive Serpentine Timeline Diagram Template for PowerPoint & Google Slides
Timeline
African American History Timeline Template for PowerPoint & Google Slides
Graphics
Wavy Timeline with Image Highlights Template for PowerPoint & Google Slides
Timeline
7 Step 6 Month Gantt Chart Timeline Template for PowerPoint & Google Slides
Gantt Chart
Goal Setting Timeline Roadmap Template for PowerPoint & Google Slides
Goals