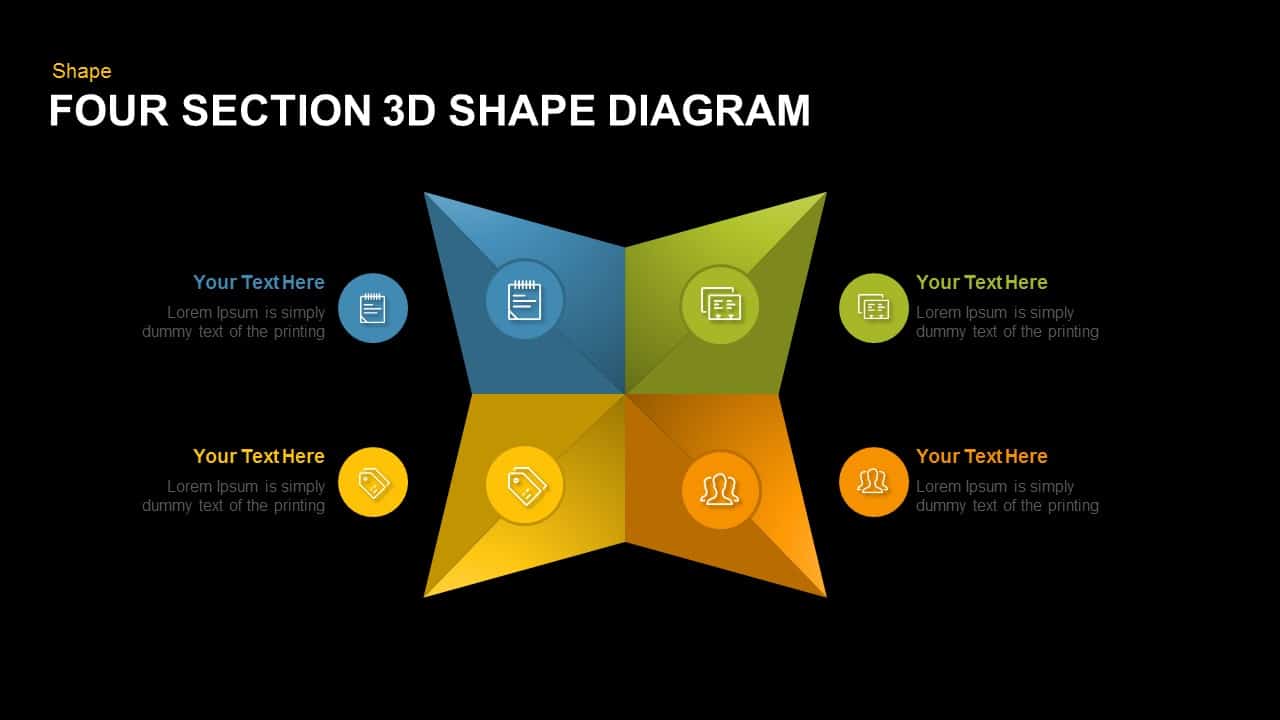
Editable Four-Section 3D Shape Diagram Template for PowerPoint & Google Slides


Description
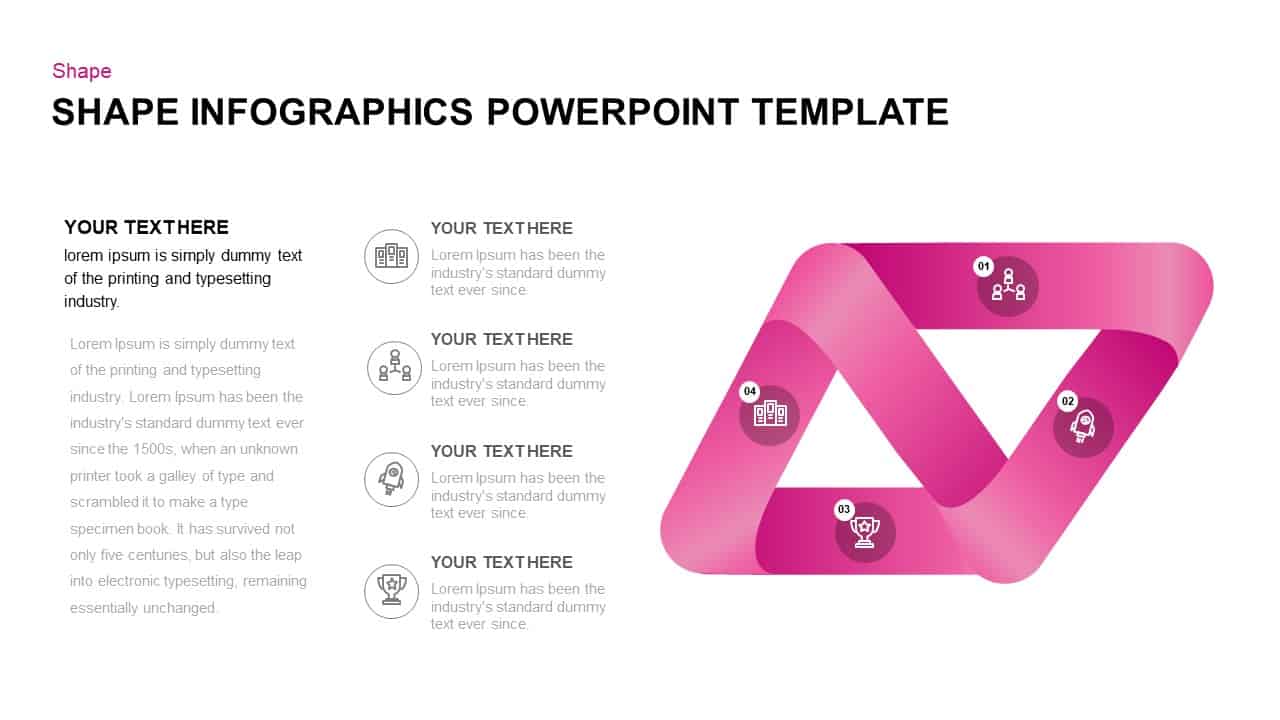
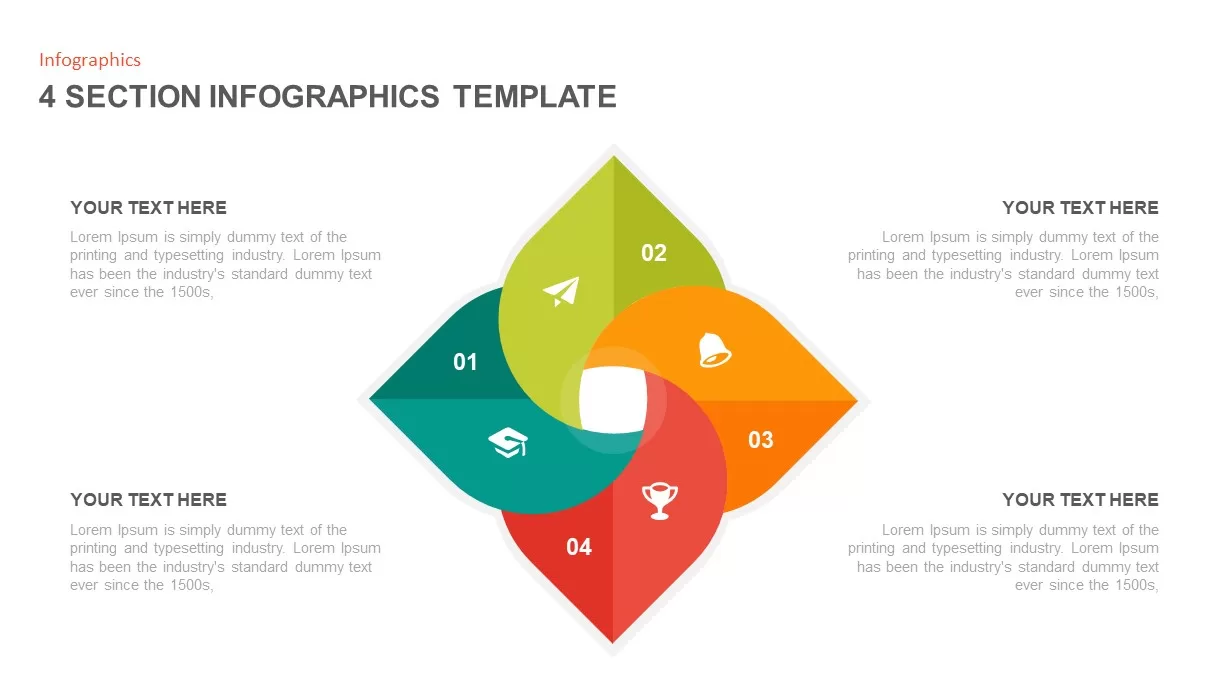
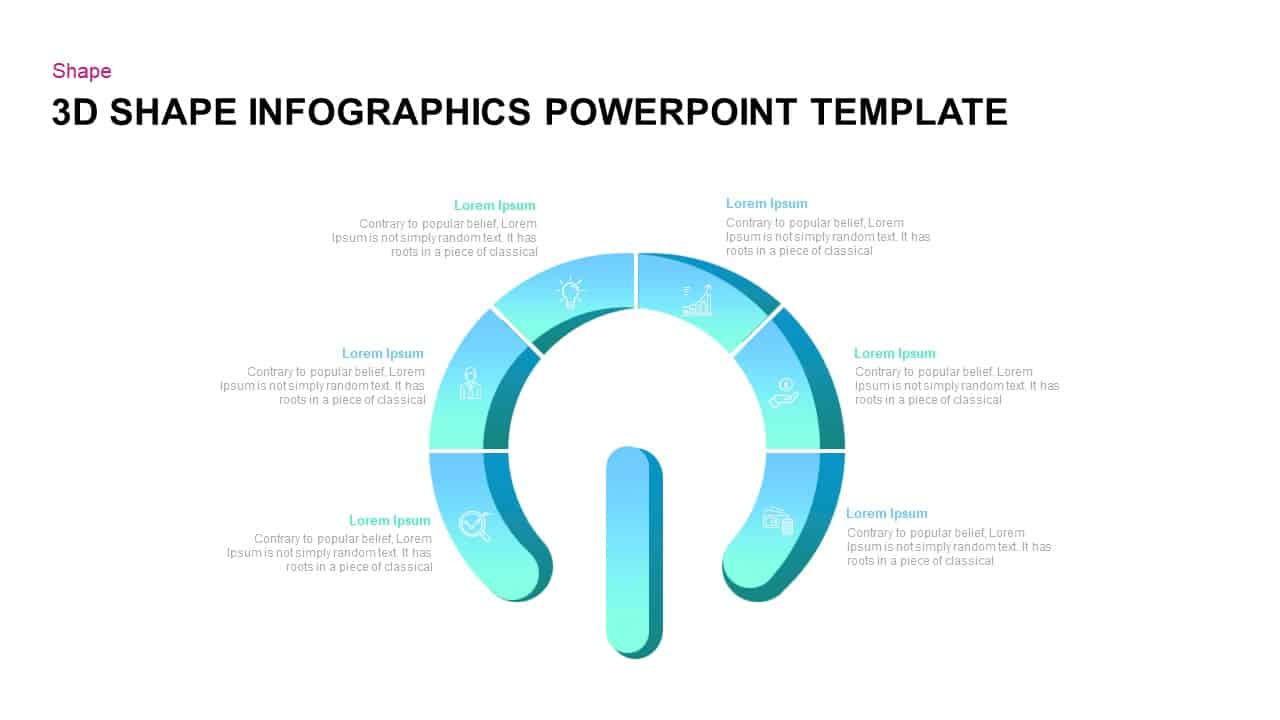
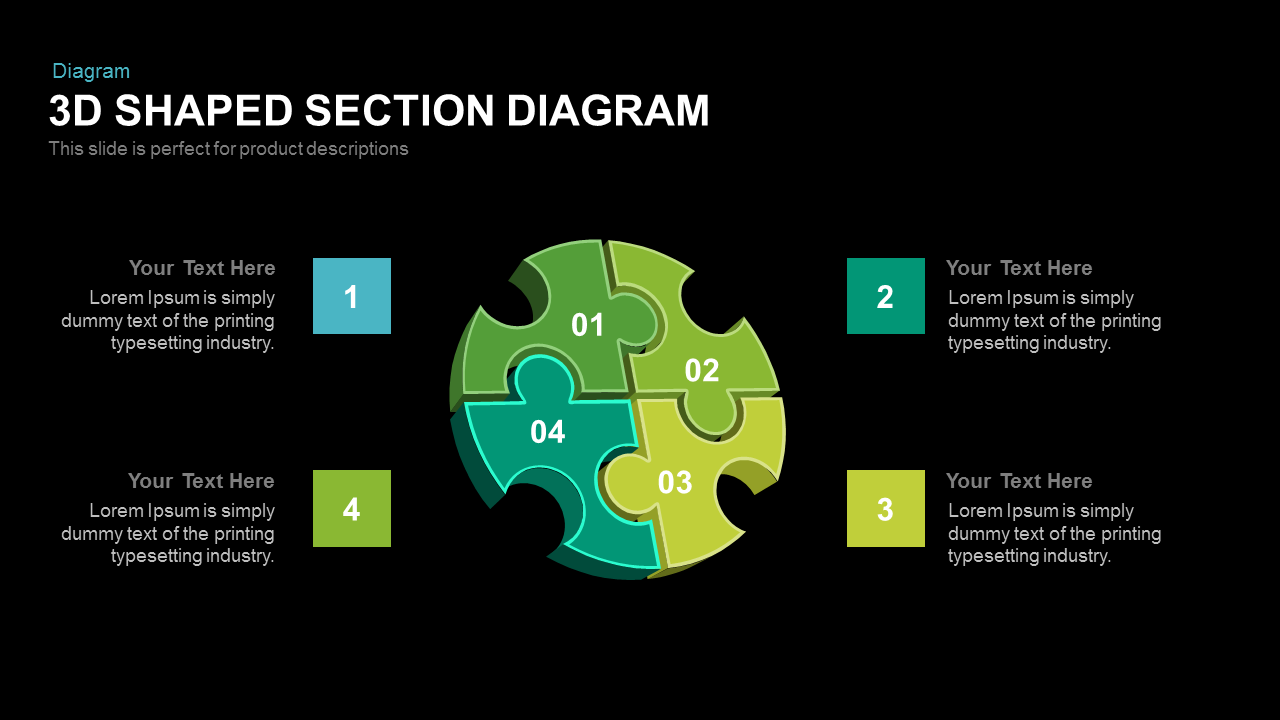
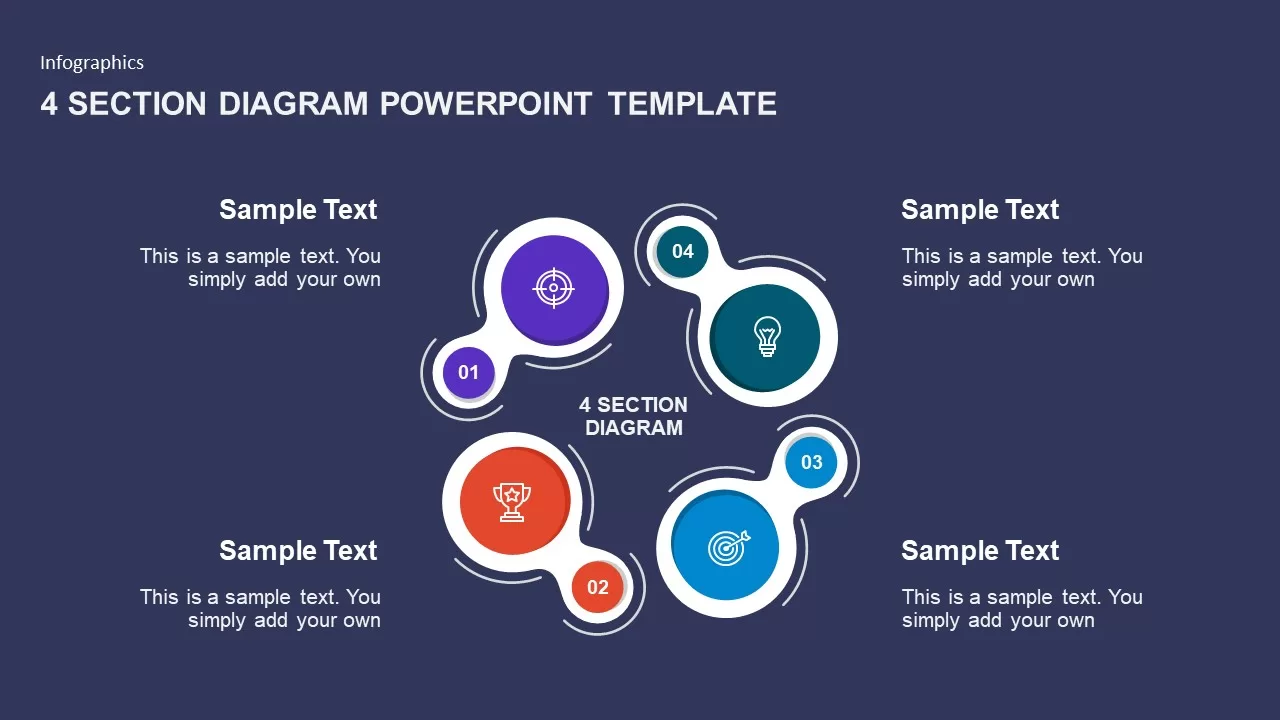
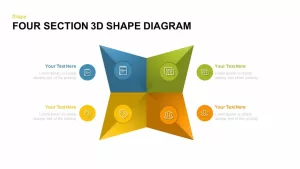
This 4-section 3D shape diagram slide showcases a central tetra-lobed form divided into four distinct gradient segments—blue, green, yellow, and orange—each housing an icon placeholder paired with a text field for descriptive labels. The angled facets and subtle shading create a polished three-dimensional effect that draws the eye inward to the geometric center, while circular icon markers positioned around the periphery link each quadrant to concise text blocks. The balanced symmetrical layout ensures equal emphasis across segments, making it ideal for illustrating quadrants, categories, or four-step cycles.
Packed with drag-and-drop icons, color swatches, and editable text boxes, this slide reduces preparation time and boosts presentation consistency, helping you convey your message with precision and style.
Built on master slides with fully editable vector shapes, users can customize gradient fills, swap icons, adjust text placeholders, and modify segment size with a single click. The neutral white background and clean sans-serif typography guarantee readability, and the modular components can be rearranged or recolored to match any corporate or brand theme. Compatible with PowerPoint and Google Slides, the slide maintains crisp resolution across platforms and supports rapid theme switching to integrate seamlessly with existing decks.
Beyond presenting four-part frameworks, this asset adapts effortlessly to diverse use cases. Use each segment to highlight product features, department functions, market segments, risk factors, or stakeholder roles. Duplicate or remove segments to expand or streamline the diagram, or overlay numbers and percentage values to convey metrics. Whether for executive briefings, marketing workshops, strategy sessions, or training modules, this 3D shape diagram slide transforms complex information into a cohesive, visually compelling narrative, fostering clarity and alignment across teams.
Who is it for
Business analysts, marketing managers, project leaders, and strategy consultants will benefit from this slide when presenting quadrant-based frameworks, segment analyses, or four-step processes. Trainers, educators, and facilitators can also leverage its clear structure for interactive workshops.
Other Uses
Repurpose this diagram to compare product tiers, map customer personas, illustrate SWOT quadrants, display risk categories, segment audiences, or outline step-by-step workflows in sales, HR, or operations contexts.
Login to download this file

Item ID
SB00637
Related Templates

Arrow Types Shape Library Editable Template for PowerPoint & Google Slides
Arrow
Shape Loop Four-Step Infographic Slide Template for PowerPoint & Google Slides
Process
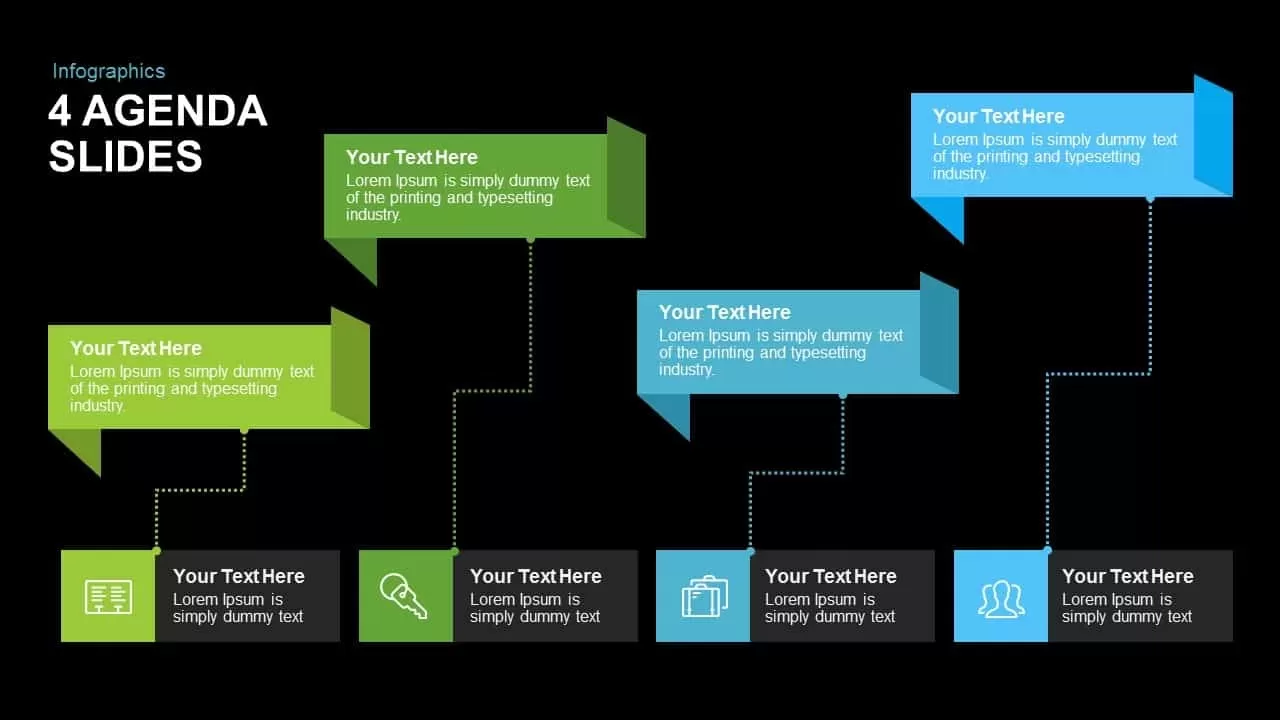
Editable Four-Point Timeline Agenda Template for PowerPoint & Google Slides
Agenda
Editable Four-Quadrant TOWS Matrix Template for PowerPoint & Google Slides
Opportunities Challenges
Four Section Comparison Chart Diagram Template for PowerPoint & Google Slides
Infographics
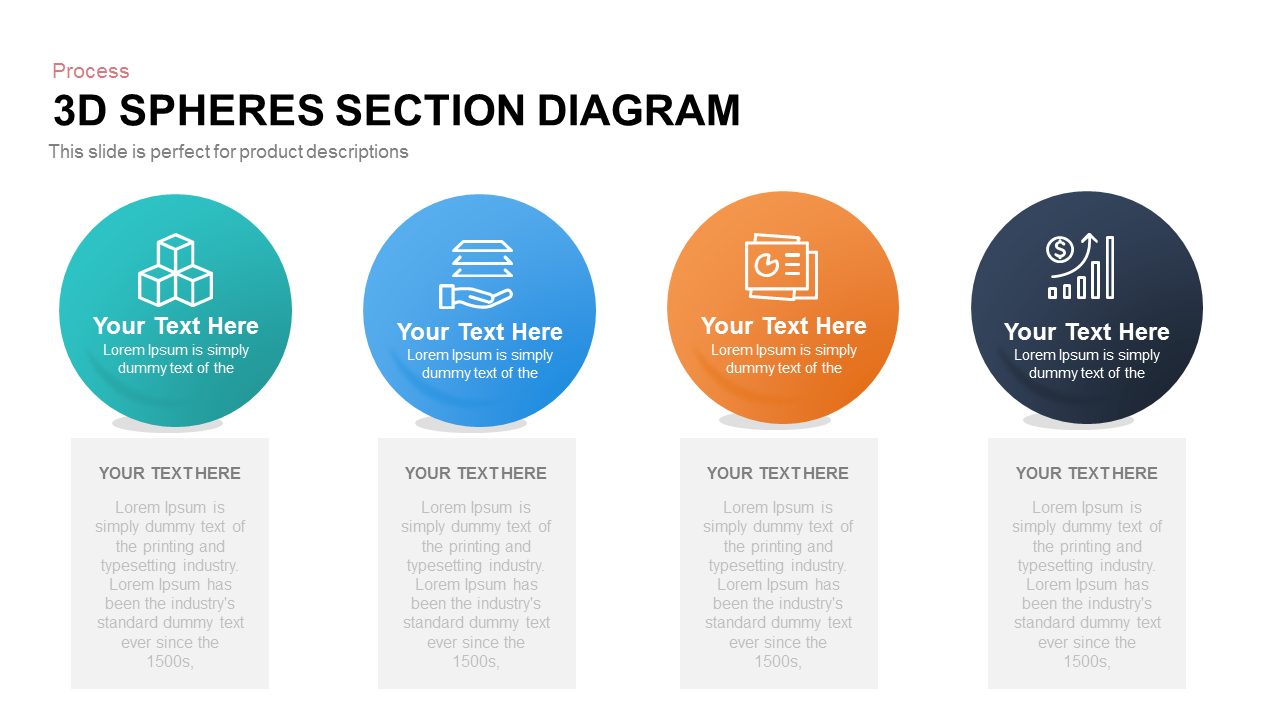
Four-Part 3D Spheres Section Diagram template for PowerPoint & Google Slides
Process

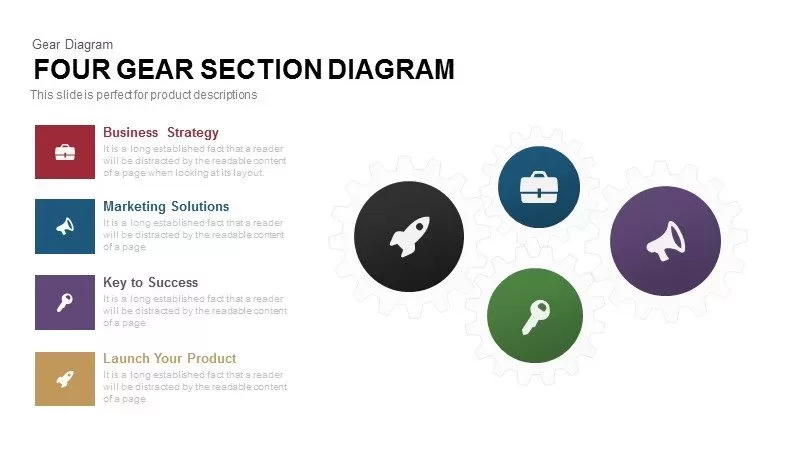
Four Gear Section Diagram Template for PowerPoint & Google Slides
Circular
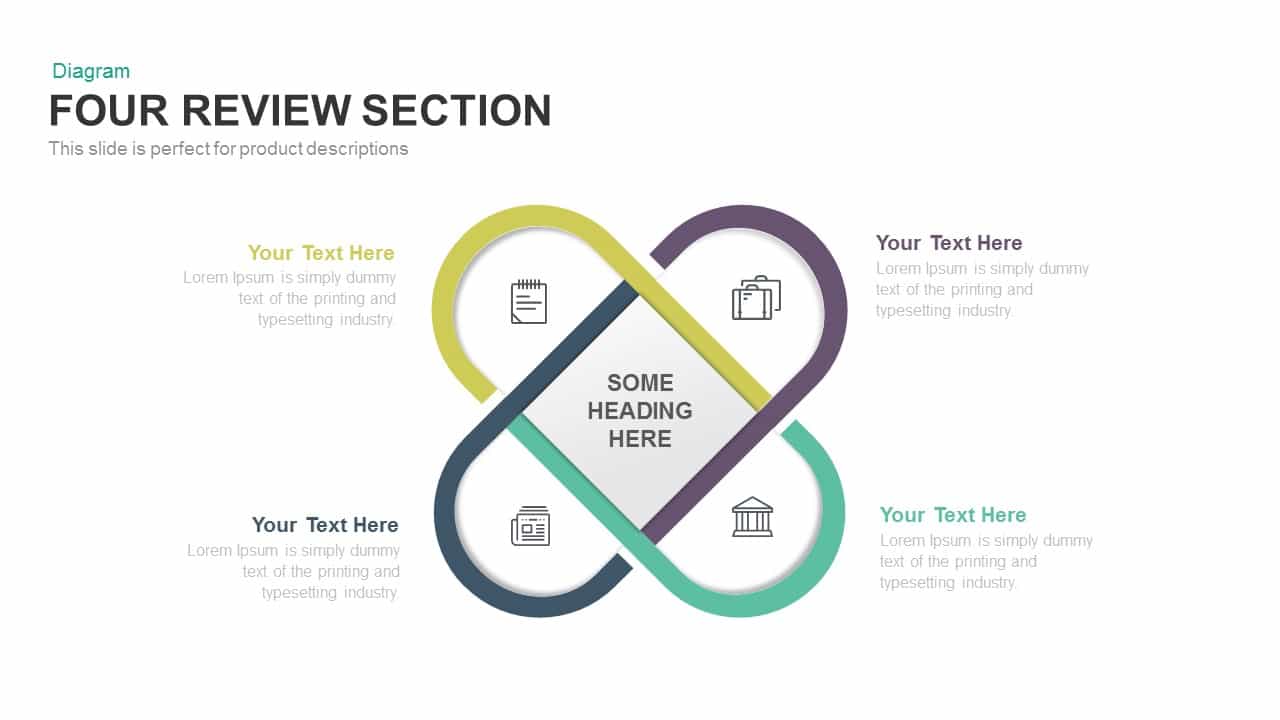
Clean Four-Section Review Diagram Template for PowerPoint & Google Slides
Agenda
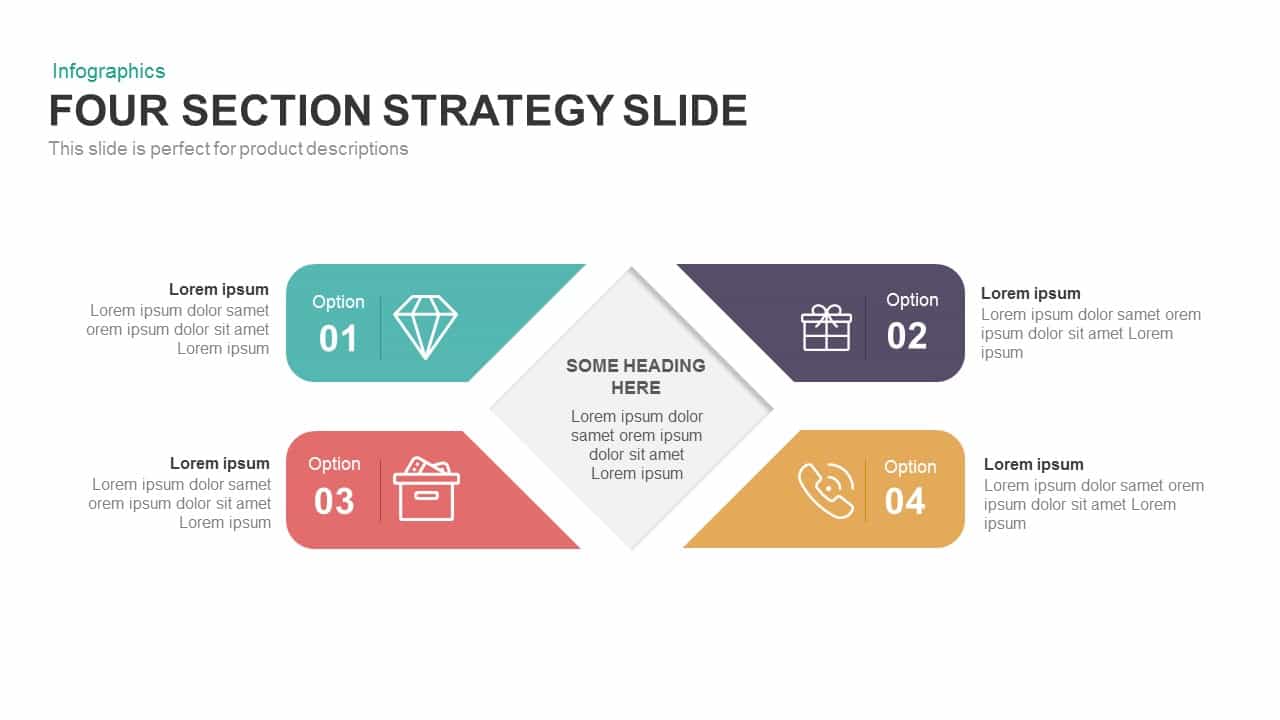
Four-Section Strategy Diagram Slide Template for PowerPoint & Google Slides
Business Strategy
Four-Section Arrow Infographic Diagram Template for PowerPoint & Google Slides
Arrow
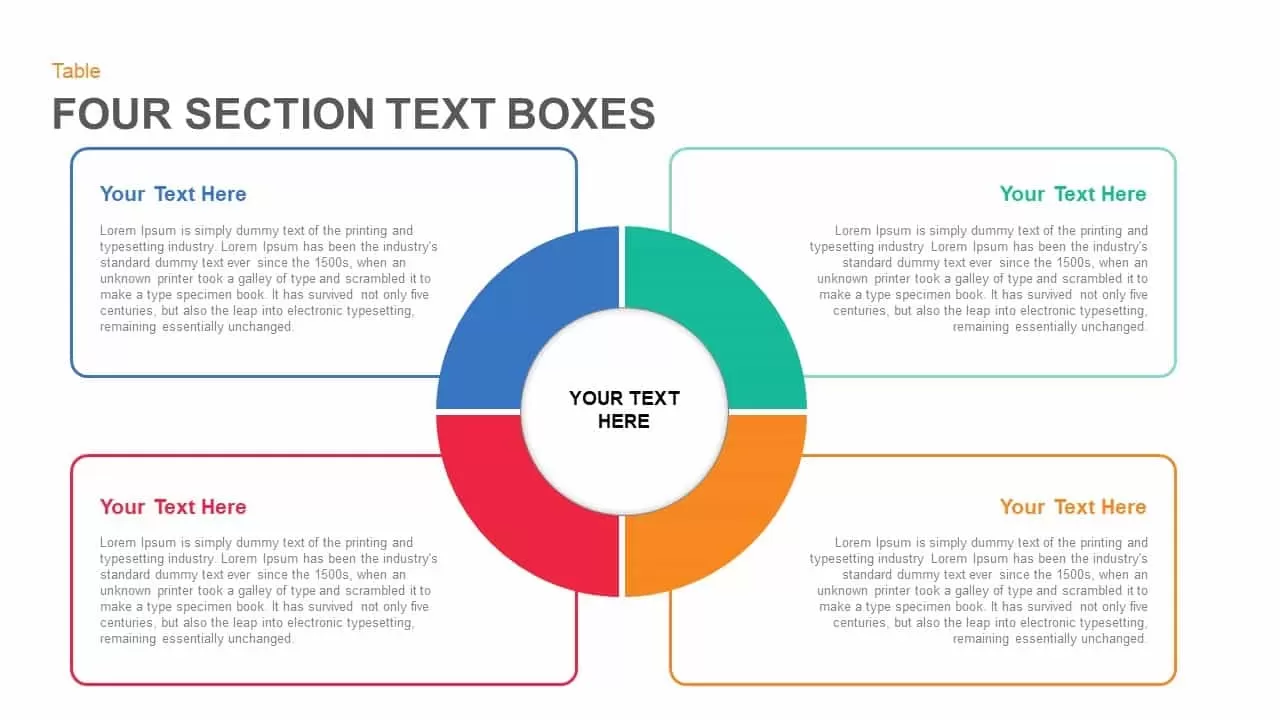
Four Section Circular Text Boxes Diagram Template for PowerPoint & Google Slides
Circular

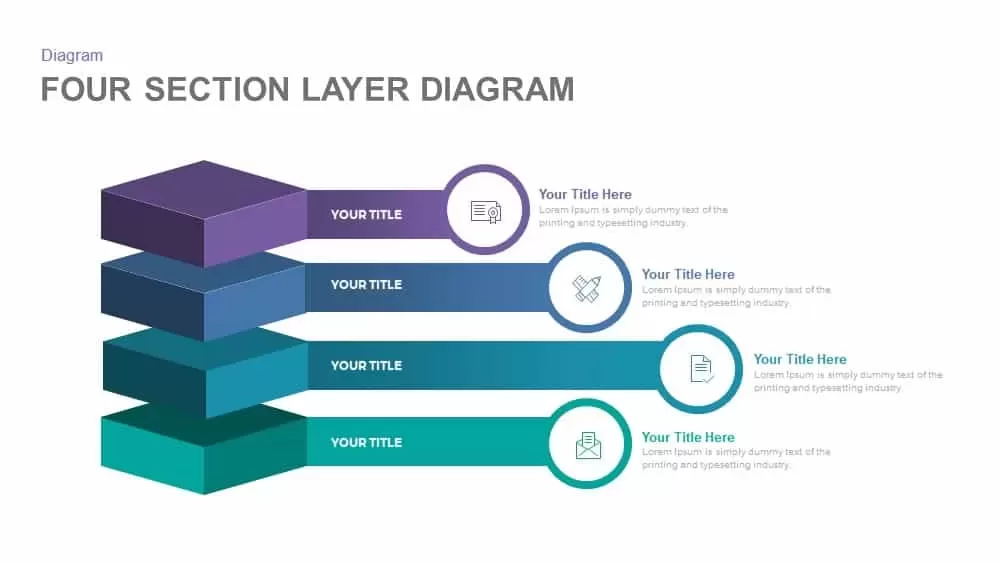
Professional Four-Section Layer Diagram Template for PowerPoint & Google Slides
Process
Four Section Diagram Infographics template for PowerPoint & Google Slides
Process

Four Section Infographic Diagram Template for PowerPoint & Google Slides
Circular
Four-Tag Section Ribbon Infographic Template for PowerPoint & Google Slides
Comparison
Four-Section Ribbon Infographics Template for PowerPoint & Google Slides
Process
Four-Section Colored Circle Infographic Template for PowerPoint & Google Slides
Circular
Four Section Medical Process template for PowerPoint & Google Slides
Process
Tablet Four-Section Menu Interface Template for PowerPoint & Google Slides
Agenda
Four-Section Table of Contents Template for PowerPoint & Google Slides
Agenda
3D Shape Linear Process Flow Diagram Template for PowerPoint & Google Slides
Process
Gauge Shape 5-Step Infographic Diagram Template for PowerPoint & Google Slides
Process
Puzzle Shape Diagram with Five Elements Template for PowerPoint & Google Slides
Circular
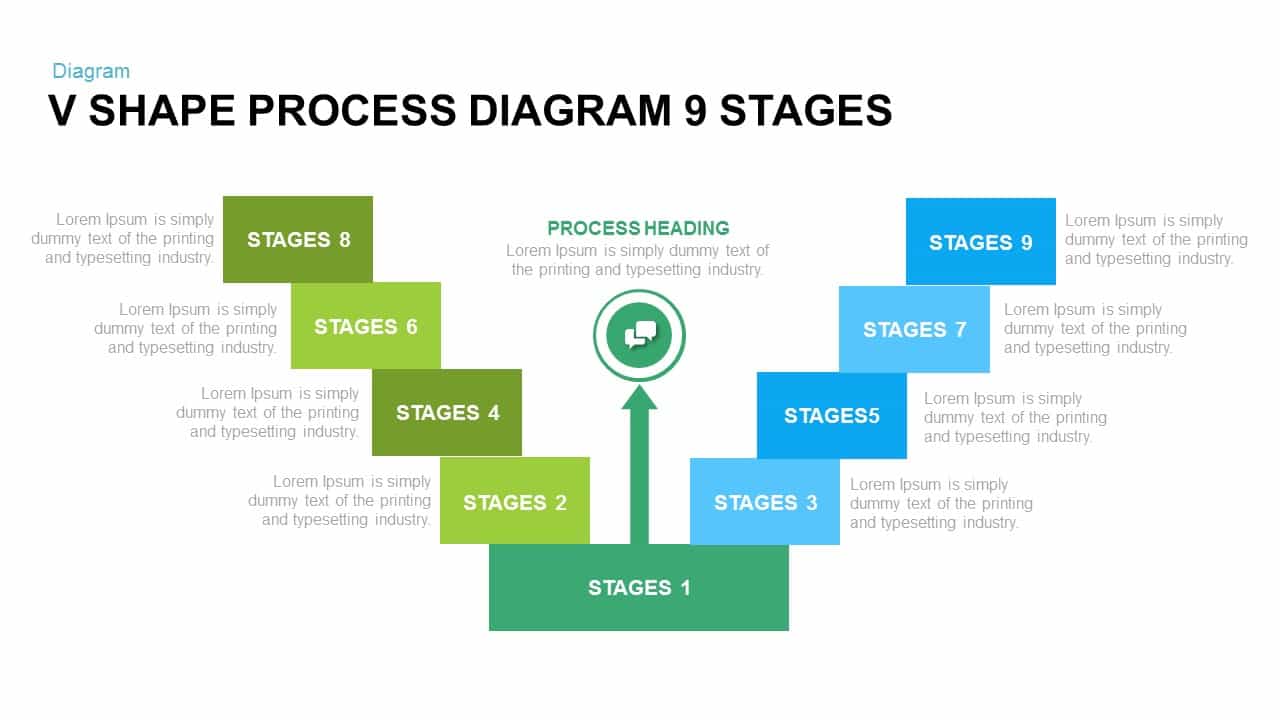
V Shape Process Diagram 9 Stages for PowerPoint & Google Slides
Infographics
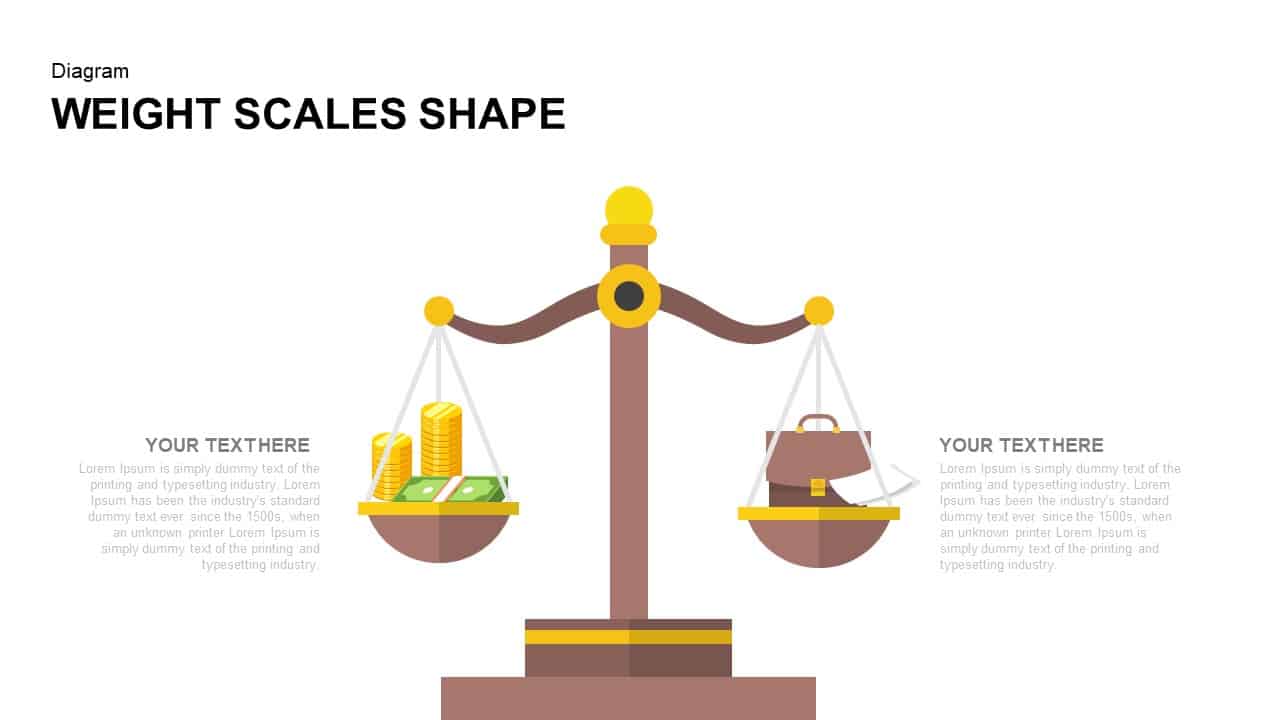
Weight Scales Shape Diagram for PowerPoint & Google Slides
Comparison

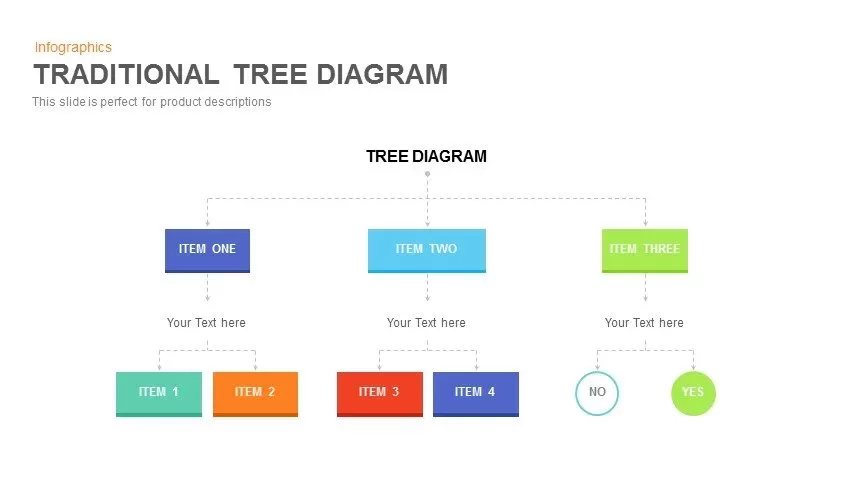
Editable Hierarchical Tree Diagram Template for PowerPoint & Google Slides
Decision Tree
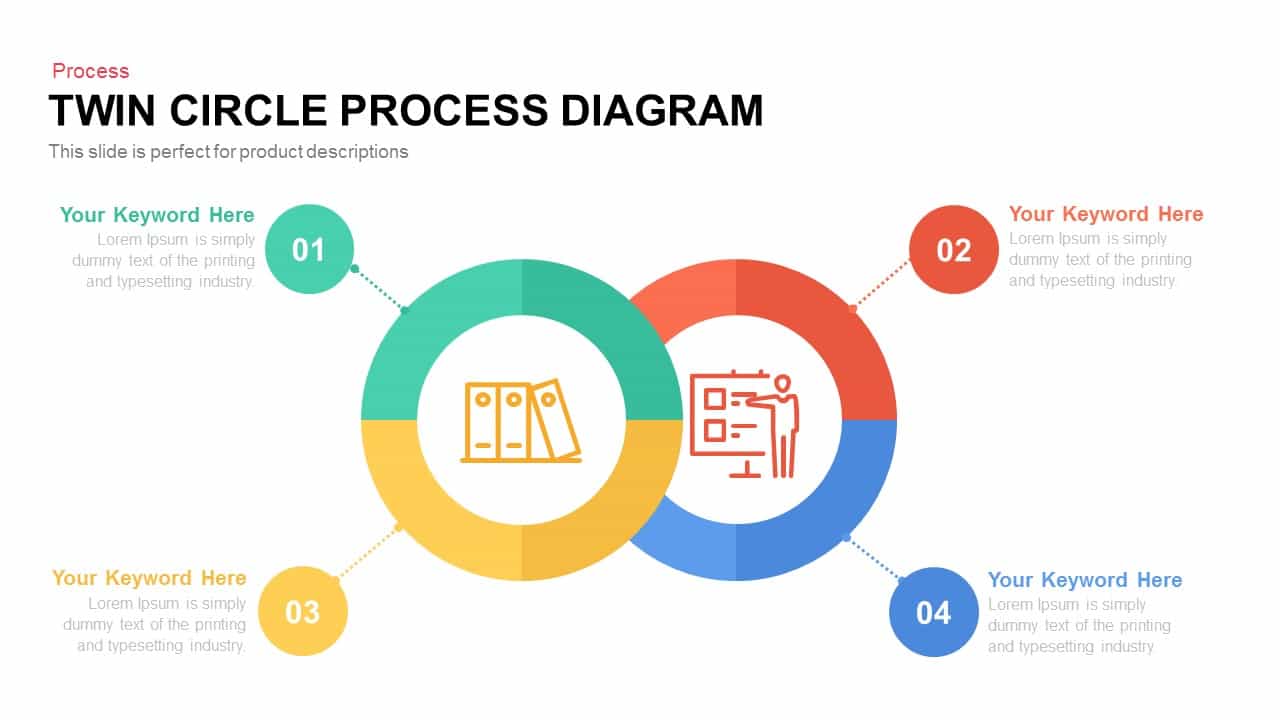
Editable Twin Circle Process Diagram Template for PowerPoint & Google Slides
Process
Editable Force Field Analysis Diagram Template for PowerPoint & Google Slides
Business Plan
Editable Six-Level 3D Pyramid Diagram Template for PowerPoint & Google Slides
Pyramid
Editable Six-Step Bubble Process Diagram Template for PowerPoint & Google Slides
Process
Editable Plant Growth Stages Diagram Template for PowerPoint & Google Slides
Process
Editable SIPOC Process Diagram Deck Template for PowerPoint & Google Slides
Pitch Deck
Free Editable Family Tree Genealogy Diagram Template for PowerPoint & Google Slides
Org Chart
Free
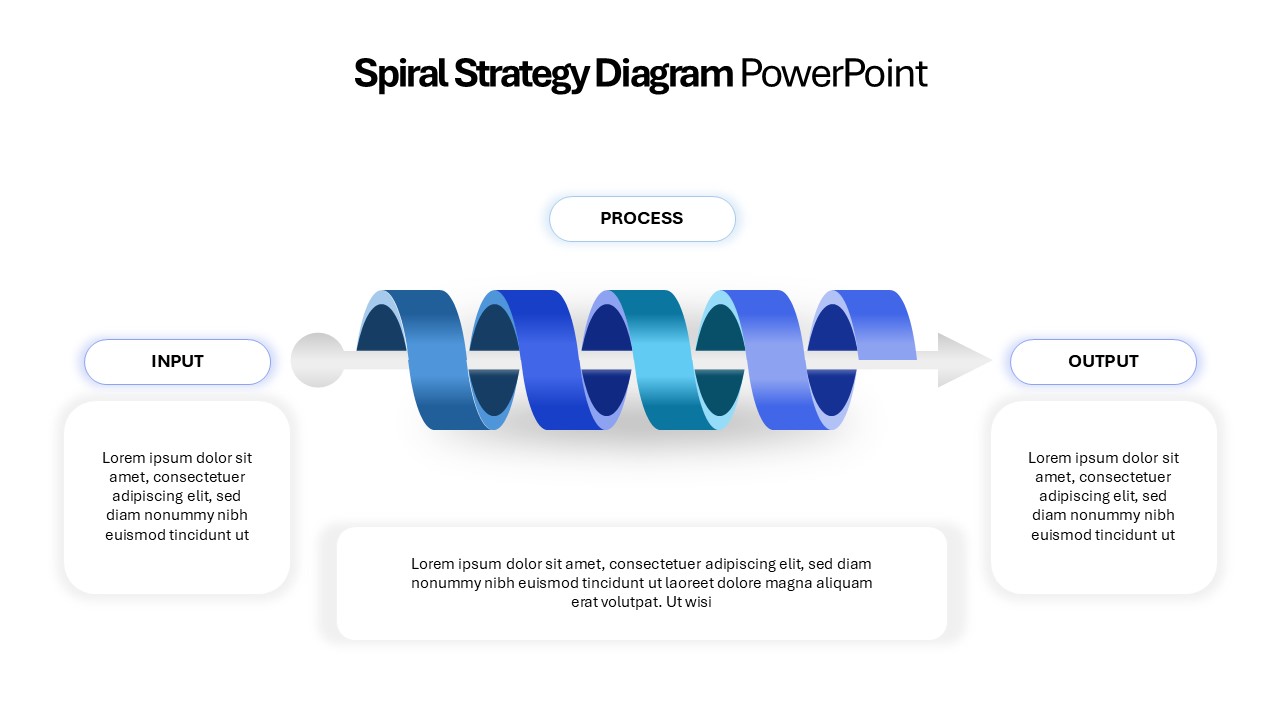
Editable 3D Spiral Strategy Diagram Template for PowerPoint & Google Slides
Process
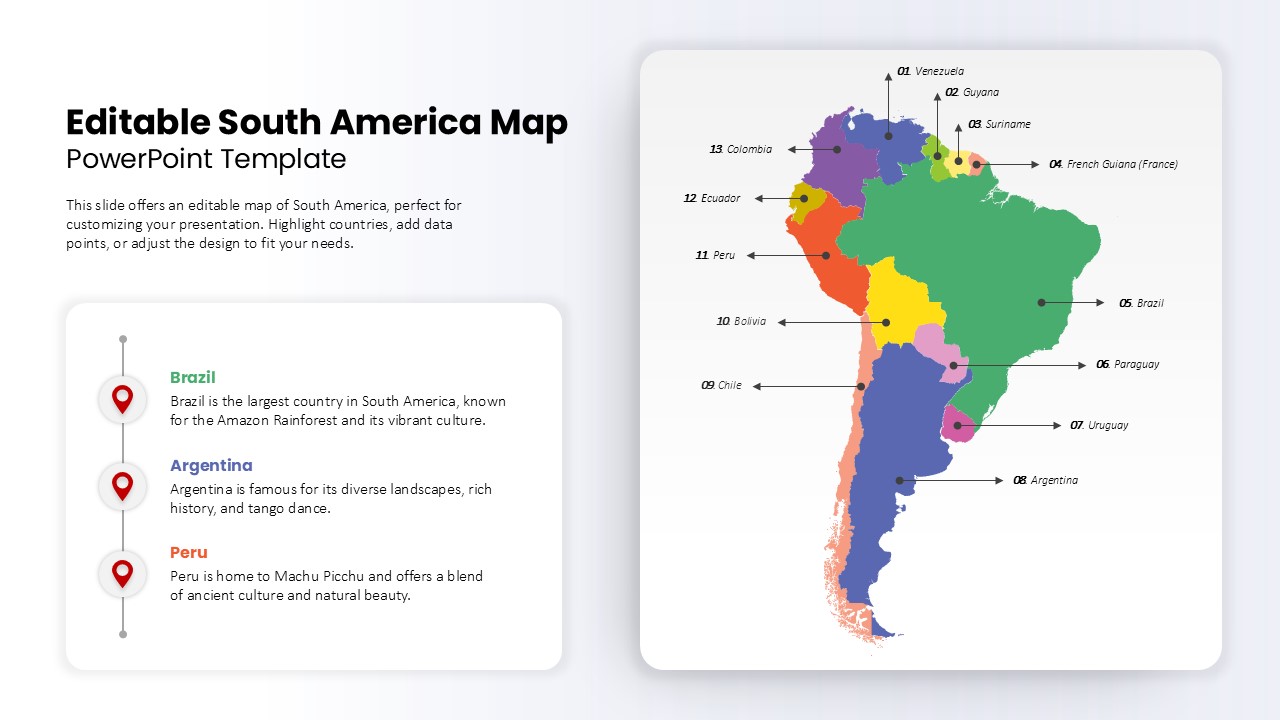
Editable South America Map Diagram Template for PowerPoint & Google Slides
Maps
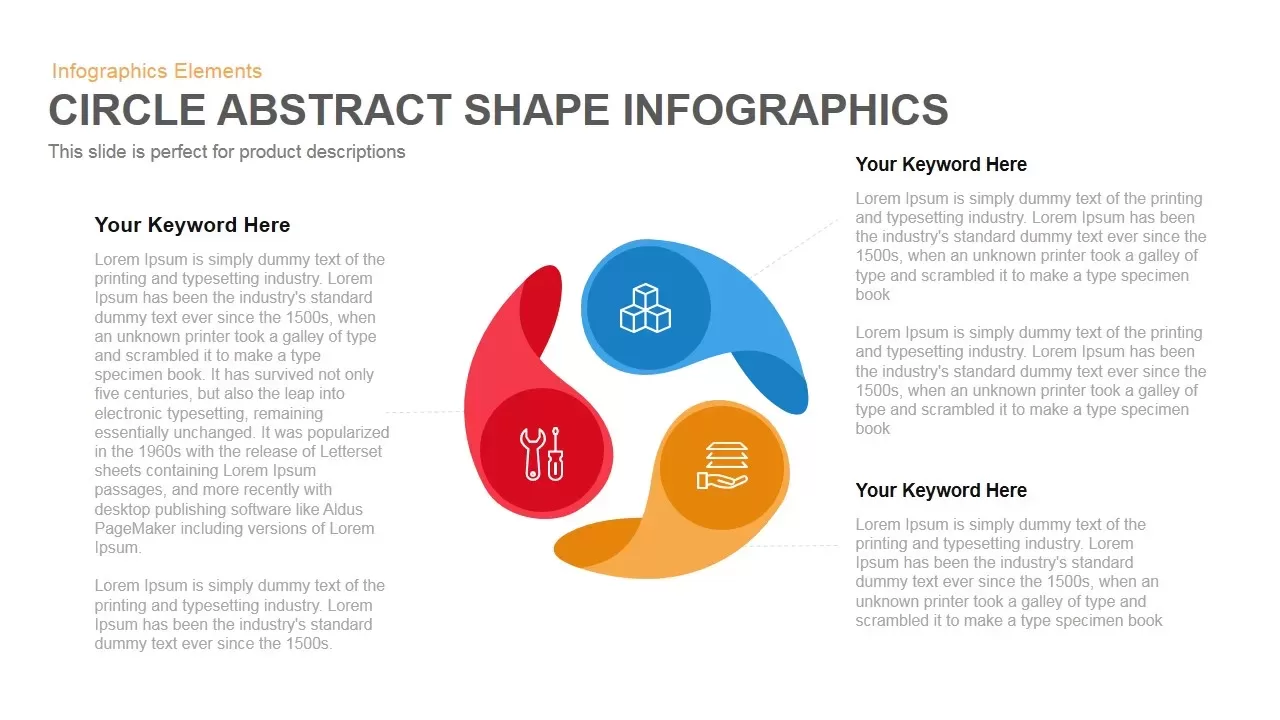
Circle Abstract Shape Infographics Template for PowerPoint & Google Slides
Circular
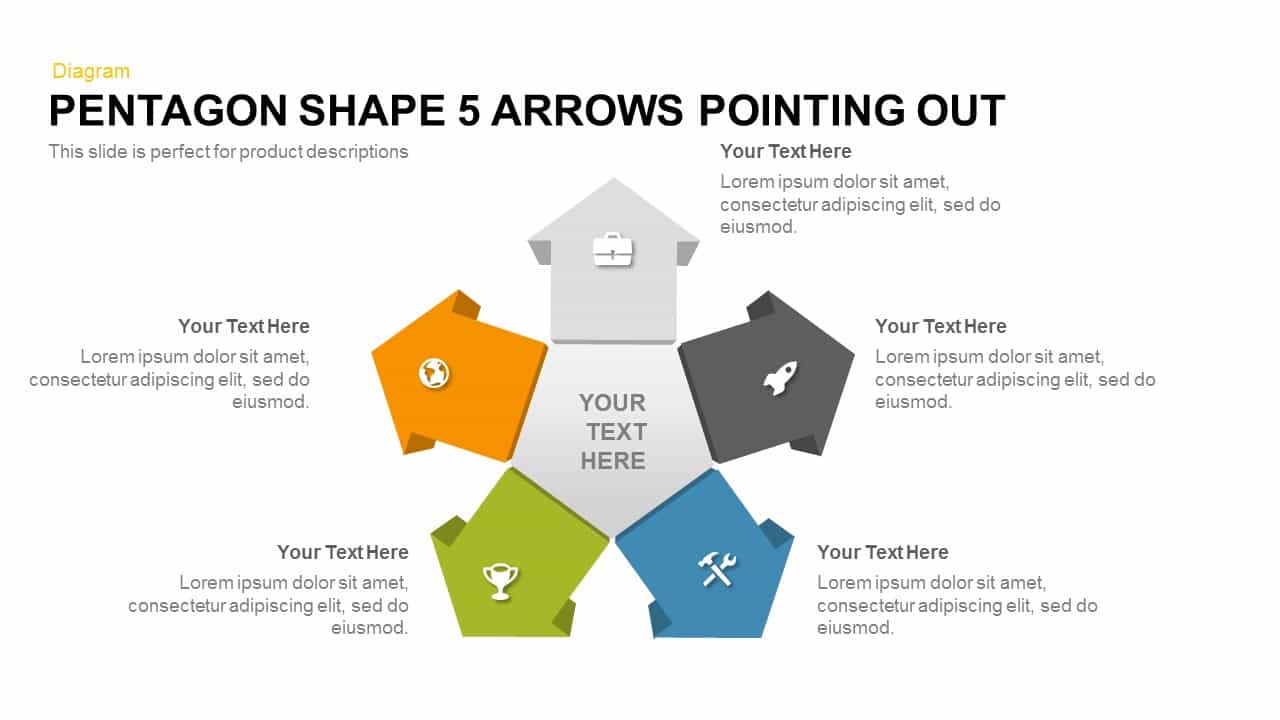
Pentagon Shape 5 Arrows Pointing Out template for PowerPoint & Google Slides
Arrow
3D Segmented Shape Infographic Template for PowerPoint & Google Slides
Circular
Versatile 3D Modular Shape Infographics Template for PowerPoint & Google Slides
Infographics
Strategic Initiatives Pill Shape Slide Template for PowerPoint & Google Slides
Pitch Deck
Fluid-Shape Cover Slide Template for PowerPoint & Google Slides
Company Profile
Stopwatch Shape Infographics for PowerPoint & Google Slides
Process
Editable Colorful Daily Agenda Slides Template for PowerPoint & Google Slides
Agenda
Editable Colombia Map PowerPoint Template for PowerPoint & Google Slides
Business Models

Fully Editable Gantt Chart Timeline template for PowerPoint & Google Slides
Gantt Chart
Editable Tajikistan Provinces Map Pack Template for PowerPoint & Google Slides
Maps
Editable Pillars Infographics Pack Template for PowerPoint & Google Slides
Infographics
Free Editable Check Box Icon Set Presentation Template for PowerPoint & Google Slides
Infographics
Free
Fully Editable World Map Infographic Template for PowerPoint & Google Slides
World Maps
Editable World Map Callout Infographic Template for PowerPoint & Google Slides
World Maps
Editable World Map Callout Infographic Template for PowerPoint & Google Slides
World Maps
Editable Buyer Persona Profile Slide Template for PowerPoint & Google Slides
Customer Journey

Editable 2024 Calendar Yearly Overview Template for PowerPoint & Google Slides
Decks
Editable One-Pager Business Plan Slide Template for PowerPoint & Google Slides
Business Plan
Weekly Social Media Calendar Editable Template for PowerPoint & Google Slides
Digital Marketing
Editable Monthly Timeline Infographic Template for PowerPoint & Google Slides
Timeline
Professional Editable 6 Month Timeline Template for PowerPoint & Google Slides
Timeline
Editable C-Suite Organizational Chart Template for PowerPoint & Google Slides
Org Chart
Free Editable Saudi Arabia Map Template for PowerPoint & Google Slides
World Maps
Free Editable U.S. Map with Regional Metrics Template for PowerPoint & Google Slides
World Maps
Free
Free Editable Simple Column Chart Slide Template for PowerPoint & Google Slides
Bar/Column
Free
Editable Sales Pitch Deck Presentation Template for PowerPoint & Google Slides
Pitch Deck
Editable Multi-Series Peak Line Chart Template for PowerPoint & Google Slides
Comparison Chart
Editable Africa Map Infographic Data Template for PowerPoint & Google Slides
World Maps
Free Editable Multi-Step Ribbon Agenda Slide Template for PowerPoint & Google Slides
Agenda
Free
Editable Ireland Map Infographic Slide Template for PowerPoint & Google Slides
World Maps
Free
Fully Editable Retro Vintage Theme Deck Template for PowerPoint & Google Slides
Company Profile
Fully Editable Career Journey Roadmap Template for PowerPoint & Google Slides
Customer Journey
Free
Fully Editable Watercolor Theme Deck Template for PowerPoint & Google Slides
Pitch Deck
Europe Map with Six Editable Points Template for PowerPoint & Google Slides
World Maps
Editable Greece Map for PowerPoint & Google Slides
Maps
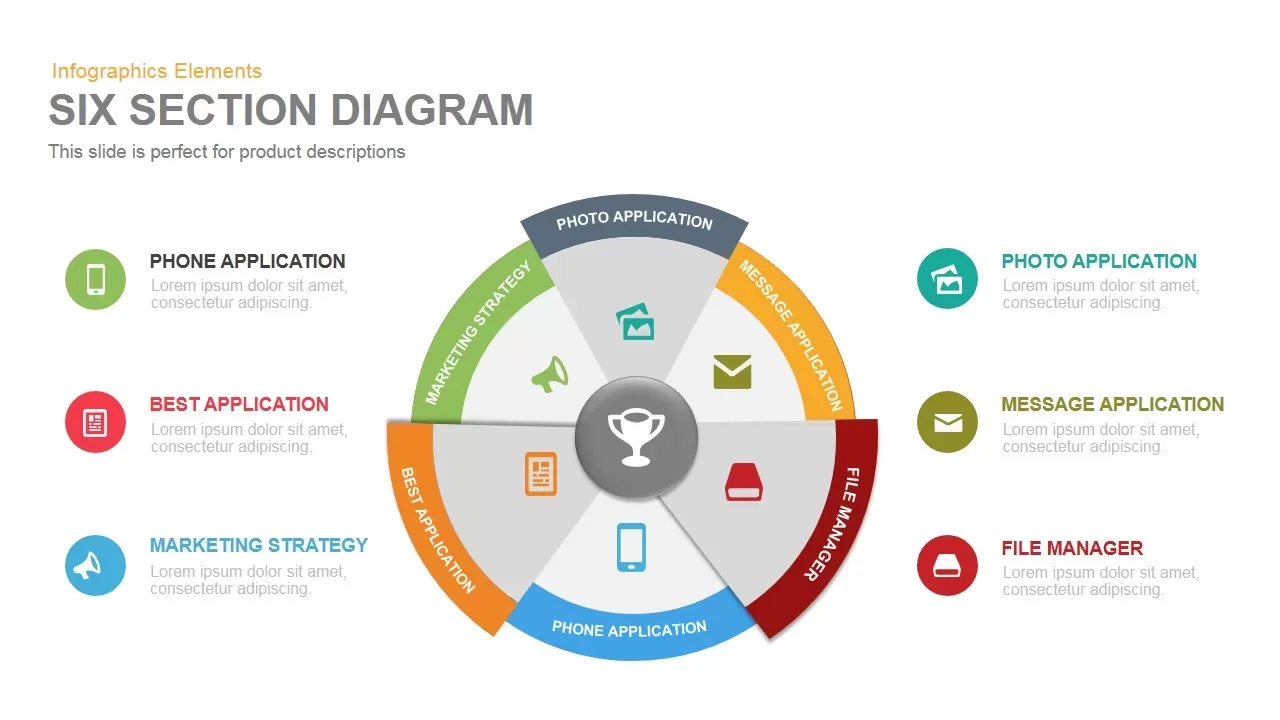
Six Section Diagram template for PowerPoint & Google Slides
Circular
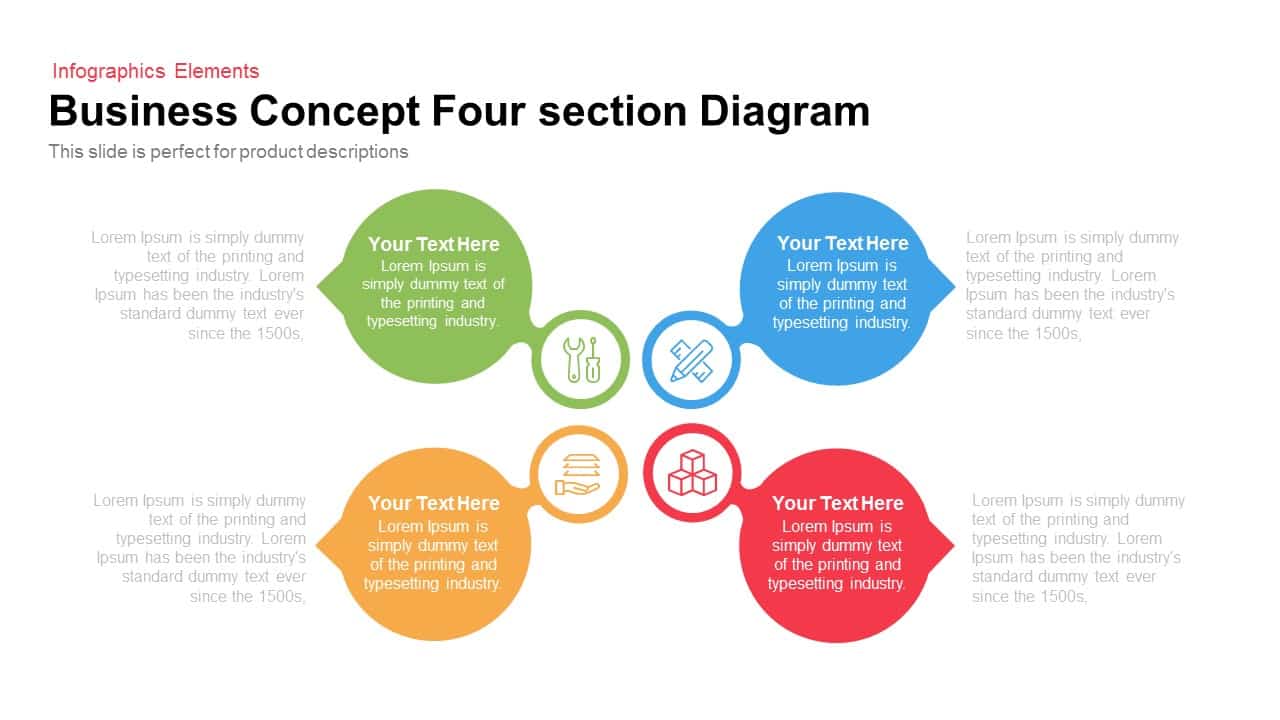
Business Concept 4 section Diagram template for PowerPoint & Google Slides
Infographics
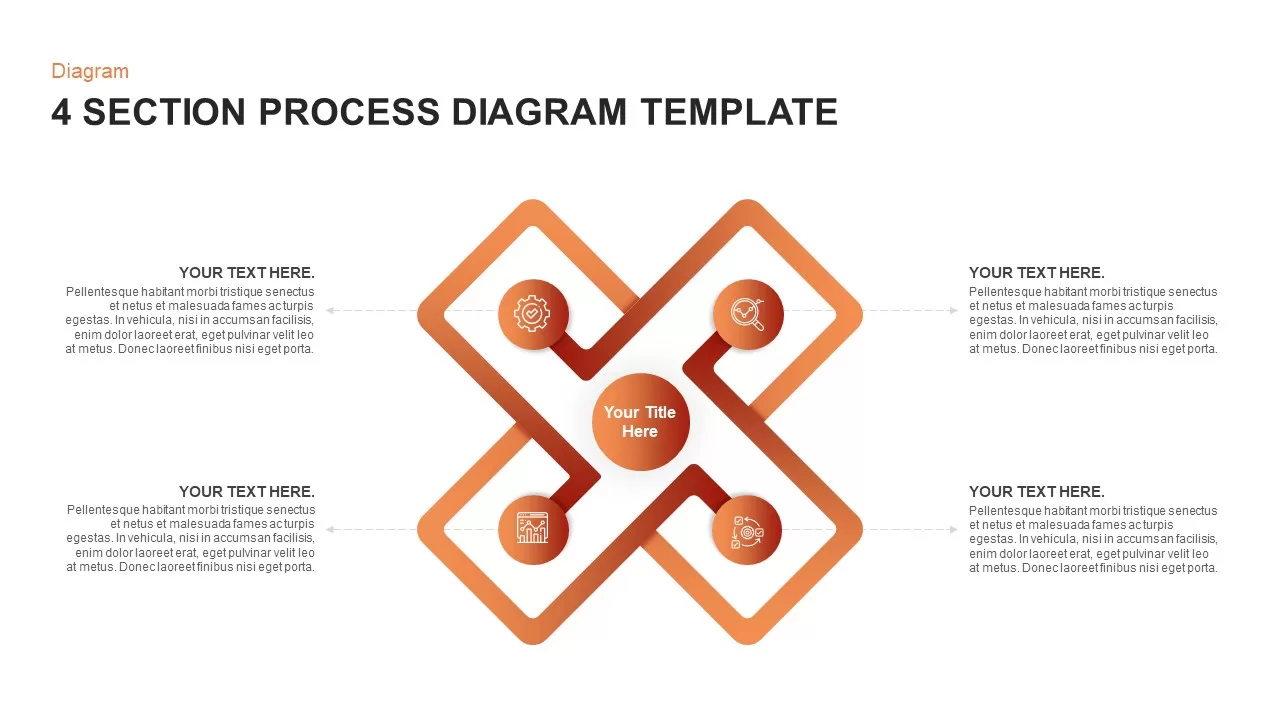
4 Section Pipe Diagram Process Flow Template for PowerPoint & Google Slides
Process
Three-Section Fishbone Process Diagram template for PowerPoint & Google Slides
Process
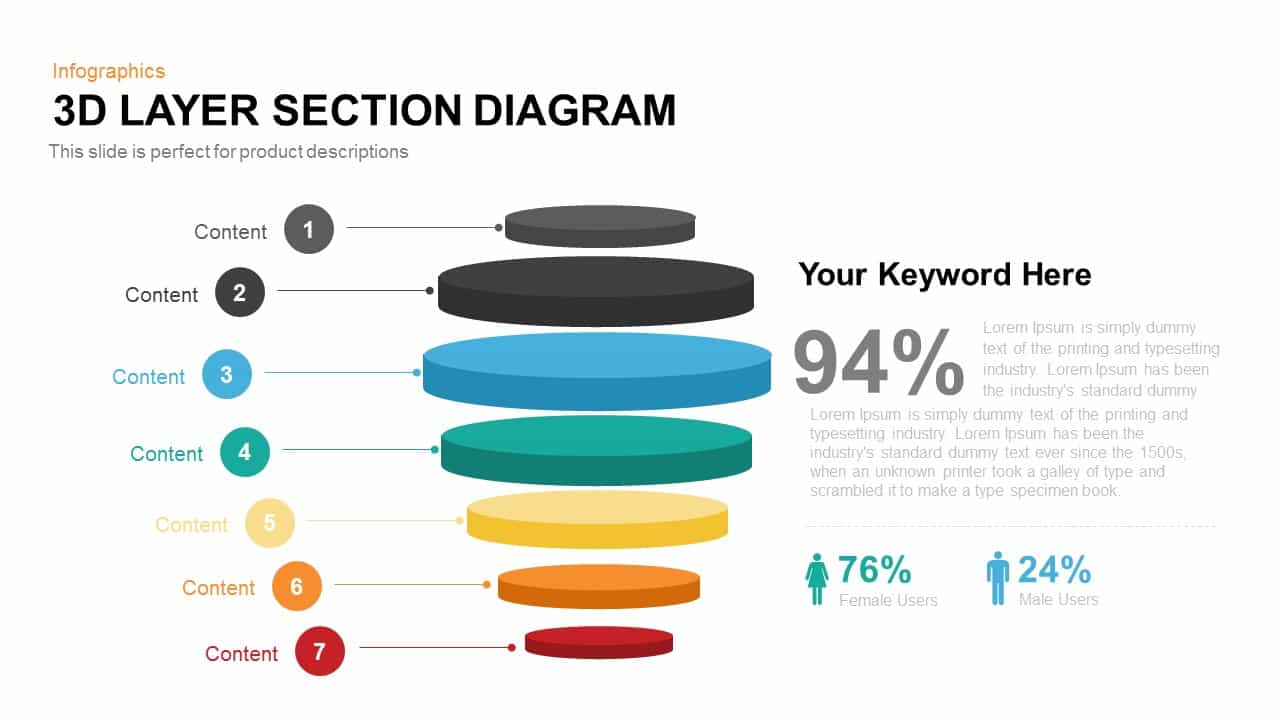
Modern 3D Layer Section Diagram Template for PowerPoint & Google Slides
Circular
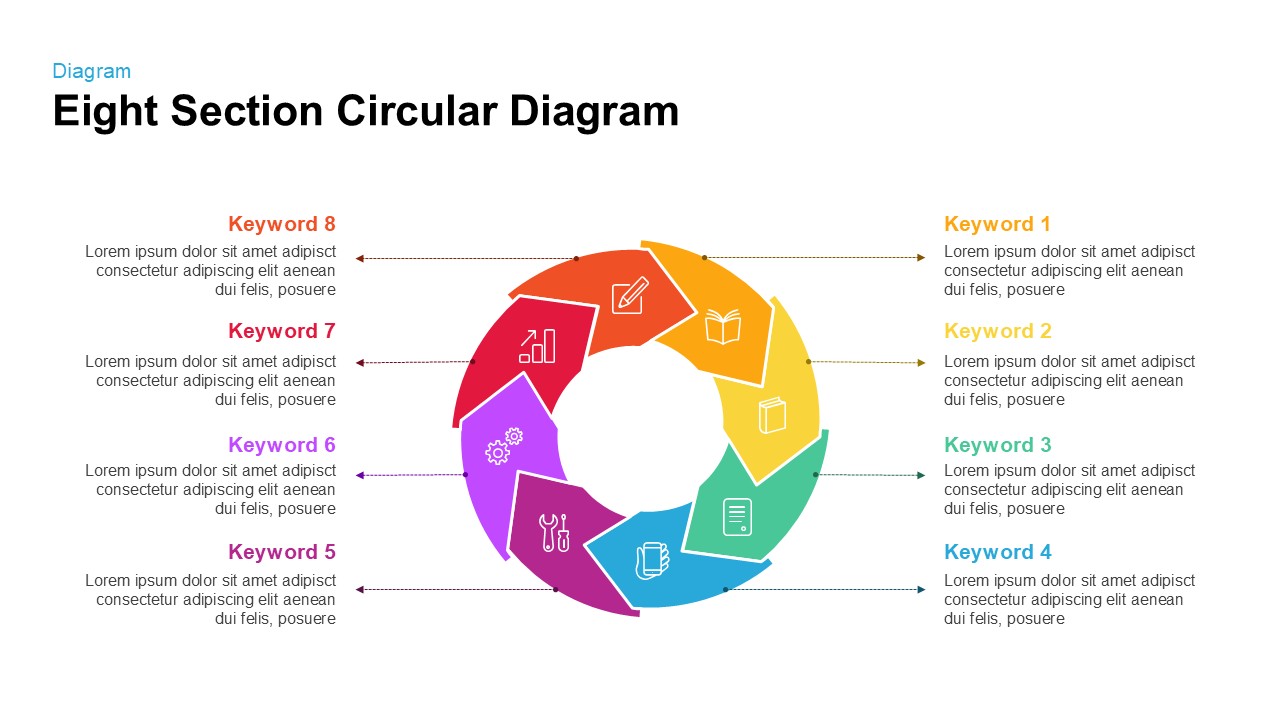
Eight Section Circular Diagram Template for PowerPoint & Google Slides
Circular
Eight Section Circular Diagram Template for PowerPoint & Google Slides
Circular
Six Section Circular Infographic Diagram Template for PowerPoint & Google Slides
Circular
Section Diagram Elements Infographic Template for PowerPoint & Google Slides
Process
Section Diagram template for PowerPoint & Google Slides
Circular
Eight-Section Circular Diagram template for PowerPoint & Google Slides
Circular
8-Section Split Diagram with Hub Icon template for PowerPoint & Google Slides
Circular
3D Shaped Section Diagram template for PowerPoint & Google Slides
Infographics
3 Stage Section Process Diagram Template for PowerPoint & Google Slides
Process
Five-Section Circular Arrow Diagram Template for PowerPoint & Google Slides
Circular
Business Section Diamond Process Diagram Template for PowerPoint & Google Slides
Process
Five-Section Arrow Signpost Diagram Template for PowerPoint & Google Slides
Arrow
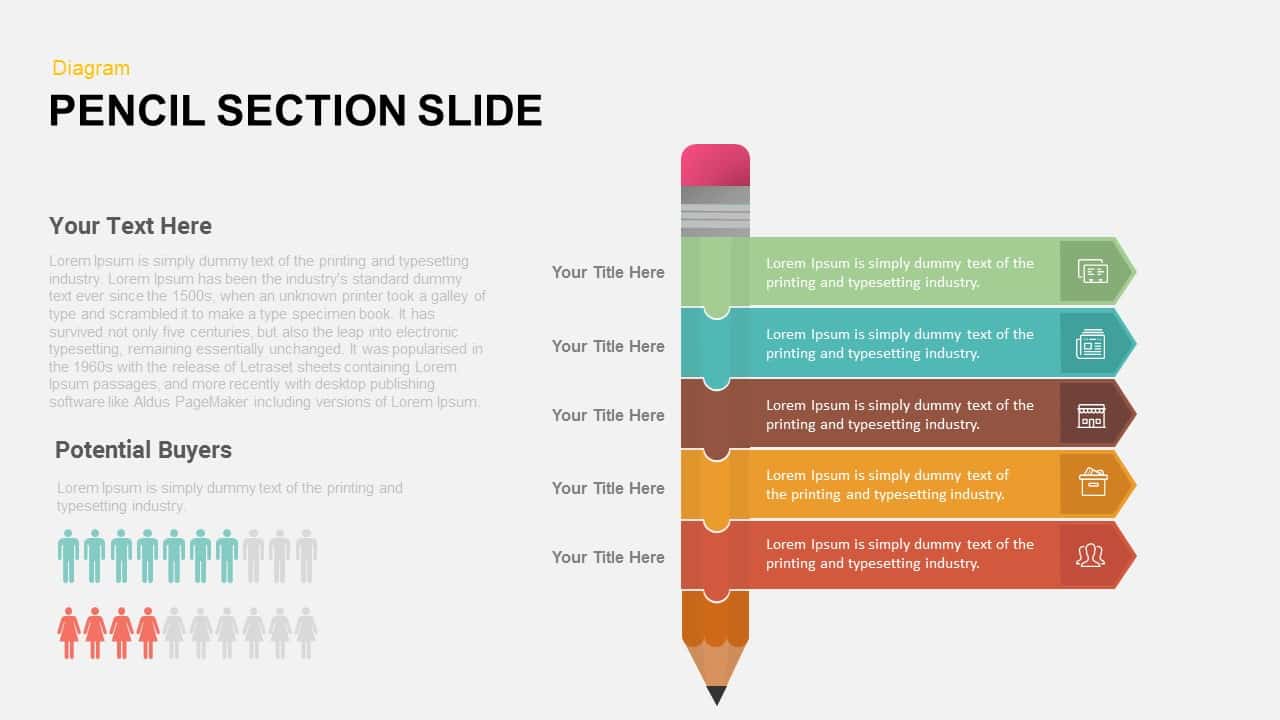
Pencil Section Five-Part Diagram Template for PowerPoint & Google Slides
Process
Modern Multi-Section Circle Diagram Template for PowerPoint & Google Slides
Circular
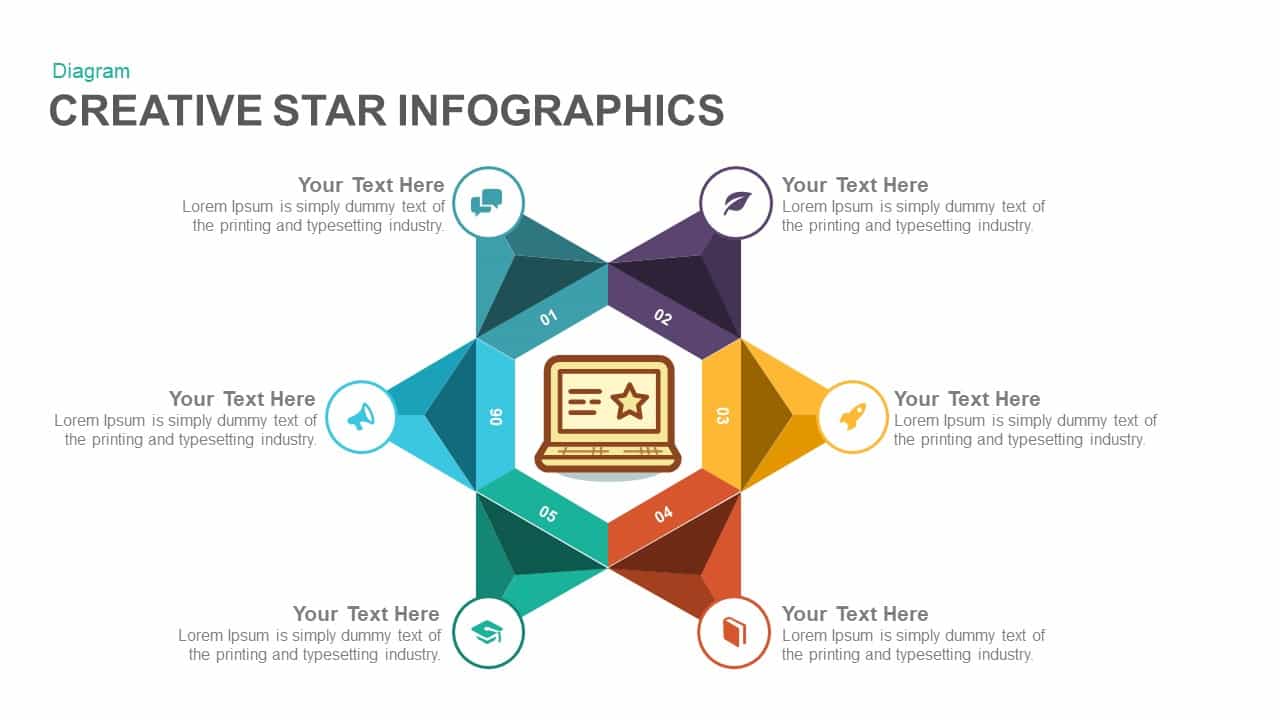
Six-Section Star Infographic Diagram Template for PowerPoint & Google Slides
Circular
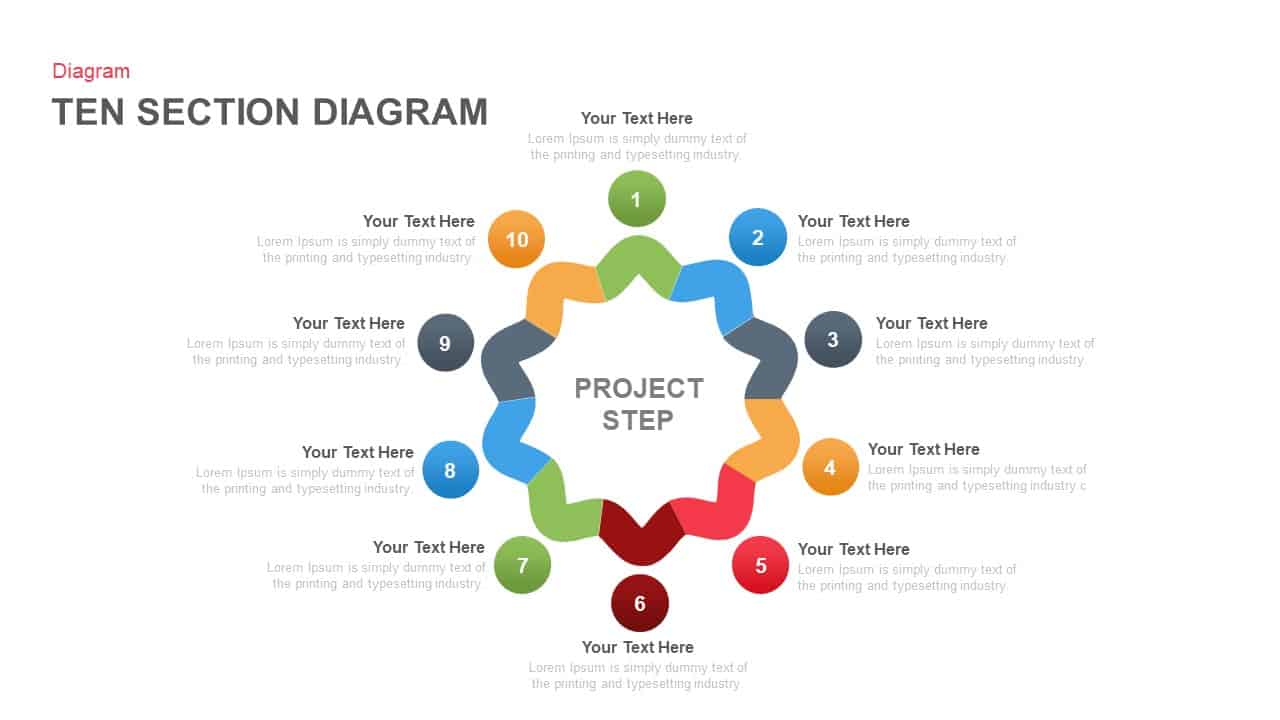
Ten-Section Project Steps Diagram Template for PowerPoint & Google Slides
Process
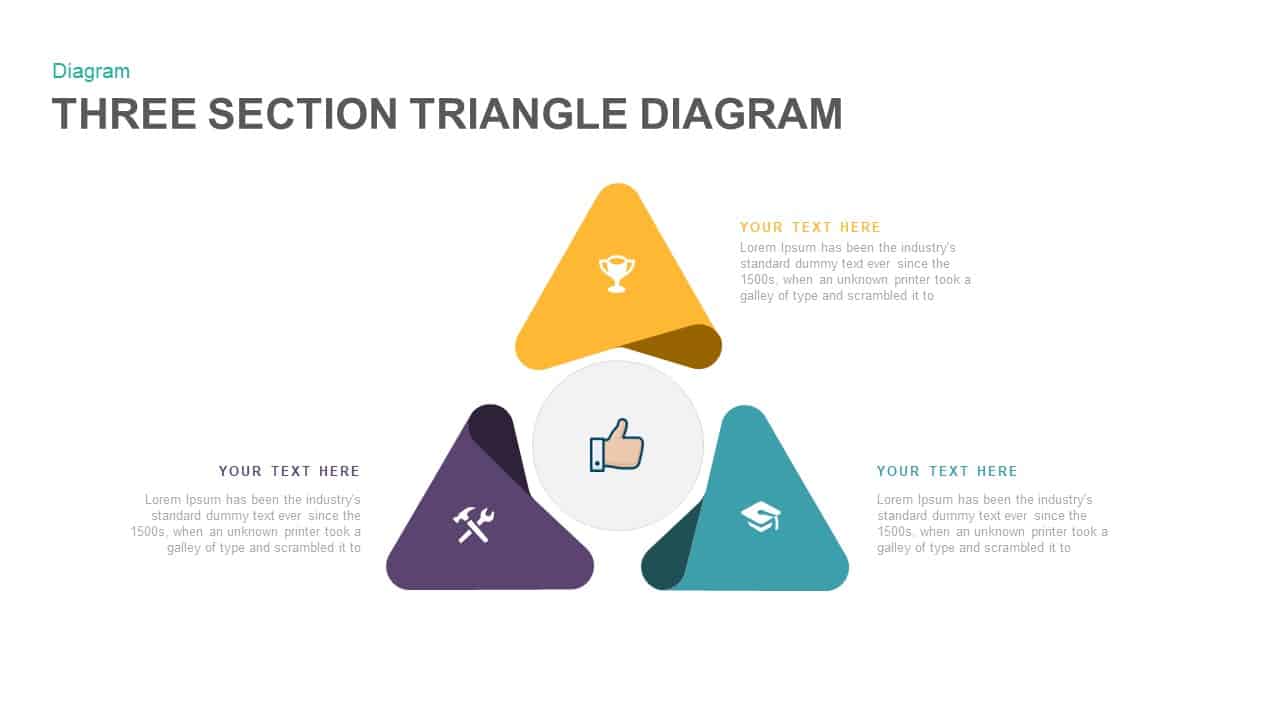
Three Section Triangle Diagram Template for PowerPoint & Google Slides
Process
Three-Section Triangle Diagram Template for PowerPoint & Google Slides
Pyramid
Three Section Triangle Diagram Template for PowerPoint & Google Slides
Process
3 Section Infographic Diagram Template for PowerPoint & Google Slides
Process
4 Section Diagram template for PowerPoint & Google Slides
Infographics
Modern 4 Section Process Diagram Template for PowerPoint & Google Slides
Process
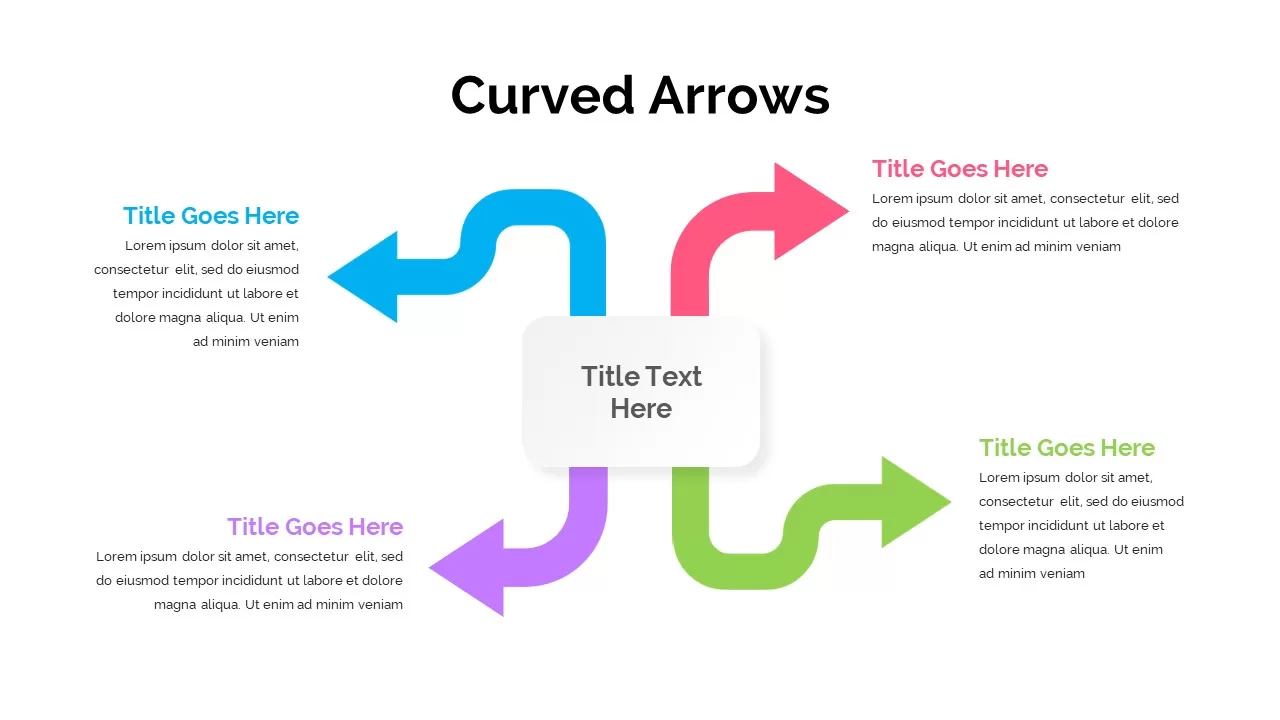
Four-Arrow Curved Hub-and-Spoke Diagram Template for PowerPoint & Google Slides
Arrow
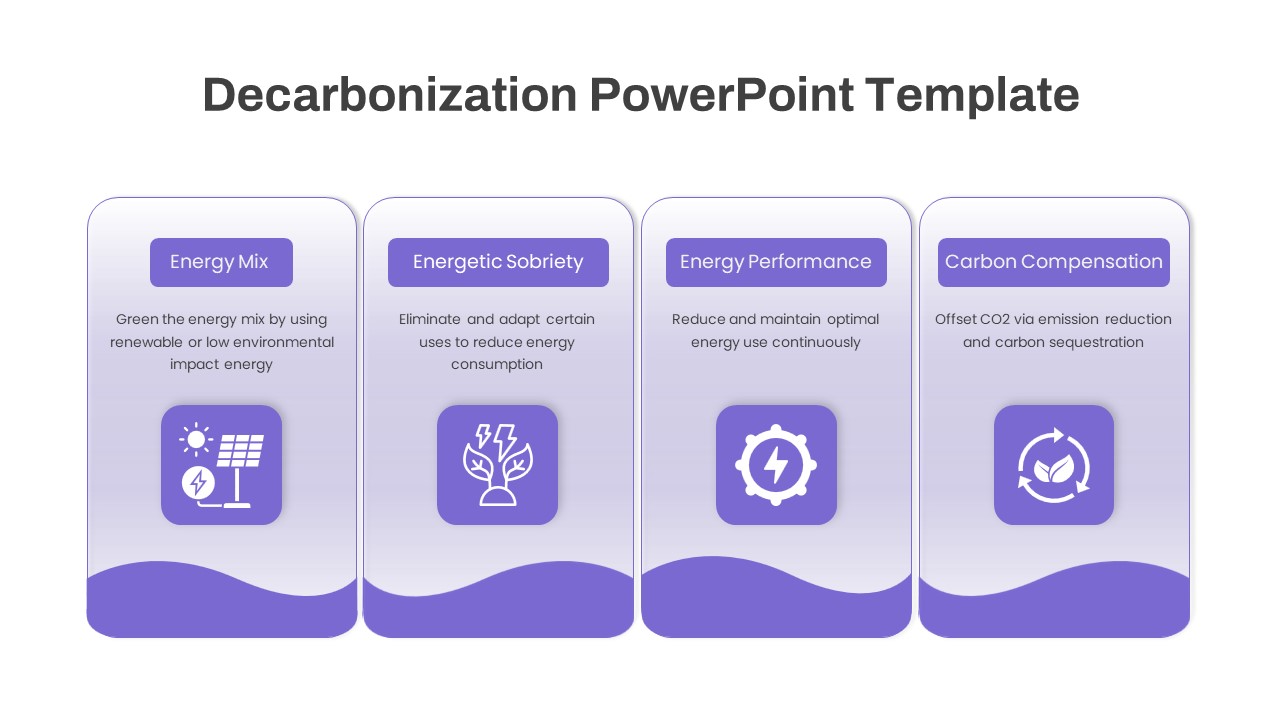
Four-Phase Decarbonization Diagram Template for PowerPoint & Google Slides
Process