Fishbone (Ishikawa) Diagram for PowerPoint & Google Slides
Description
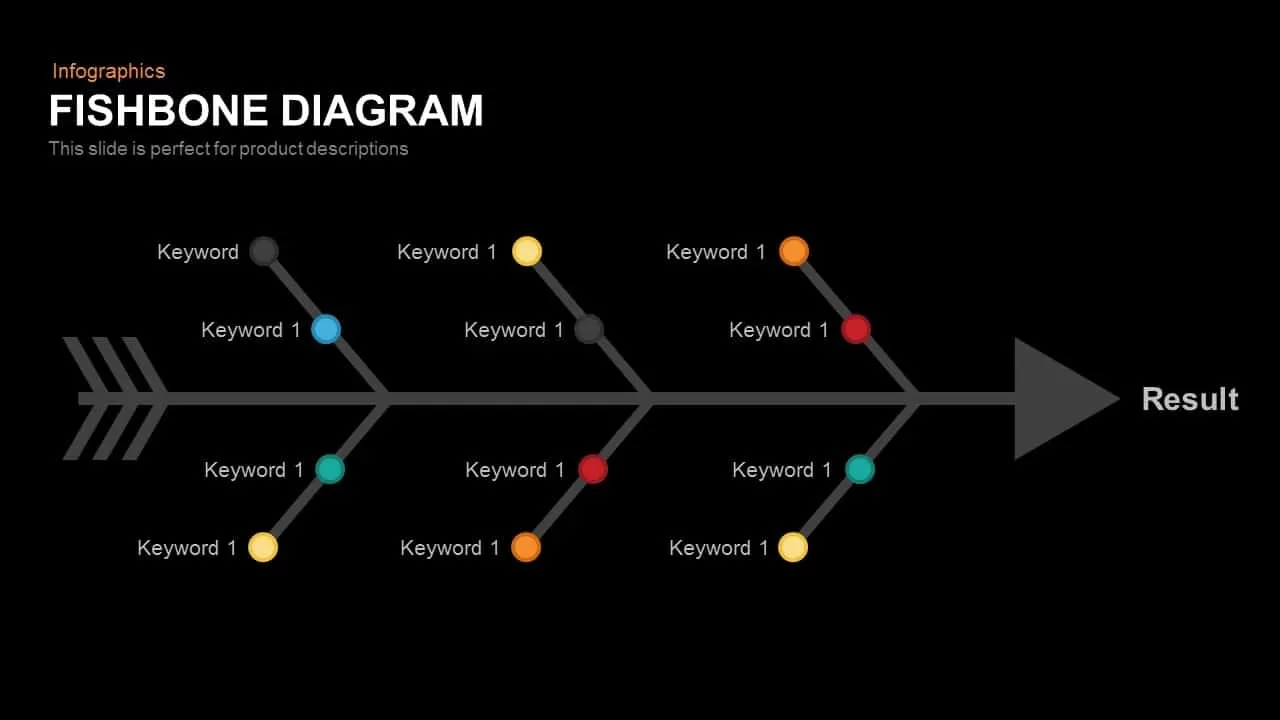
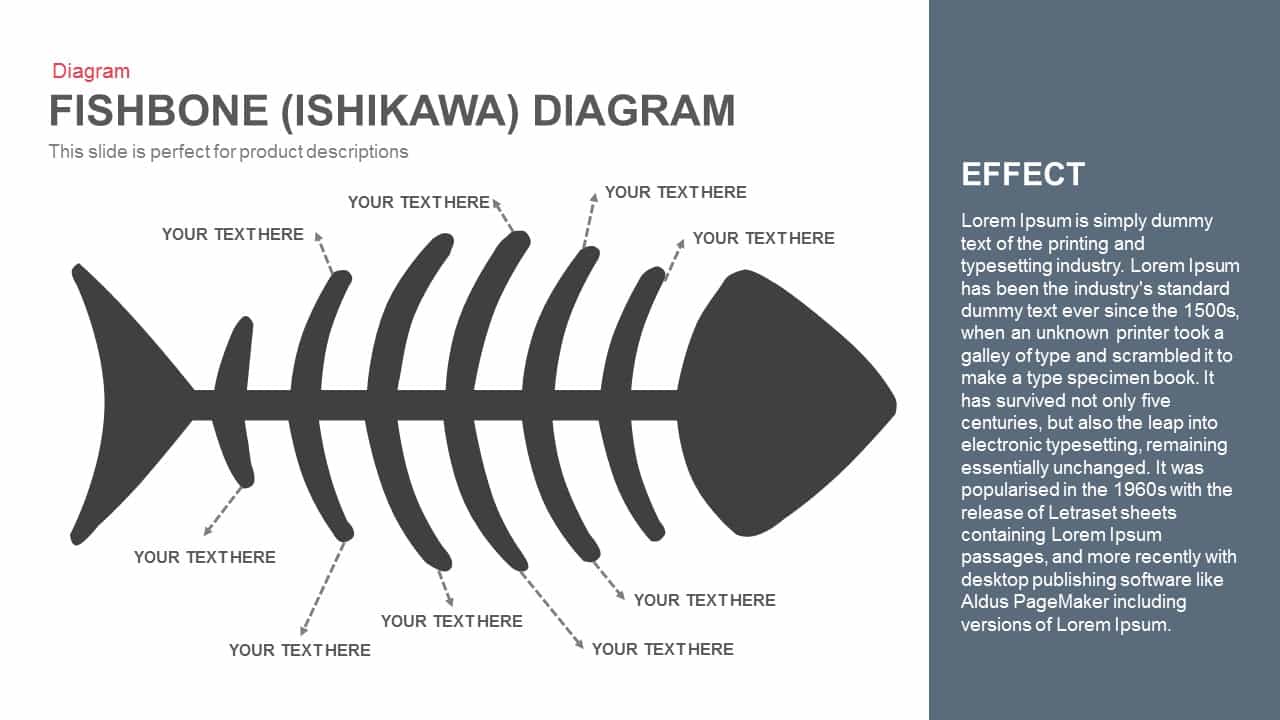
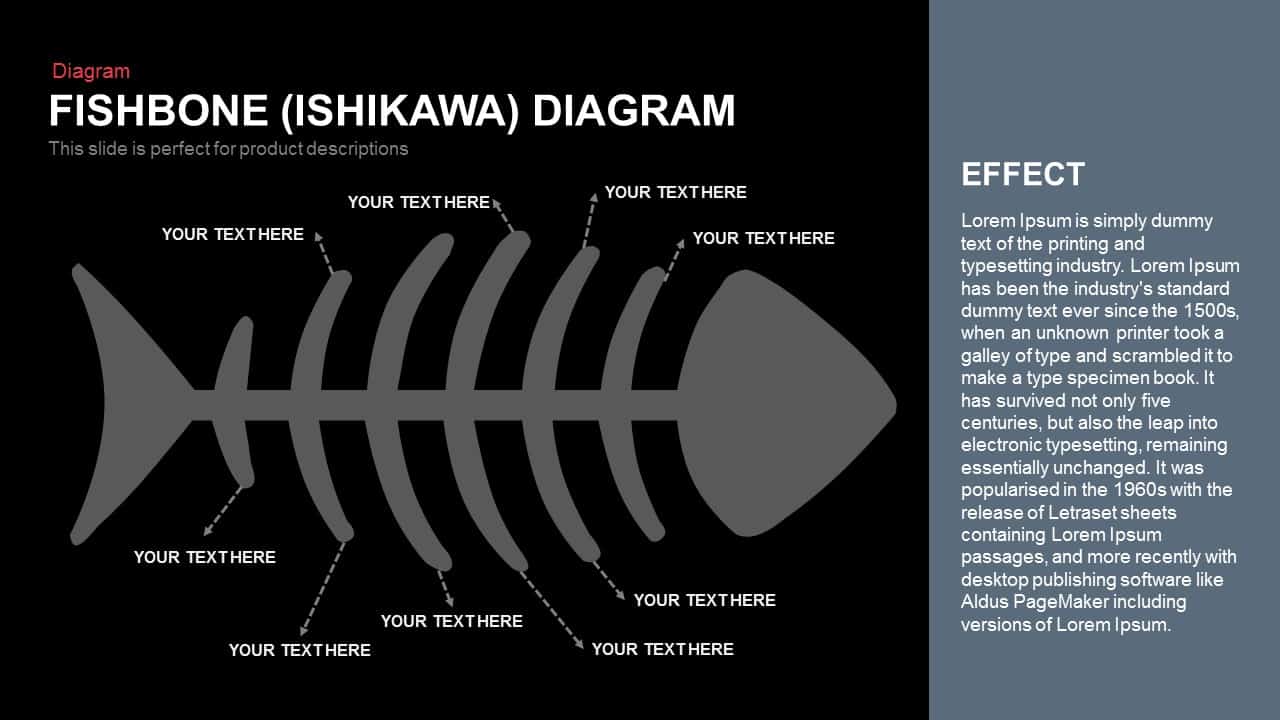
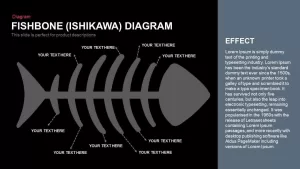
The Fishbone (Ishikawa) Diagram is a powerful tool for identifying and analyzing the root causes of a problem. This slide layout features a central “spine” with branching “bones” representing different categories or factors that contribute to the issue being examined. Each bone is customizable to show specific causes, such as people, processes, materials, or environment. This type of diagram is ideal for brainstorming sessions, root cause analysis, and continuous improvement efforts. The clean design and clear structure allow for easy customization, ensuring your content is presented in a visually appealing and accessible way.
Who is it for
This diagram is perfect for business analysts, project managers, quality control teams, and problem-solving groups who need to visually represent the causes of an issue. It is especially useful for teams conducting root cause analysis in manufacturing, service industries, or project management. It also benefits educators and students who are learning or teaching problem-solving techniques.
Other Uses
Beyond root cause analysis, this diagram can be adapted for various other purposes. It can be used in strategic planning, process analysis, risk assessment, and operational reviews to visually dissect a complex problem into manageable components. Additionally, it can be used to break down multiple factors or categories affecting an outcome, helping teams prioritize issues to address.
Login to download this file

Item ID
SB00383
Related Templates

Three-Section Fishbone Process Diagram template for PowerPoint & Google Slides
Process
Fishbone RCA Diagram Template for PowerPoint & Google Slides
Business Strategy
Fishbone Diagram Overview template for PowerPoint & Google Slides
Infographics
Fishbone Diagram Cause-and-Effect Template for PowerPoint & Google Slides
Process
Free Color-Coded Fishbone Diagram Template for PowerPoint & Google Slides
Project
Free
Fishbone Cause and Effect Diagram Template for PowerPoint & Google Slides
Process
Fishbone Diagram Analysis Template for PowerPoint & Google Slides
Flow Charts
Fishbone Cause Analysis Diagram Template for PowerPoint & Google Slides
Process
Underwater Fishbone Cause-Effect Diagram Template for PowerPoint & Google Slides
Process
Fishbone Process Diagram template for PowerPoint & Google Slides
Infographics
Free Root Cause Analysis Fishbone Diagram Template for PowerPoint & Google Slides
Process
Free
5 Why Fishbone Diagram for Root Cause Analysis in PowerPoint & Google Slides
Process
Fishbone Cause and Effect Infographic Template for PowerPoint & Google Slides
Infographics
Fishbone Timeline Infographic Series Template for PowerPoint & Google Slides
Manufacturing
Snake Diagram Pack of 8 Slides template for PowerPoint & Google Slides
Process
Gear Process Diagram PowerPoint Template for PowerPoint & Google Slides
Process
Sales Process Workflow Funnel Diagram PowerPoint Template for PowerPoint & Google Slides
Funnel
Puzzle Diagram PowerPoint Template for PowerPoint & Google Slides
Process
Transportation Logistics PowerPoint Diagram template for PowerPoint & Google Slides
Process
Emoji Scale PowerPoint Diagram for PowerPoint & Google Slides
Infographics
4 Step Problem Solving PowerPoint Diagram for PowerPoint & Google Slides
Process