Experiments & Targets template for PowerPoint & Google Slides


Description
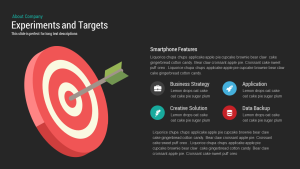
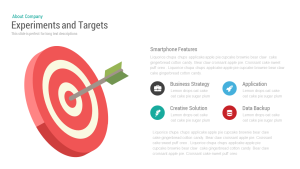
This Experiments & Targets template centers a bold 3D bullseye infographic on a dark background for high-impact presentations. The vector target graphic uses concentric red rings and a precision arrow in green, visually reinforcing themes of goal-setting and performance measurement. To the right, a customizable “Smartphone Features” panel offers headline and rich-text placeholders, followed by four feature callouts—Business Strategy, Application, Creative Solution, and Data Backup—each paired with colored circular icons for intuitive visual association. Below, dual data metrics highlight device usage splits, while a body copy area accommodates longer explanatory text.
Built on master slides, every element—from the 3D target and arrow to icon sets and text blocks—is fully editable in PowerPoint and Google Slides. Theme-color controls let you swap red and green for any brand palette, and free web fonts ensure consistent typography across platforms. Drag-and-drop placeholders streamline graphic updates, while subtle drop shadows add depth without visual clutter. The slide adapts seamlessly between 16:9 widescreen and 4:3 ratios, maintaining crisp clarity on HD projectors, retina displays, and virtual meeting backgrounds. Hidden variation slides include alternate color schemes and layout tweaks for rapid customization. Apply entrance animations or morph transitions to guide your audience from overarching objectives to detailed feature insights. Whether you’re reporting marketing experiments, campaign targets, or strategic KPIs, this slide delivers data-driven storytelling with zero design headaches.
Who is it for
Marketing managers, brand strategists, and data analysts who need to present campaign targets, performance metrics, or feature roadmaps. Consultants, executives, and product teams will also value its high-impact visual narrative for stakeholder briefings.
Other Uses
Repurpose this template for sales targets, project milestones, or quarterly goals. Swap the target graphic for a funnel or radar chart to adapt the slide for customer journey analyses or competitive audits.
Login to download this file

Item ID
SB00042