Emotional Customer Journey Map Template for PowerPoint & Google Slides
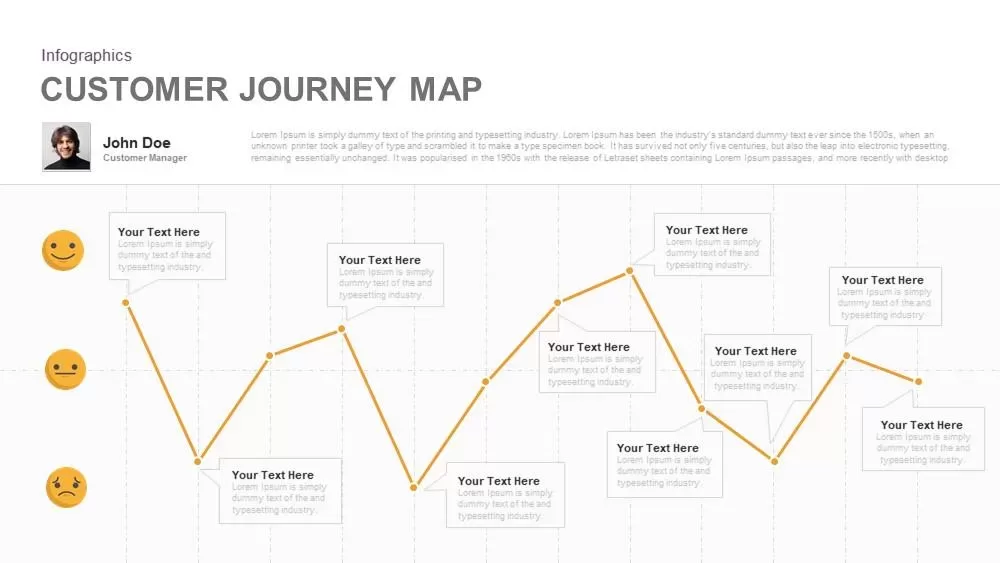
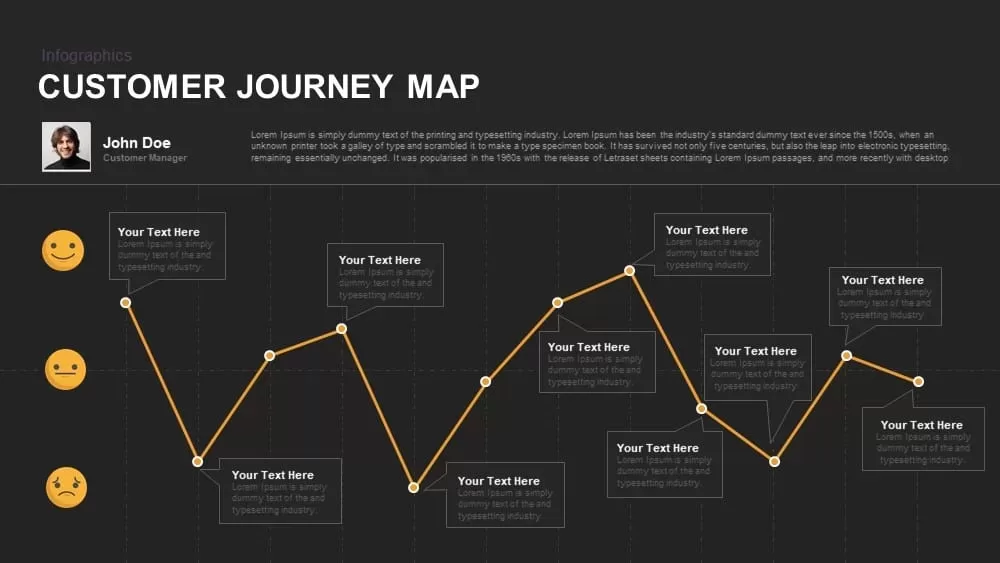
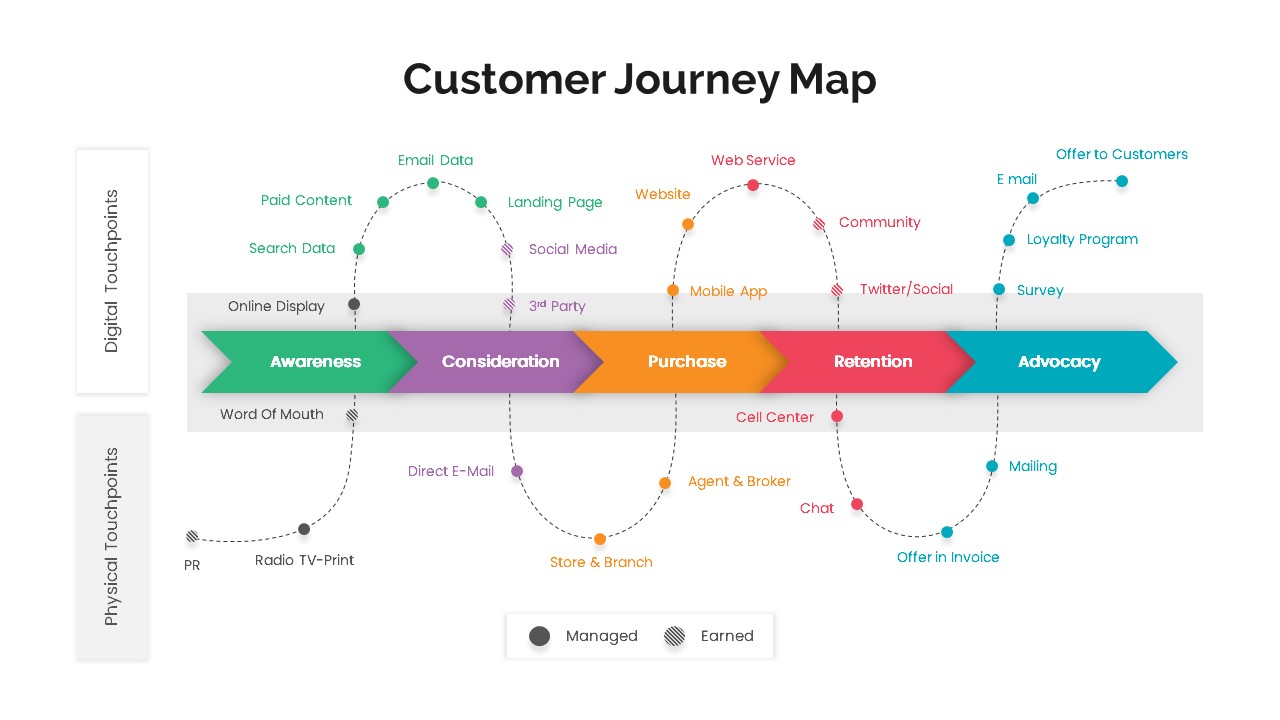
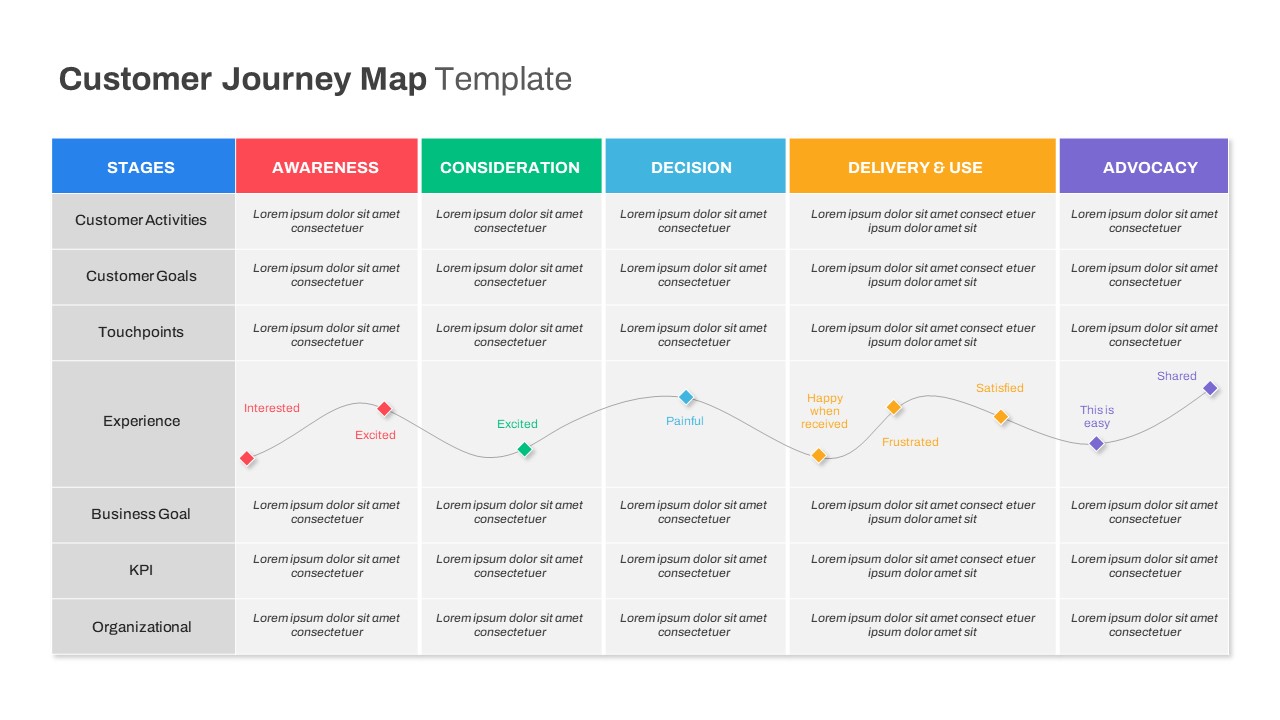
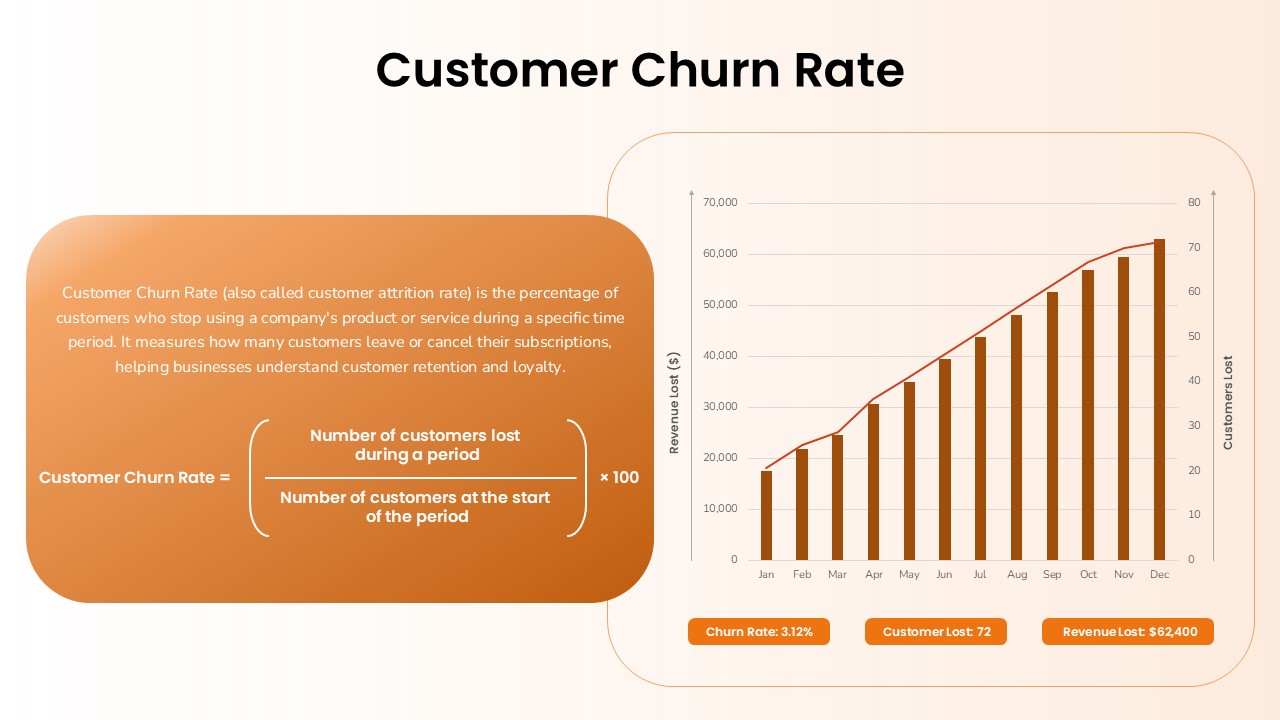
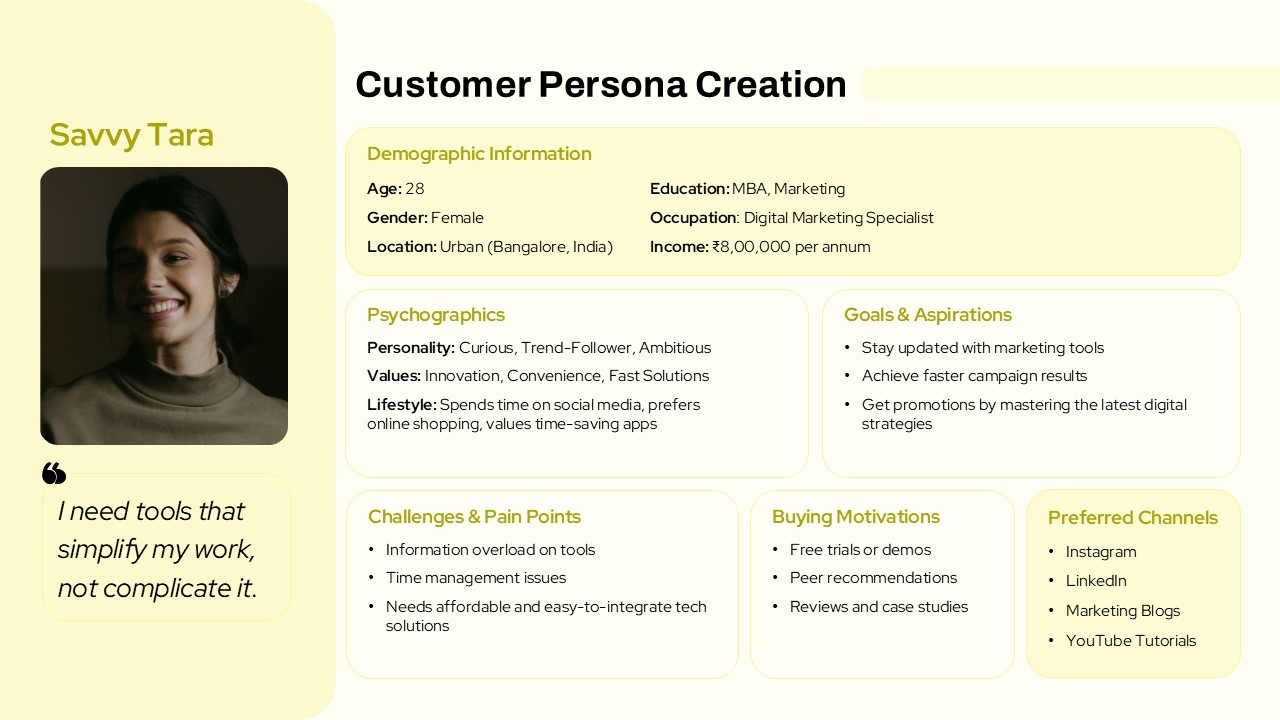
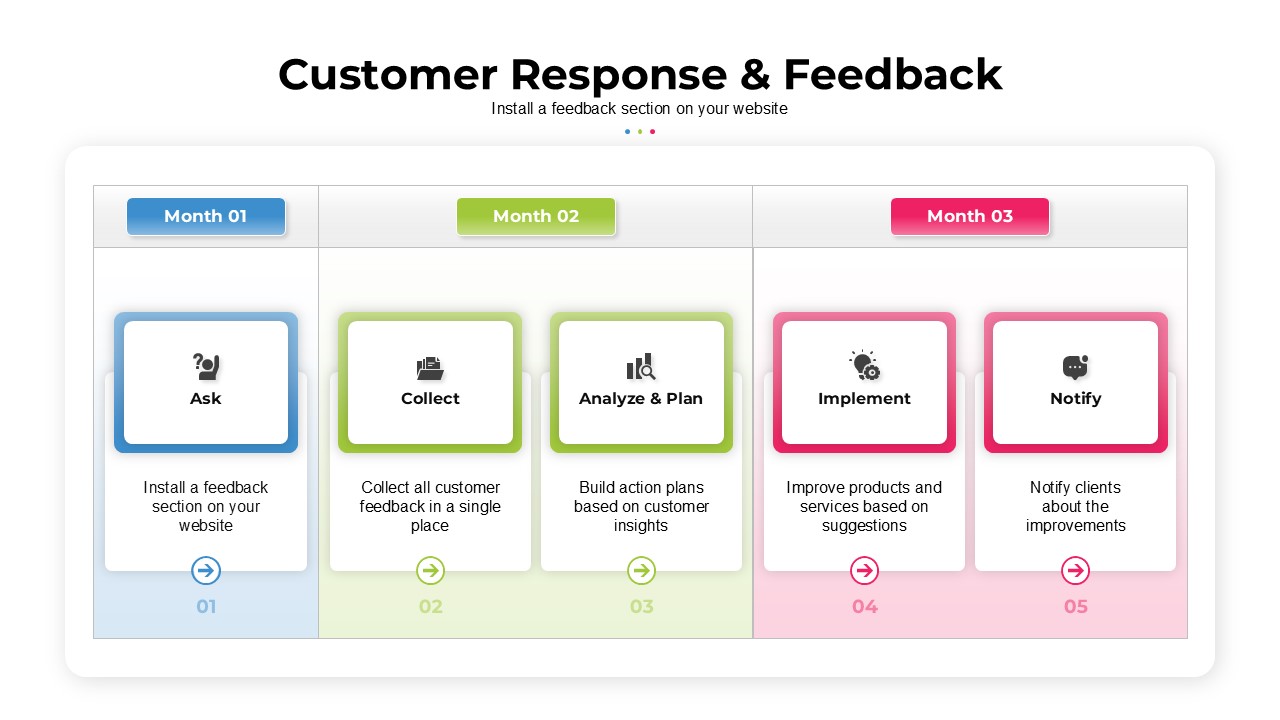
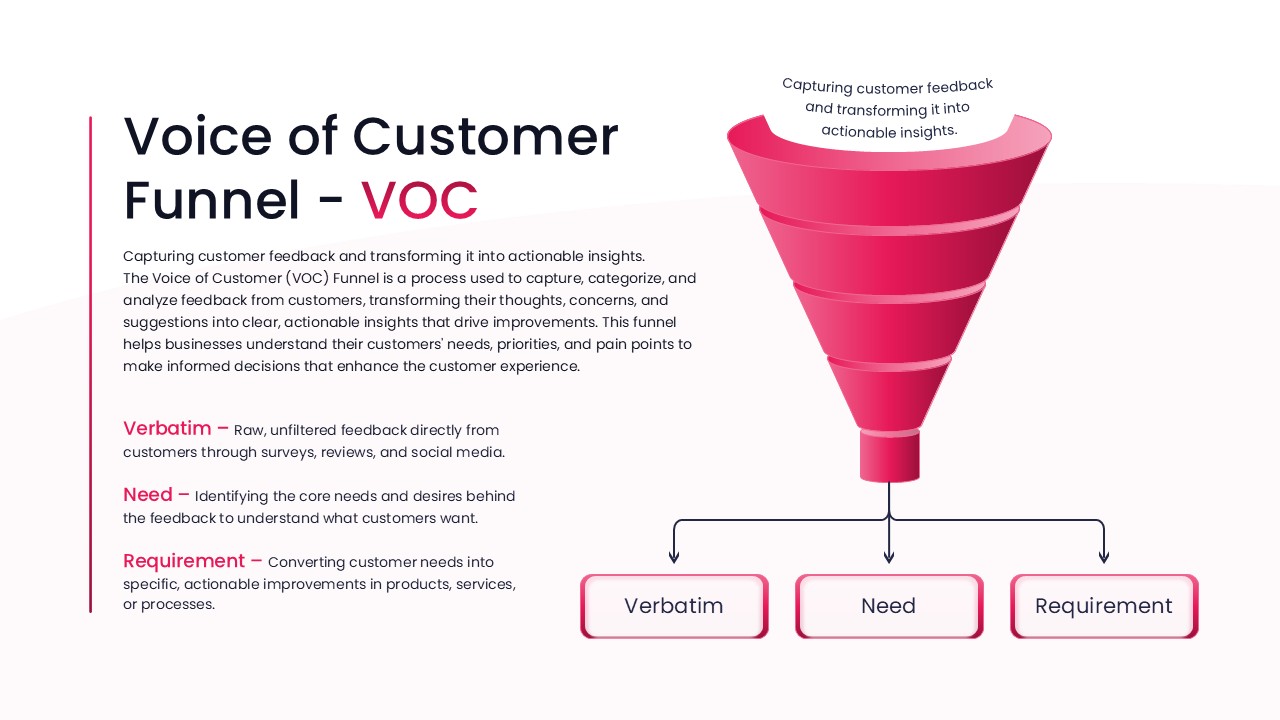
Leverage this emotive customer journey map slide to illustrate user sentiment dynamics and touchpoint analysis with precision and style. The horizontal line graph spans a 12-stage timeline on a subtle gray grid backdrop, plotting sentiment scores with ten circular data markers connected by a bold orange curve. Emotive icons anchored on the vertical axis represent positive, neutral, and negative feedback, reinforcing emotional context at key moments. Each marker features a callout box for detailed commentary, metrics, or action items. The top section includes a persona profile placeholder with photo, name, and role, plus a summary header for providing scenario context. With clean typography, ample whitespace, and flat design elements, the layout ensures maximum readability in boardrooms, training rooms, or virtual meetings.
Fully editable in PowerPoint and Google Slides, this template empowers you to adapt every element to match your brand guidelines or presentation theme. Swap emotive icons, adjust the line curve, and recolor data markers with one click. Use master slide layouts to maintain consistency across your deck, and integrate external data sources such as Excel or Google Sheets to update metrics in real time. Vector-based shapes guarantee flawless scaling on any device, while grouped and named objects accelerate editing workflows.
Enhance storytelling and audience engagement by adding smart annotations directly next to data points, highlighting peaks, dips, or forecasted values. Use conditional formatting or subtle gradient overlays to draw focus to critical segments, or integrate connector lines for cross-touchpoint comparisons. Include built-in legend elements to clarify data series and sentiment scales. Custom animations and transitions can reveal each stage in sequence, guiding viewers through your narrative flow.
Originally designed for customer experience professionals, this journey map also excels in market research reports, employee satisfaction analyses, and project retrospectives. Swap the sentiment curve for sales trends, user engagement metrics, or risk assessments. Duplicate or resize sections to emphasize specific phases, and apply optional drop shadows to create visual depth. With its intuitive structure and fully customizable components, this asset streamlines slide creation and elevates data-driven storytelling across departments.
Who is it for
Product managers, UX researchers, and marketing strategists will find this journey map invaluable for visualizing customer experiences, tracking sentiment trends, and driving data-informed decisions. Stakeholder teams, client presentations, and training sessions also benefit from the clear, story-driven format that highlights customer pain points and opportunities.
Other Uses
Repurpose this slide for project retrospectives, satisfaction surveys, or quarterly performance reviews. Swap the line graph for sales trends, track employee engagement scores, or map service request volumes across time. Adjust icons and labels to suit any sentiment-driven narrative or time-series analysis.
Login to download this file

Item ID
SB00856
Related Templates

Versatile Customer Journey Map Template for PowerPoint & Google Slides
Customer Journey
Comprehensive Customer Journey Map Template for PowerPoint & Google Slides
Customer Journey
Customer Journey Process Map Infographic Template for PowerPoint & Google Slides
Customer Journey
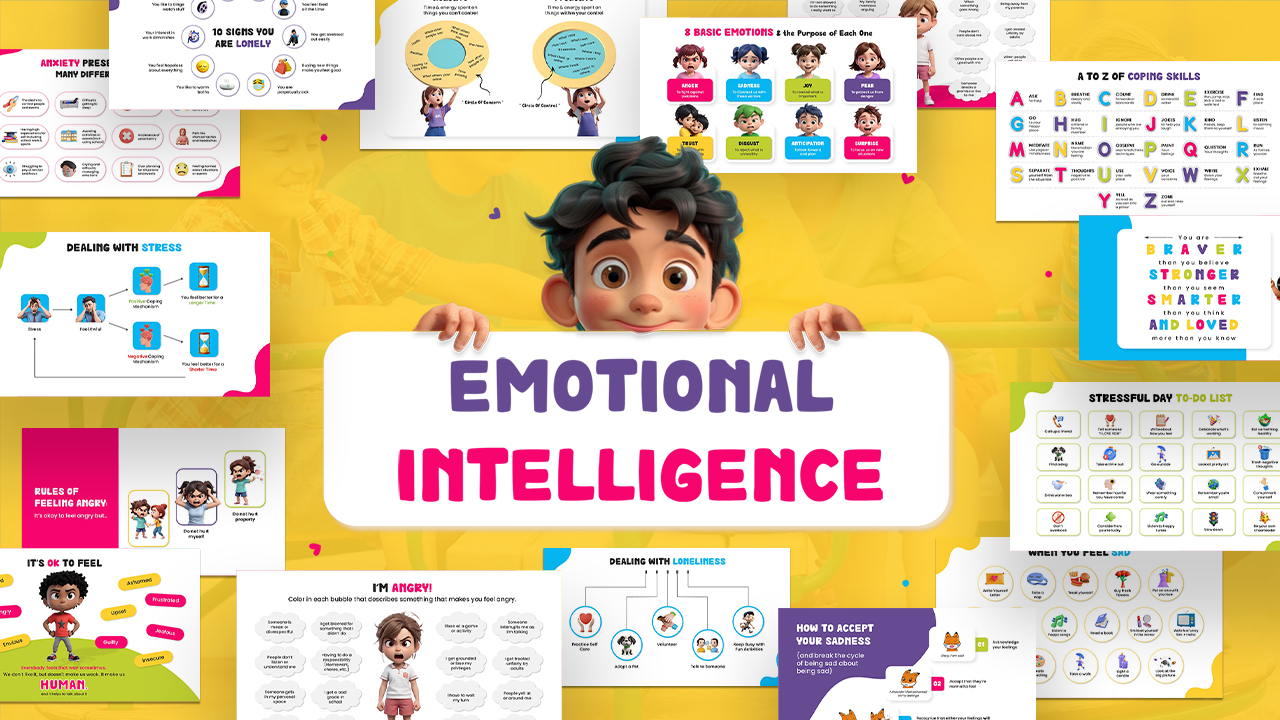
Emotional Intelligence Quadrant Template for PowerPoint & Google Slides
Circular
Emotional Intelligence Workshop Deck Template for PowerPoint & Google Slides
Pitch Deck
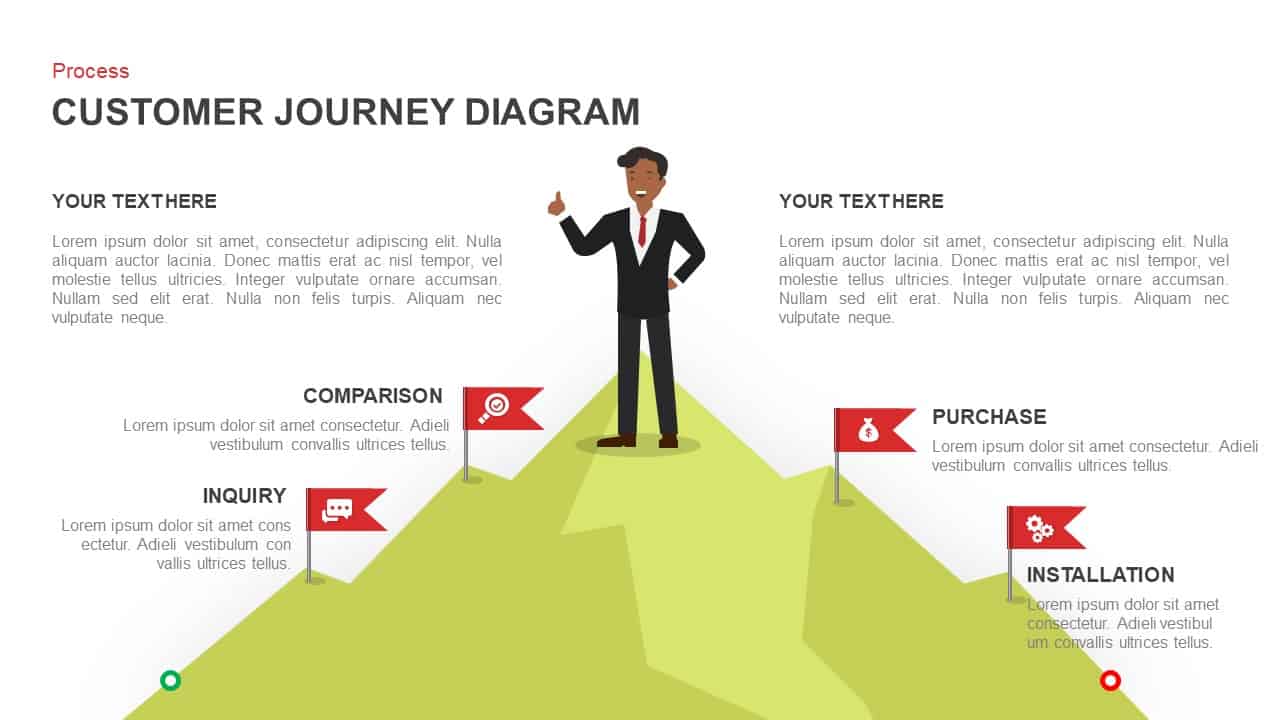
Customer Journey Mountain Infographic Template for PowerPoint & Google Slides
Customer Journey
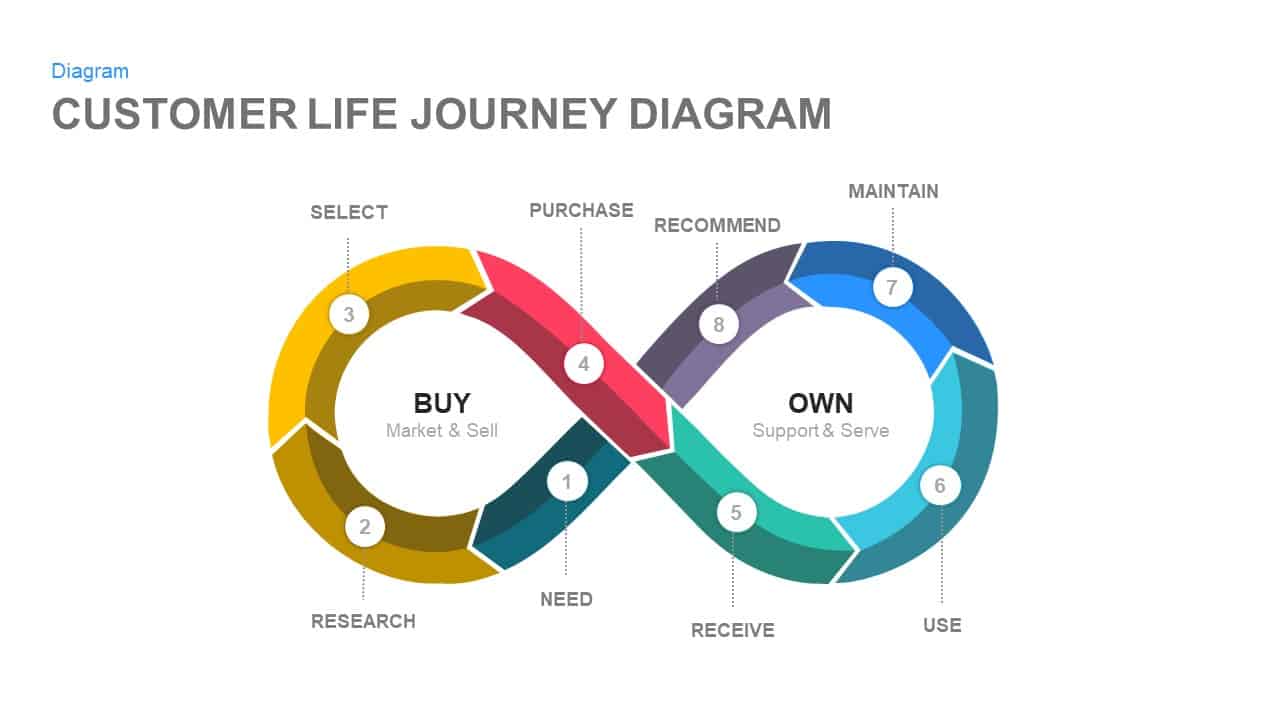
Customer Life Journey Infinity Diagram Template for PowerPoint & Google Slides
Customer Journey

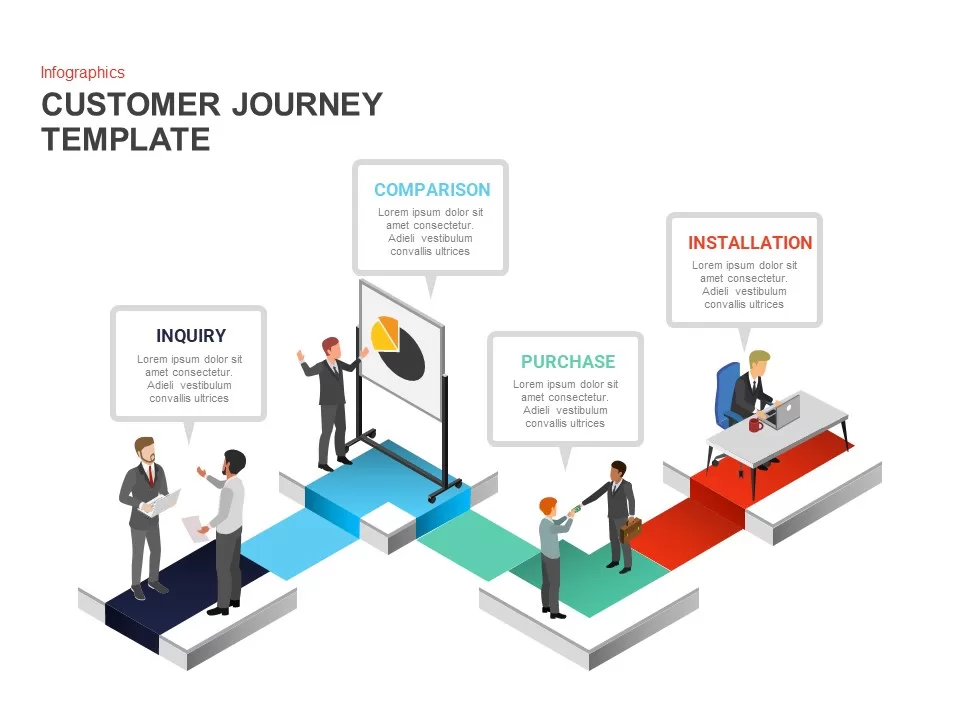
Isometric Customer Journey Path Template for PowerPoint & Google Slides
Customer Journey
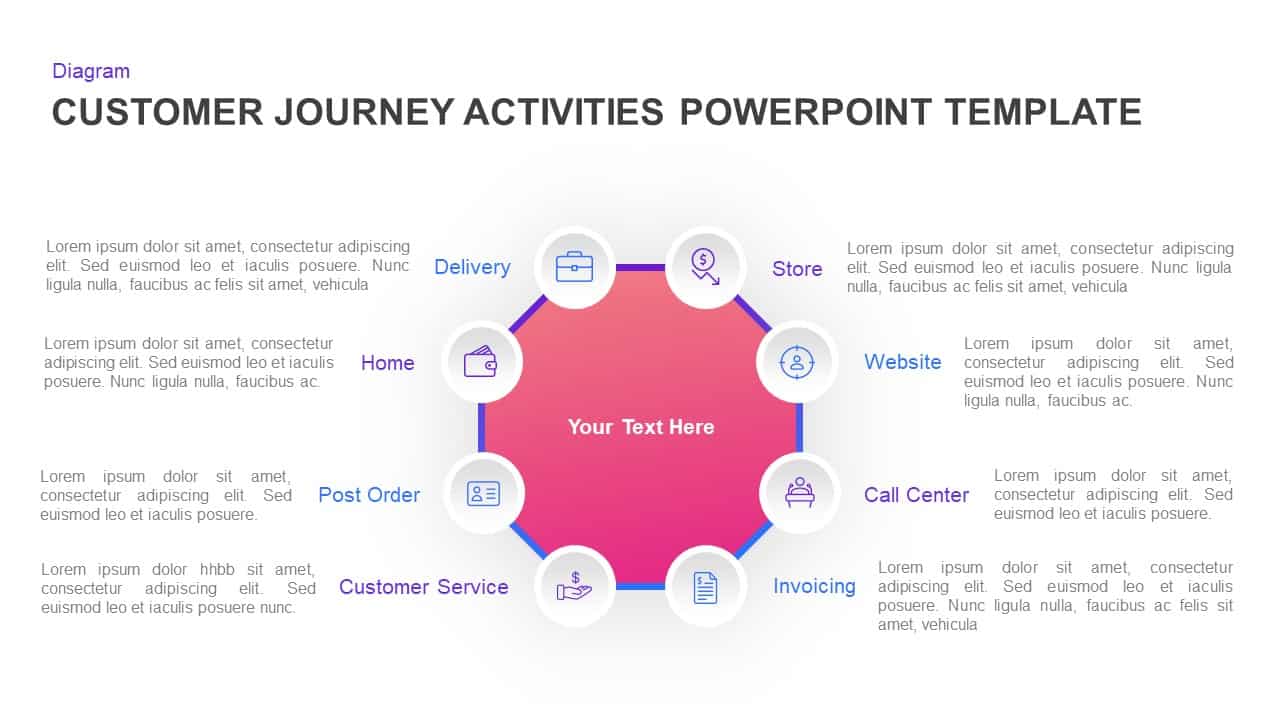
Customer Journey Activities Diagram Template for PowerPoint & Google Slides
Customer Journey
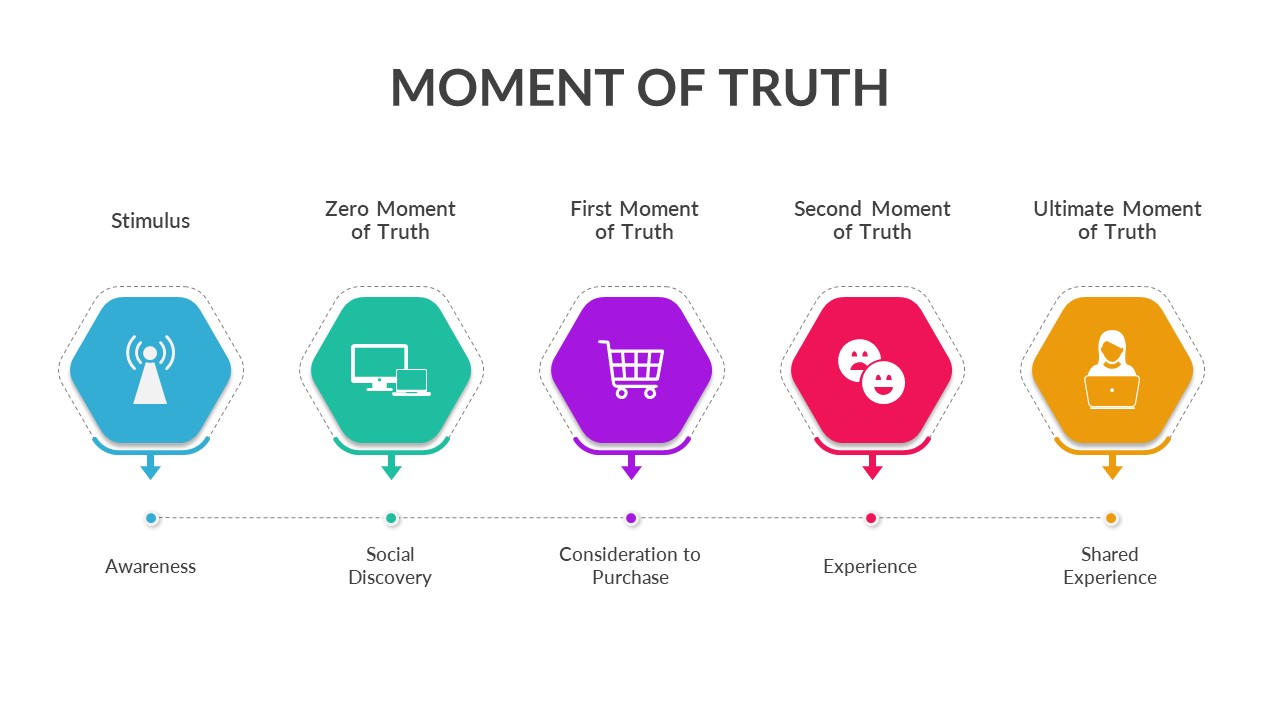
Moment of Truth Customer Journey Process Template for PowerPoint & Google Slides
Timeline
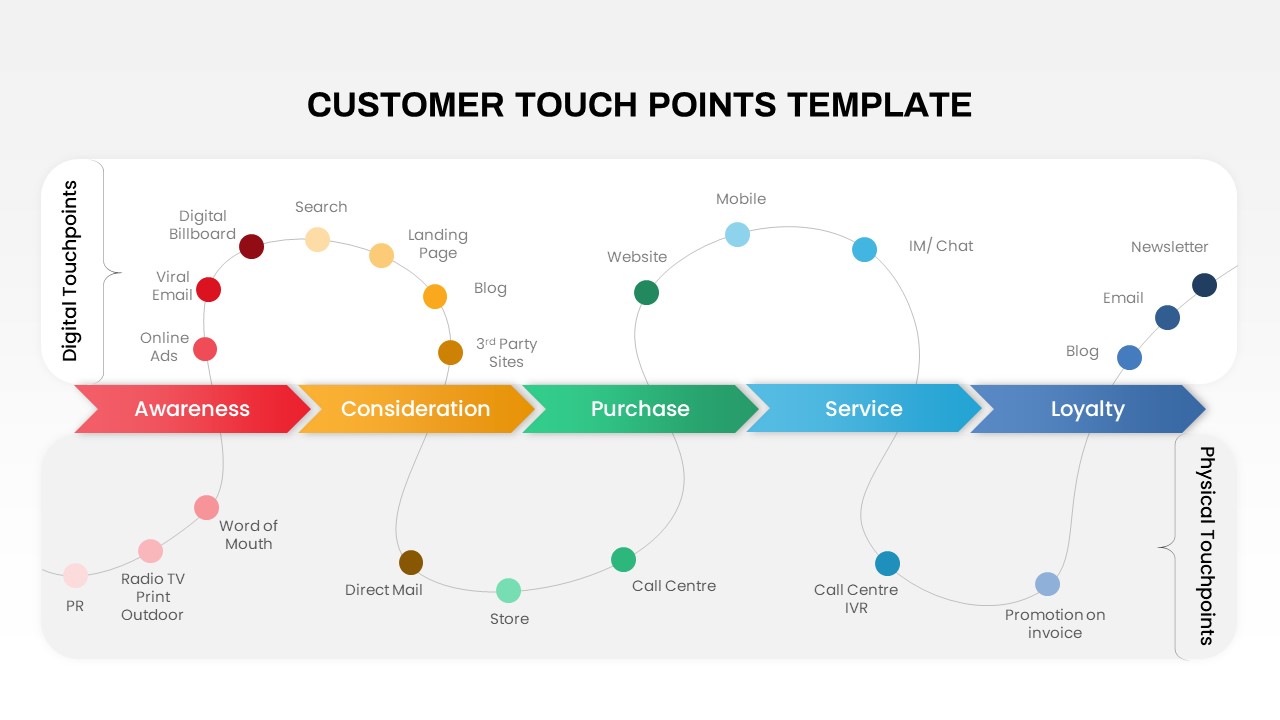
Customer Touchpoints Journey & Hub Template for PowerPoint & Google Slides
Customer Journey
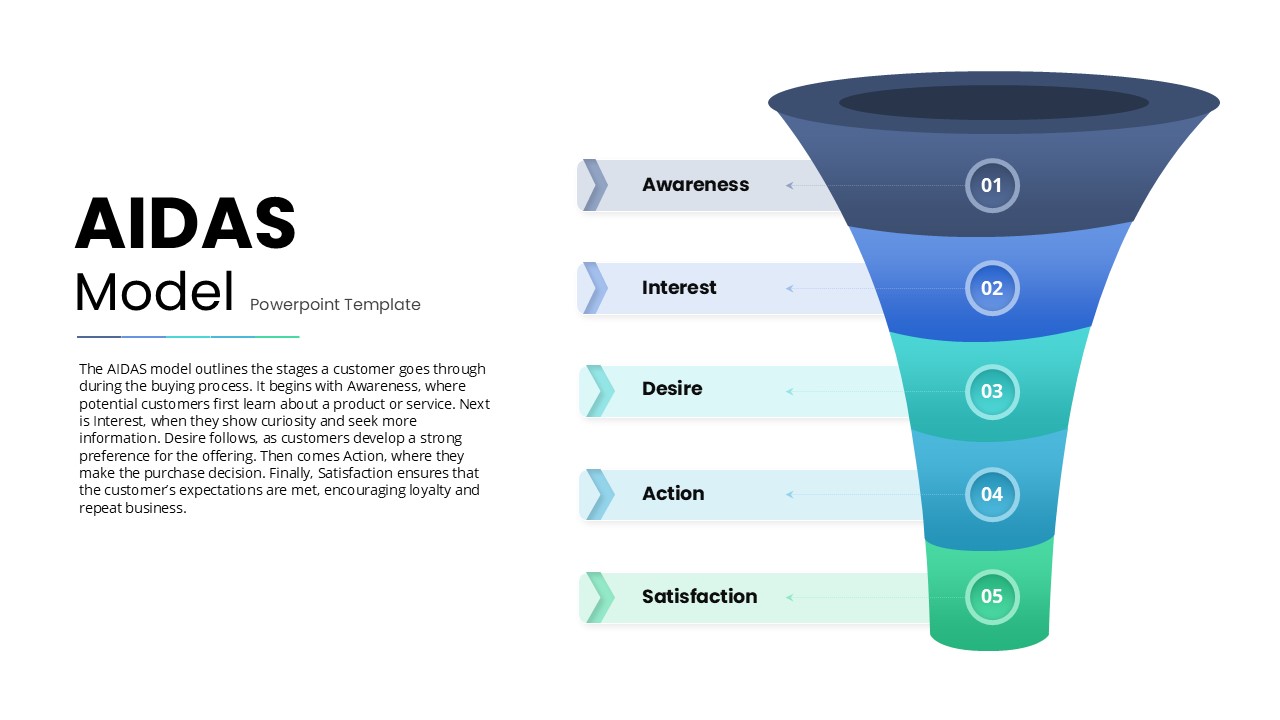
AIDAS Customer Journey Funnel Diagram Template for PowerPoint & Google Slides
Marketing Funnel
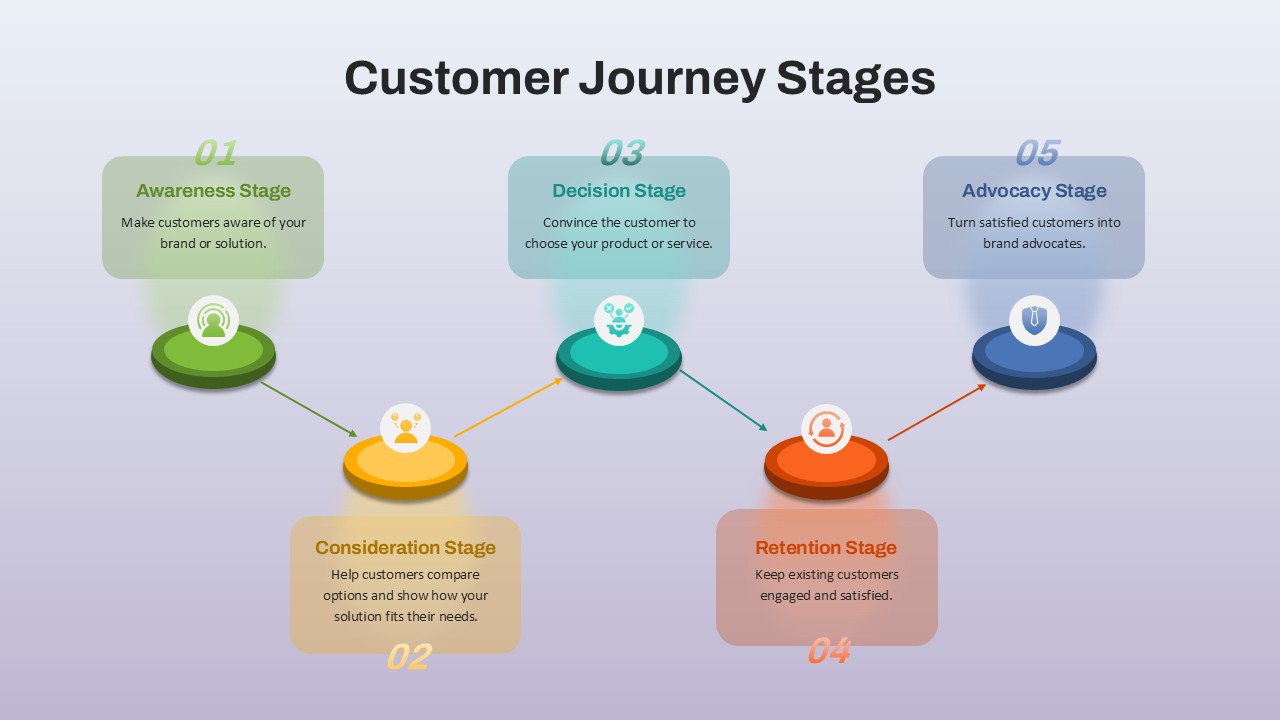
Customer Journey Stages template for PowerPoint & Google Slides
Business
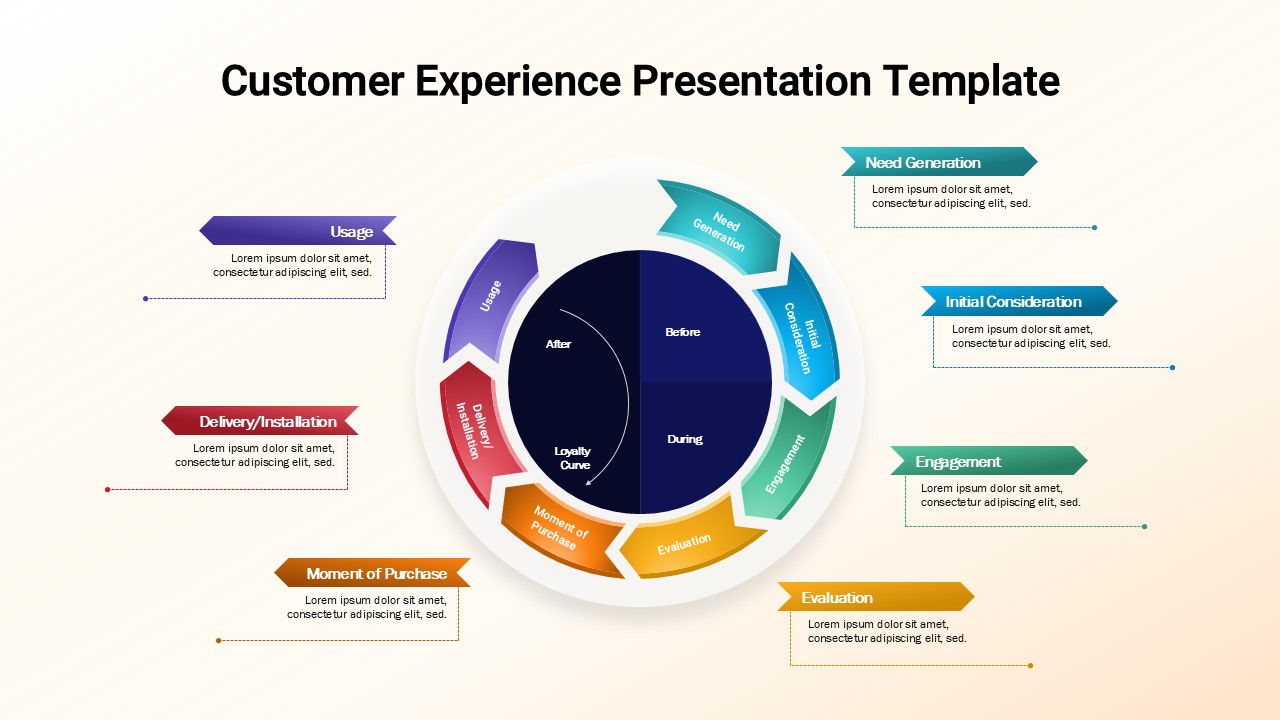
Customer Experience Journey Template for PowerPoint & Google Slides
Customer Journey
Customer Experience Journey Template for PowerPoint & Google Slides
Customer Journey
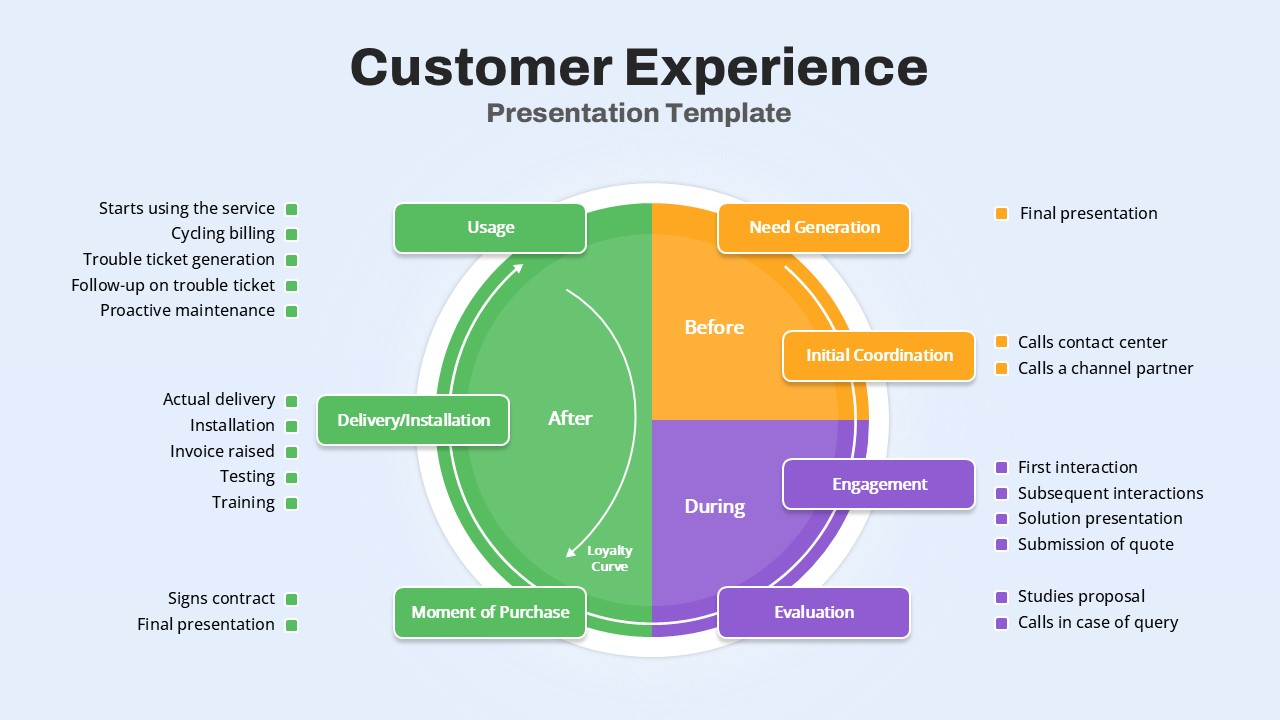
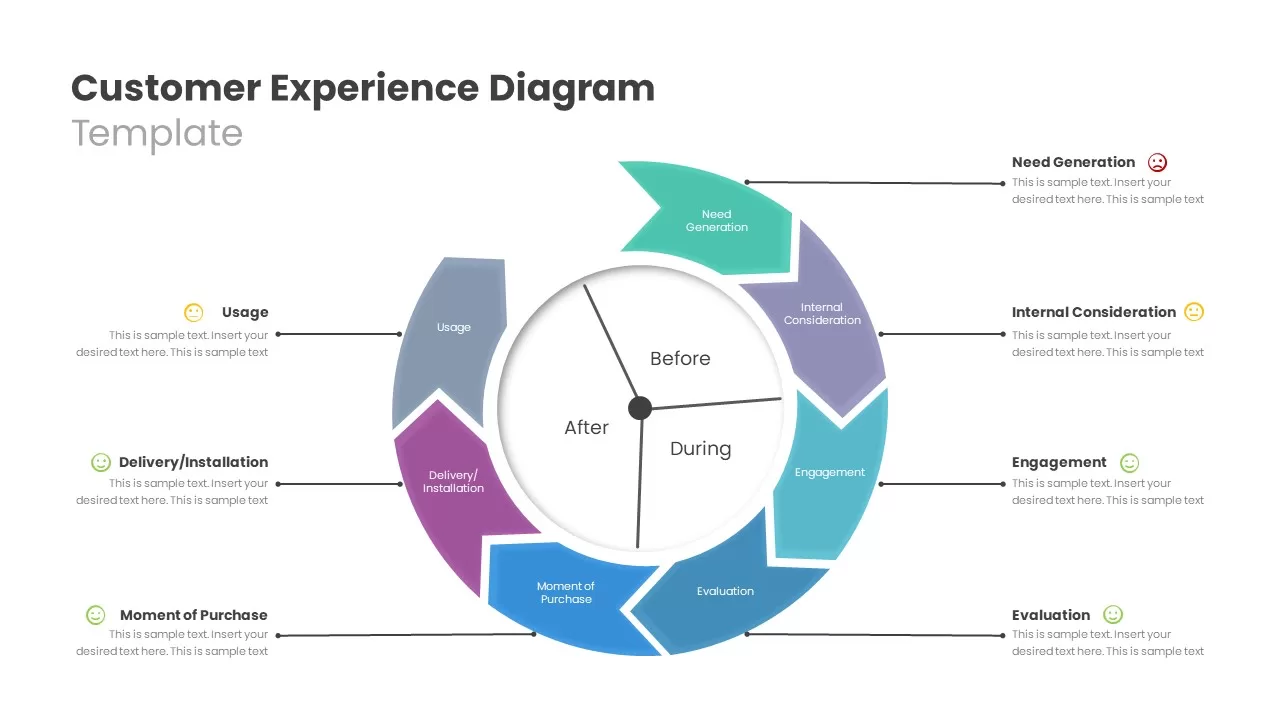
Customer Experience Journey Diagram Template for PowerPoint & Google Slides
Customer Journey
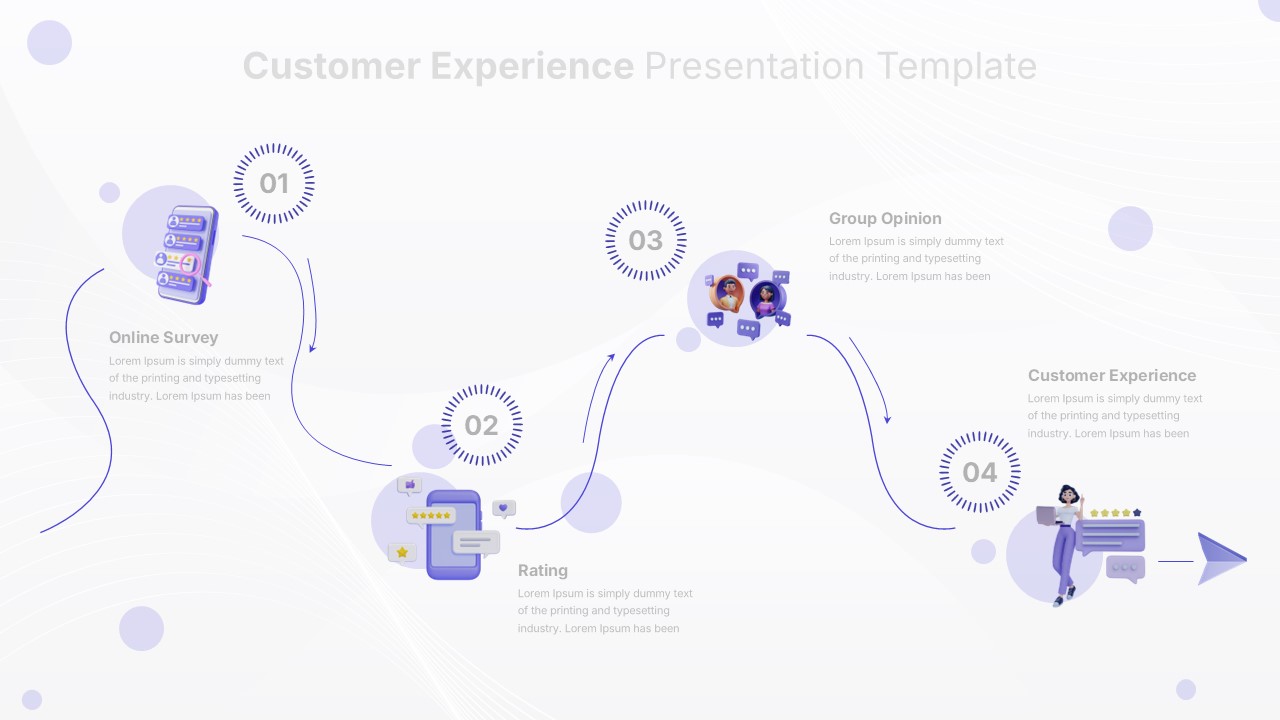
Customer Experience 4-Step Journey Template for PowerPoint & Google Slides
Customer Journey
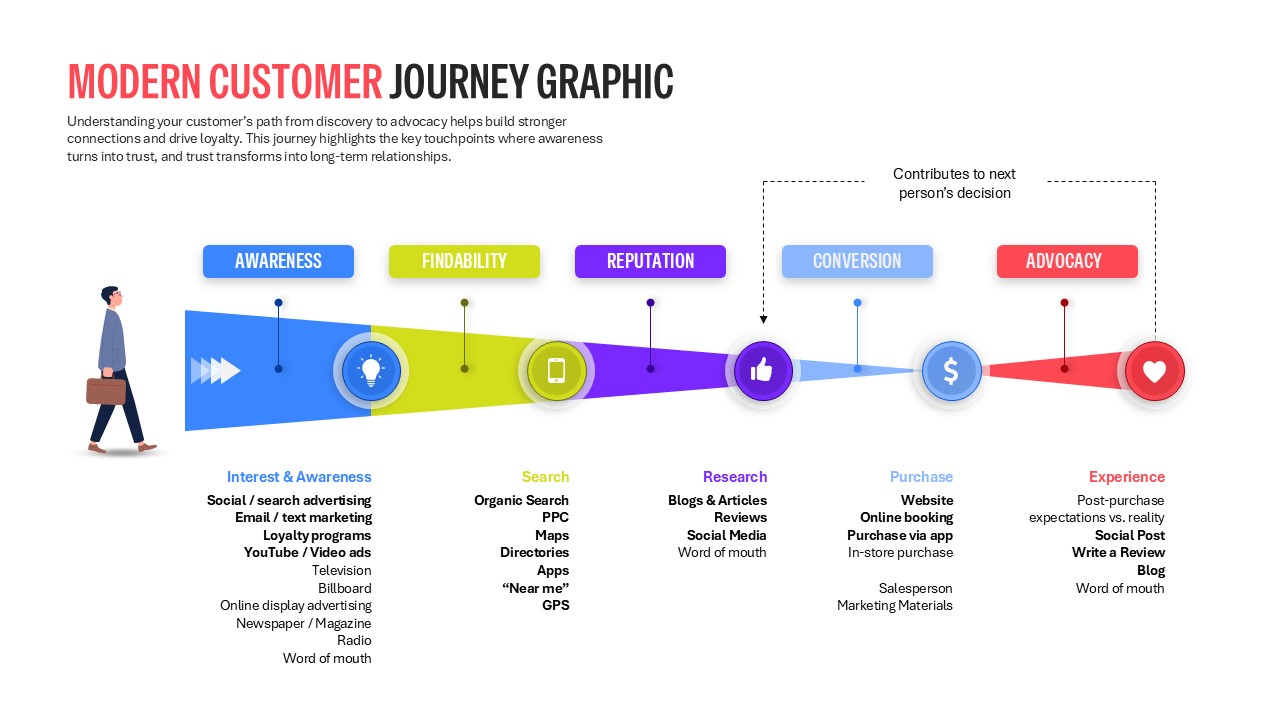
Modern Customer Journey Graphic Funnel Template for PowerPoint & Google Slides
Customer Journey
Customer Experience & Journey Infographic Templates for PowerPoint & Google Slides
Process
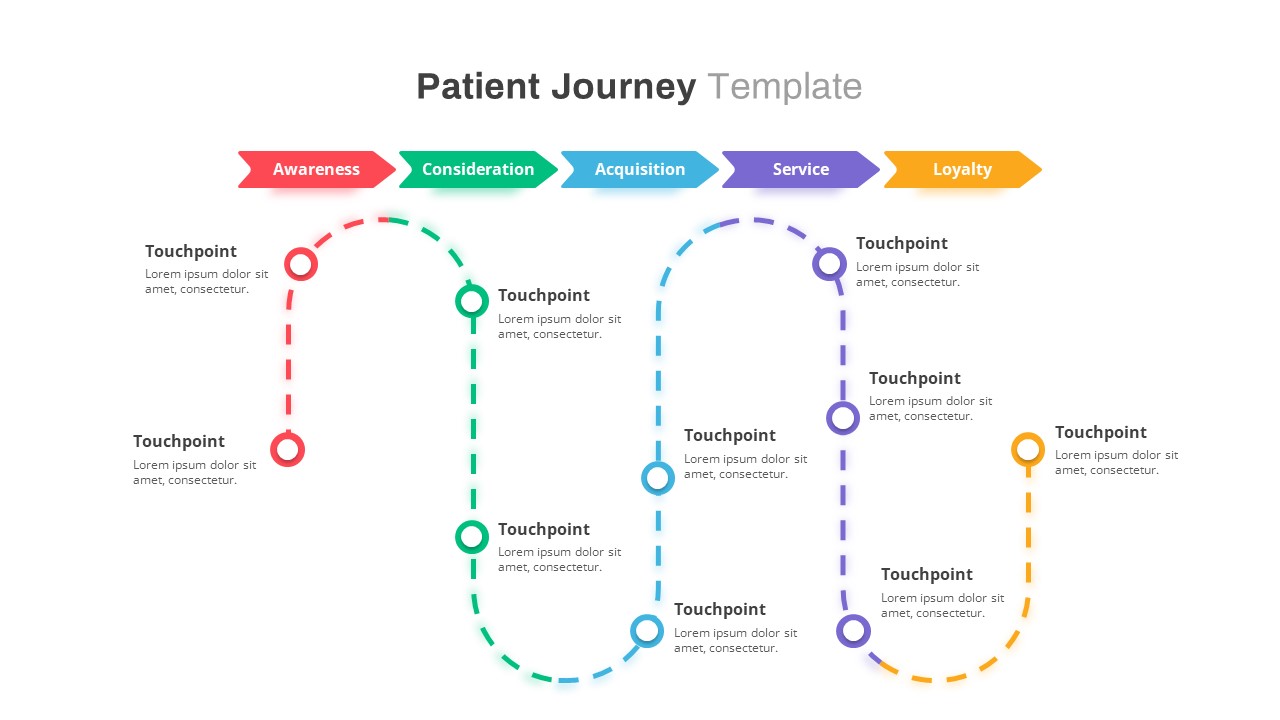
Healthcare Patient Journey Map Overview Template for PowerPoint & Google Slides
Health
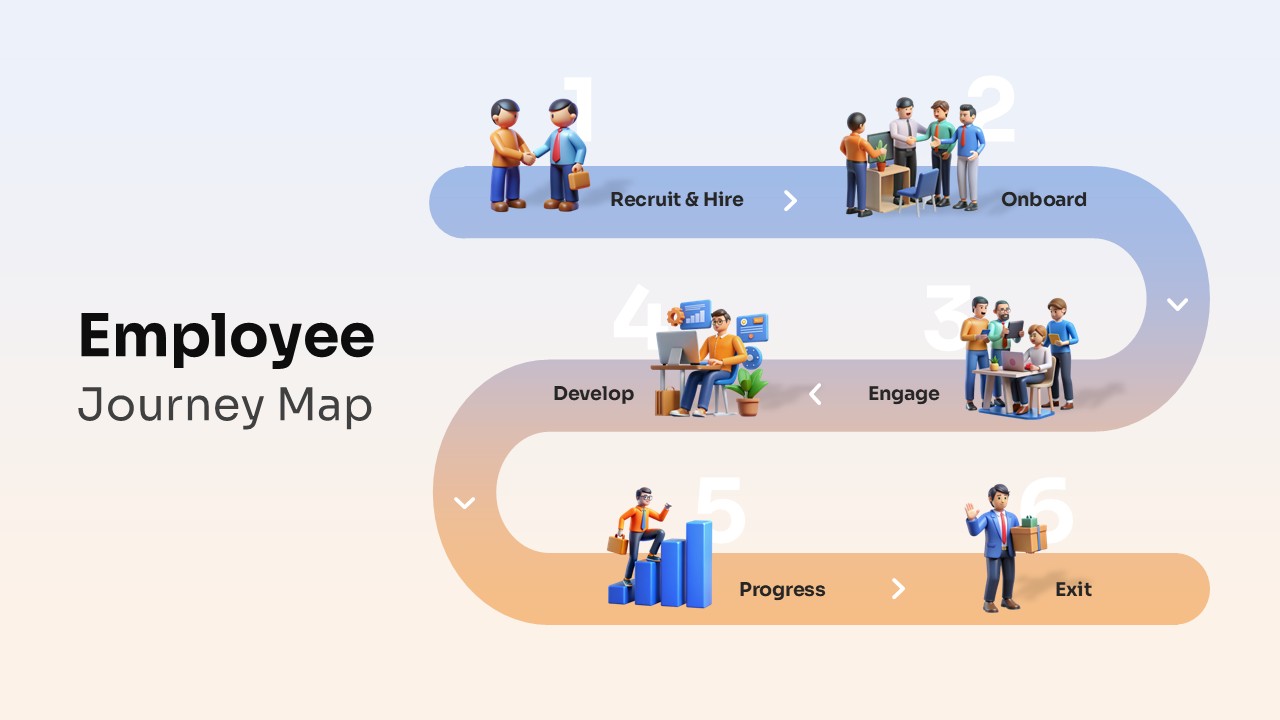
Employee Journey Map with Stages template for PowerPoint & Google Slides
Recruitment

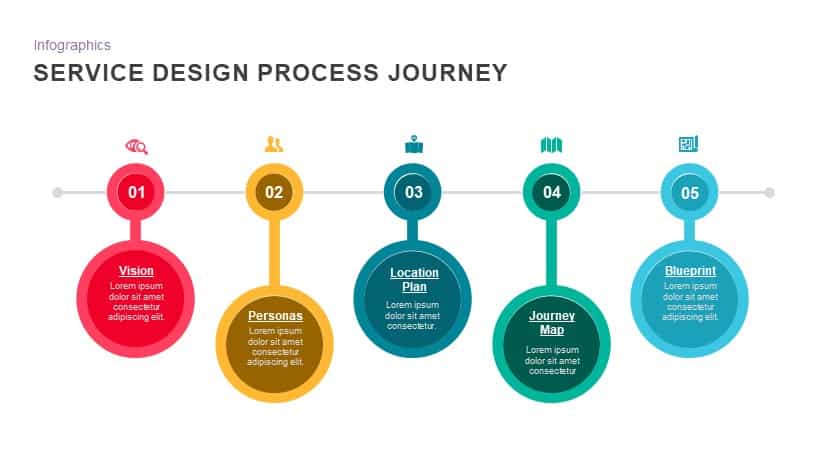
Service Design Process Journey template for PowerPoint & Google Slides
Process
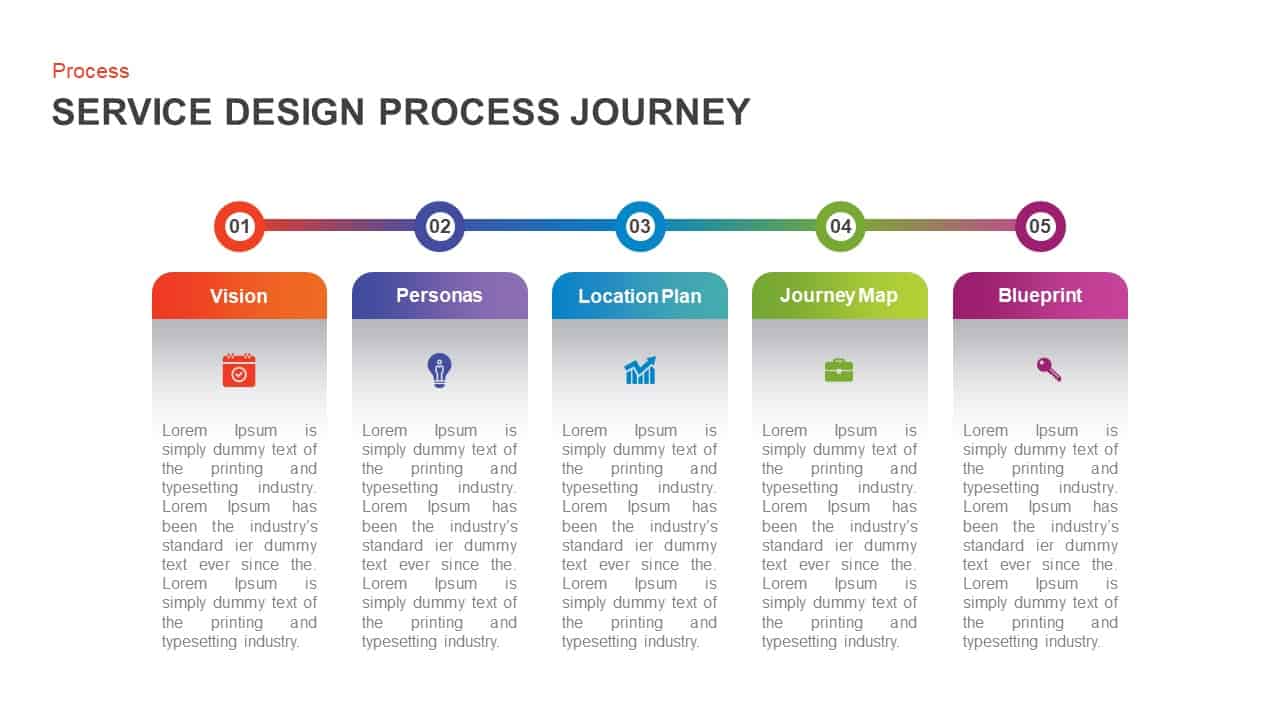
Service Design Process Journey Template for PowerPoint & Google Slides
Process
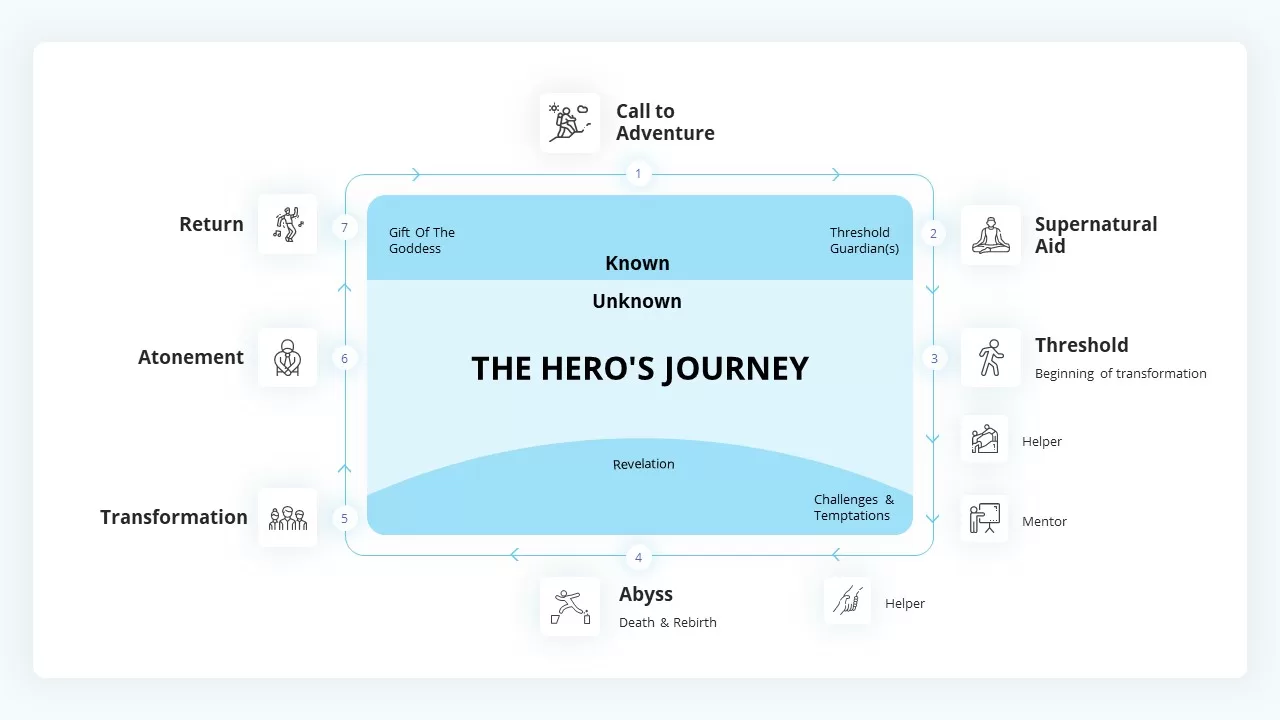
The Hero’s Journey Infographic Framework Template for PowerPoint & Google Slides
Customer Journey
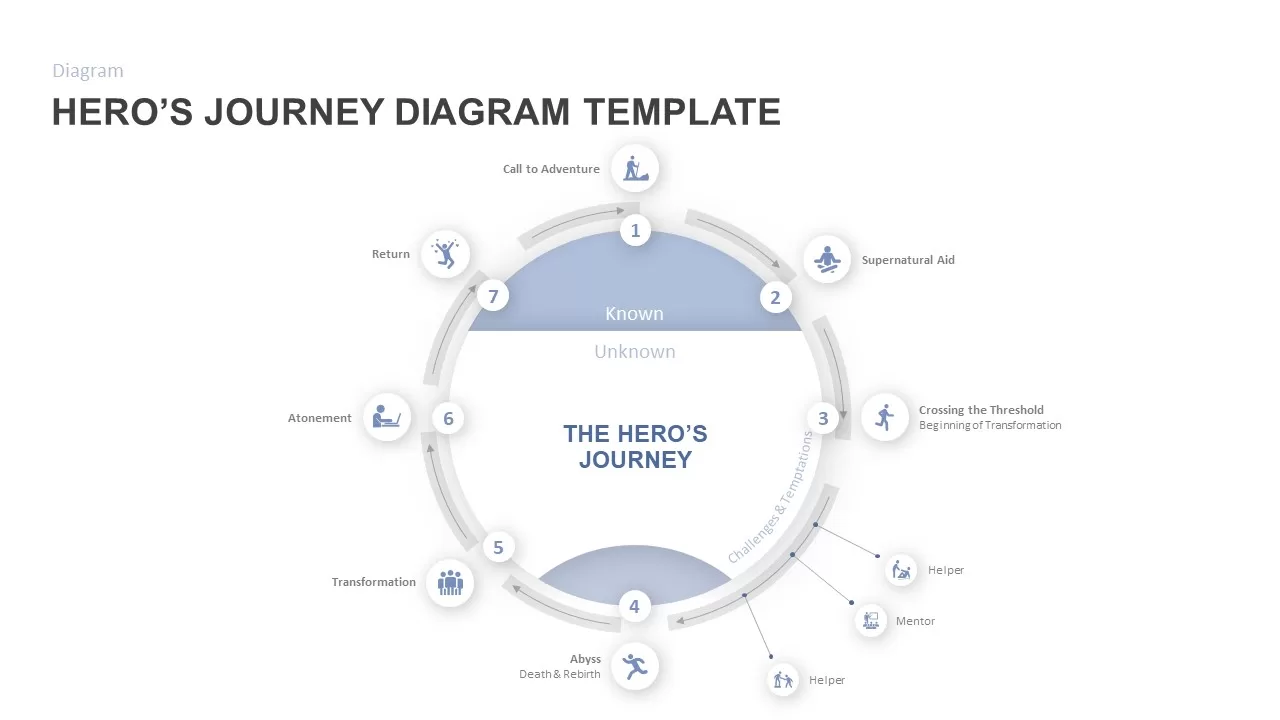
Hero’s Journey Diagram Template for PowerPoint & Google Slides
Customer Journey
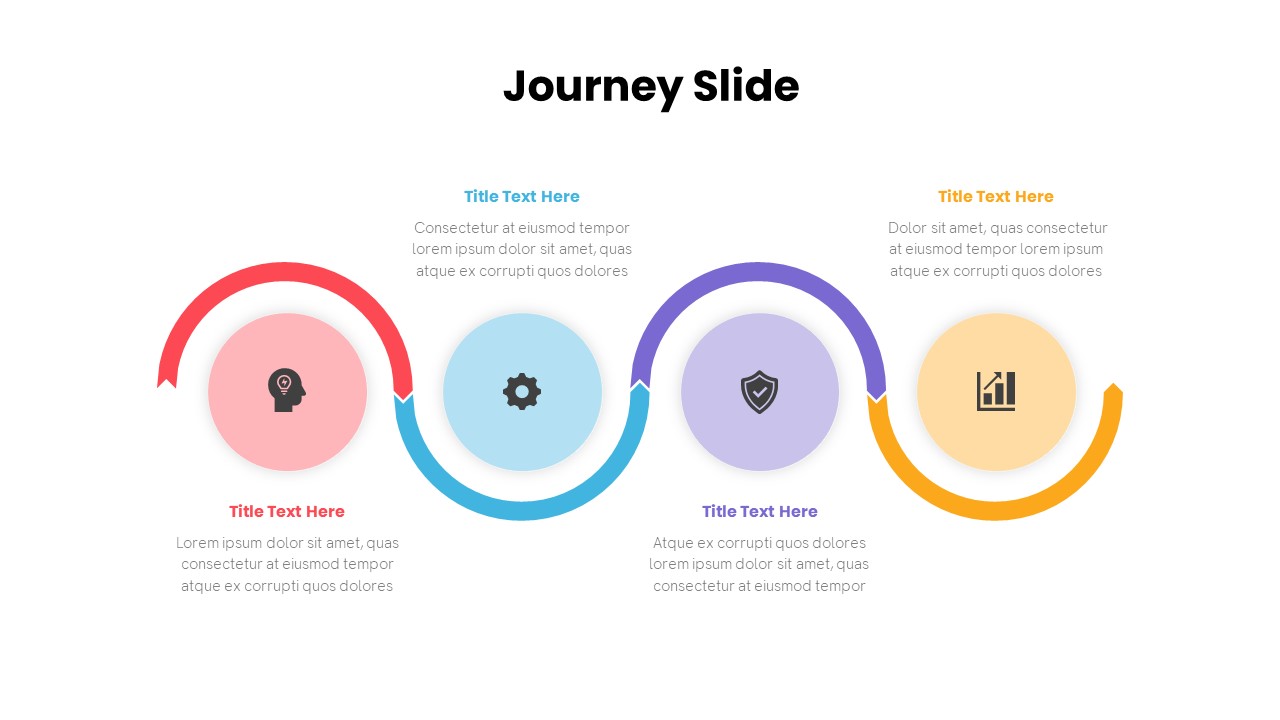
Free Journey Slide with Four Icons Diagram Template for PowerPoint & Google Slides
Process
Free
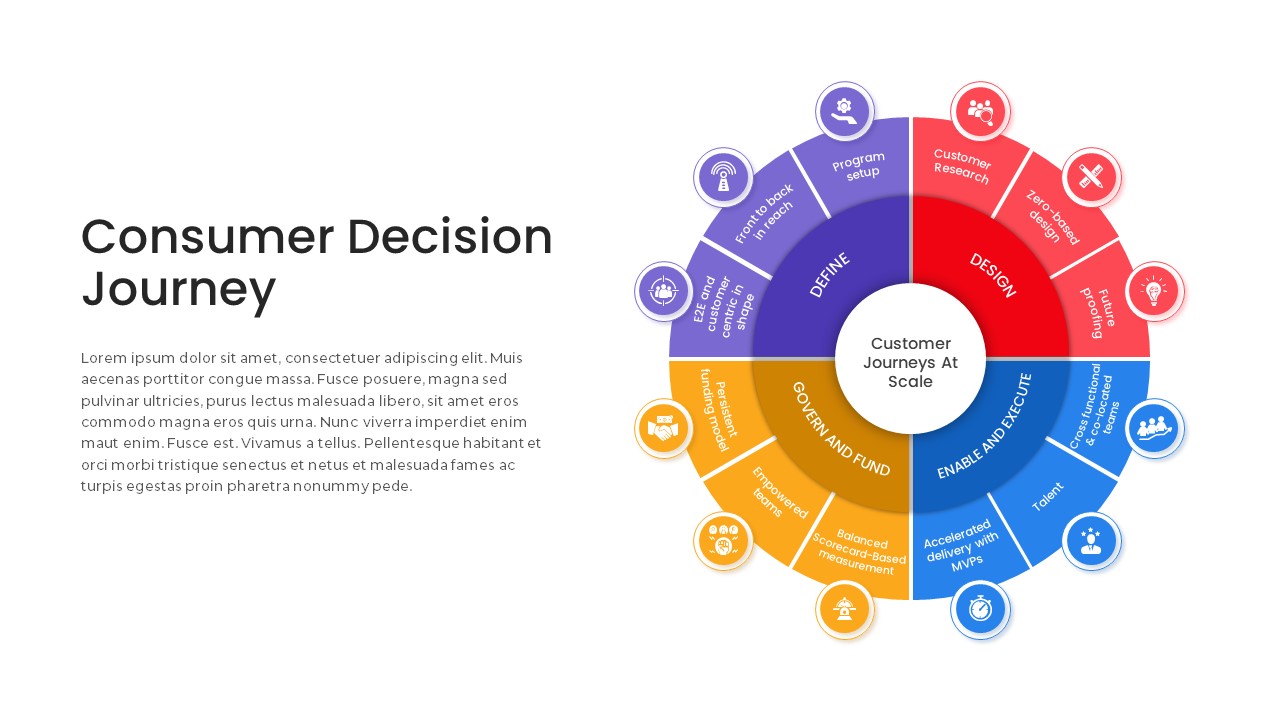
Consumer Decision Journey Radial Diagram Template for PowerPoint & Google Slides
Circular
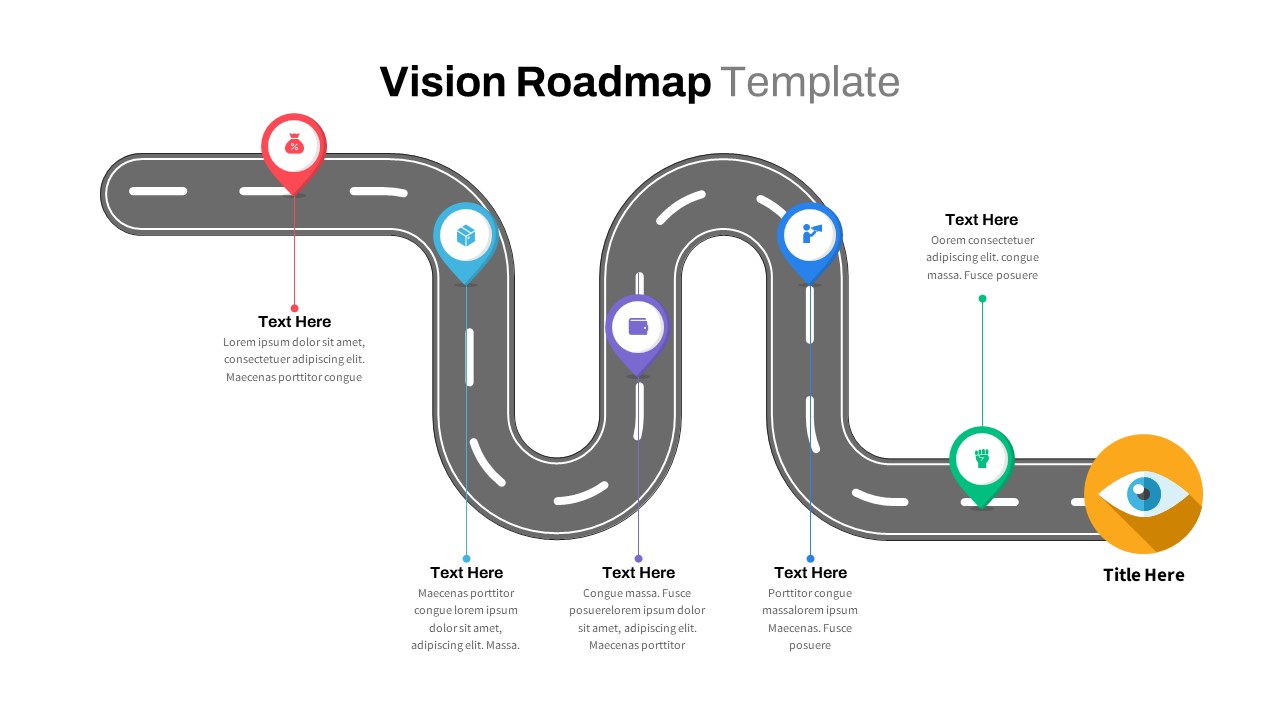
Curved Roadmap Infographic Vision Journey Template for PowerPoint & Google Slides
Business Strategy
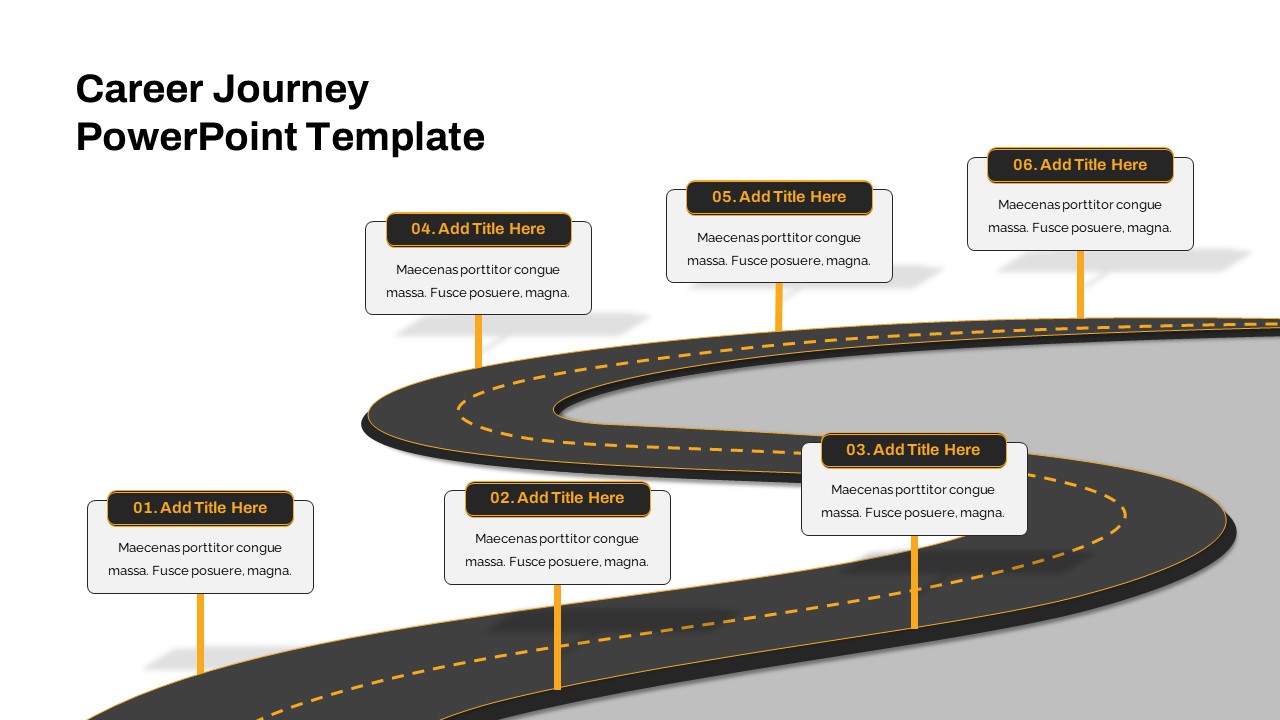
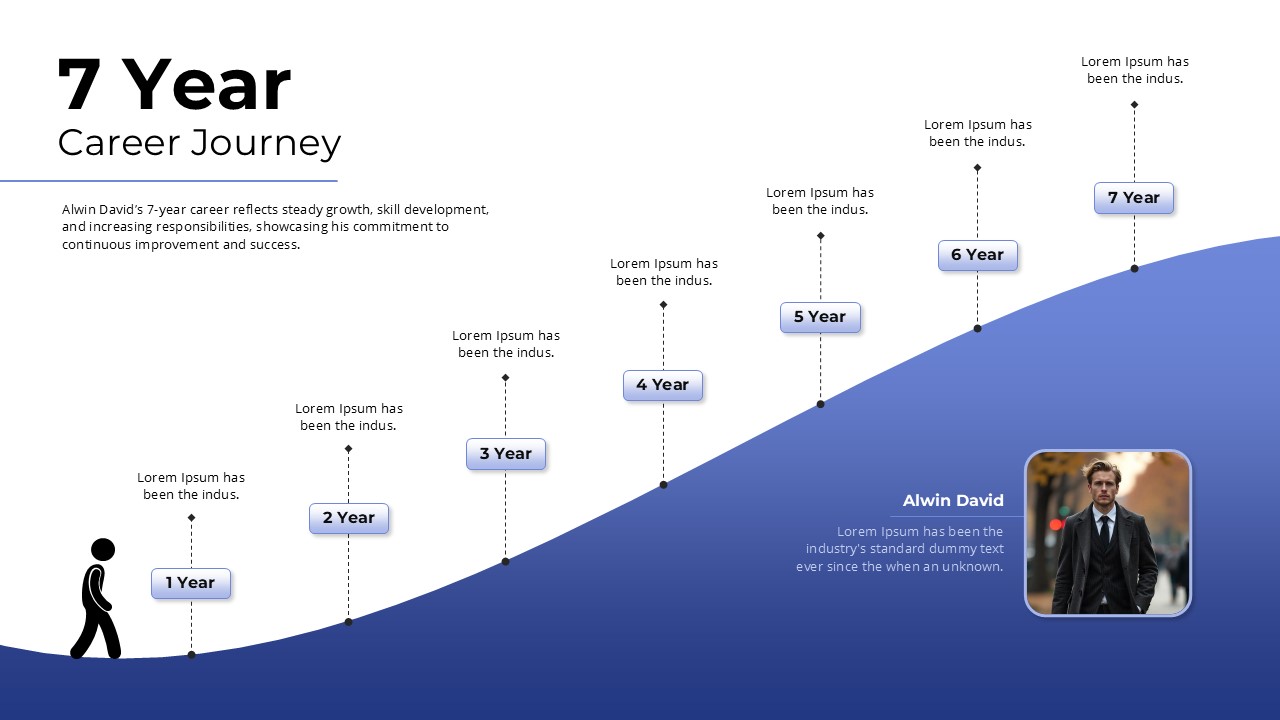
Fully Editable Career Journey Roadmap Template for PowerPoint & Google Slides
Customer Journey
Free
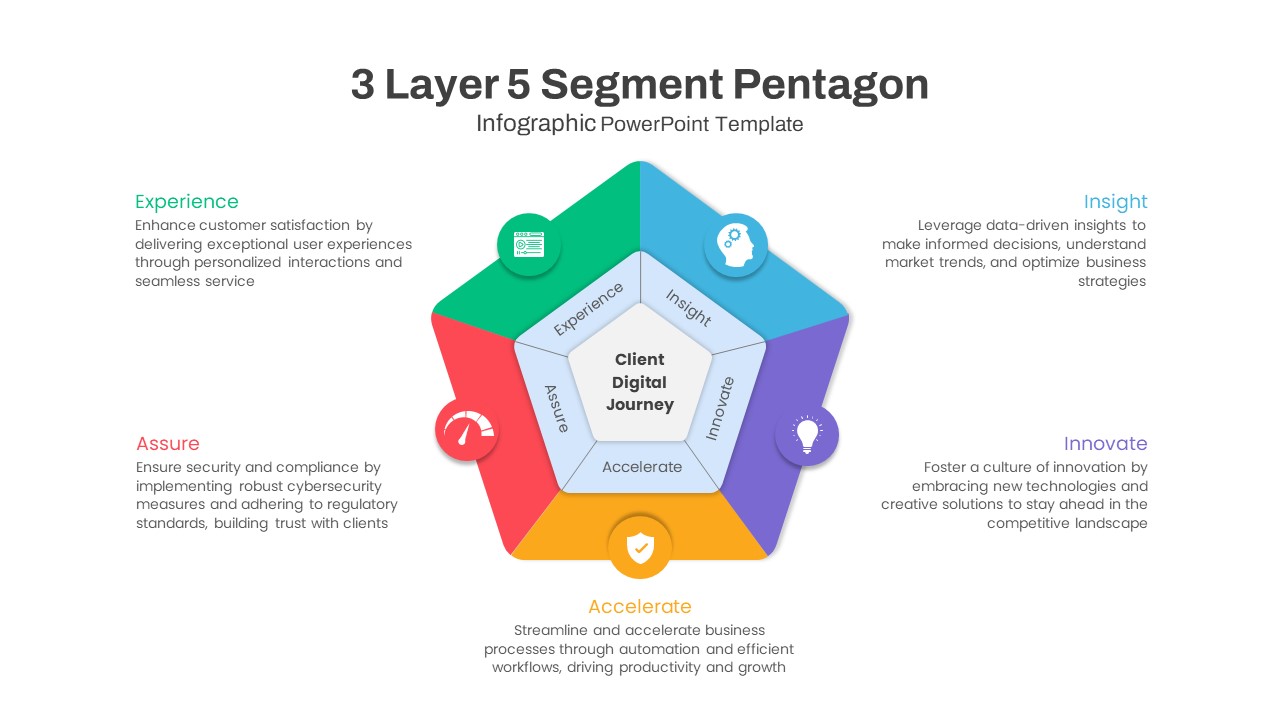
Five-Segment Pentagon Digital Journey Template for PowerPoint & Google Slides
Process
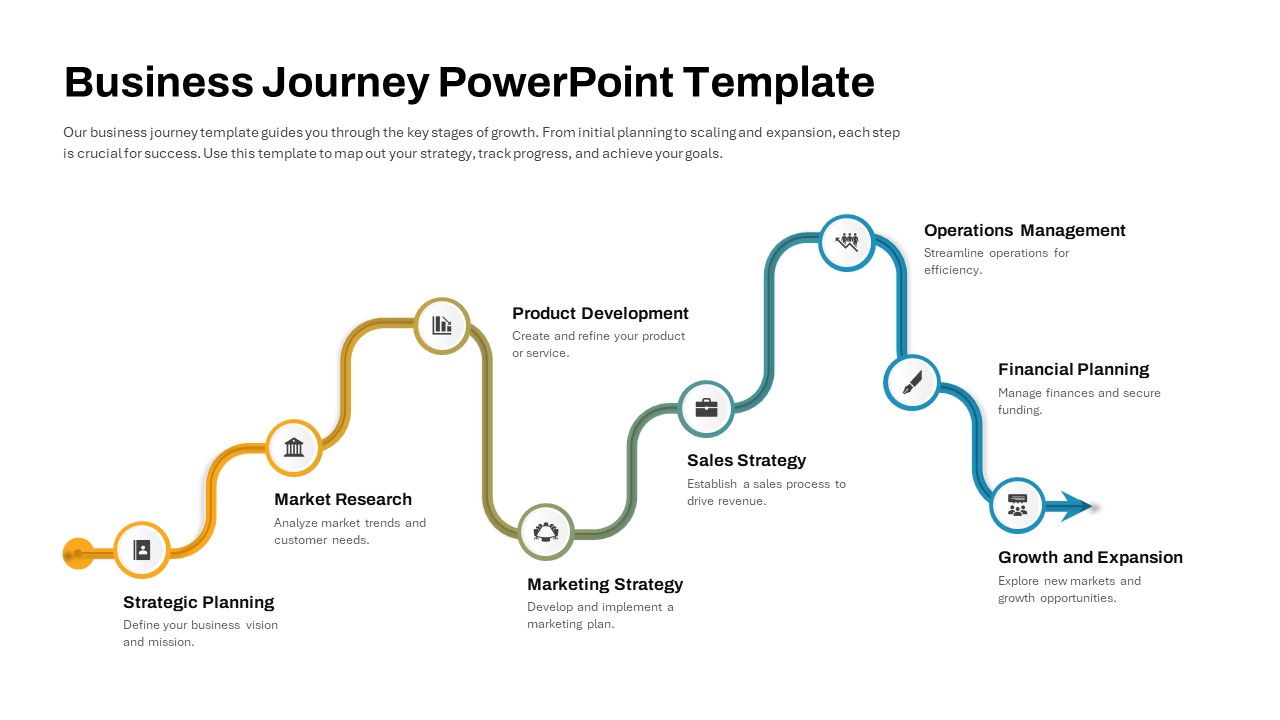
Modern Business Journey Roadmap Template for PowerPoint & Google Slides
Roadmap
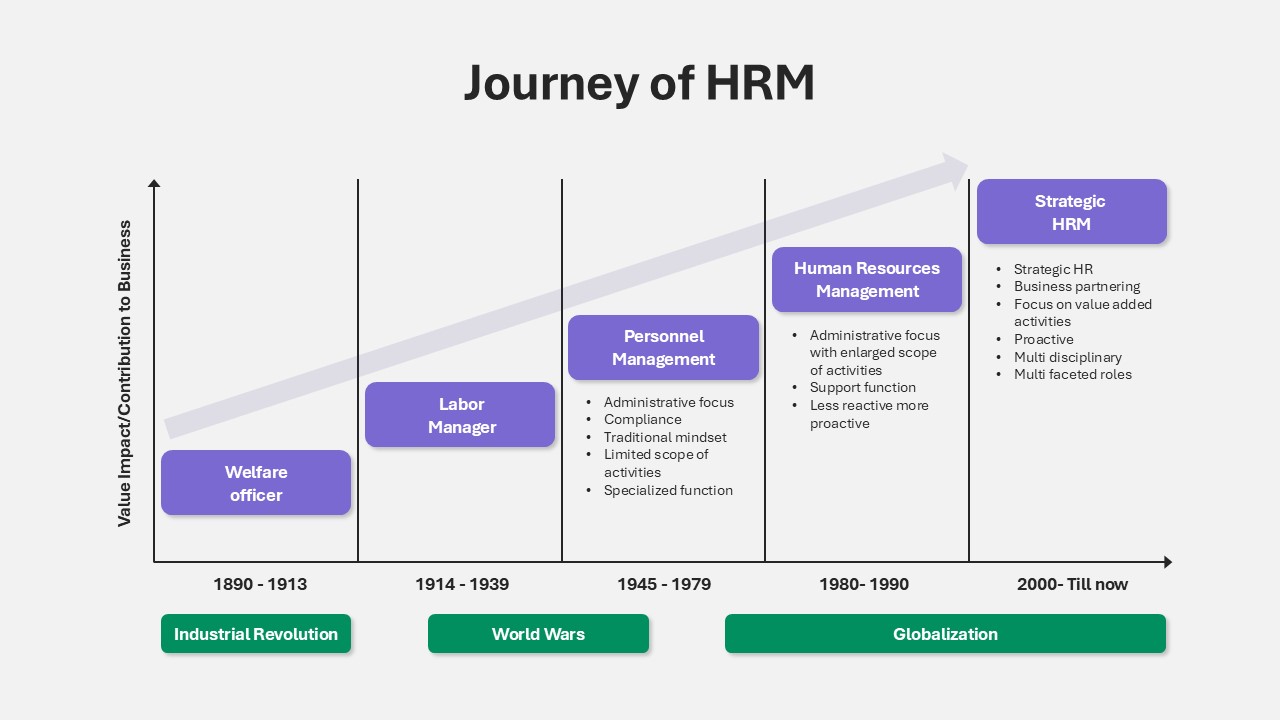
Journey of HRM Timeline Evolution Template for PowerPoint & Google Slides
HR
Career Journey Infographic Pack Template for PowerPoint & Google Slides
Timeline
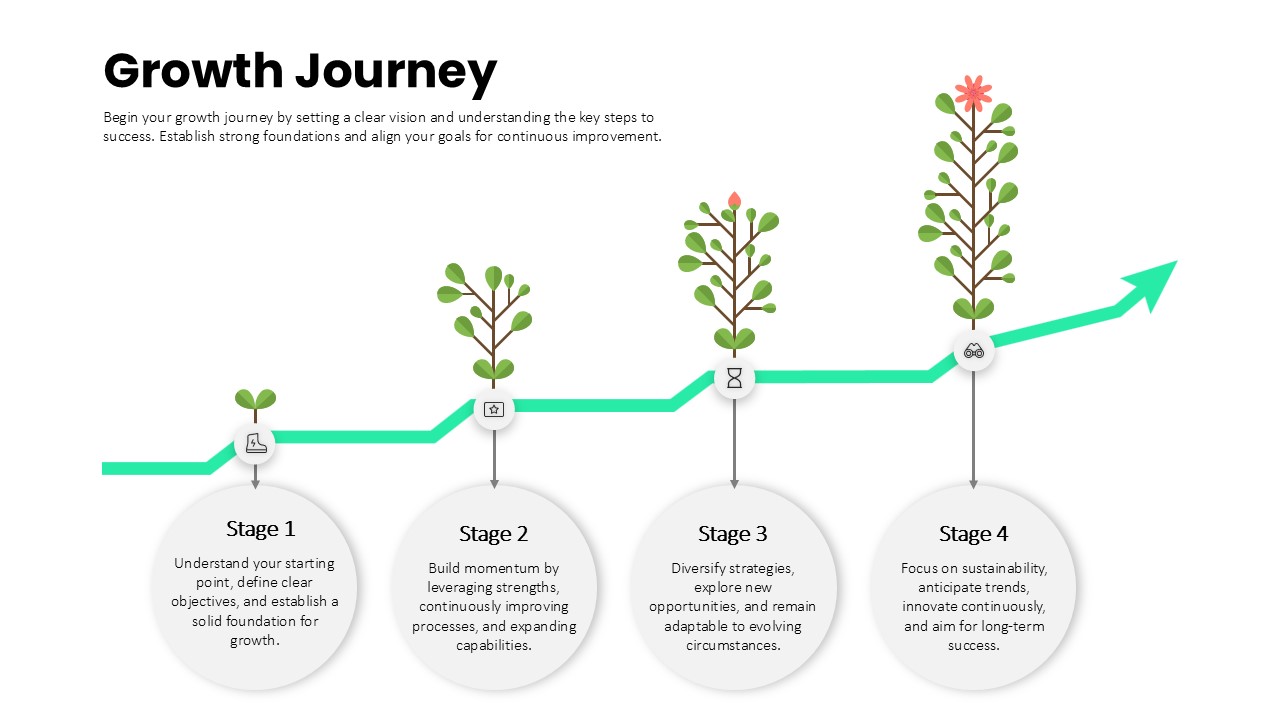
Growth Journey Stages Process template for PowerPoint & Google Slides
Business Strategy
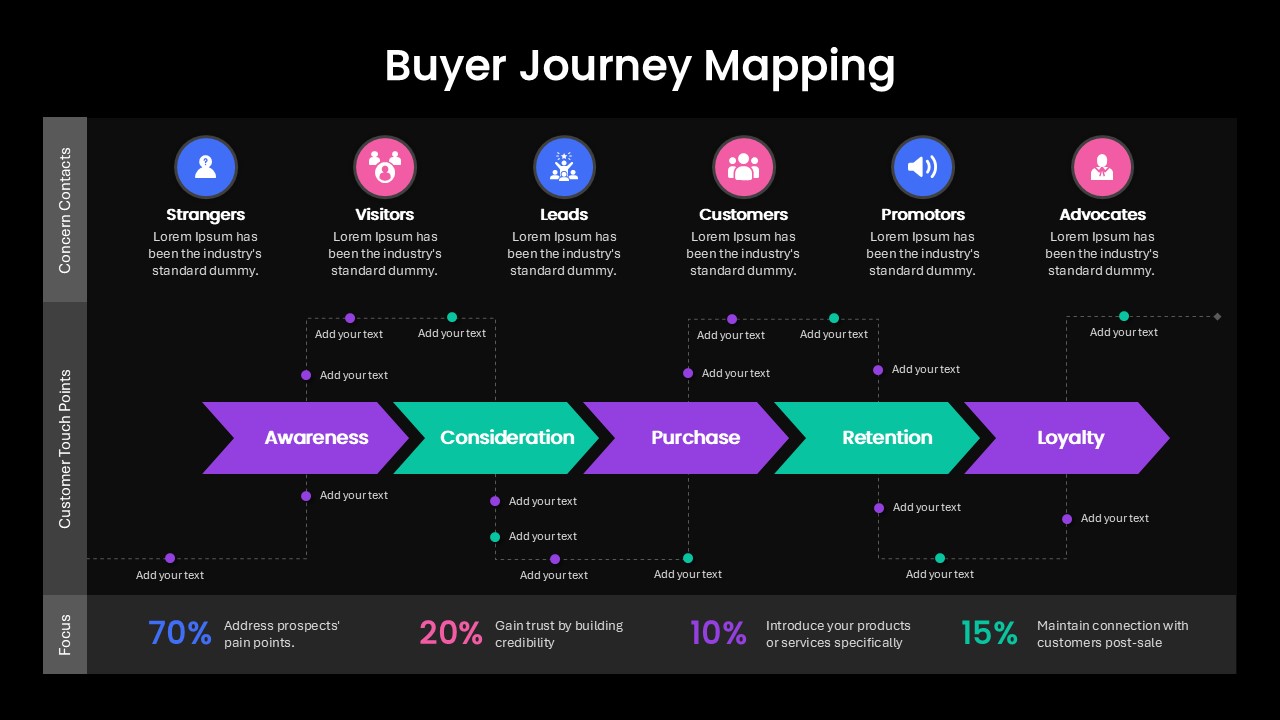
Buyer Journey Mapping Process Diagram Template for PowerPoint & Google Slides
Process
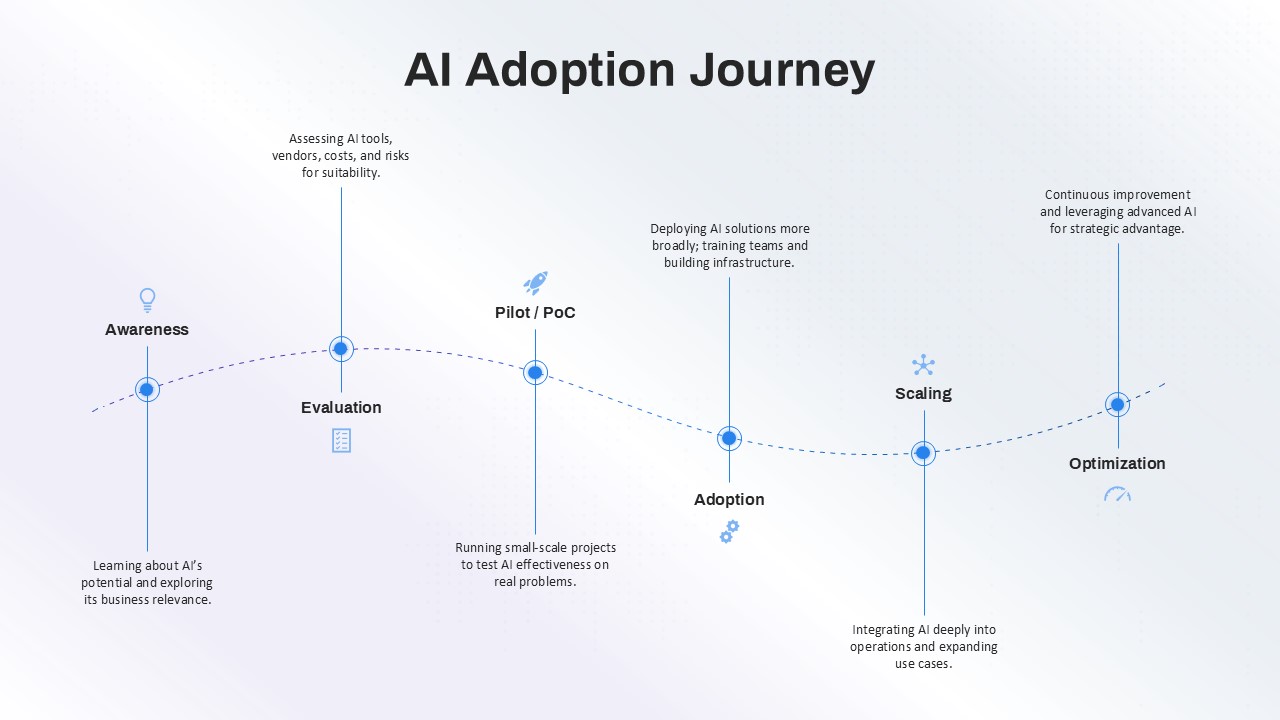
AI Adoption Journey template for PowerPoint & Google Slides
AI
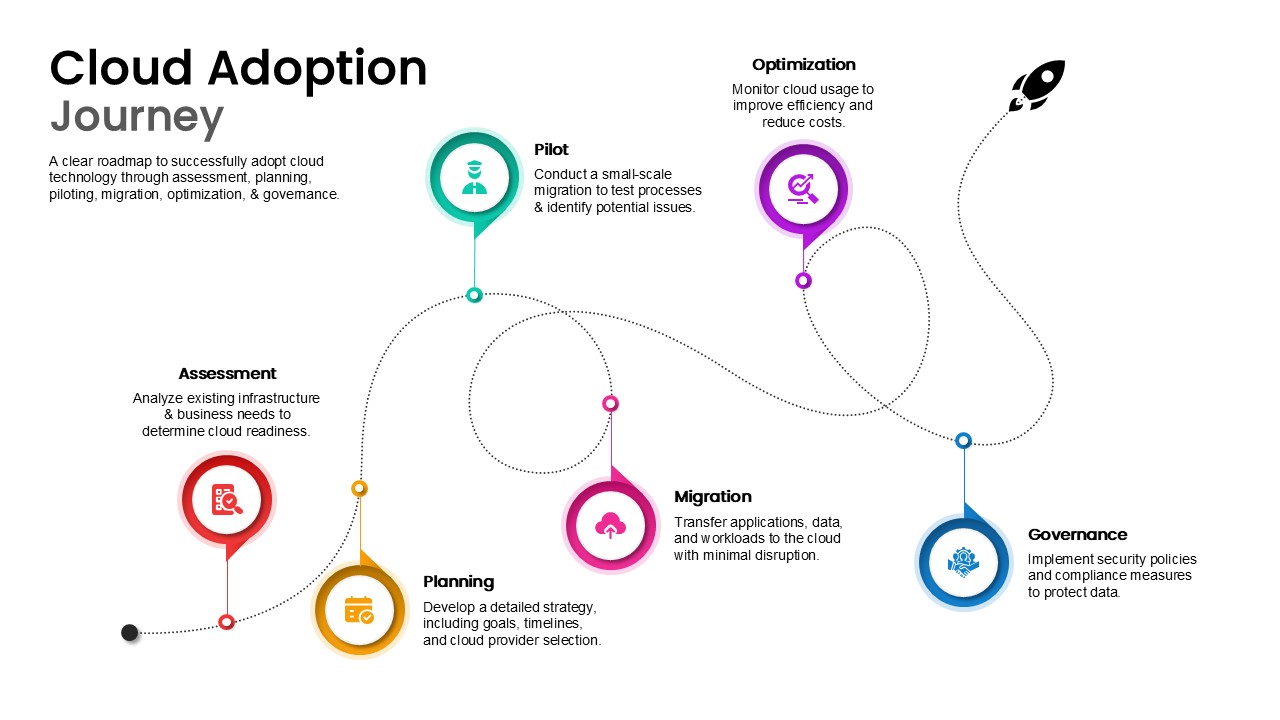
Cloud Adoption Journey Roadmap Template for PowerPoint & Google Slides
Cloud Computing
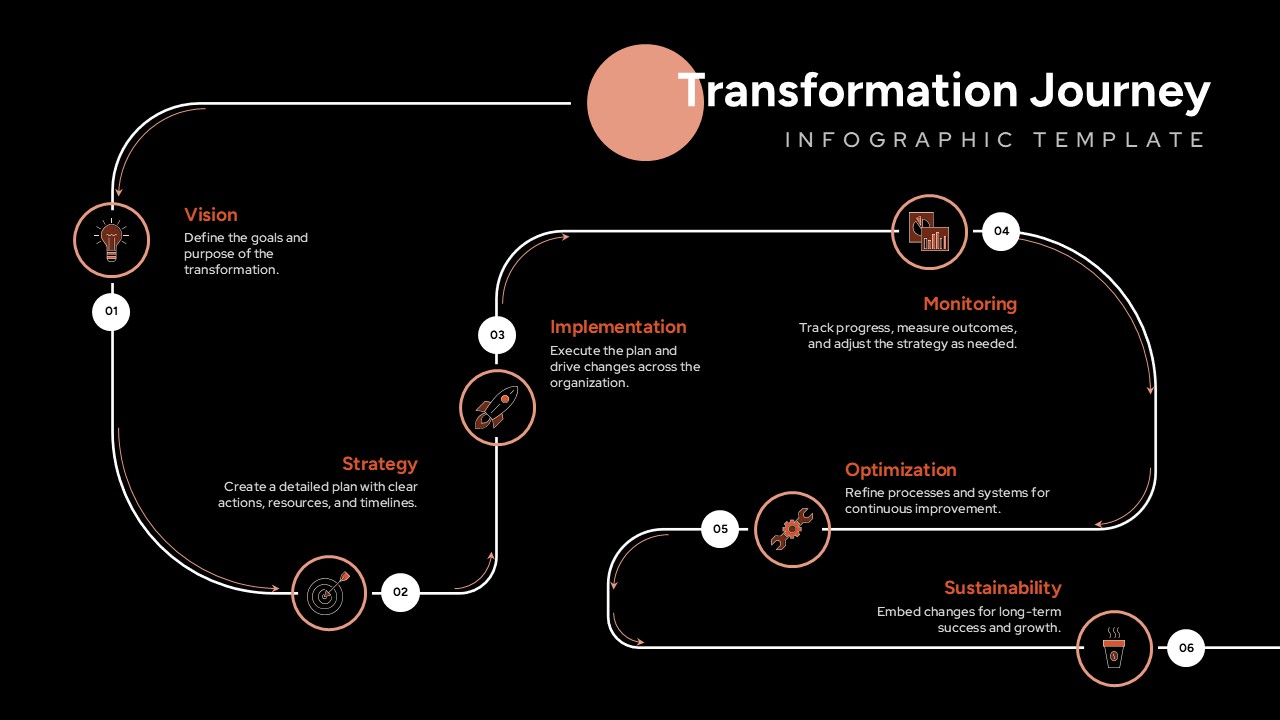
Transformation Journey Infographic Template for PowerPoint & Google Slides
Process
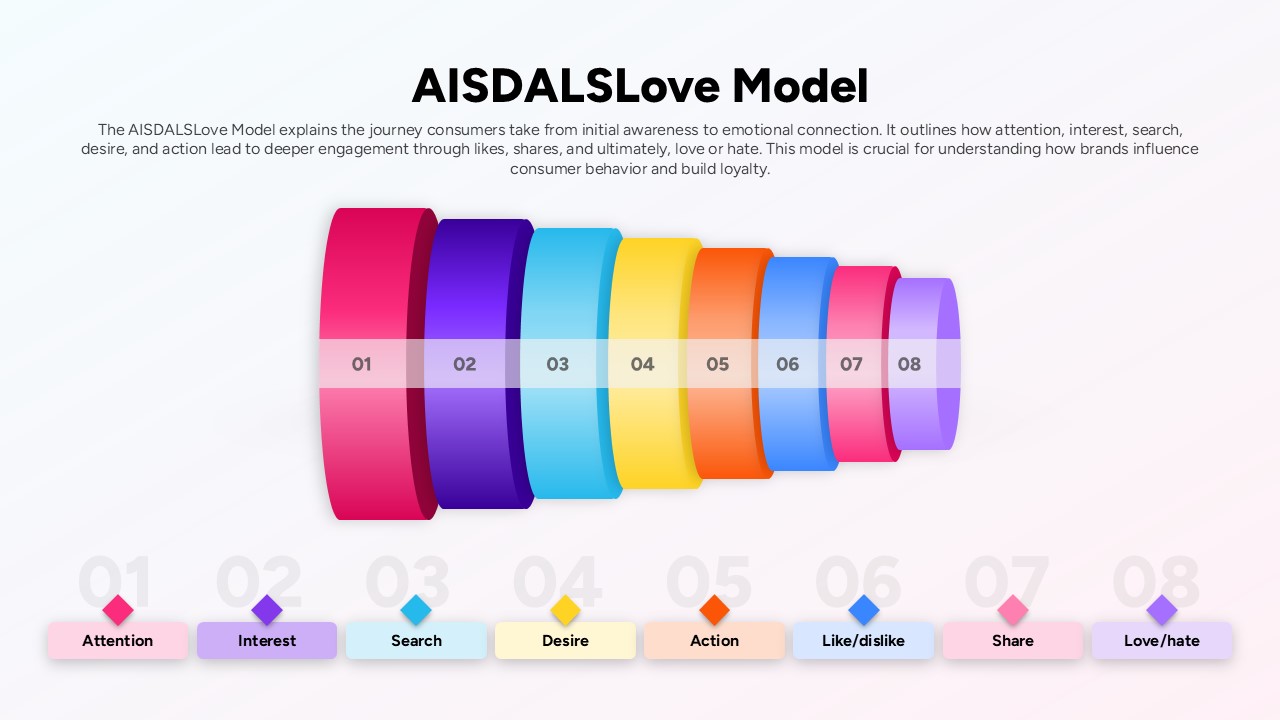
AISDALSLove Consumer Journey Model Slide Template for PowerPoint & Google Slides
Customer Journey
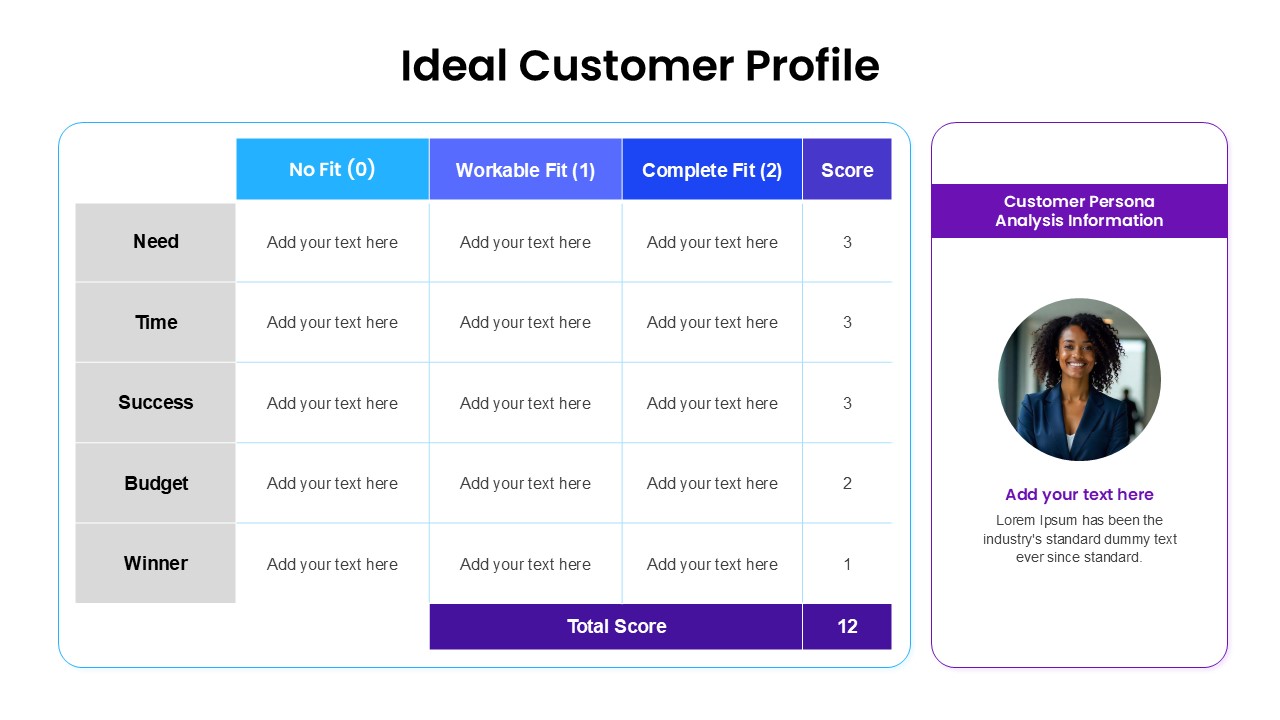
Ideal Customer Profile PowerPoint Template for PowerPoint & Google Slides
Business Strategy
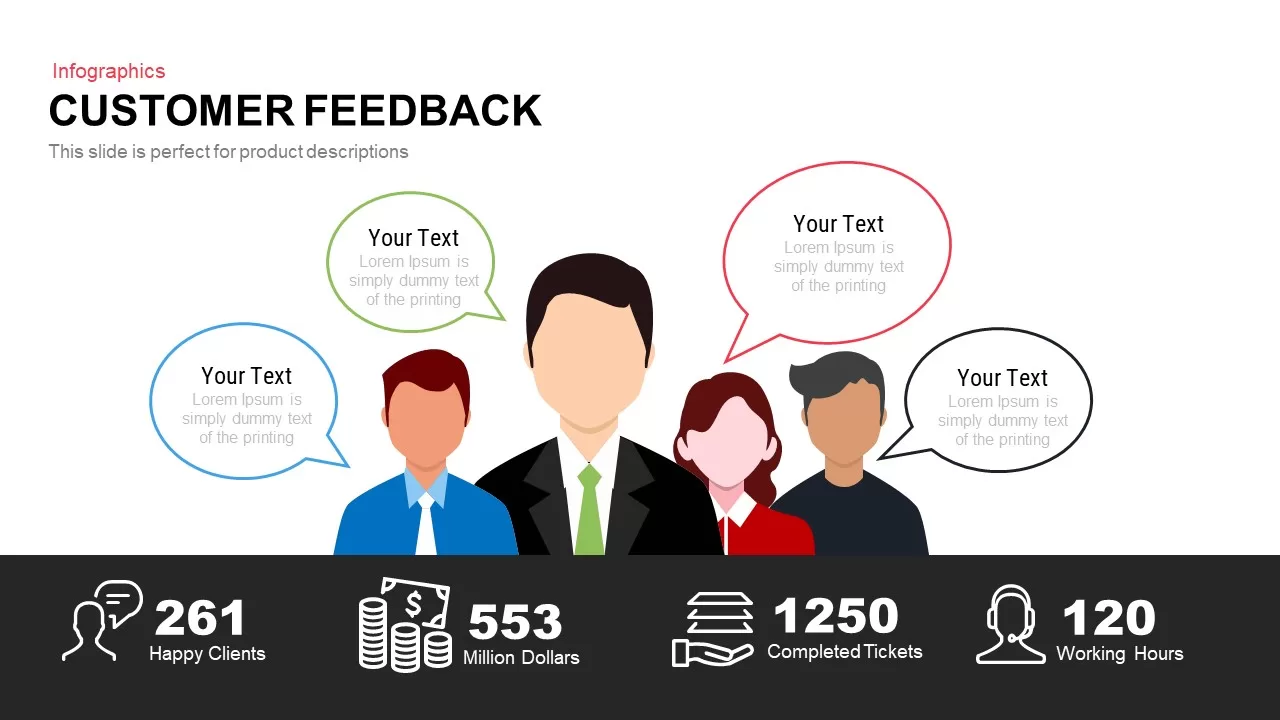
Customer Feedback Infographic Slide Template for PowerPoint & Google Slides
Customer Experience

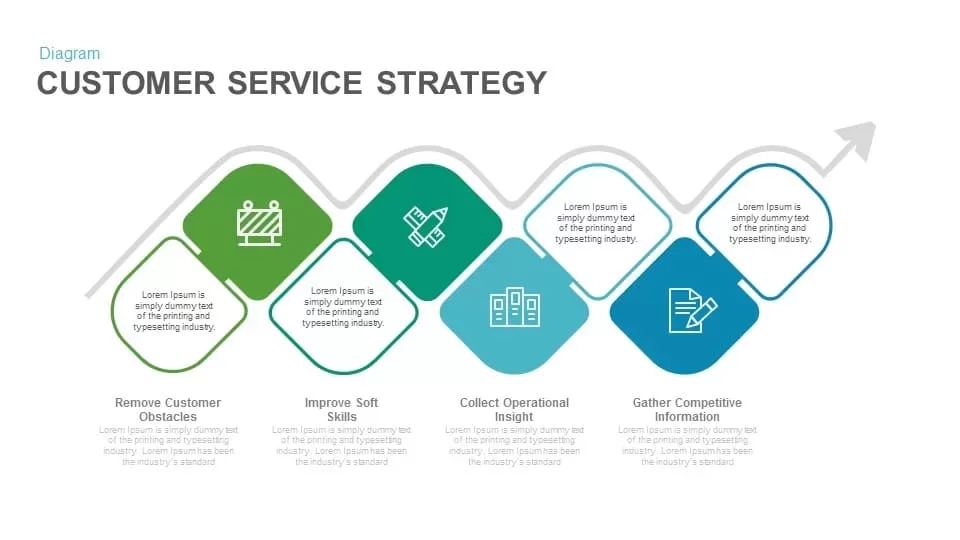
Customer Service Strategy template for PowerPoint & Google Slides
Business Strategy
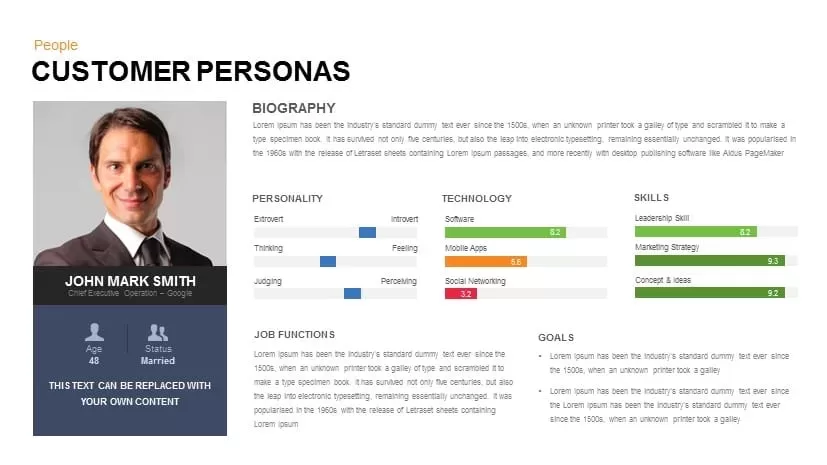
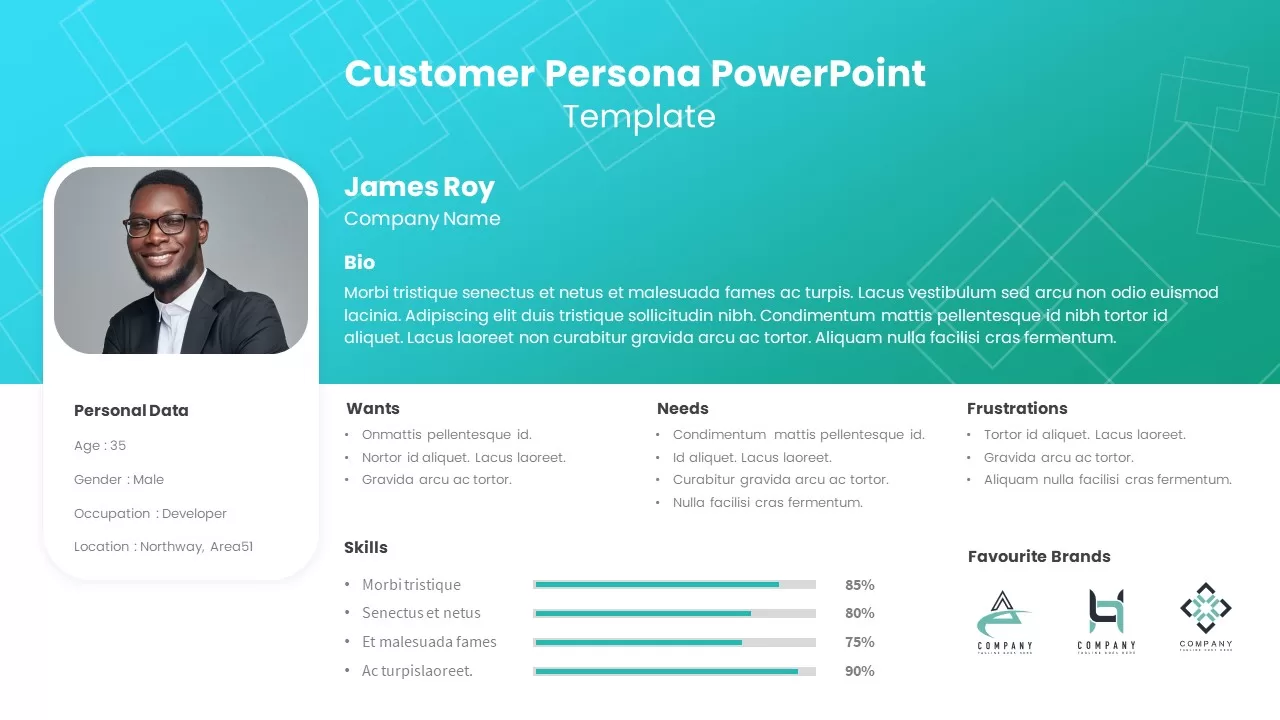
Customer Persona Template for PowerPoint & Google Slides
Customer Journey
Modern Customer Acquisition Strategy Template for PowerPoint & Google Slides
Customer Journey
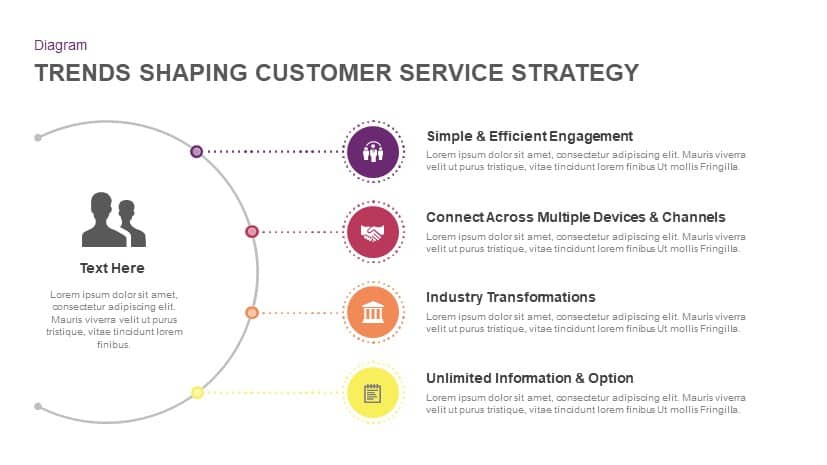
Trends Shaping Customer Service Strategy template for PowerPoint & Google Slides
Marketing
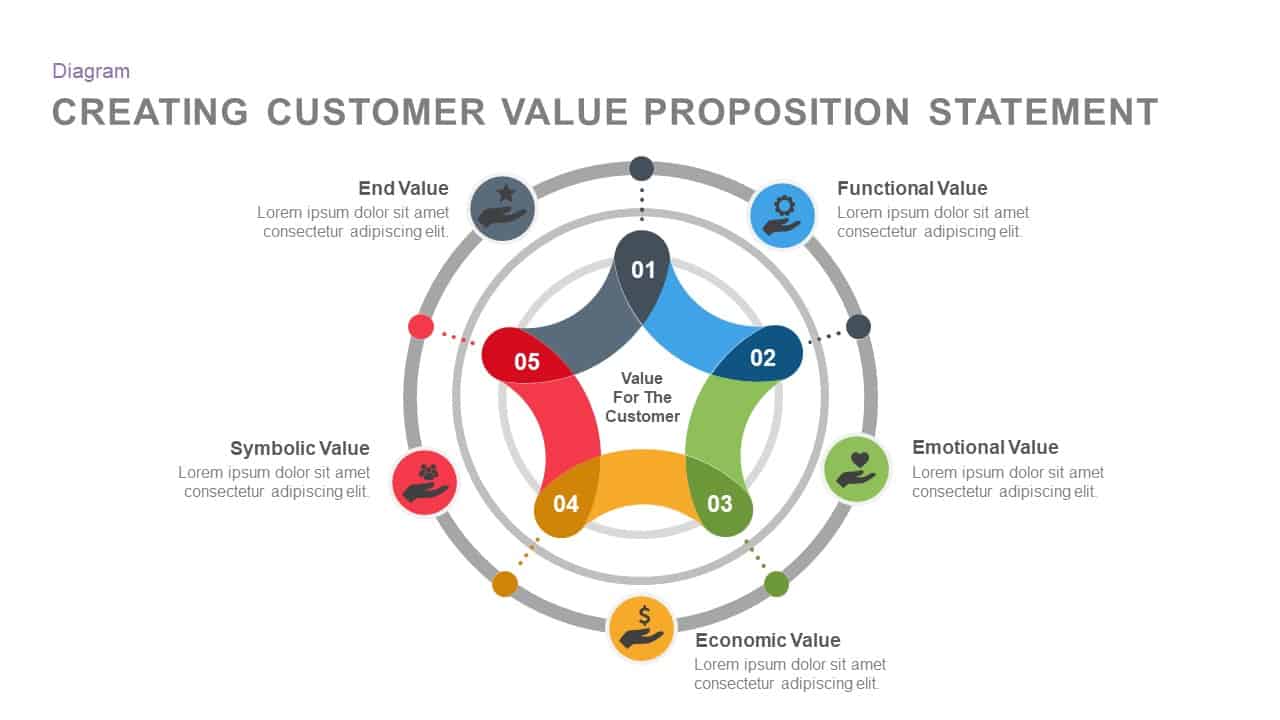
Customer Value Proposition Diagram Template for PowerPoint & Google Slides
Circular
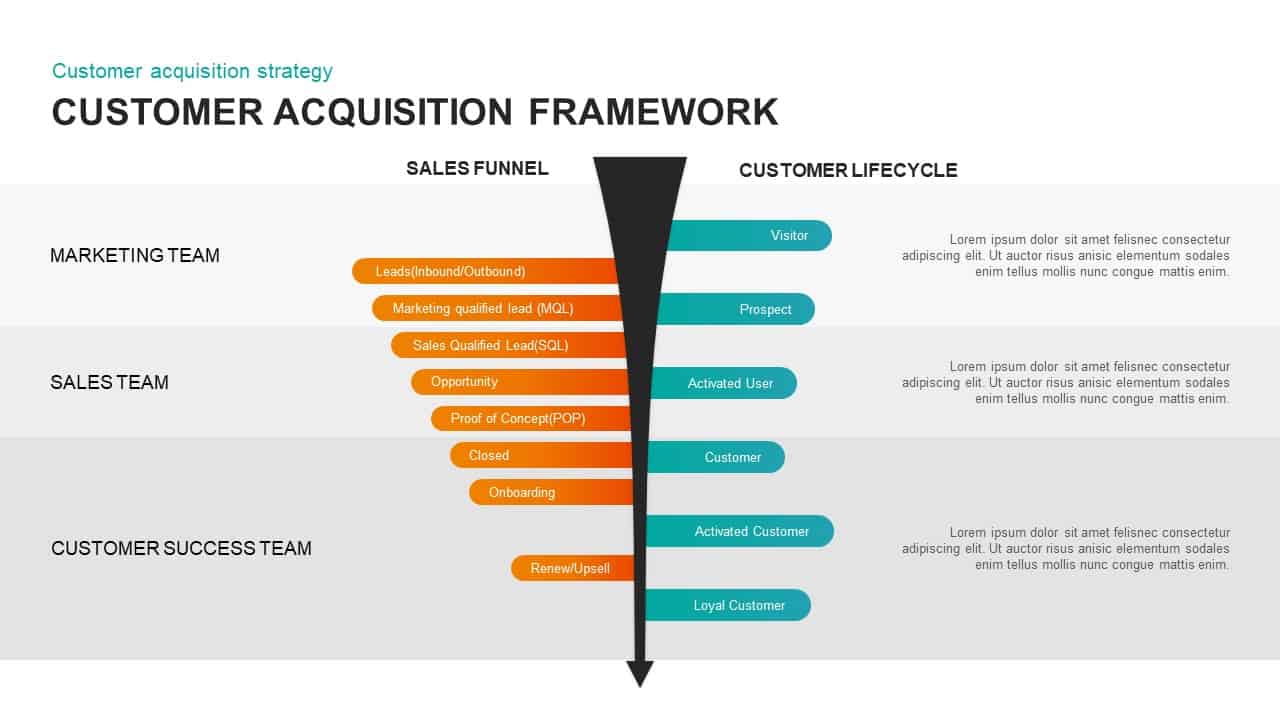
Customer Acquisition Framework Template for PowerPoint & Google Slides
Funnel
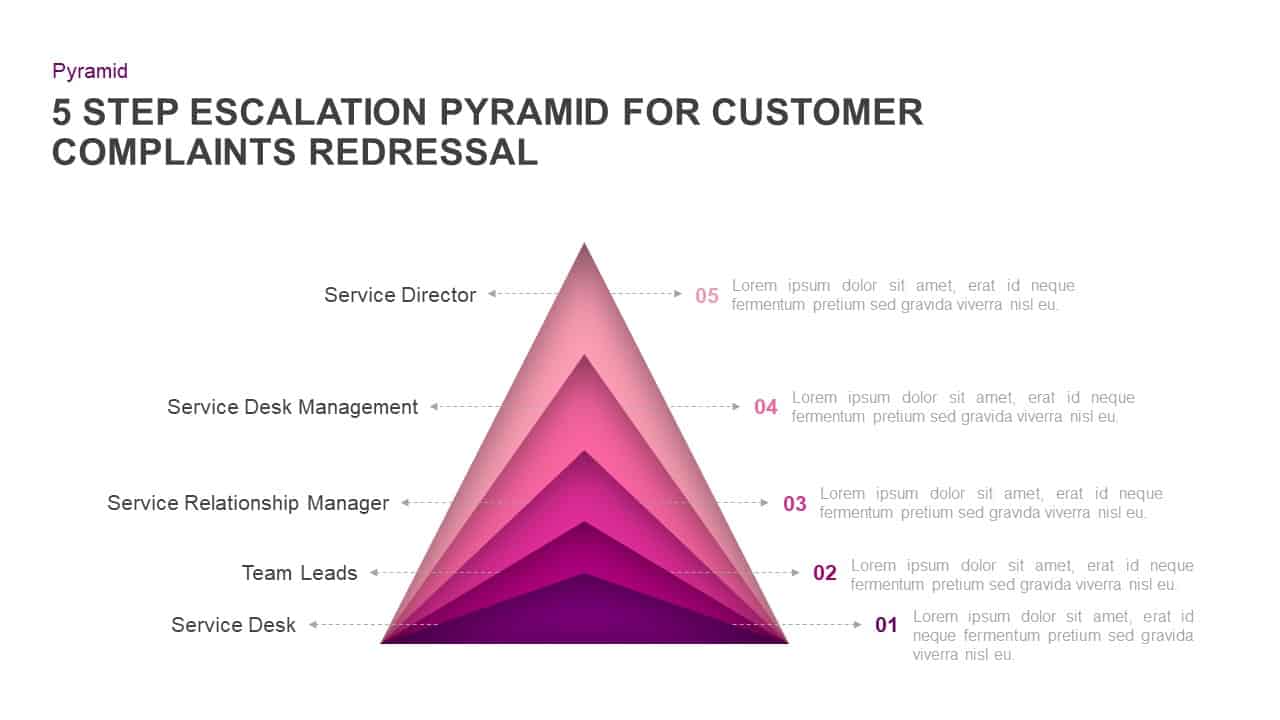
Customer Complaints Escalation Pyramid Template for PowerPoint & Google Slides
Infographics
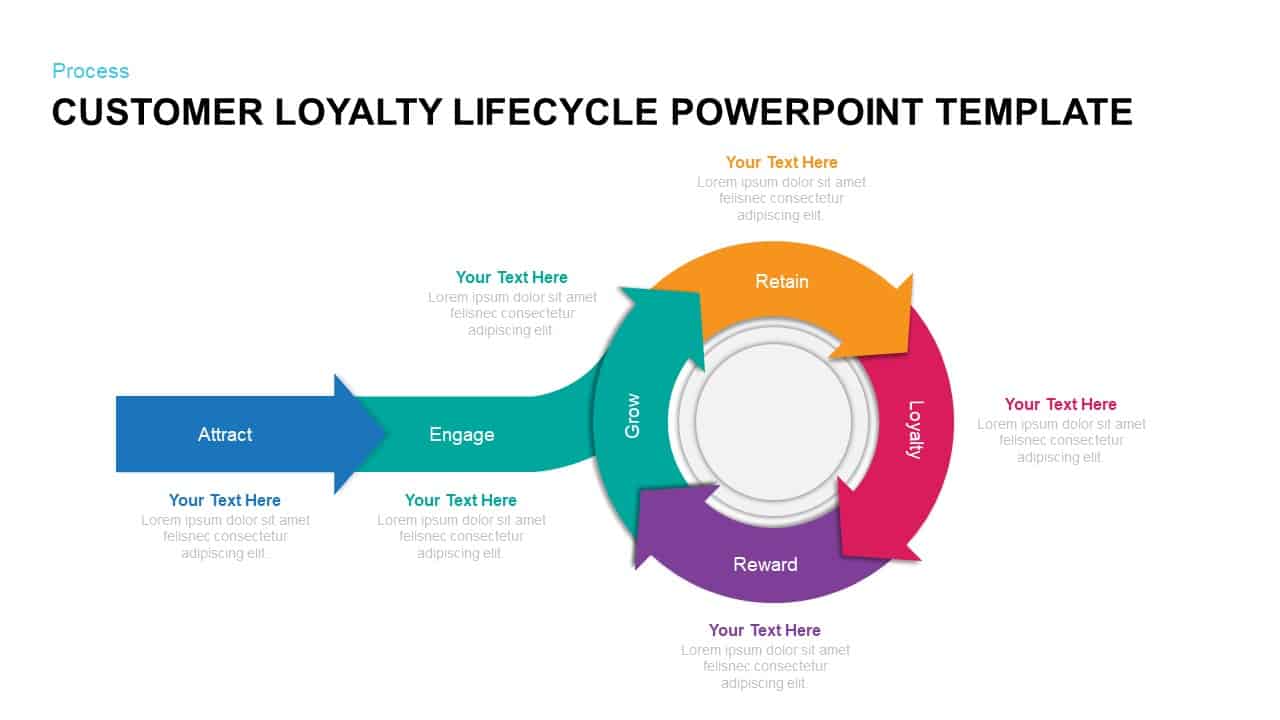
Customer Loyalty Lifecycle Process Template for PowerPoint & Google Slides
Process
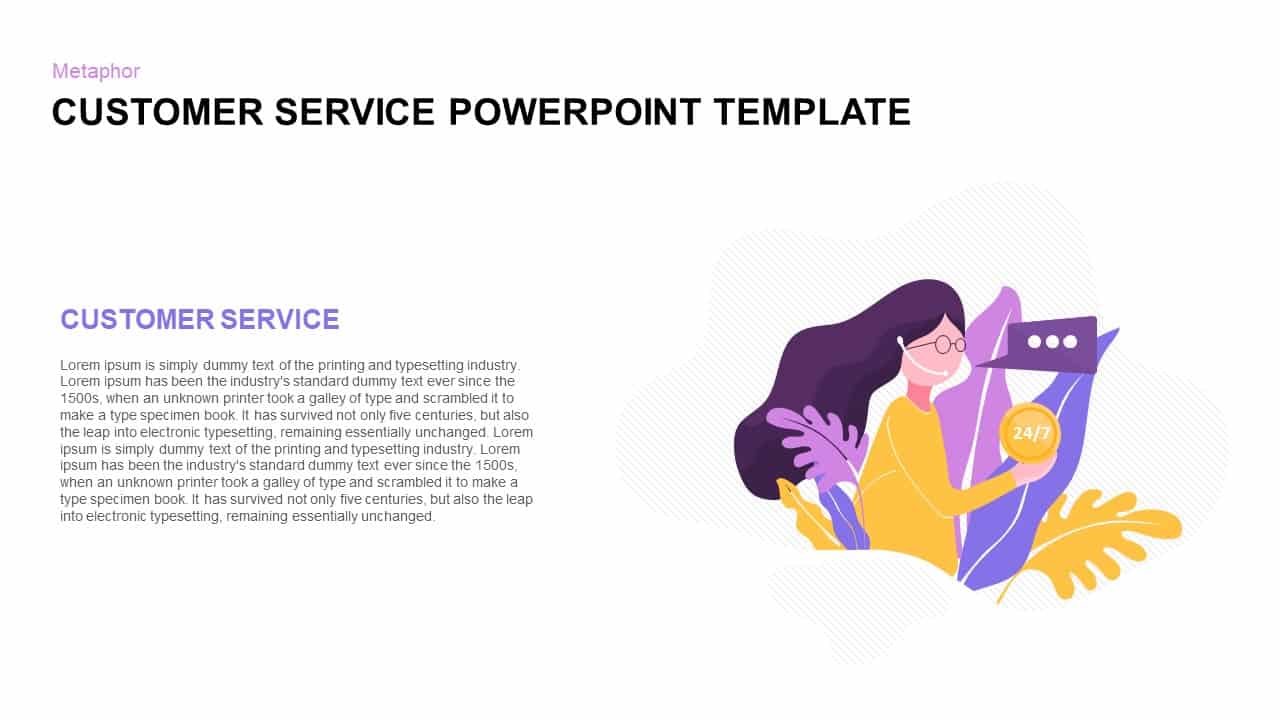
Customer Service Metaphor Infographic Template for PowerPoint & Google Slides
Customer Experience
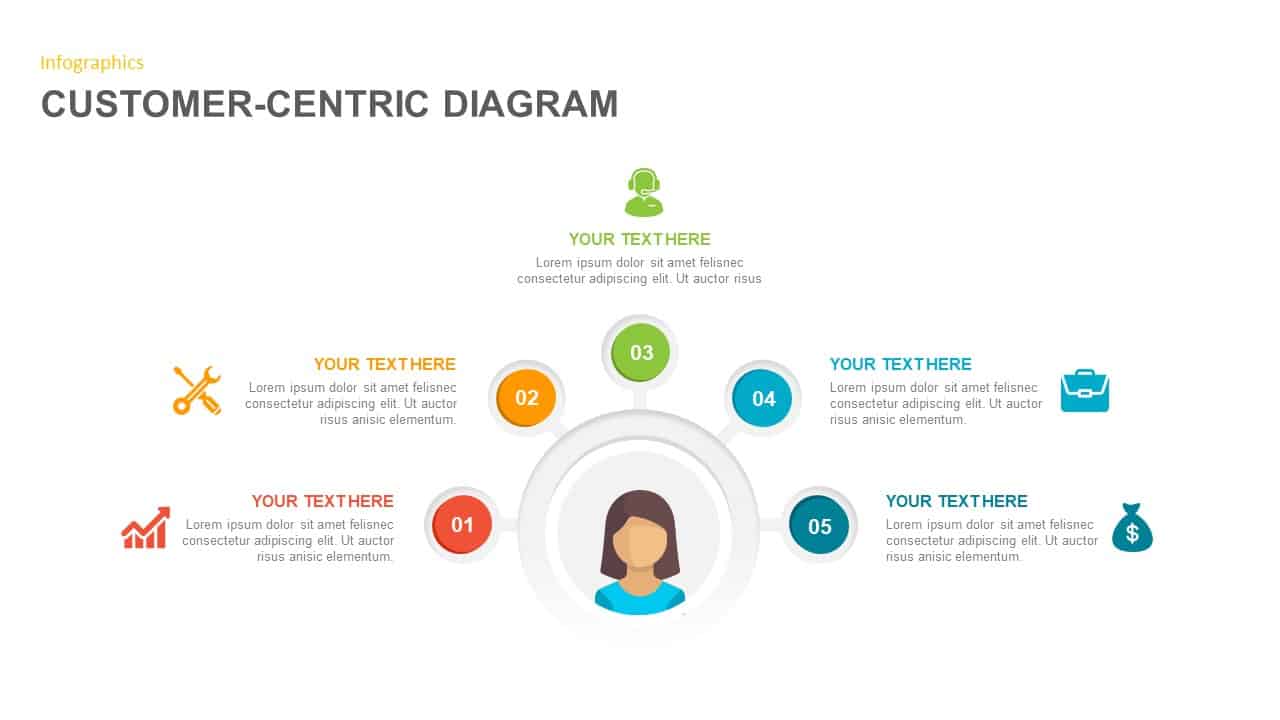
Customer-Centric Hub and Spoke Diagram Template for PowerPoint & Google Slides
Customer Experience
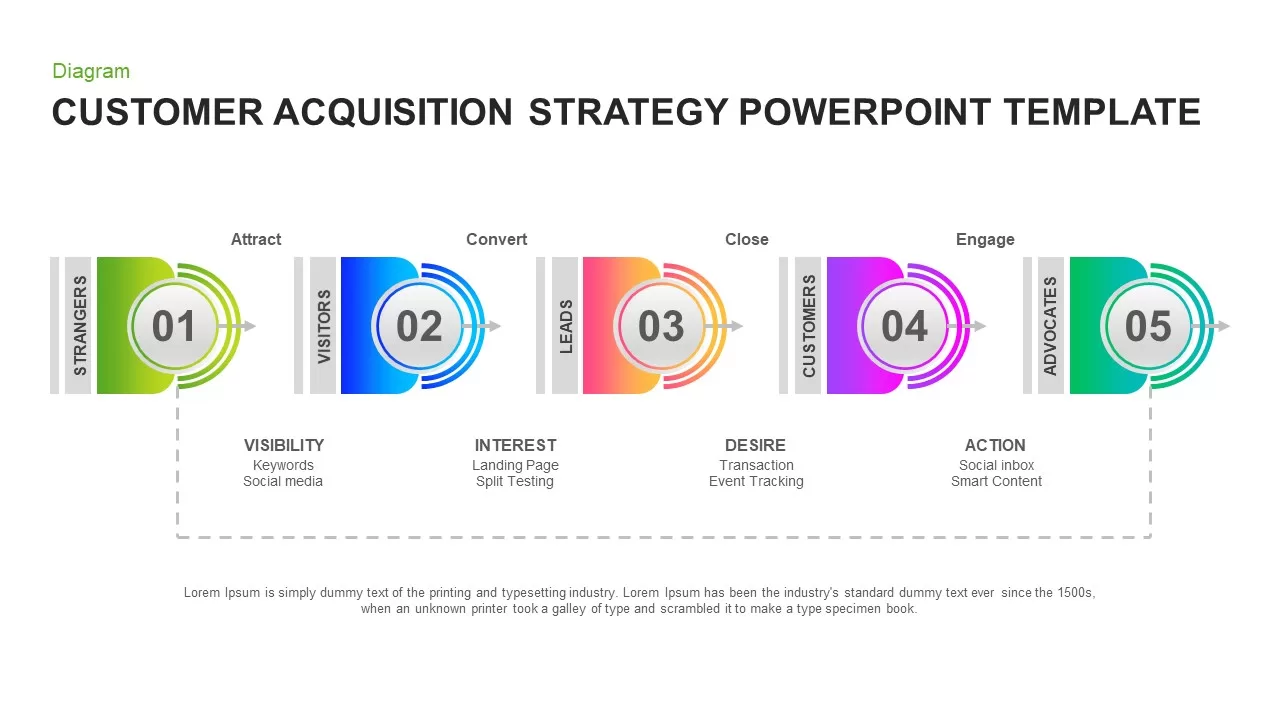
Customer Acquisition Strategy Diagram Template for PowerPoint & Google Slides
Customer Journey
Voice of Customer Overview template for PowerPoint & Google Slides
Customer Journey
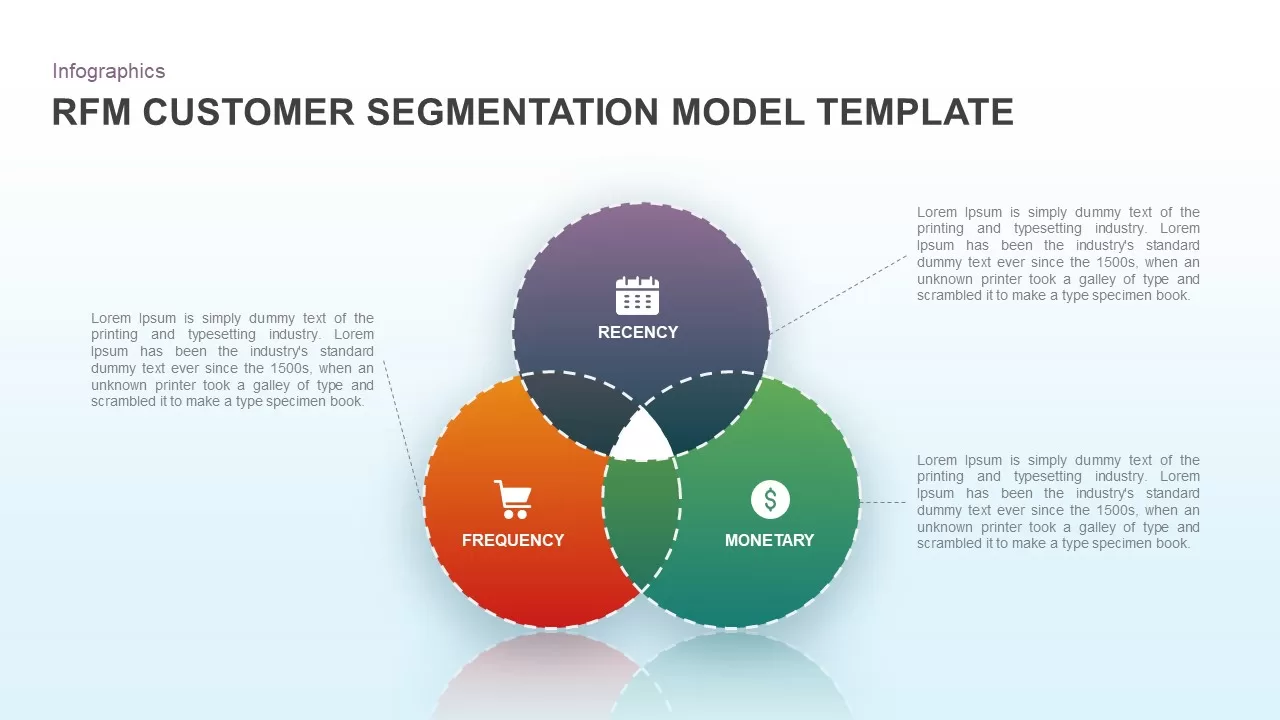
RFM Customer Segmentation Template for PowerPoint & Google Slides
Business Models
Customer Persona Profile template for PowerPoint & Google Slides
Marketing
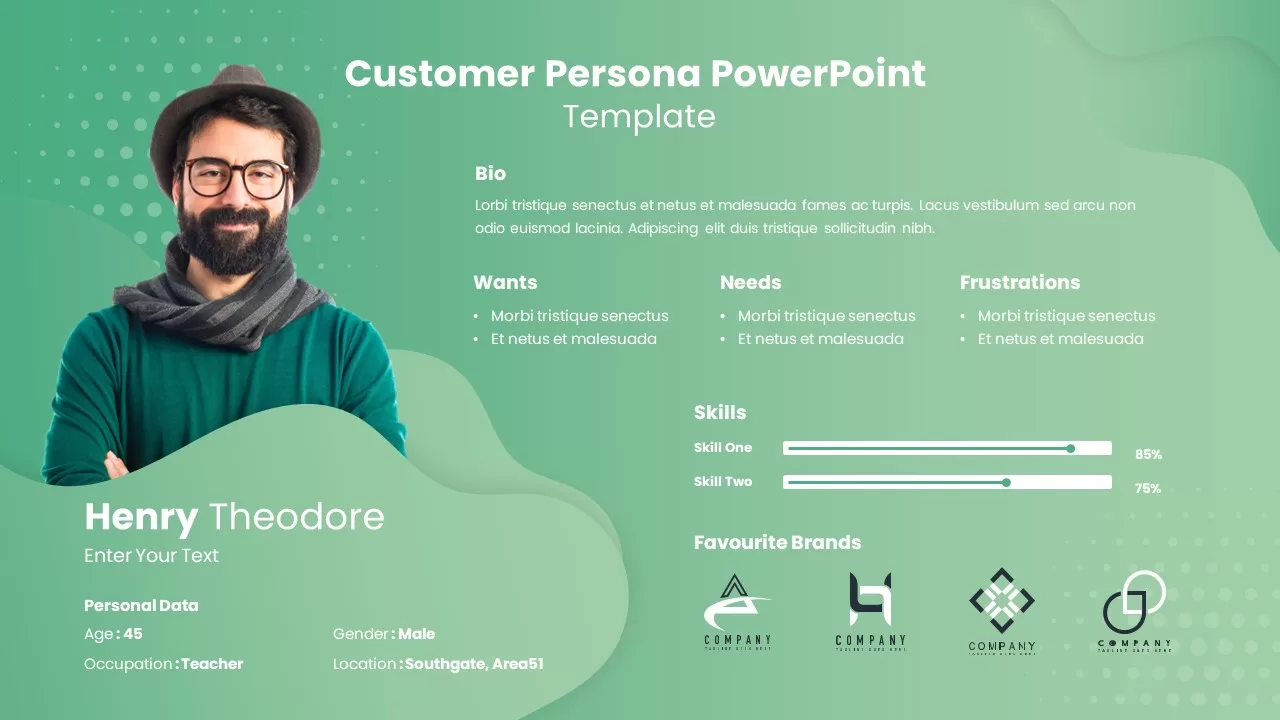
Customer Persona template for PowerPoint & Google Slides
Customer Journey
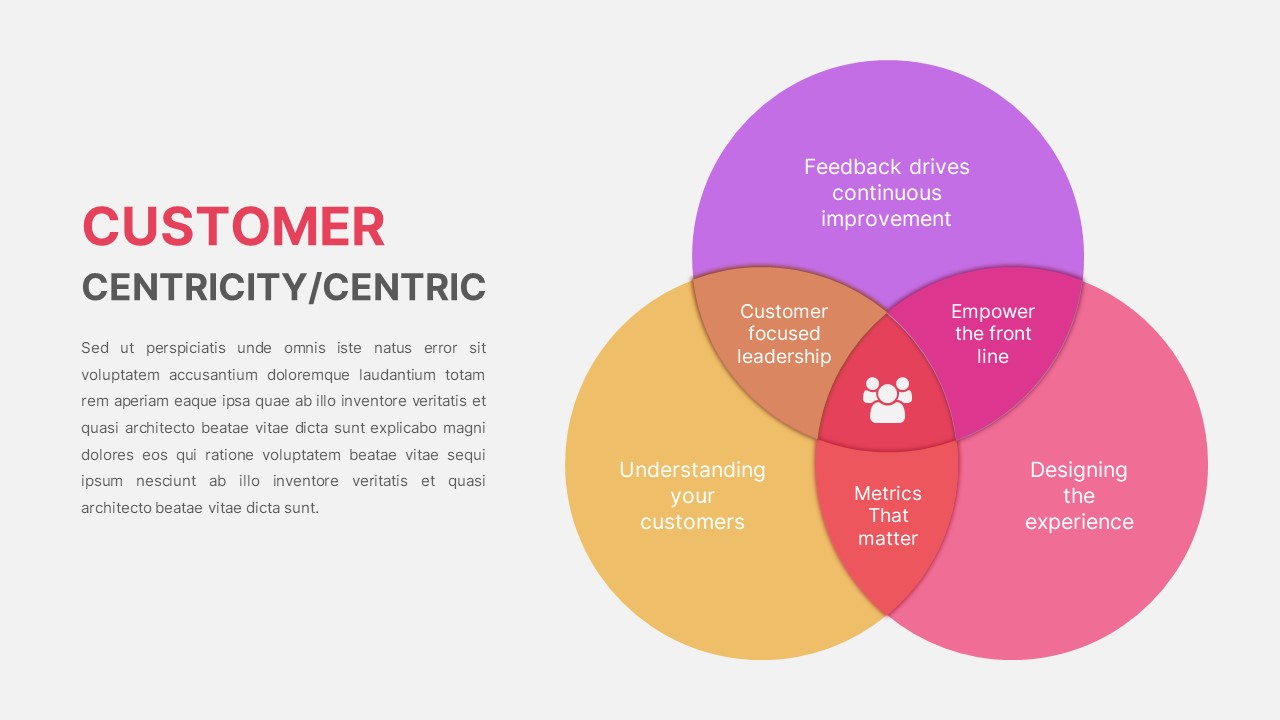
Customer Centricity Venn Diagram template for PowerPoint & Google Slides
Infographics
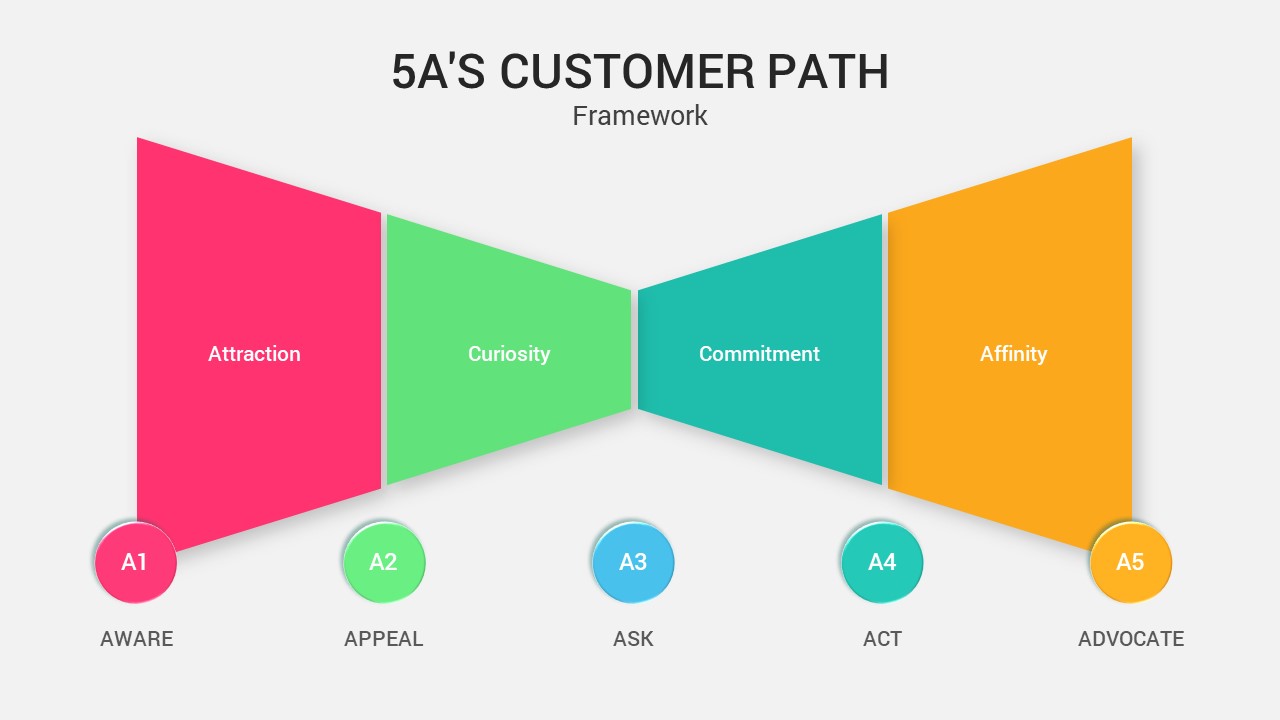
5A’s Customer Path Framework Diagram Template for PowerPoint & Google Slides
Process
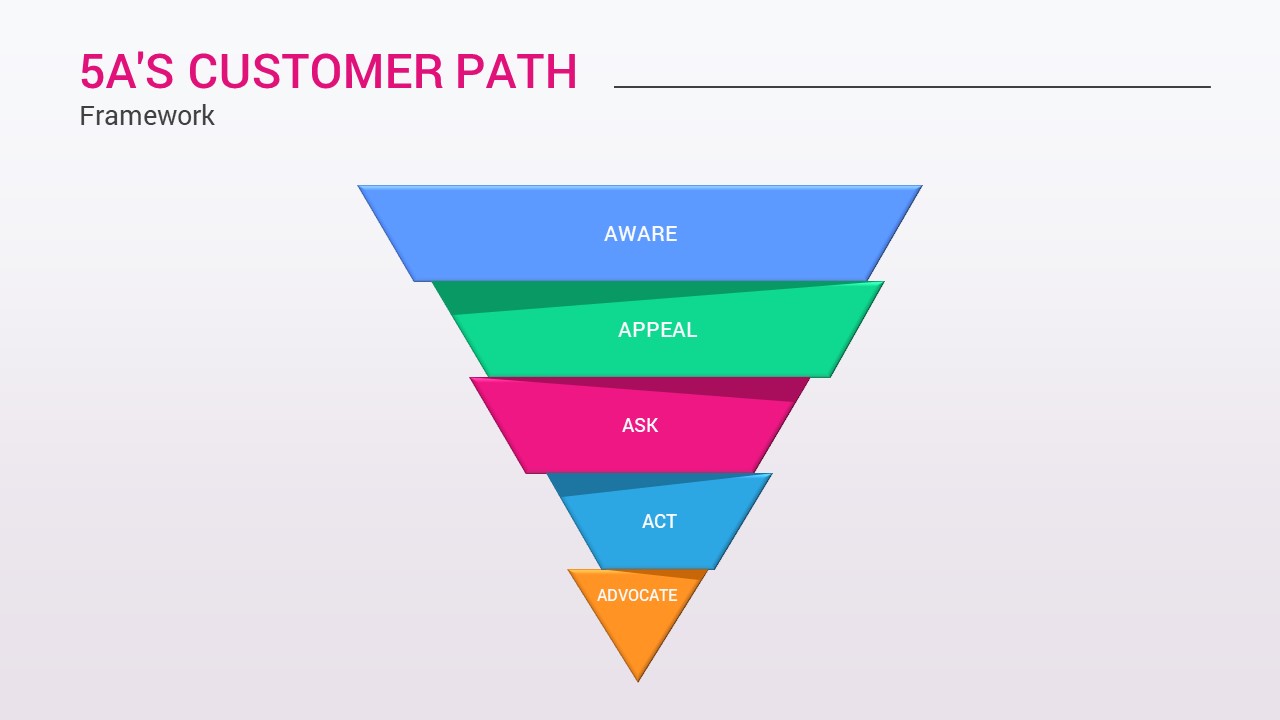
5A’s Customer Path Funnel Diagram Template for PowerPoint & Google Slides
Funnel
Customer Support Template for PowerPoint & Google Slides
Customer Experience
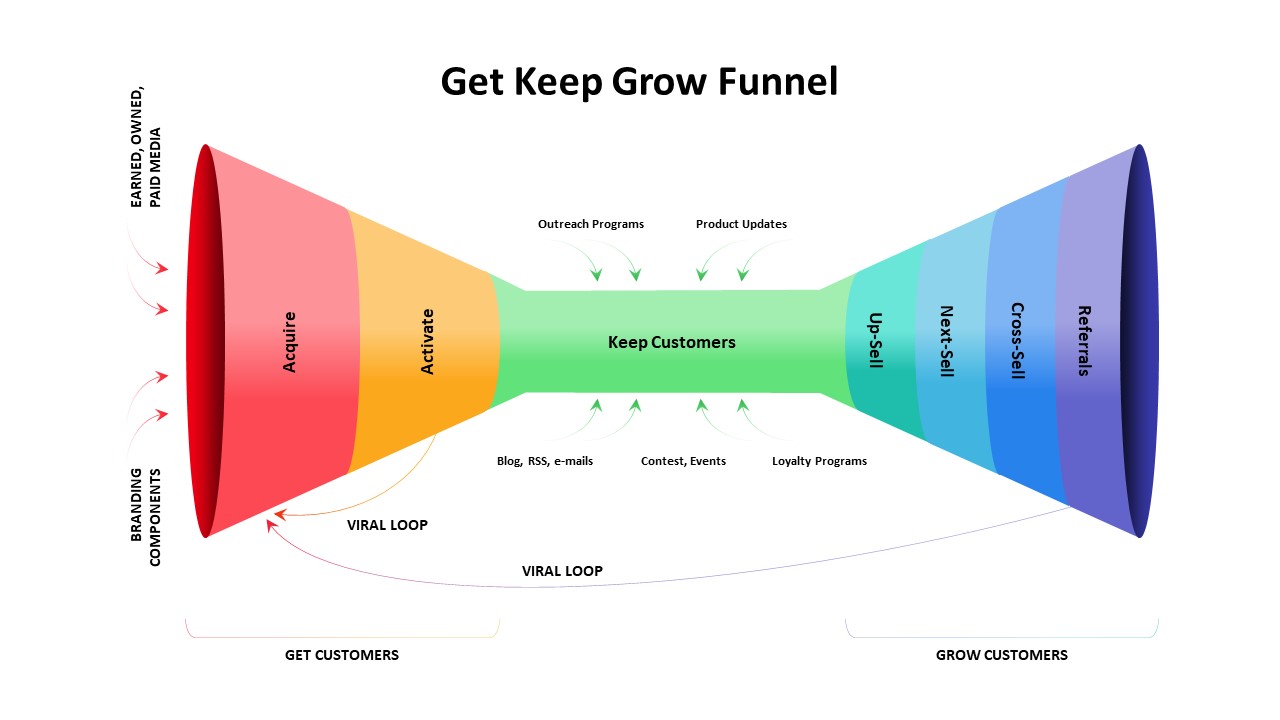
Get Keep Grow Customer Funnel Lifecycle Template for PowerPoint & Google Slides
Funnel
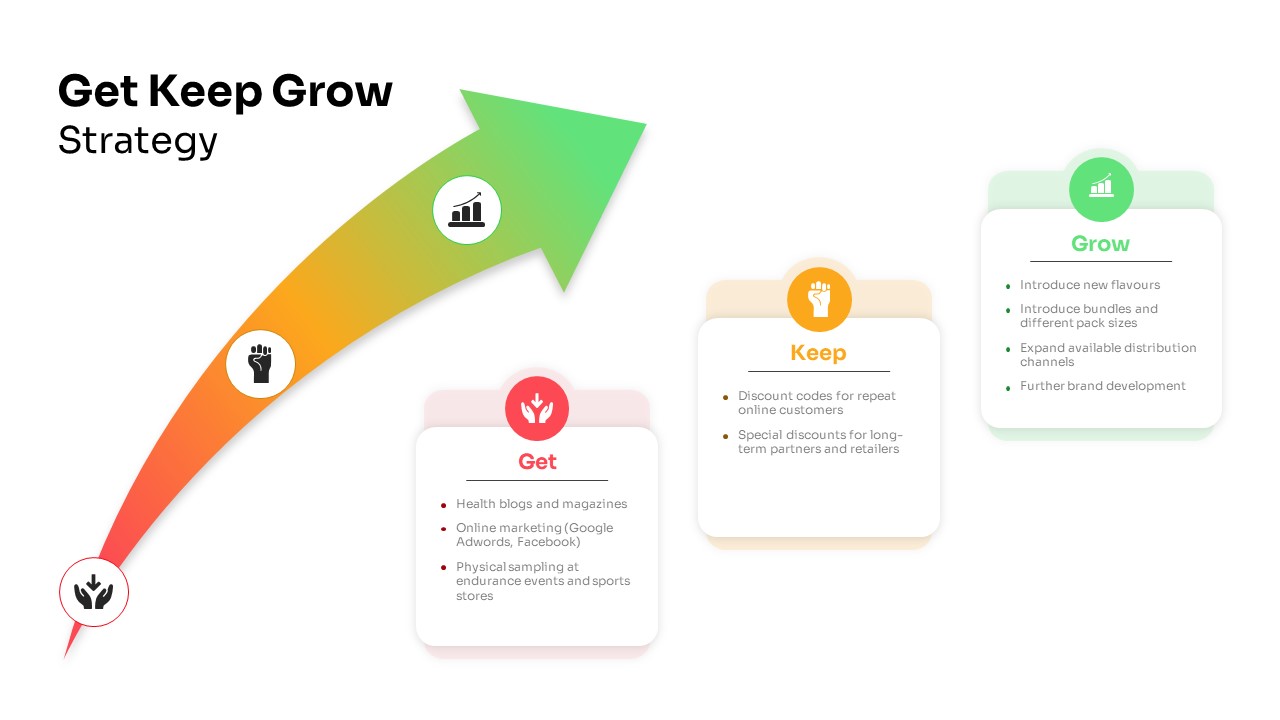
Get Keep Grow Customer Strategy Template for PowerPoint & Google Slides
Business Strategy
Customer Satisfaction KPI Dashboard Template for PowerPoint & Google Slides
Customer Experience
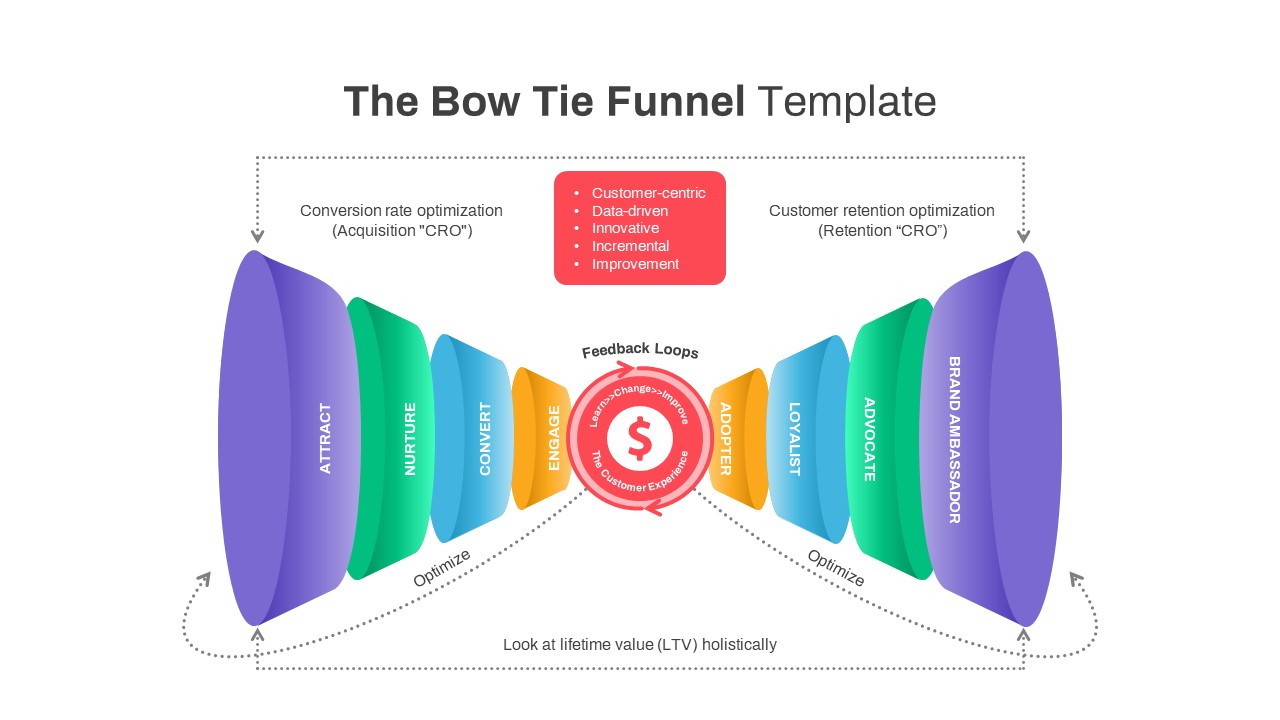
Bow Tie Customer Funnel Presentation Template for PowerPoint & Google Slides
Funnel
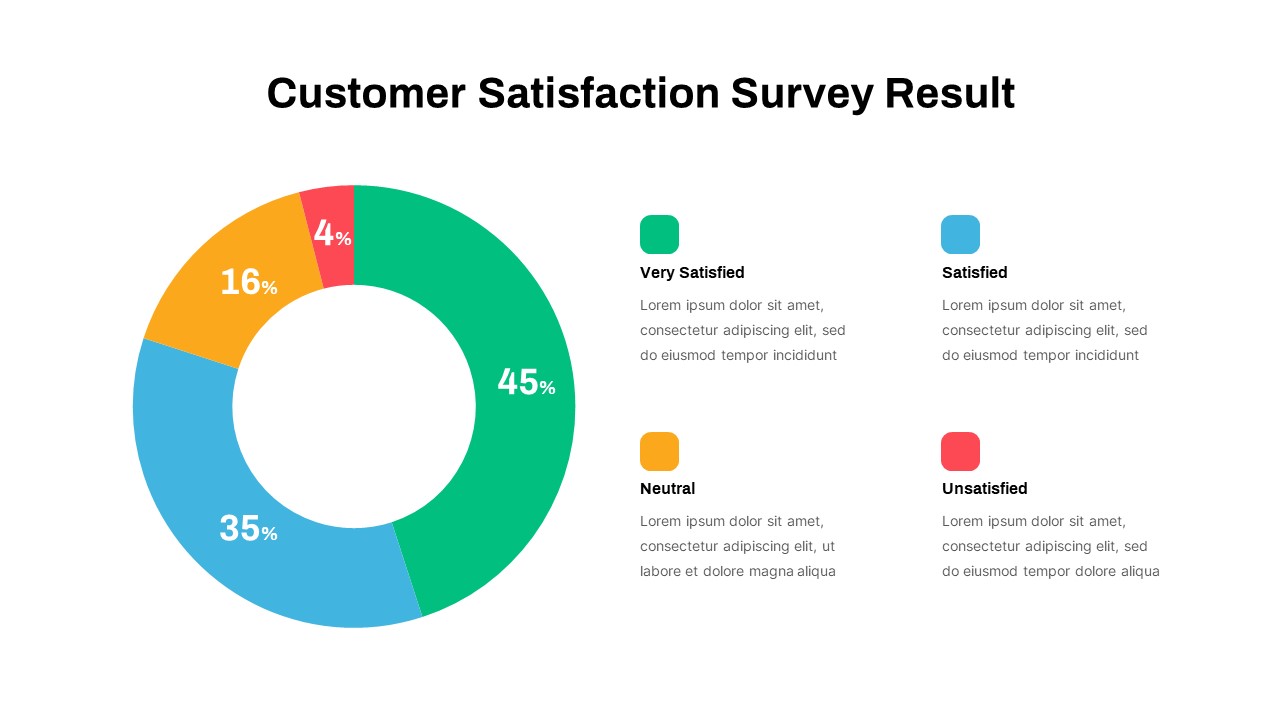
Customer Satisfaction Survey Result Template for PowerPoint & Google Slides
Marketing

Custom Customer Service Infographics Template for PowerPoint & Google Slides
Process
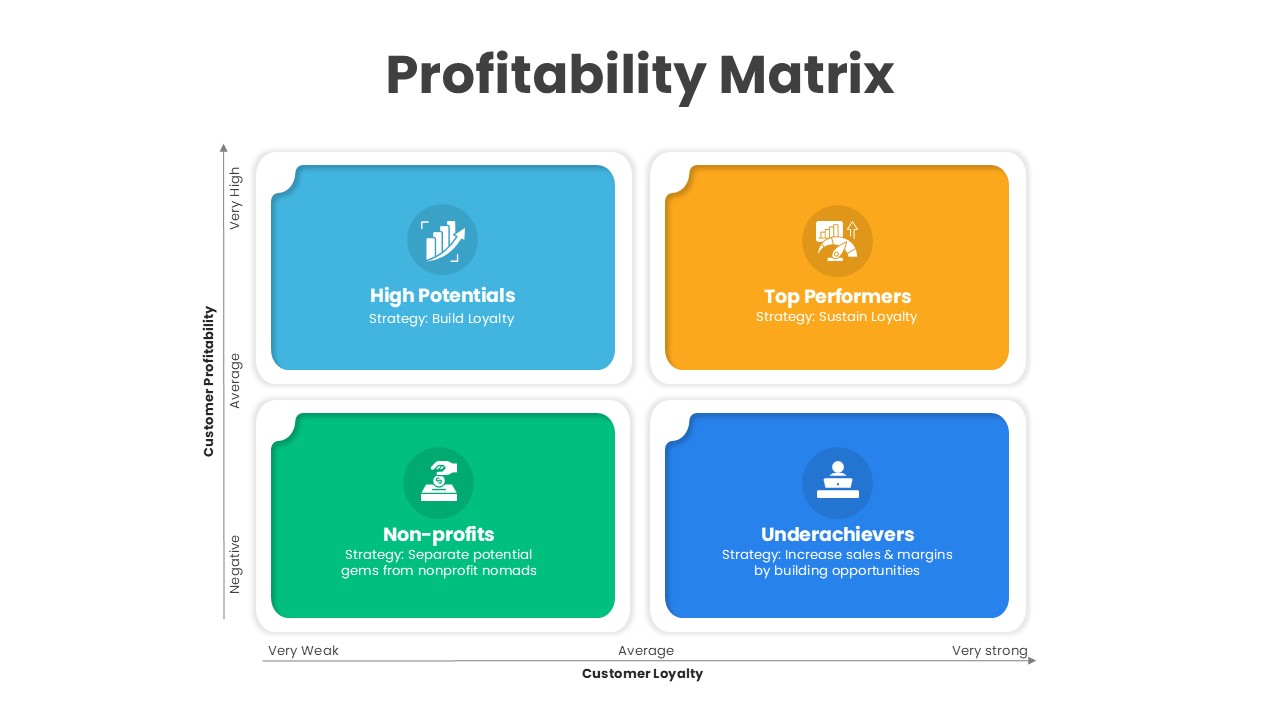
Customer Loyalty & Profitability Matrix Template for PowerPoint & Google Slides
Comparison
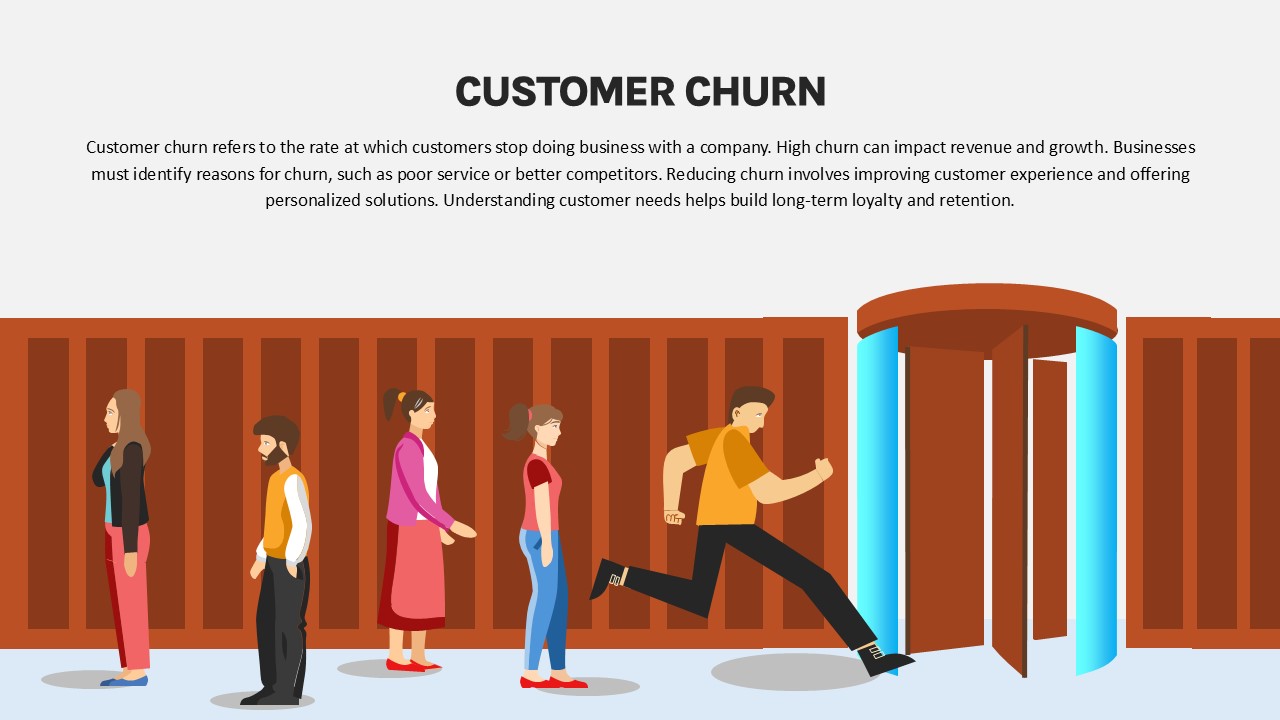
Customer Churn Illustration Diagram Template for PowerPoint & Google Slides
Customer Journey
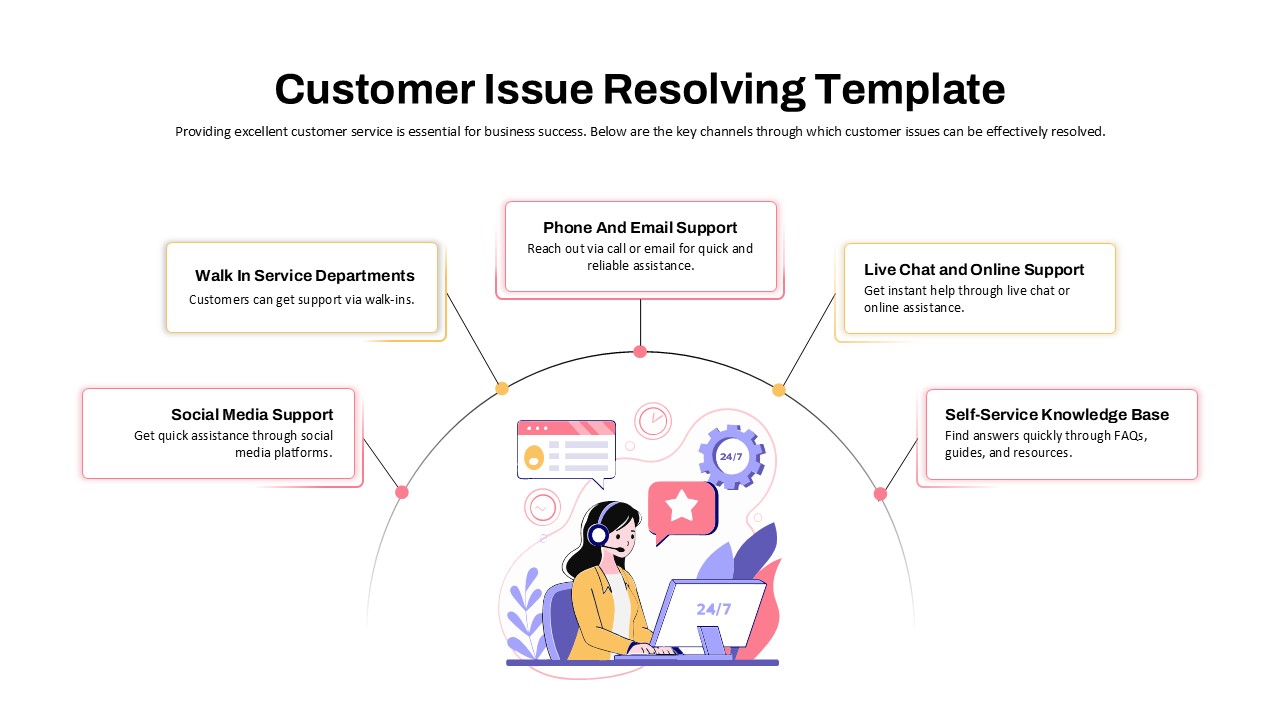
Customer Issue Resolving Template for PowerPoint & Google Slides
Customer Experience
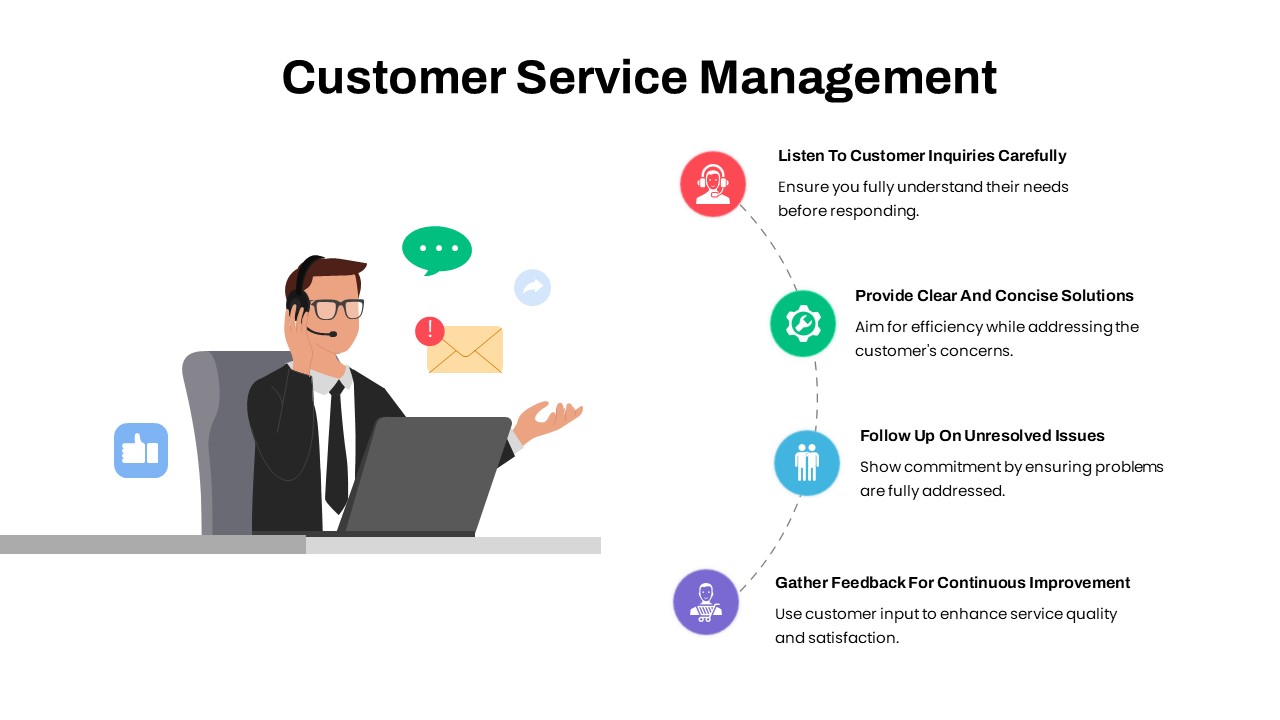
Customer Service Management Process Template for PowerPoint & Google Slides
Process
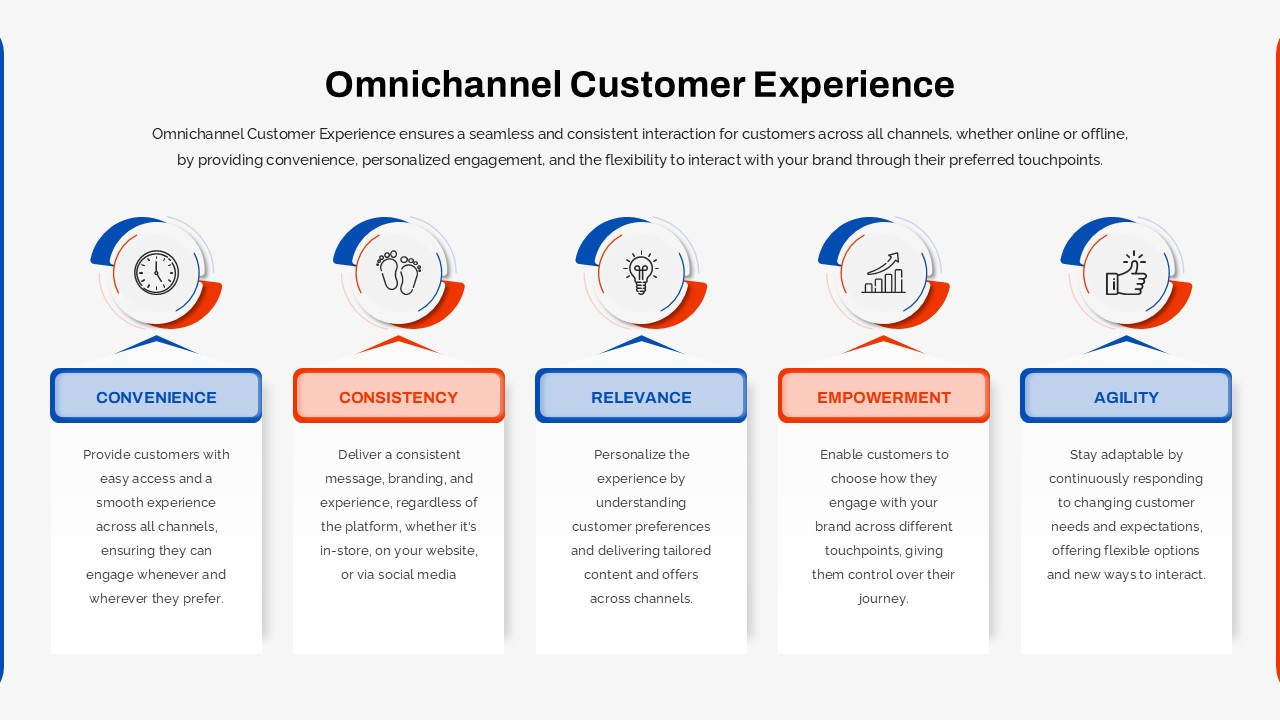
Omnichannel Customer Experience Overview Template for PowerPoint & Google Slides
Customer Journey
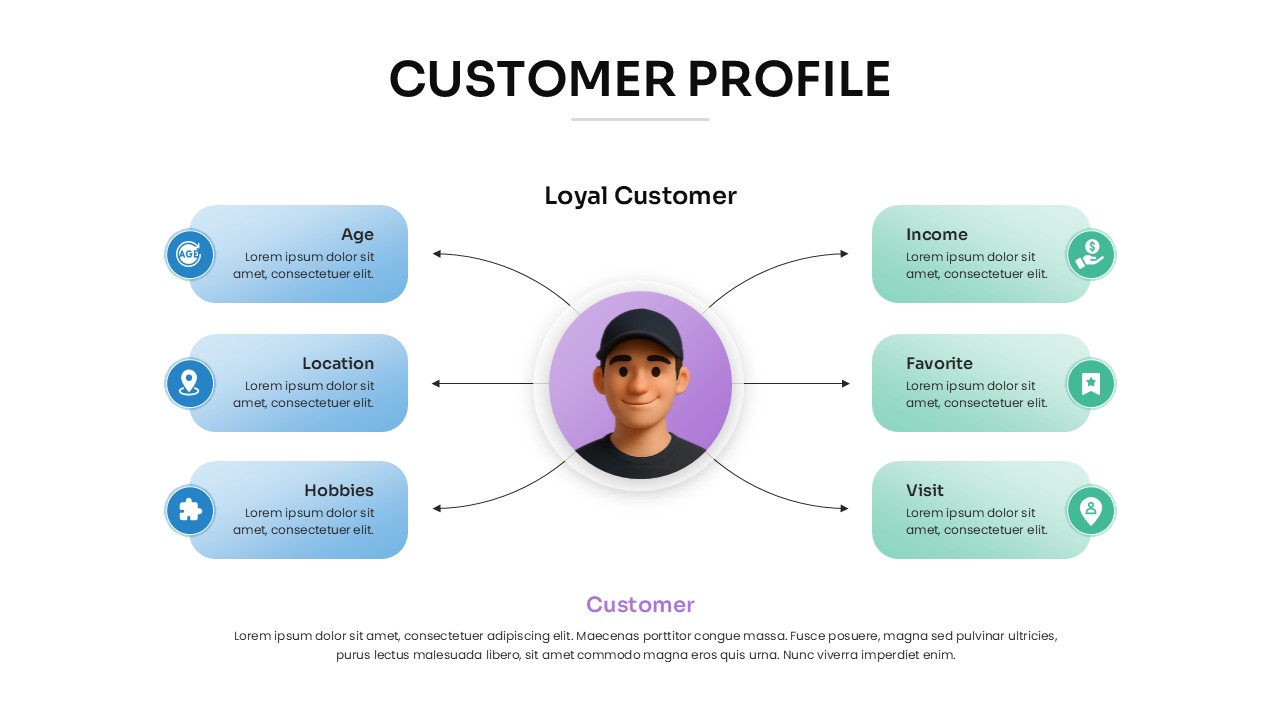
Customer Profile Overview Template for PowerPoint & Google Slides
Customer Journey
Customer Churn Rate Analysis template for PowerPoint & Google Slides
Business Report
Customer Persona Creation template for PowerPoint & Google Slides
Marketing
Customer Response & Feedback Process template for PowerPoint & Google Slides
Business Proposal
Voice of Customer Funnel (VOC) template for PowerPoint & Google Slides
Marketing
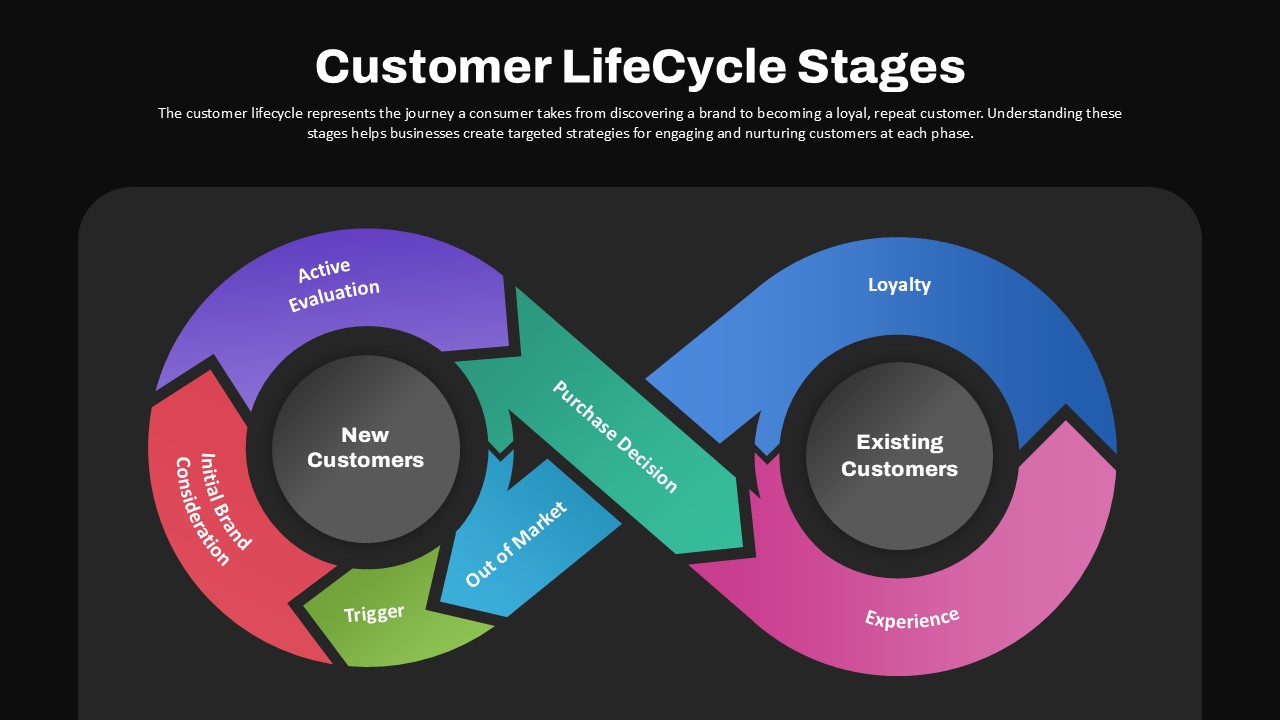
Customer Lifecycle Stages Infinity Loop Template for PowerPoint & Google Slides
Customer Journey
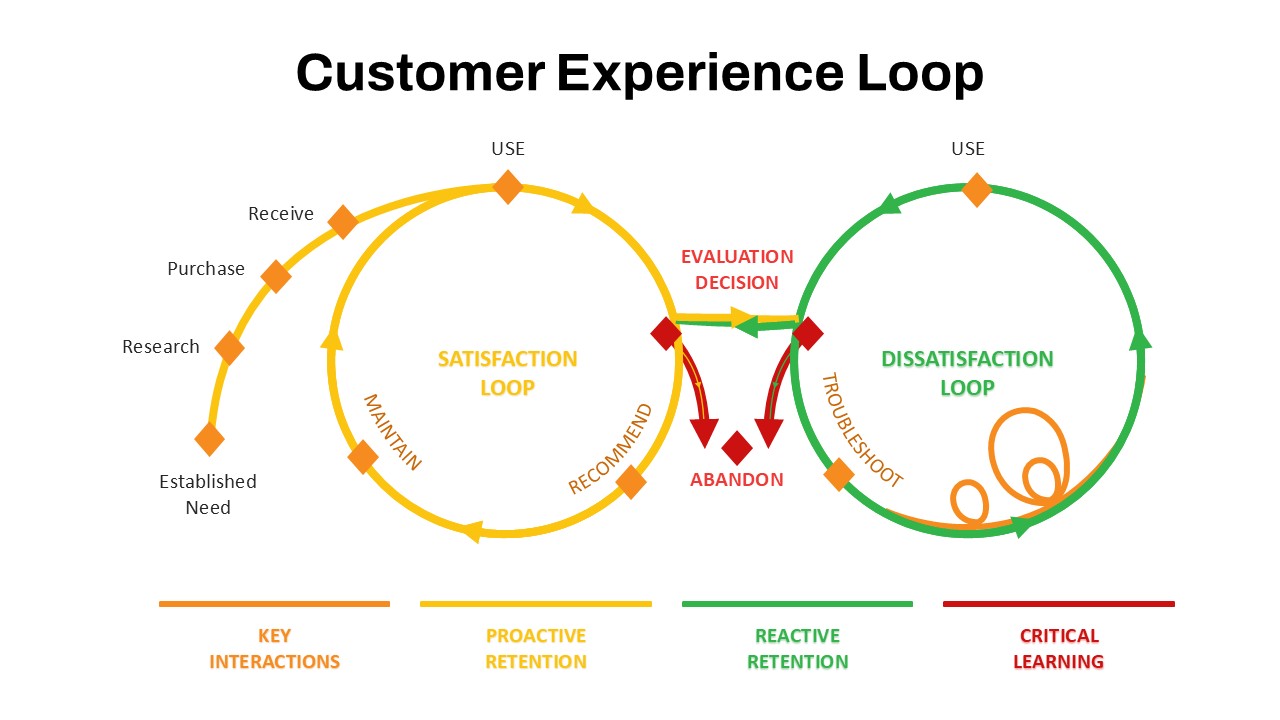
Customer Experience Loop Template for PowerPoint & Google Slides
Customer Experience
Customer Data Platform Workflow Diagram Template for PowerPoint & Google Slides
Information Technology
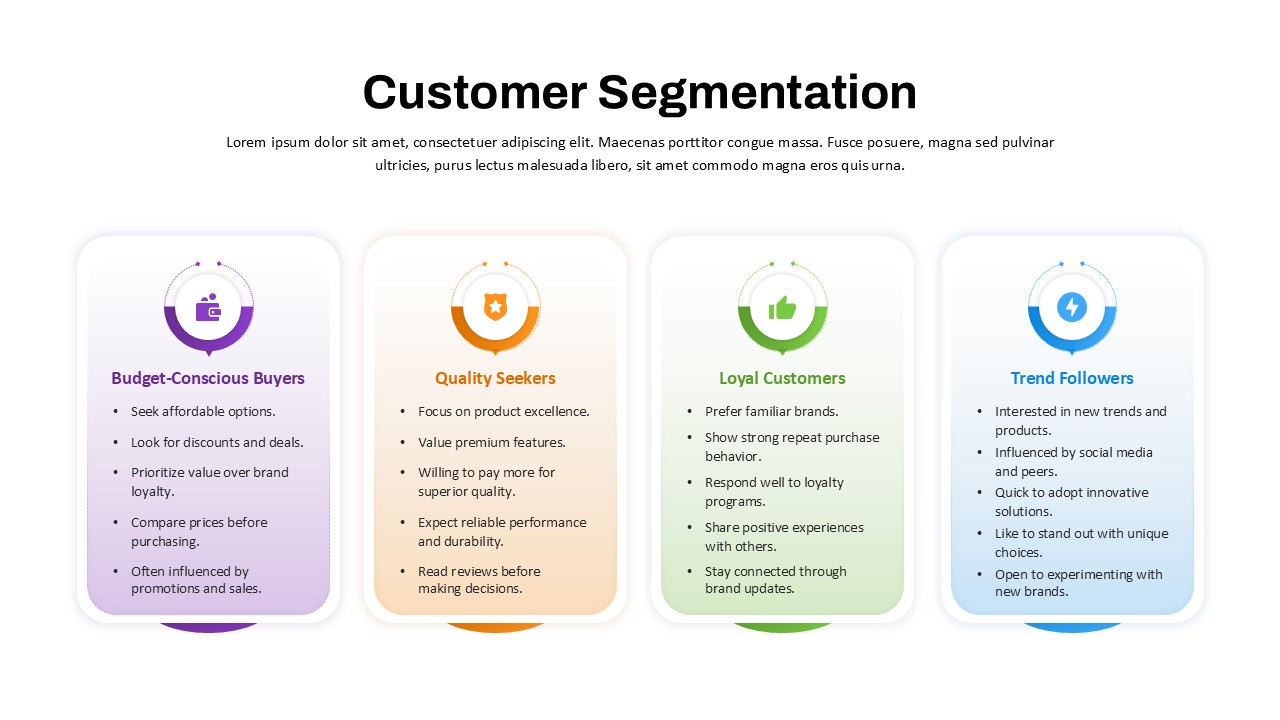
Customer Segmentation Overview template for PowerPoint & Google Slides
Marketing
Customer Interview Insights Dashboard Template for PowerPoint & Google Slides
Customer Experience
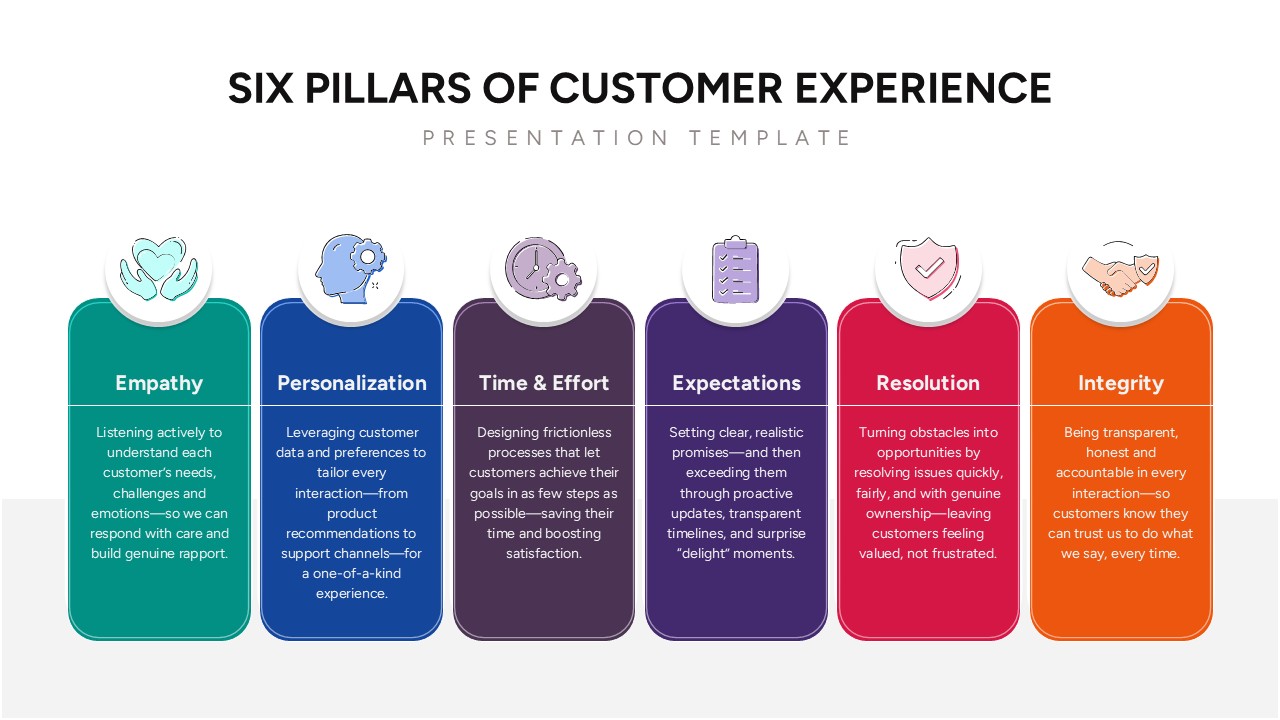
Pillars of Customer Experience Template for PowerPoint & Google Slides
Customer Experience
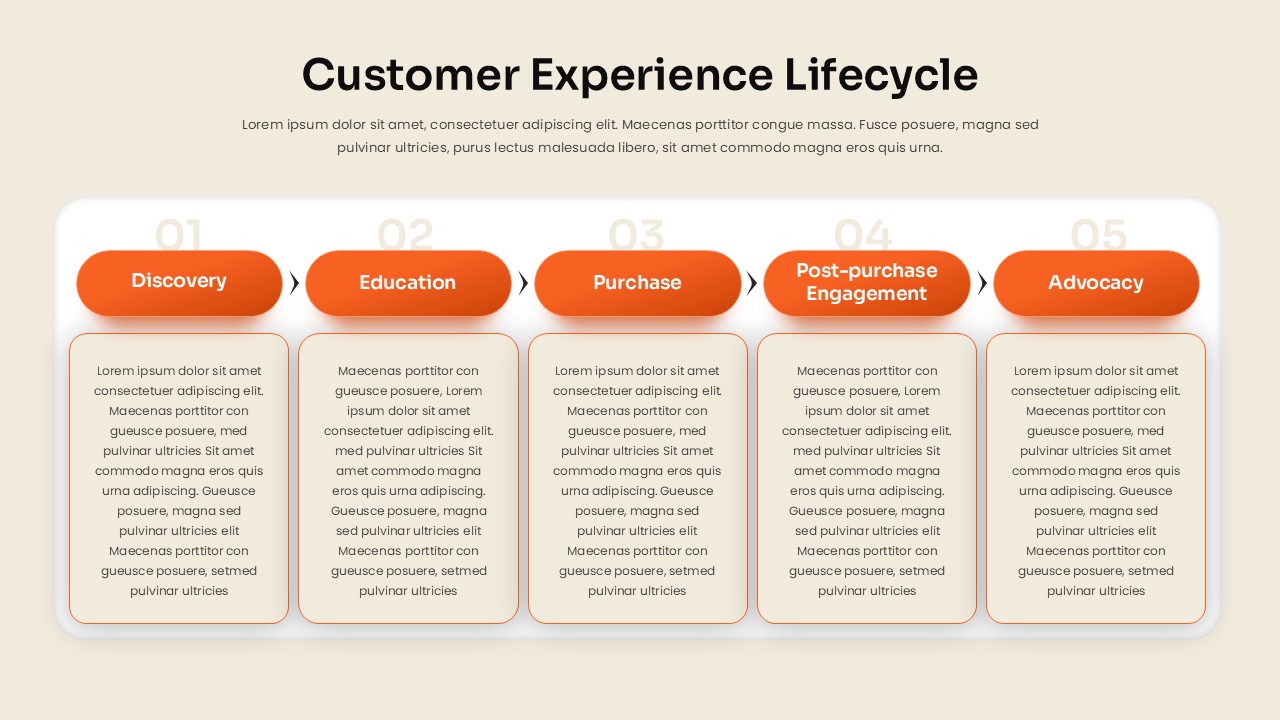
Customer Experience Lifecycle Template for PowerPoint & Google Slides
Customer Journey
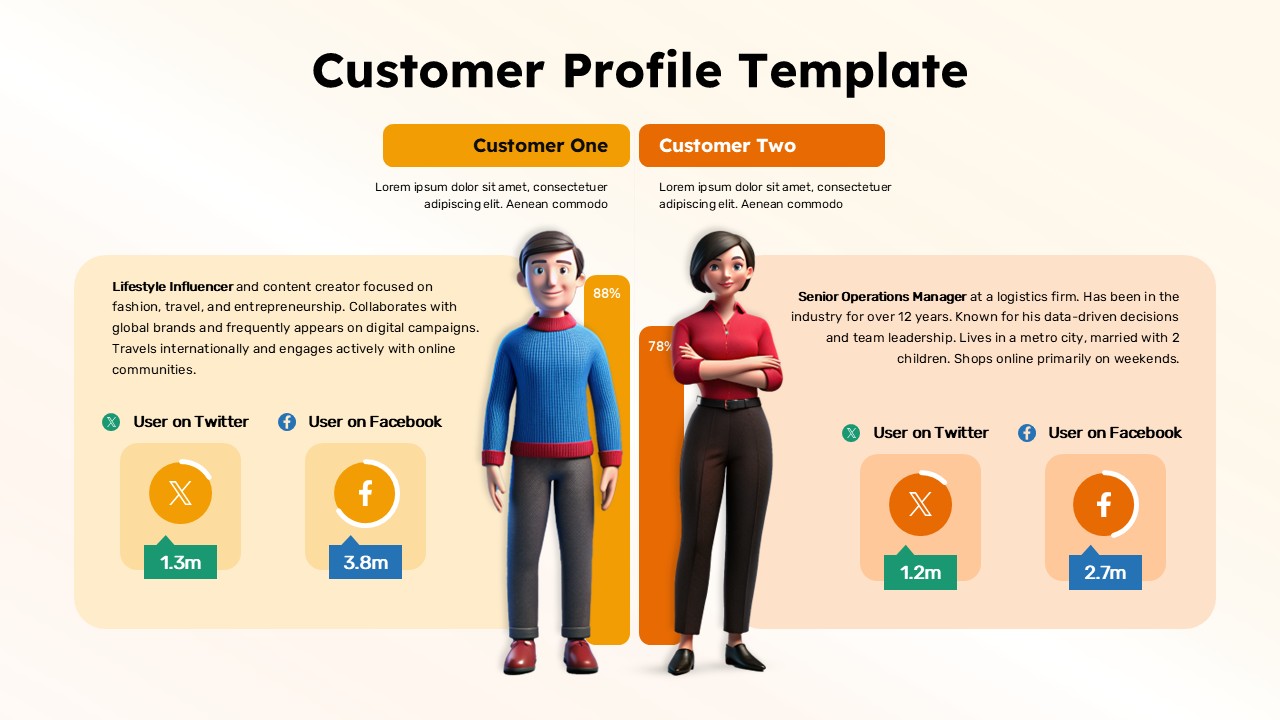
Customer Persona Comparison Profile Template for PowerPoint & Google Slides
Business
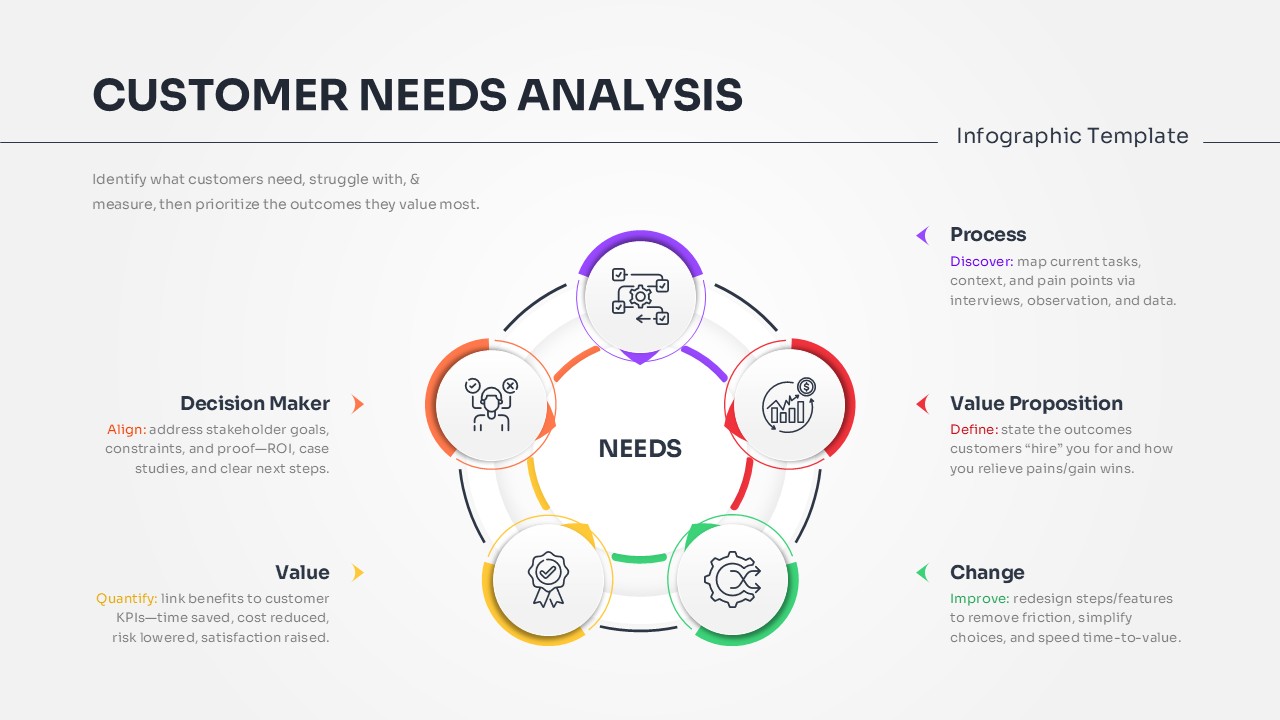
Customer Needs Analysis Template for PowerPoint & Google Slides
Customer Experience
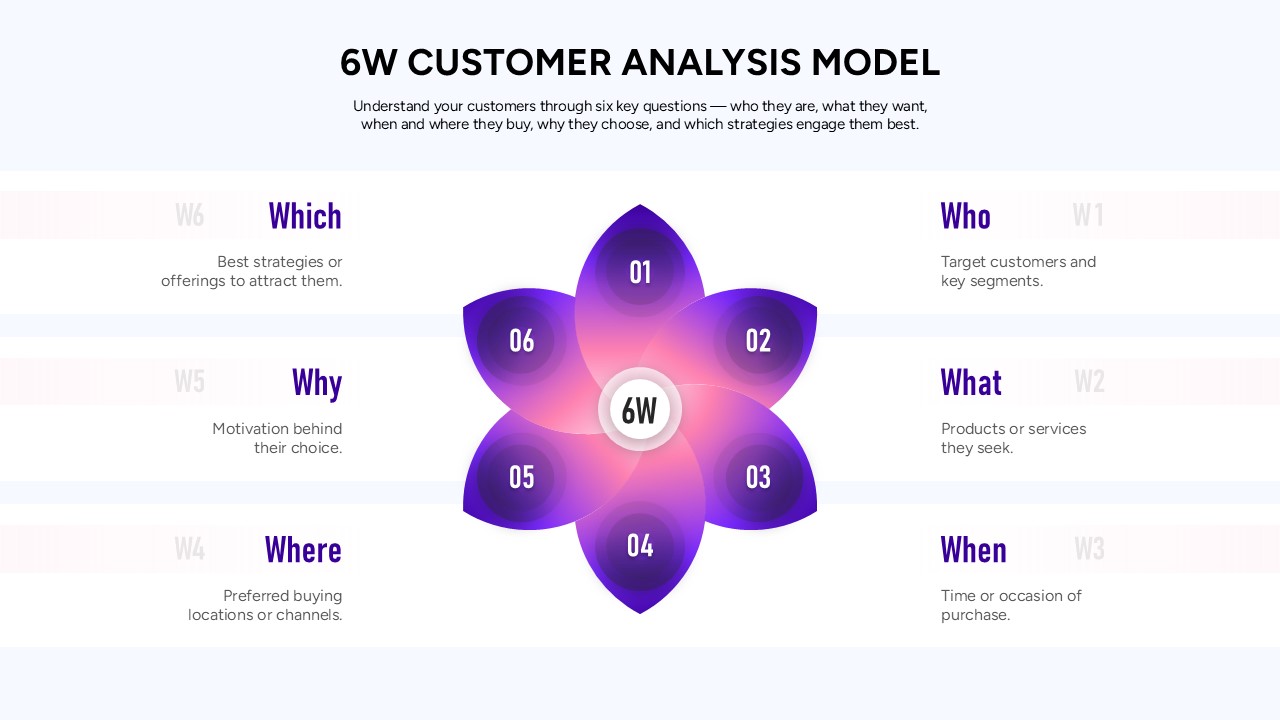
6W Customer Analysis Model Template for PowerPoint & Google Slides
Customer Experience
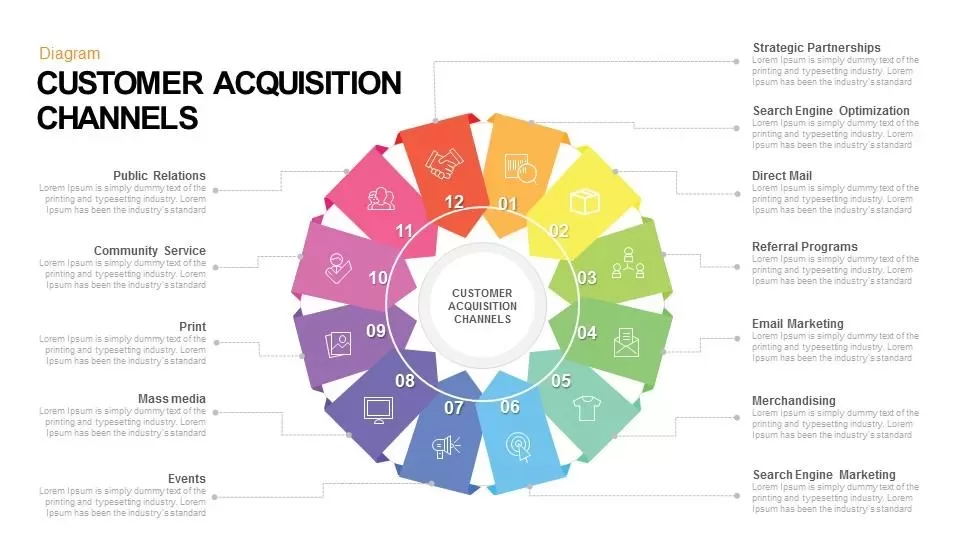
Customer Acquisition Channels Diagram for PowerPoint & Google Slides
Business Strategy
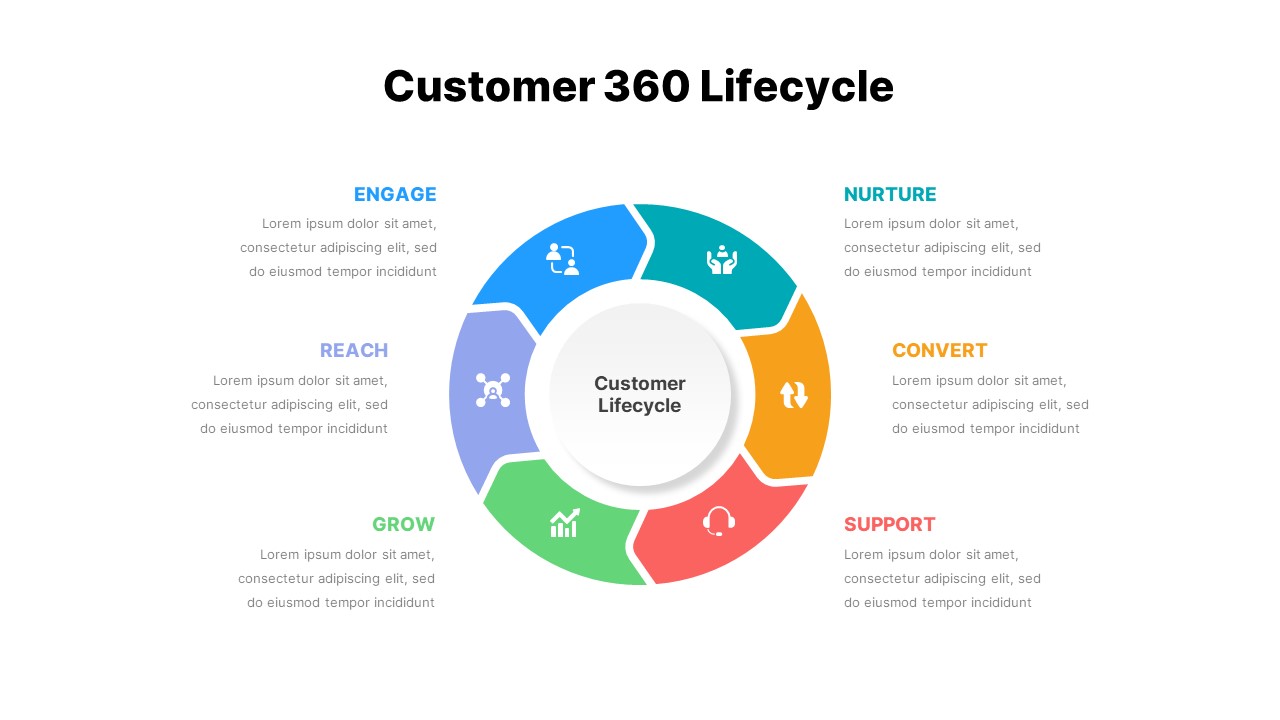
Customer 360 Lifecycle Slide for PowerPoint & Google Slides
Customer Journey
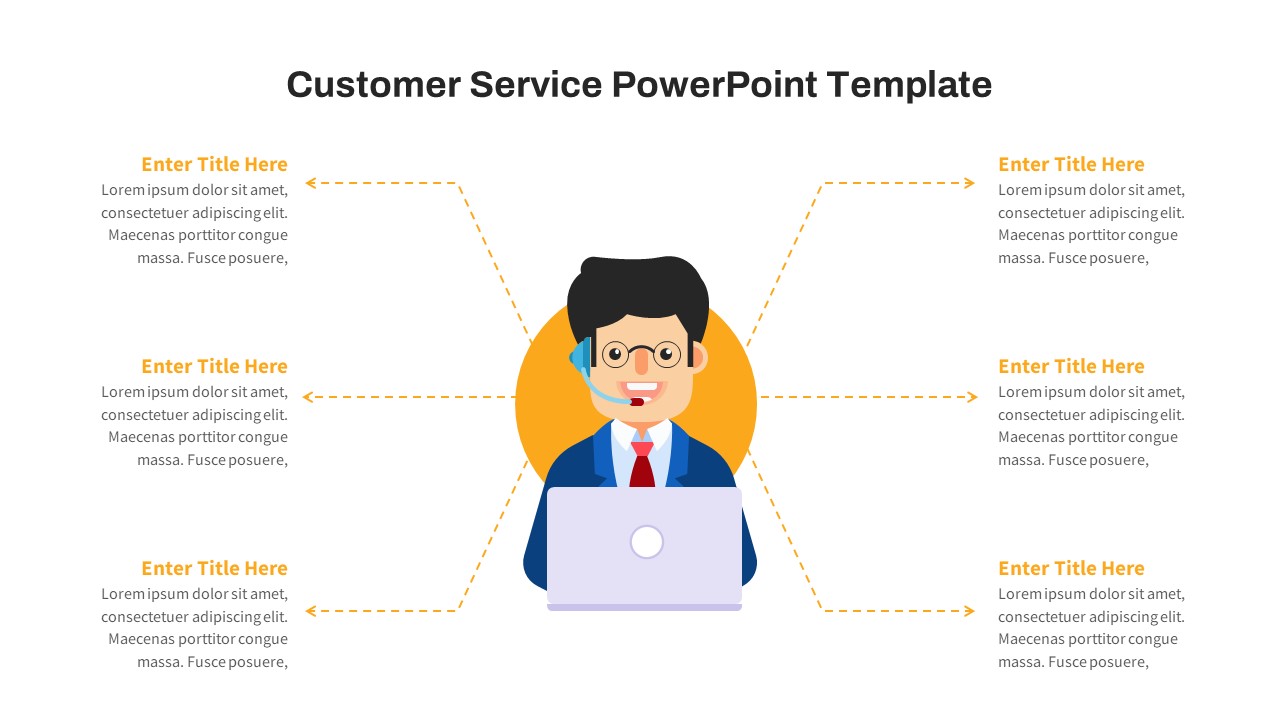
Free Customer Service Breakdown Slide for PowerPoint & Google Slides
Infographics
Free
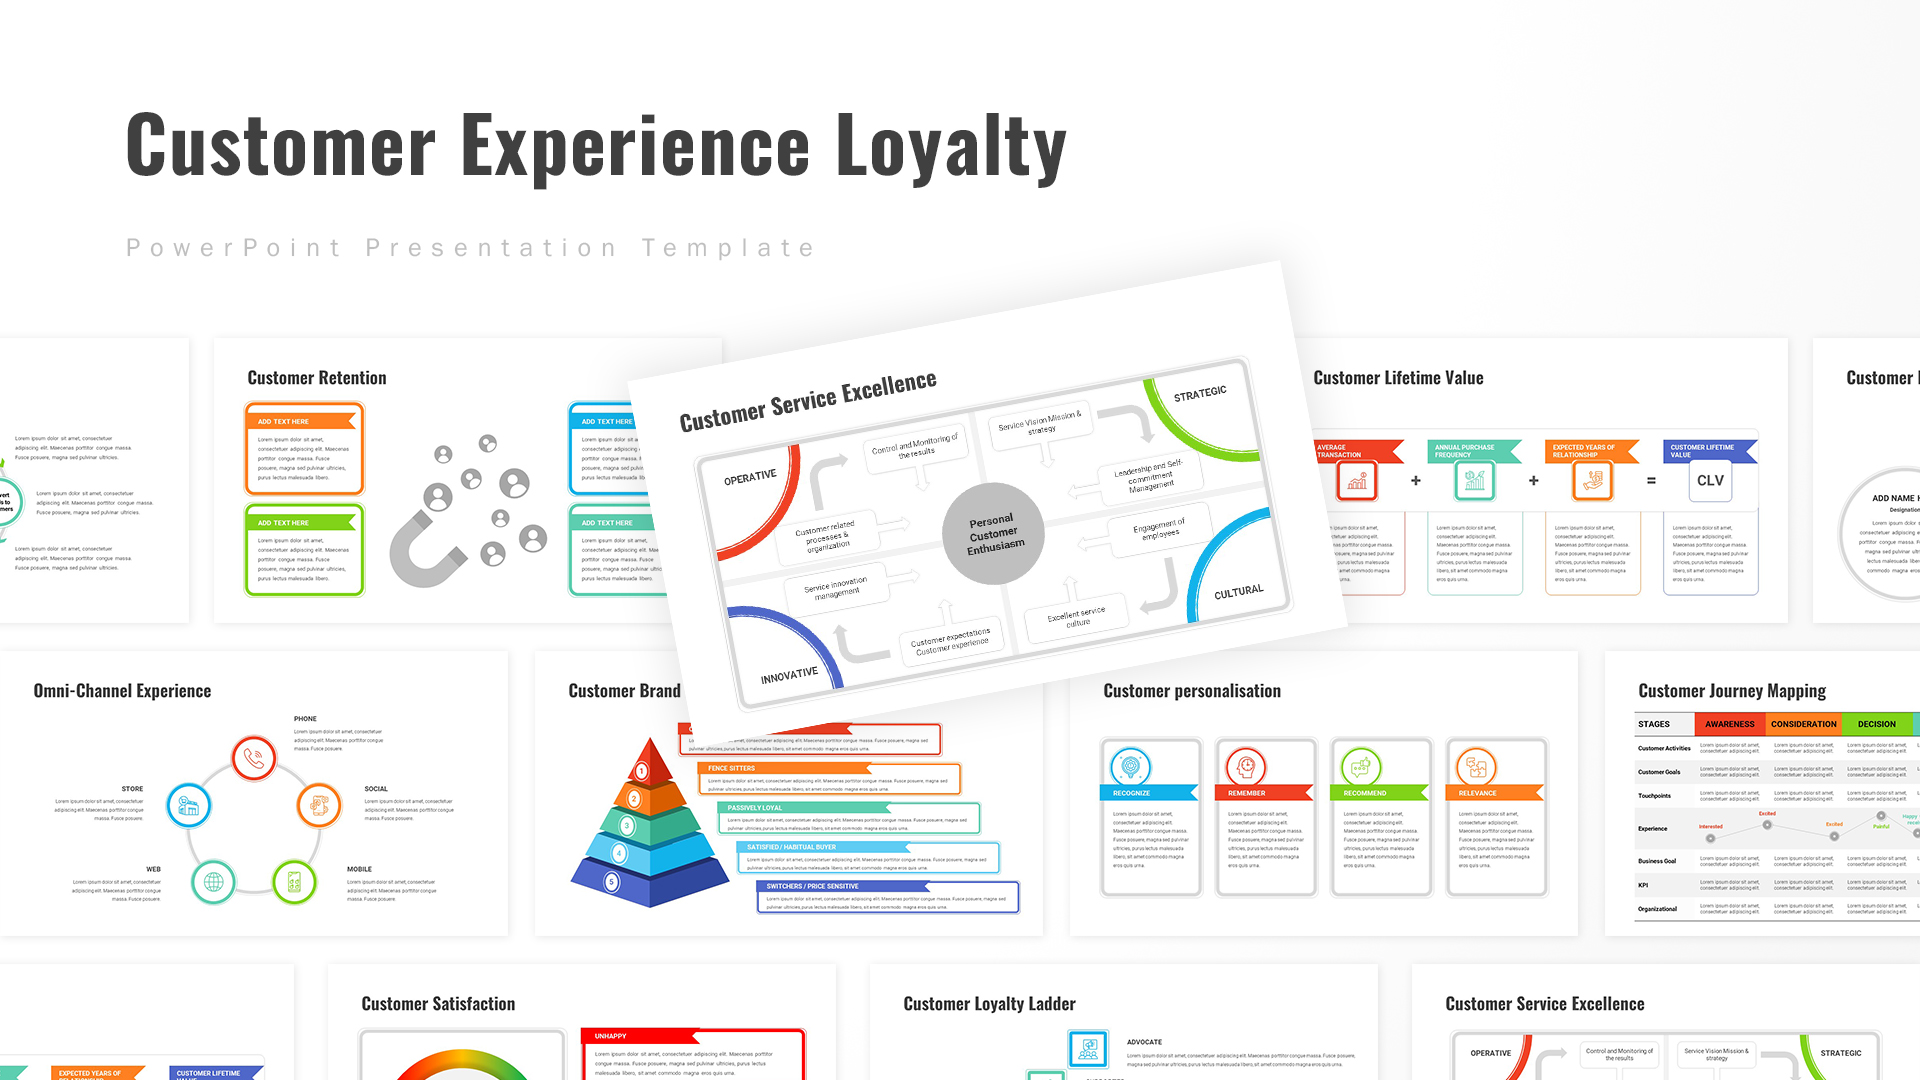
Customer Experience Loyalty Deck for PowerPoint & Google Slides
Customer Experience
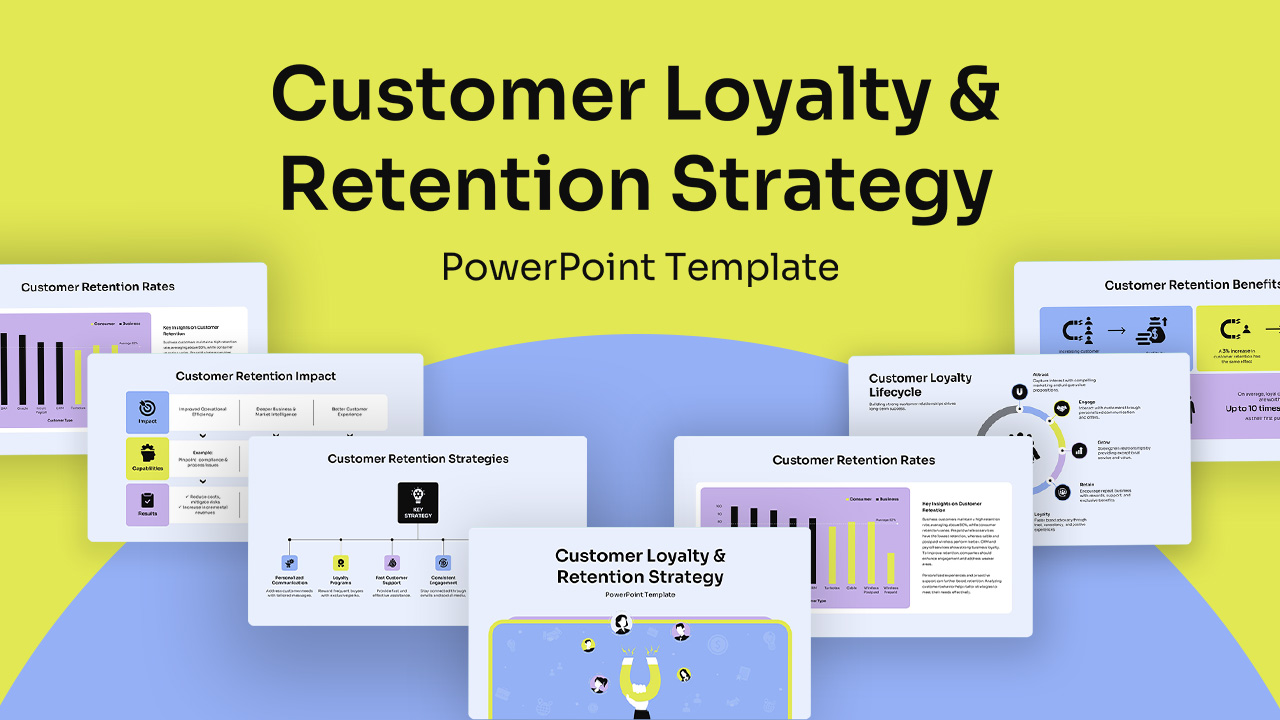
Customer Loyalty & Retention Strategy Deck for PowerPoint & Google Slides
Business Strategy
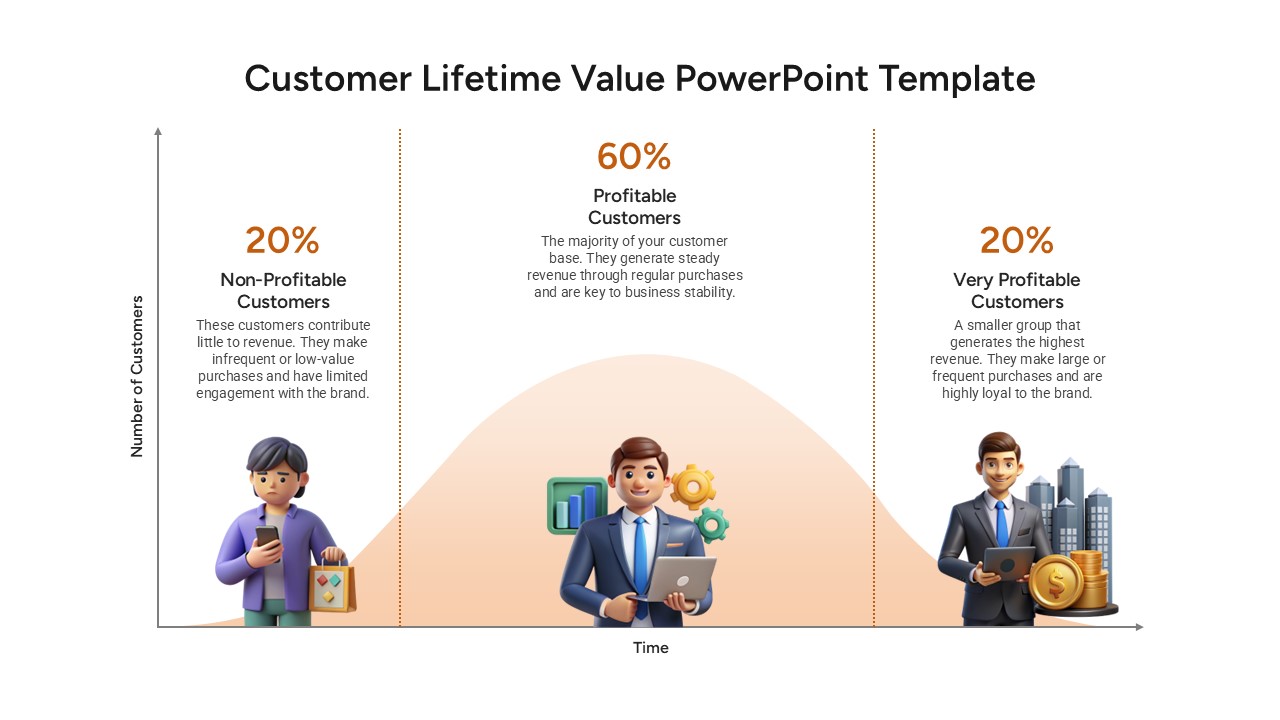
Customer Lifetime Value Analysis for PowerPoint & Google Slides
Customer Journey

Customer Relationship Management (CRM) Presentation Template for PowerPoint
Decks
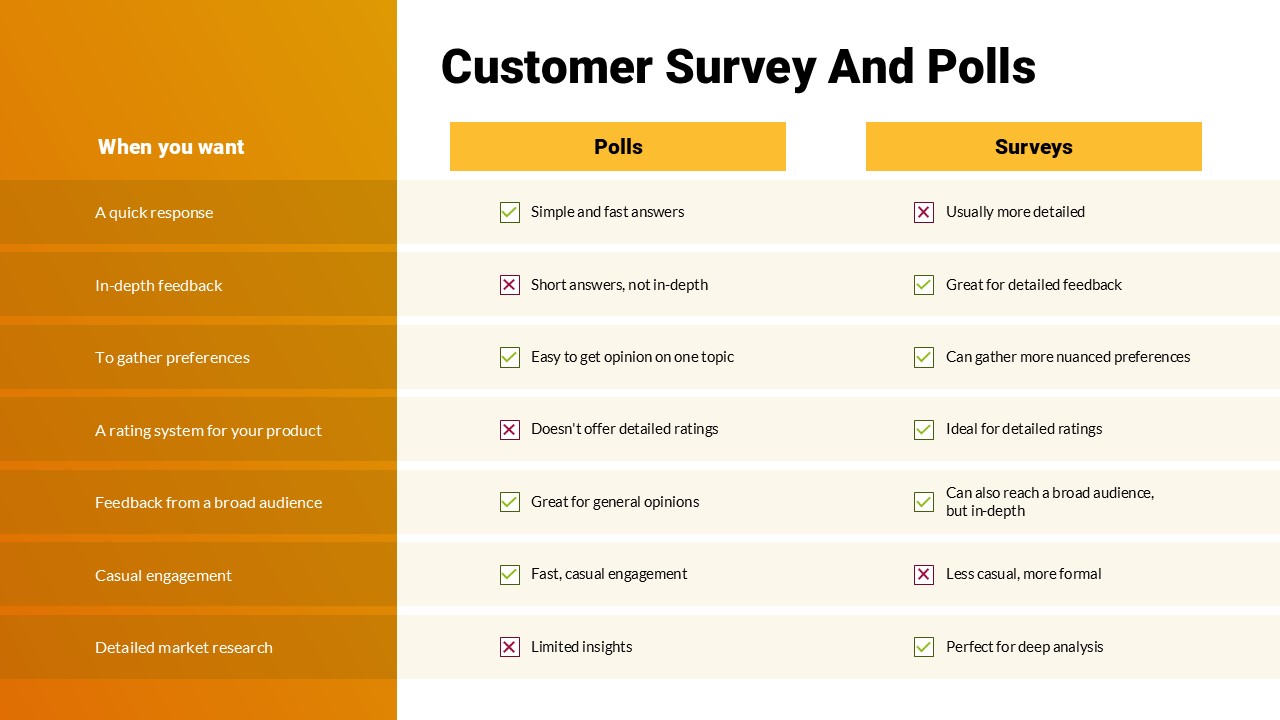
Customer Survey & Polls Comparison PowerPoint Template
Customer Experience
Mind Map PowerPoint template for PowerPoint & Google Slides
Mind Maps
Editable Colombia Map PowerPoint Template for PowerPoint & Google Slides
Business Models

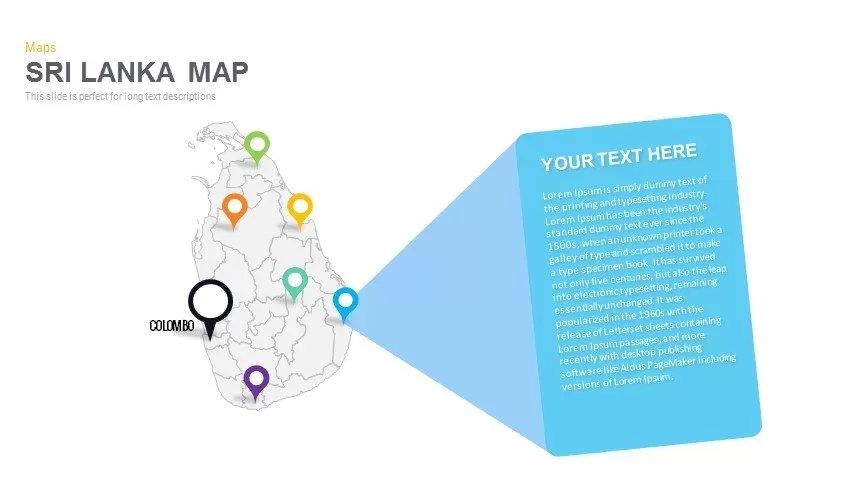
Sri Lanka Map Infographic Pack Template for PowerPoint & Google Slides
Maps
Free Editable Saudi Arabia Map Template for PowerPoint & Google Slides
World Maps
Germany Map with Regional Callouts Template for PowerPoint & Google Slides
World Maps
London Map with Highlighted Boroughs Template for PowerPoint & Google Slides
World Maps