Download Diagrams for PowerPoint
![]() Filter
Filter
Filter
-
Four-Stage Agenda Circle Diagram Slide Template for PowerPoint & Google Slides
Agenda
-
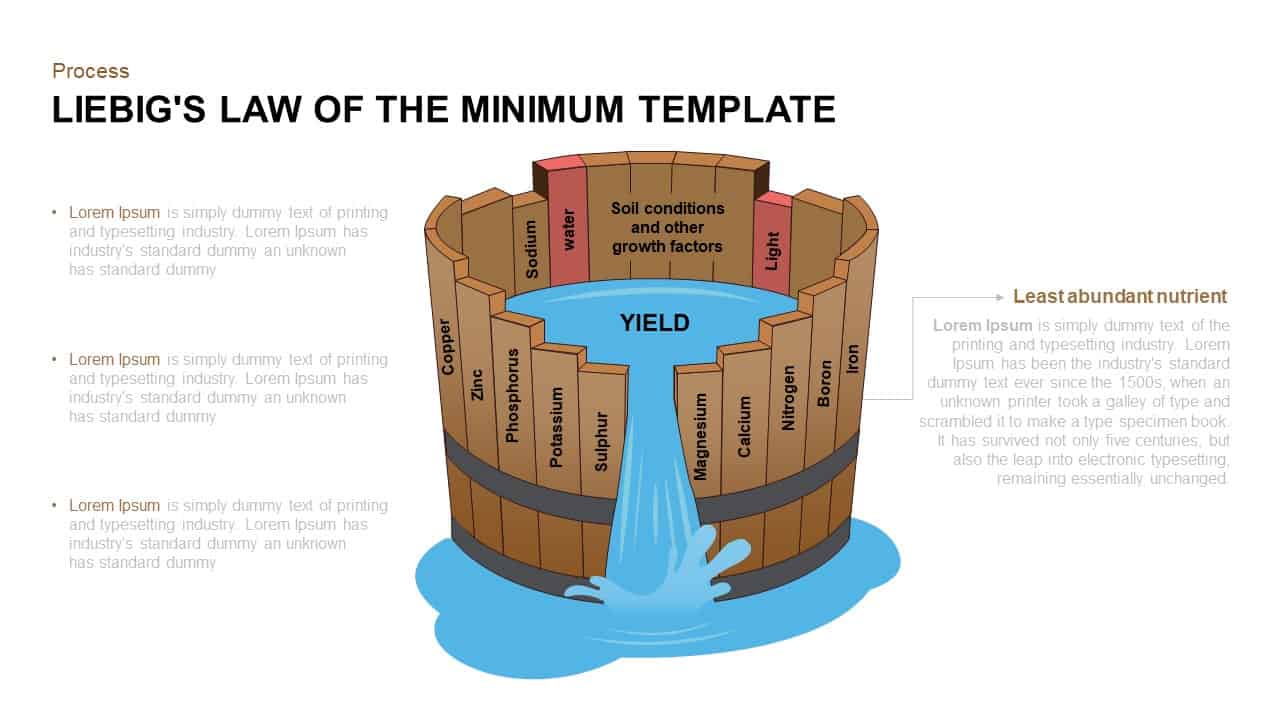
Liebig’s Law Barrel Diagram Template for PowerPoint & Google Slides
Process
-
Isometric Five-Stage Process Flow Template for PowerPoint & Google Slides
Process
-

Colorful Mind Map Infographic Template with Icons for PowerPoint & Google Slides
Mind Maps
-

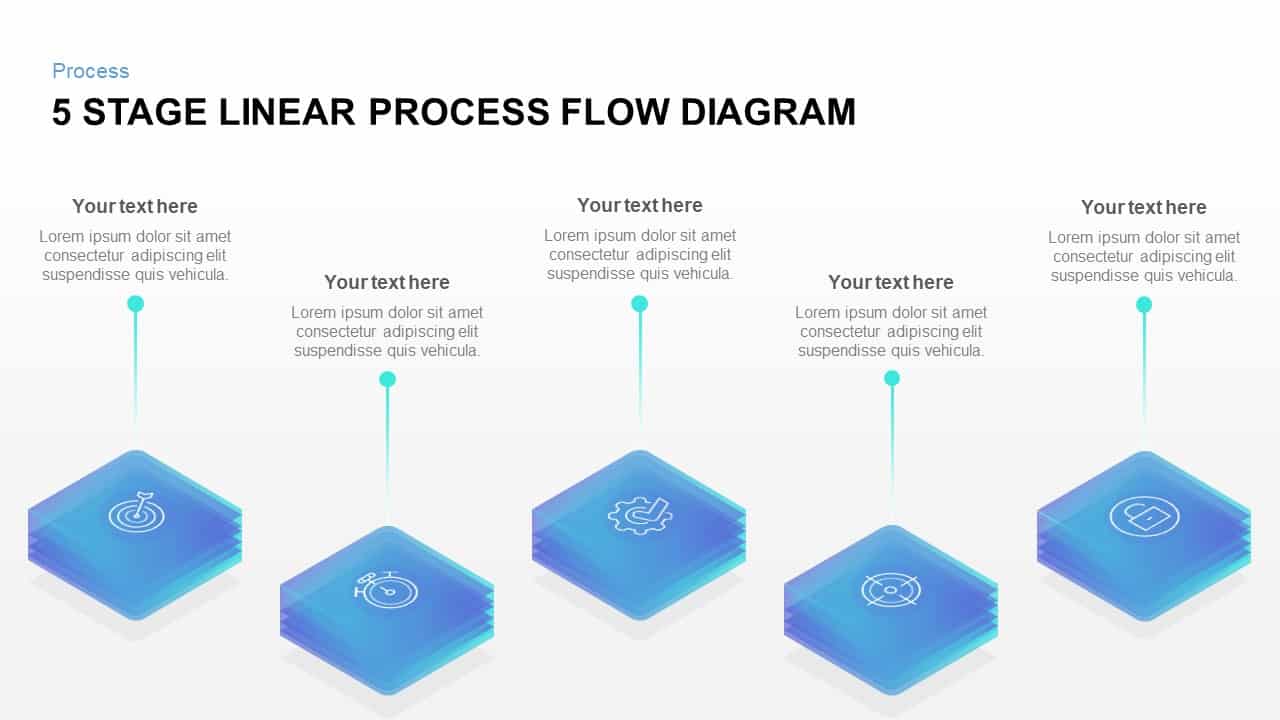
Five Stage Linear Process Flow Diagram Template for PowerPoint & Google Slides
Process
-
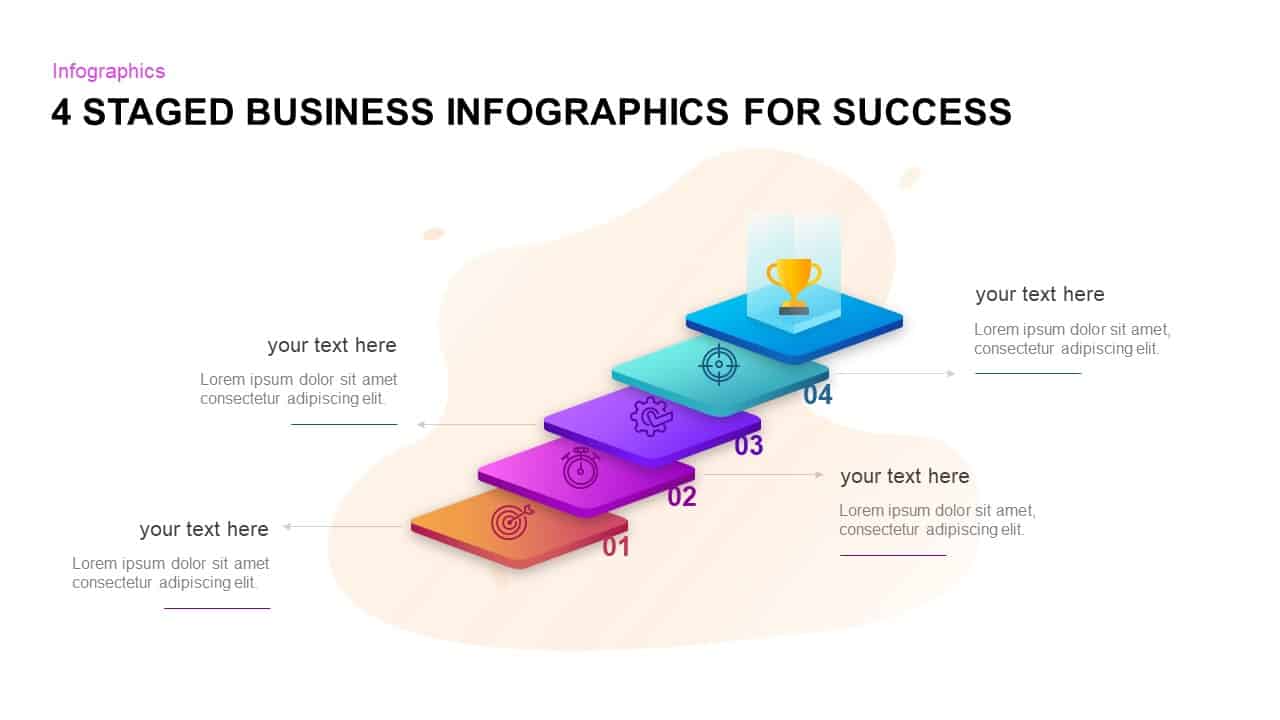
Four-Stage Business Success Infographic Template for PowerPoint & Google Slides
Process
-
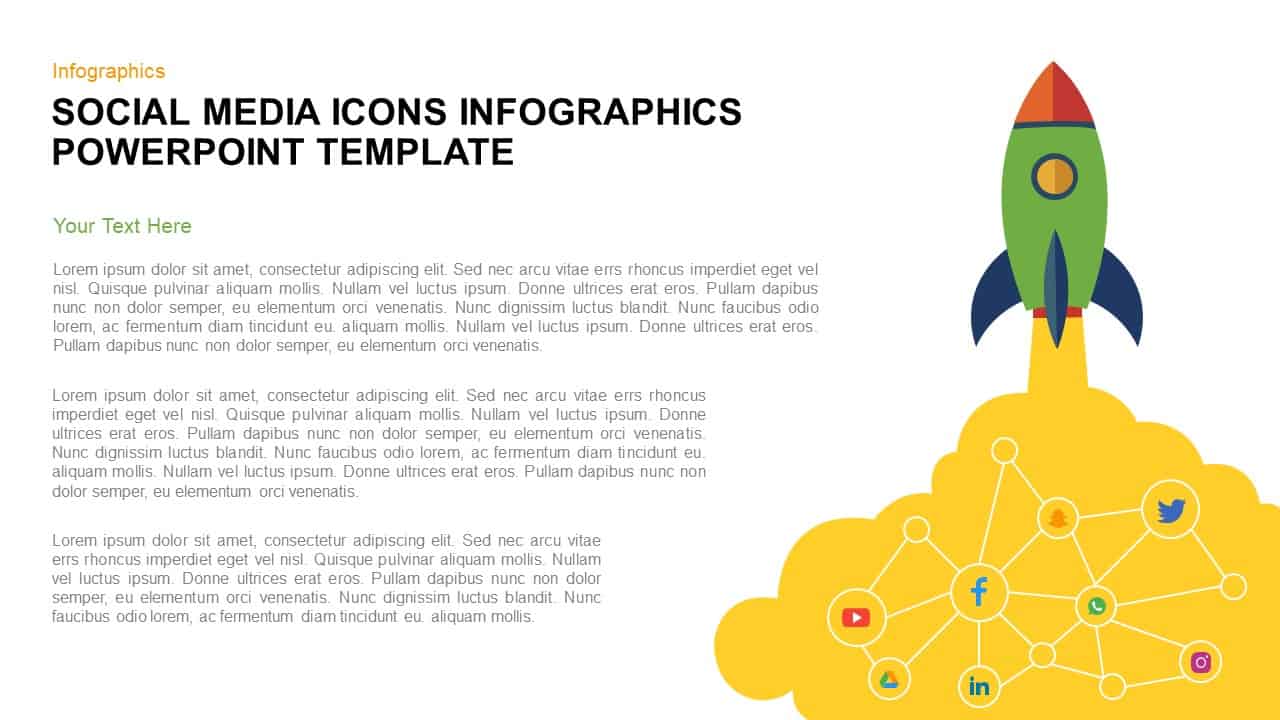
Social Media Rocket Launch Infographic Template for PowerPoint & Google Slides
Marketing
-
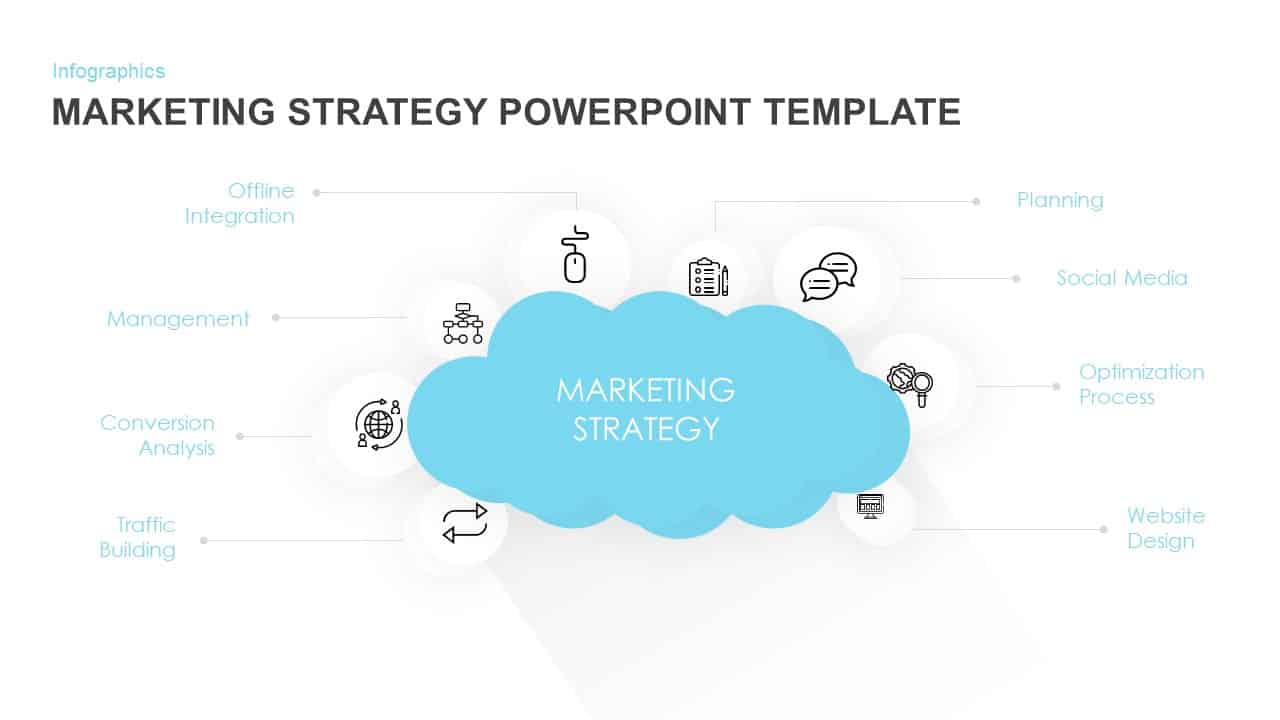
Marketing Strategy Cloud Diagram Template for PowerPoint & Google Slides
Digital Marketing
-
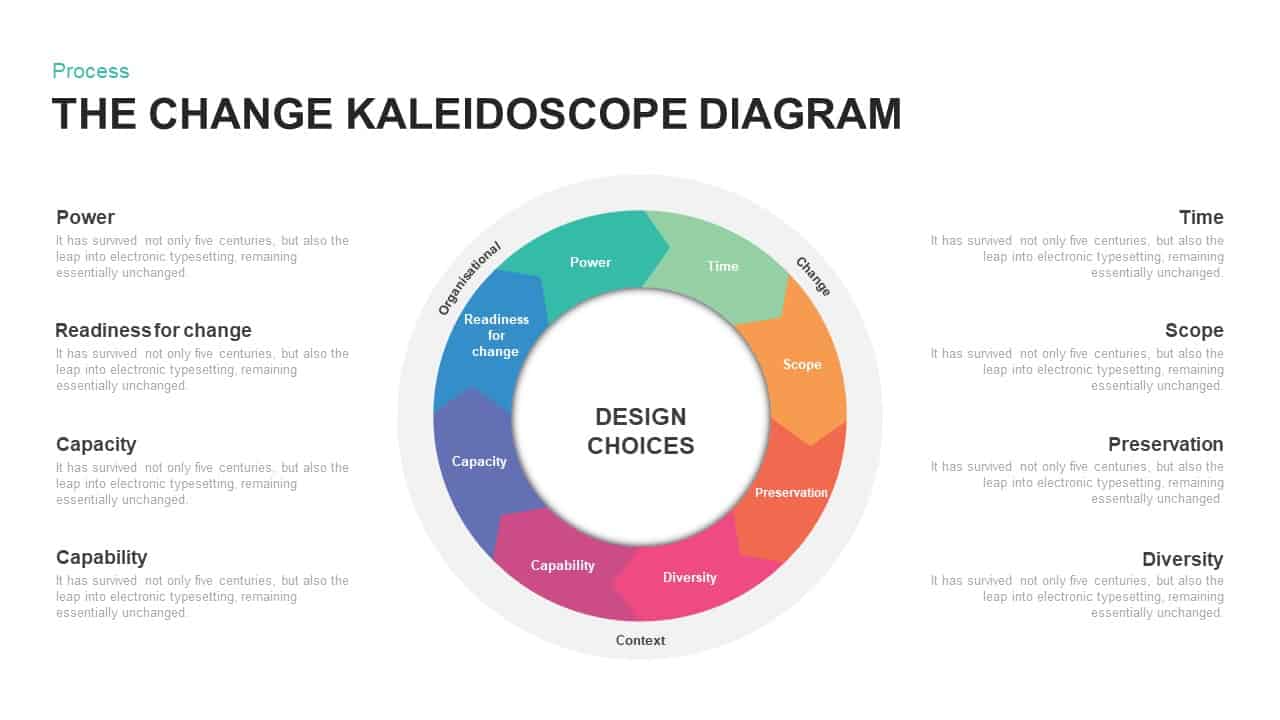
Change Kaleidoscope Process Diagram Template for PowerPoint & Google Slides
Circular
-
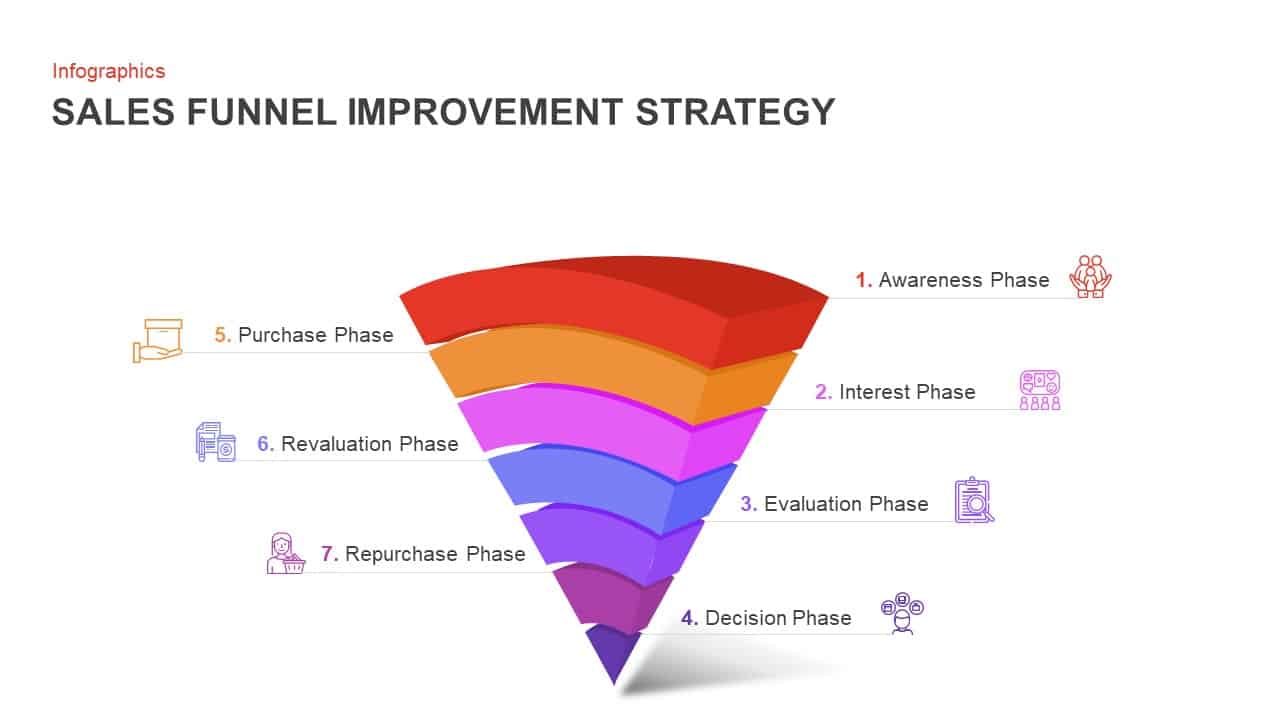
7-Step Sales Funnel Improvement Strategy Template for PowerPoint & Google Slides
Infographics
-

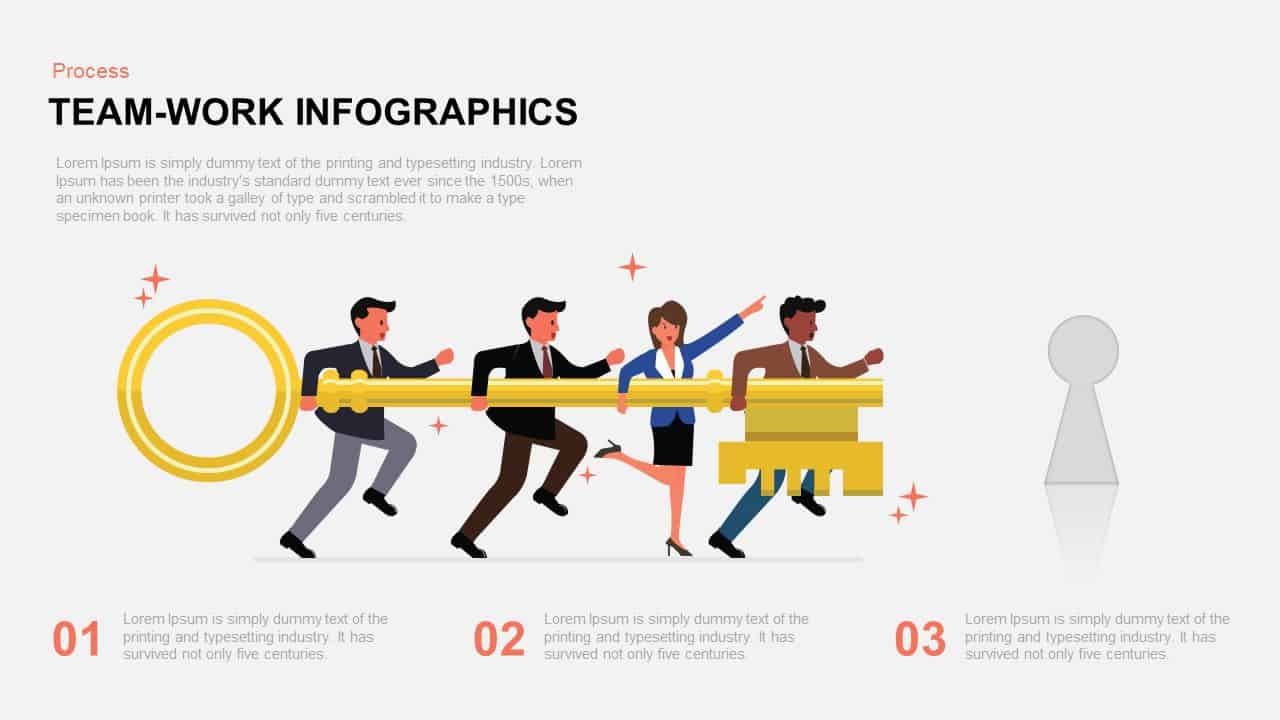
Teamwork Key Infographic Slide Template for PowerPoint & Google Slides
Process
-
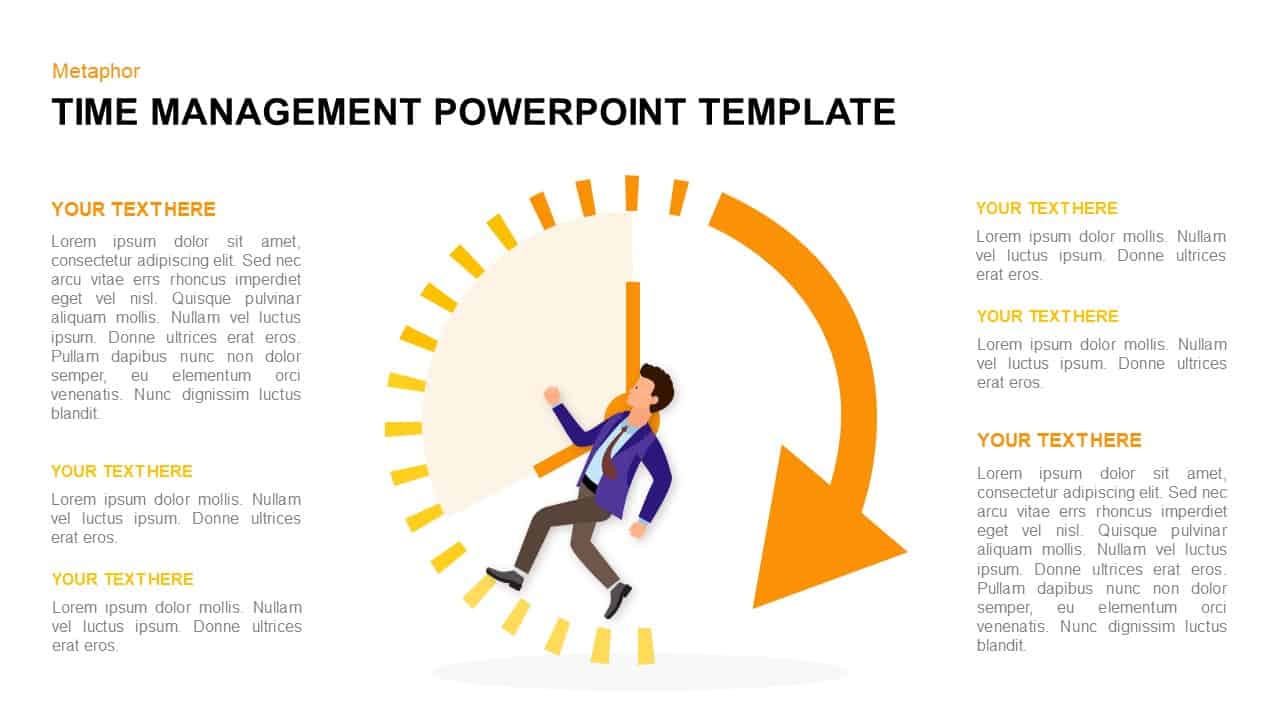
Time Management Clock Infographic Template for PowerPoint & Google Slides
Circular
-
Cluster Analysis Infographic Diagram Template for PowerPoint & Google Slides
Business
-

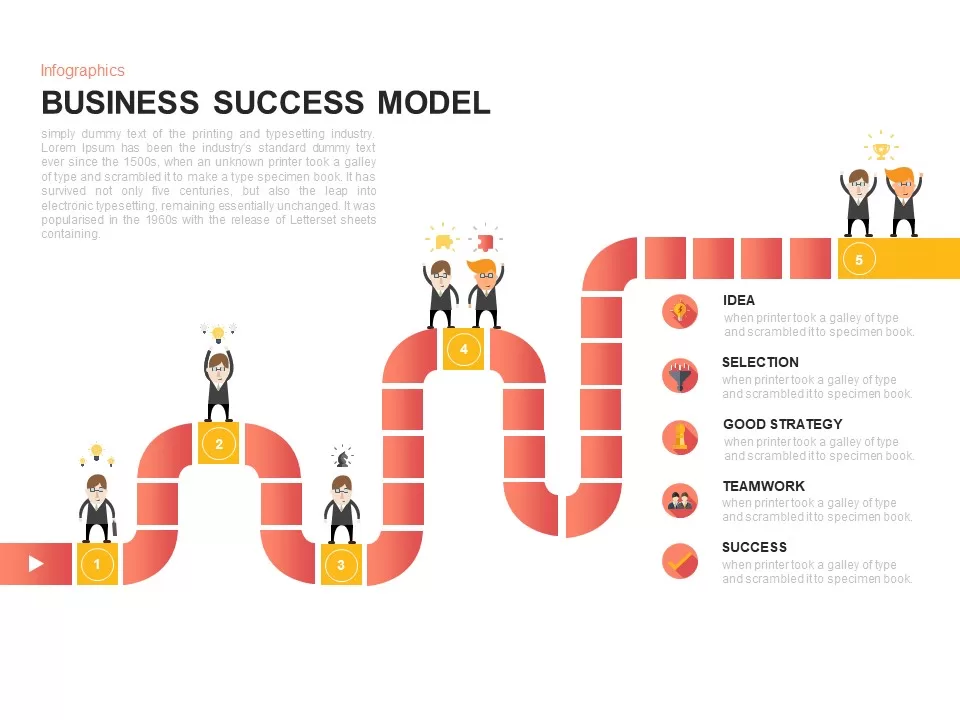
Business Success Model Infographic Template for PowerPoint & Google Slides
Roadmap
-
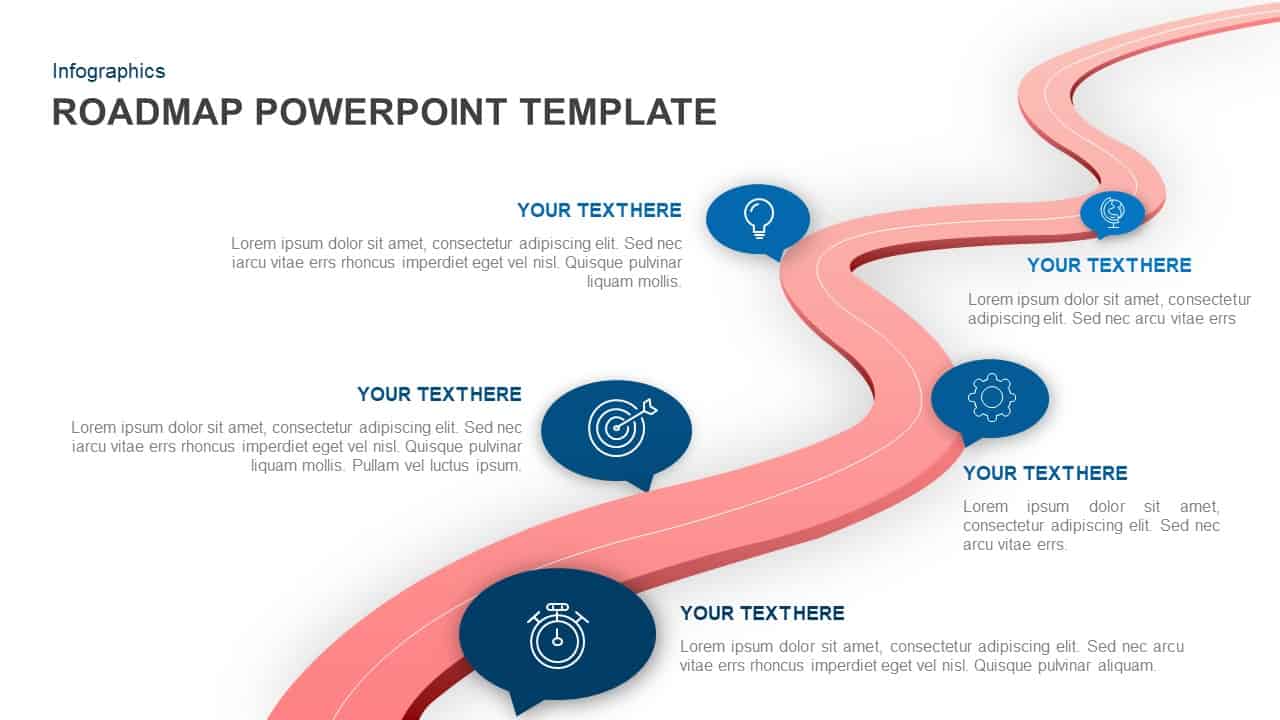
Dynamic Winding Roadmap Infographic Template for PowerPoint & Google Slides
Roadmap
-
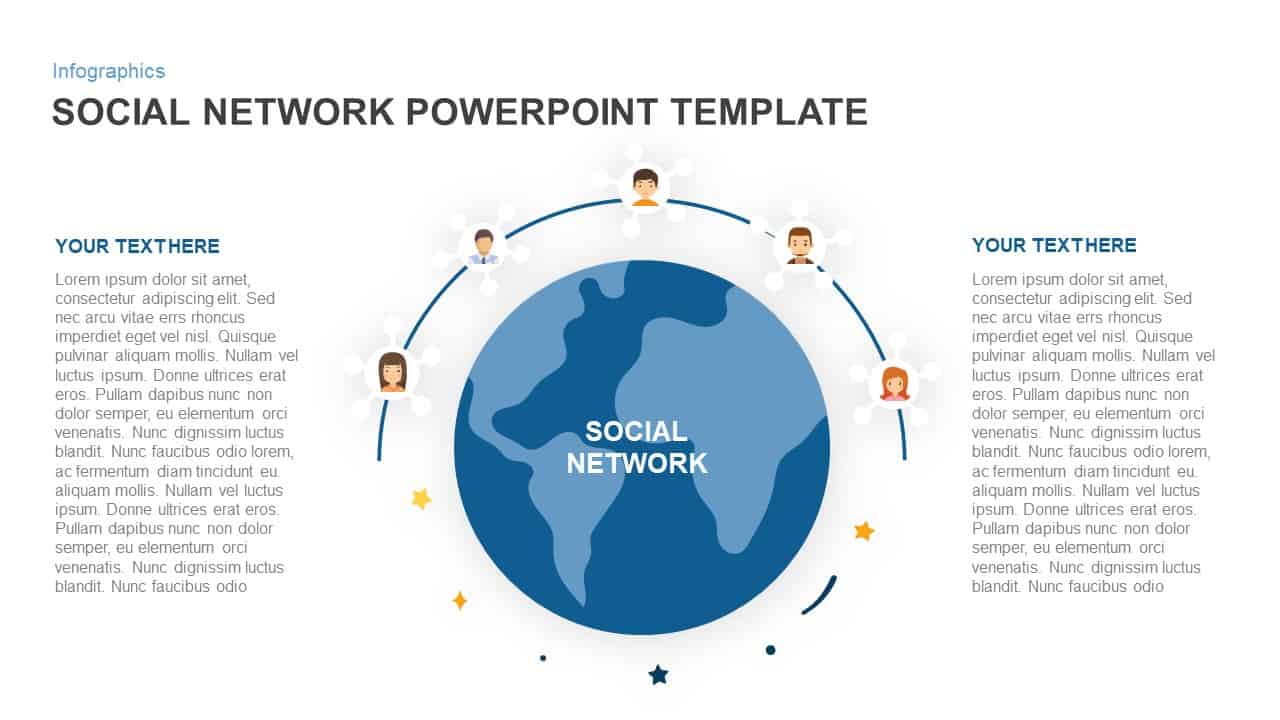
Social Network Connectivity Infographic Template for PowerPoint & Google Slides
Infographics
-
Eight-Step Inward Arrow Diagram Template for PowerPoint & Google Slides
Arrow
-
Social Media Mind Network Infographic Template for PowerPoint & Google Slides
Digital Marketing
-
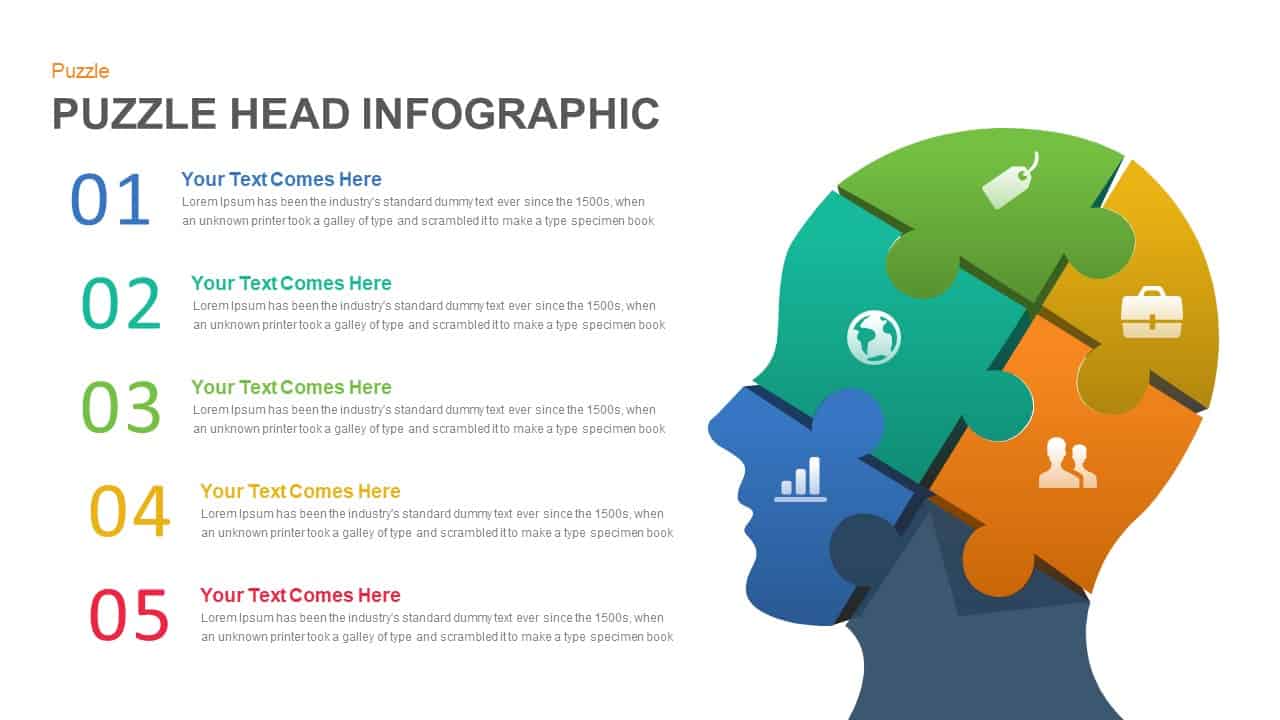
Five-Step Puzzle Head Infographic Template for PowerPoint & Google Slides
Process
-
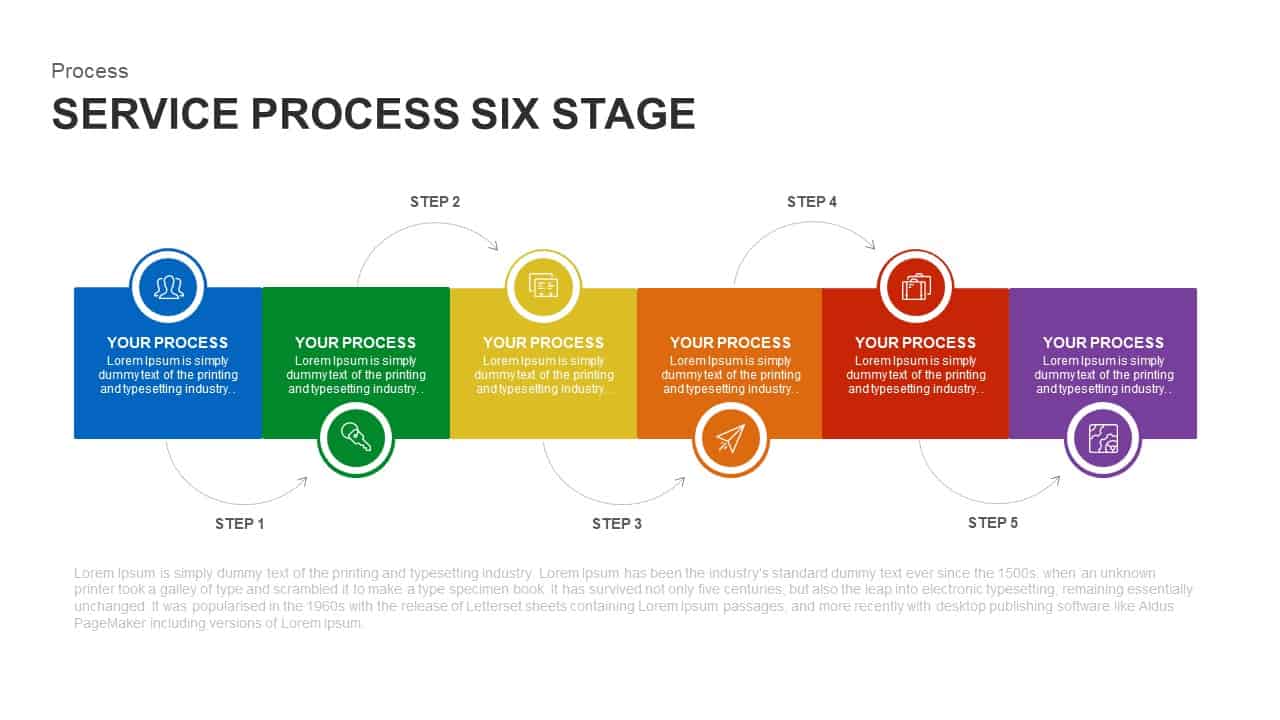
Six-Stage Service Process Workflow Template for PowerPoint & Google Slides
Process
-
Puzzle Diagram PowerPoint Template for PowerPoint & Google Slides
Process
-
Bottle Data Percentage Infographic Template for PowerPoint & Google Slides
Infographics
-
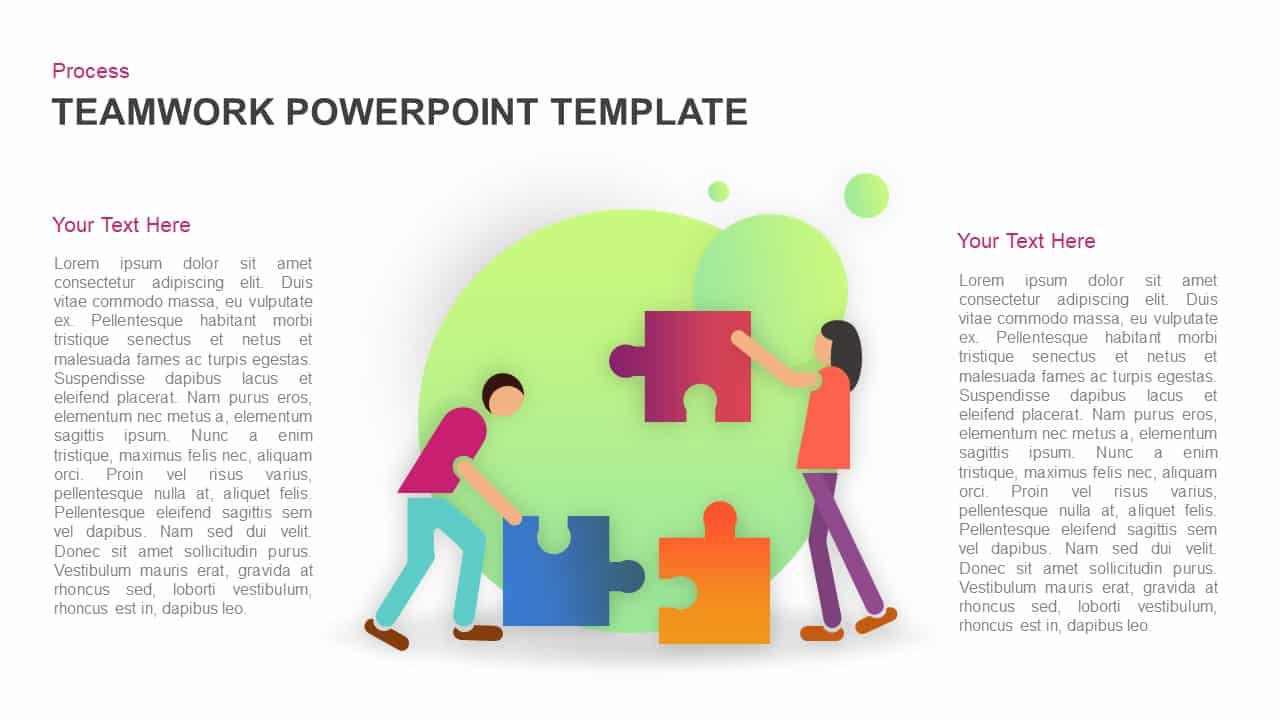
Modern Teamwork Puzzle Process Slide Template for PowerPoint & Google Slides
Process
-
Free Professional Cloud Infographics Template for PowerPoint & Google Slides
Process
Free
-
Free Six-Stage Arrow Process Diagram Template for PowerPoint & Google Slides
Process
Free
-
Teamwork PowerPoint Infographic Template for PowerPoint & Google Slides
Leadership
-
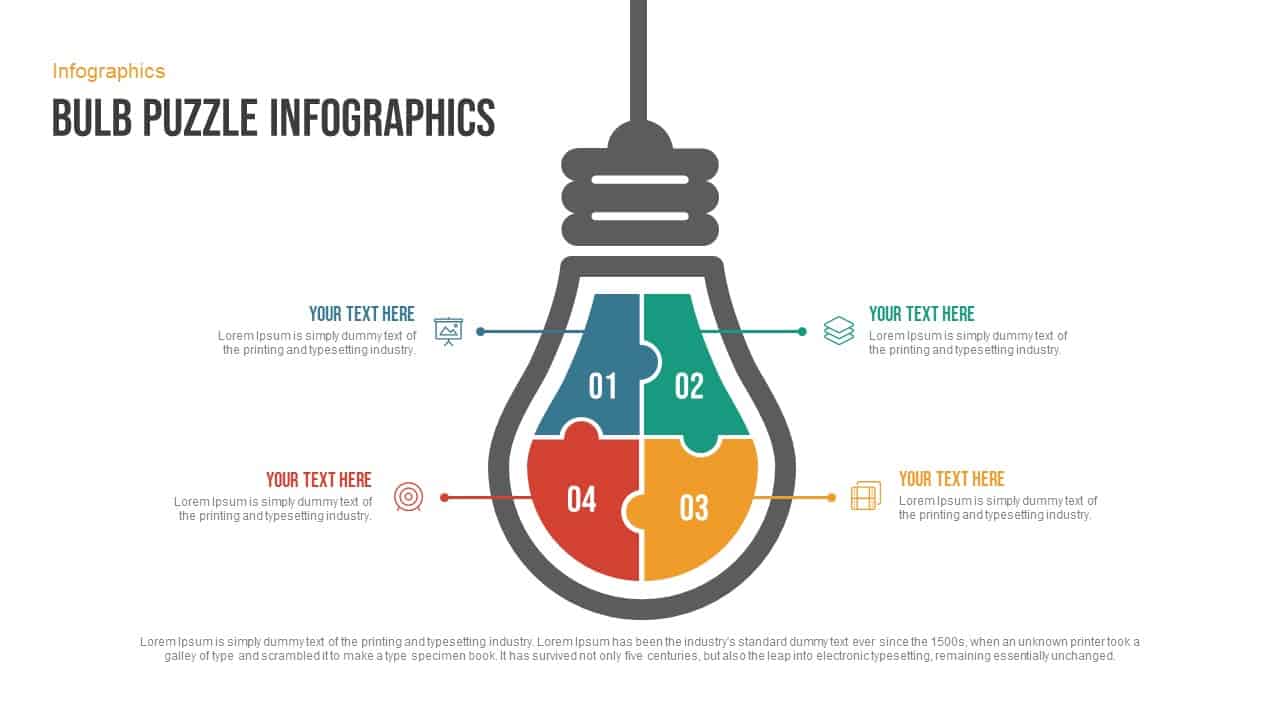
Free Bulb Puzzle Infographics Diagram Template for PowerPoint & Google Slides
Process
Free
-
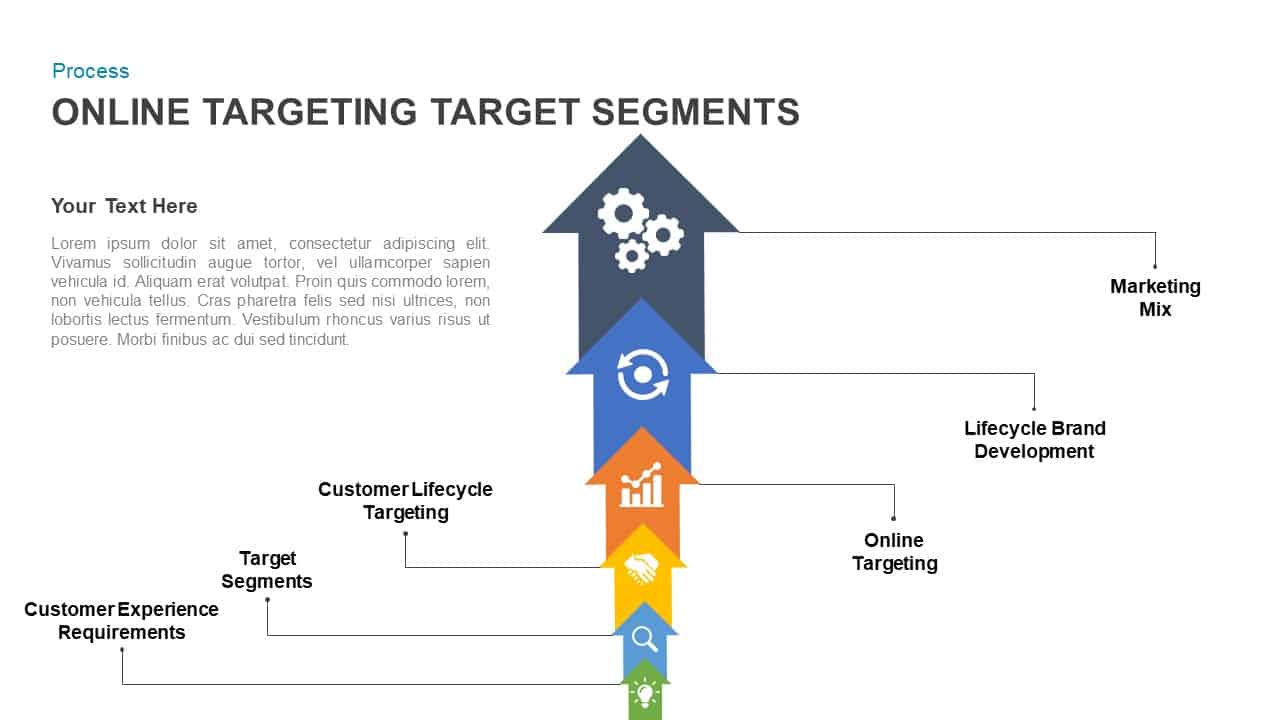
Online Targeting & Segmentation Diagram Template for PowerPoint & Google Slides
Process
-
Five-Stage Process Diagram Template for PowerPoint & Google Slides
Process
-
Six-Step Linear Arrow Process Diagram Template for PowerPoint & Google Slides
Process
-
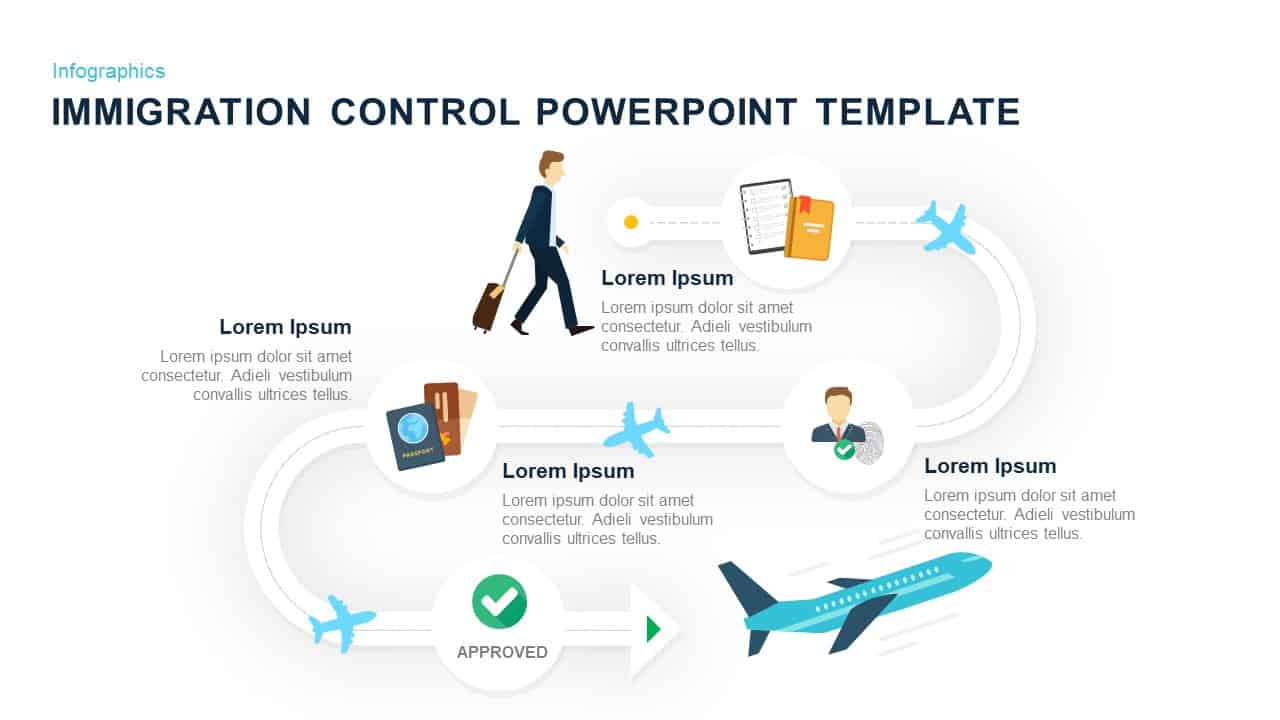
Immigration Control Process Infographic Template for PowerPoint & Google Slides
Process
-
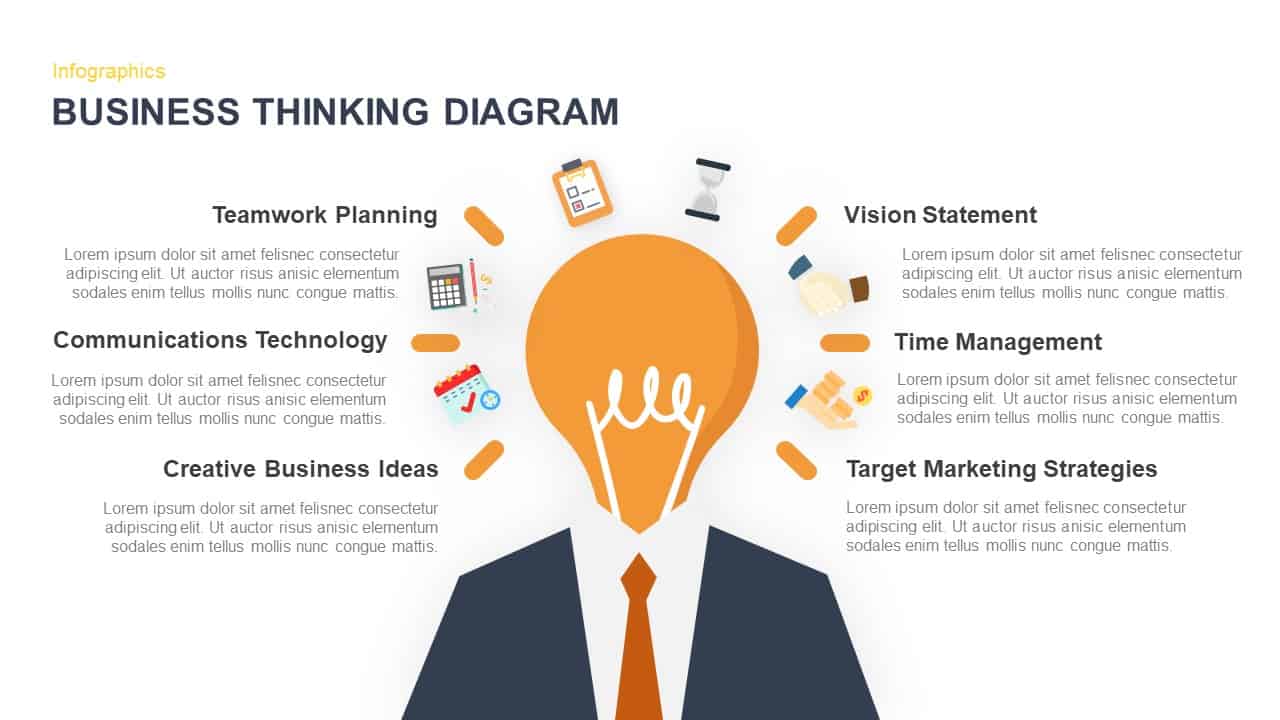
Business Thinking Concept Diagram Template for PowerPoint & Google Slides
Business Strategy
-
Sales Target Achievement Arrows Template for PowerPoint & Google Slides
Arrow
-
Business Process Improvement Cycle Template for PowerPoint & Google Slides
Process
-
Eight-Step New Product Survey Process Template for PowerPoint & Google Slides
Process