data-studio-insights-dashboard-dark-template-powerpoint-google-slides


Description
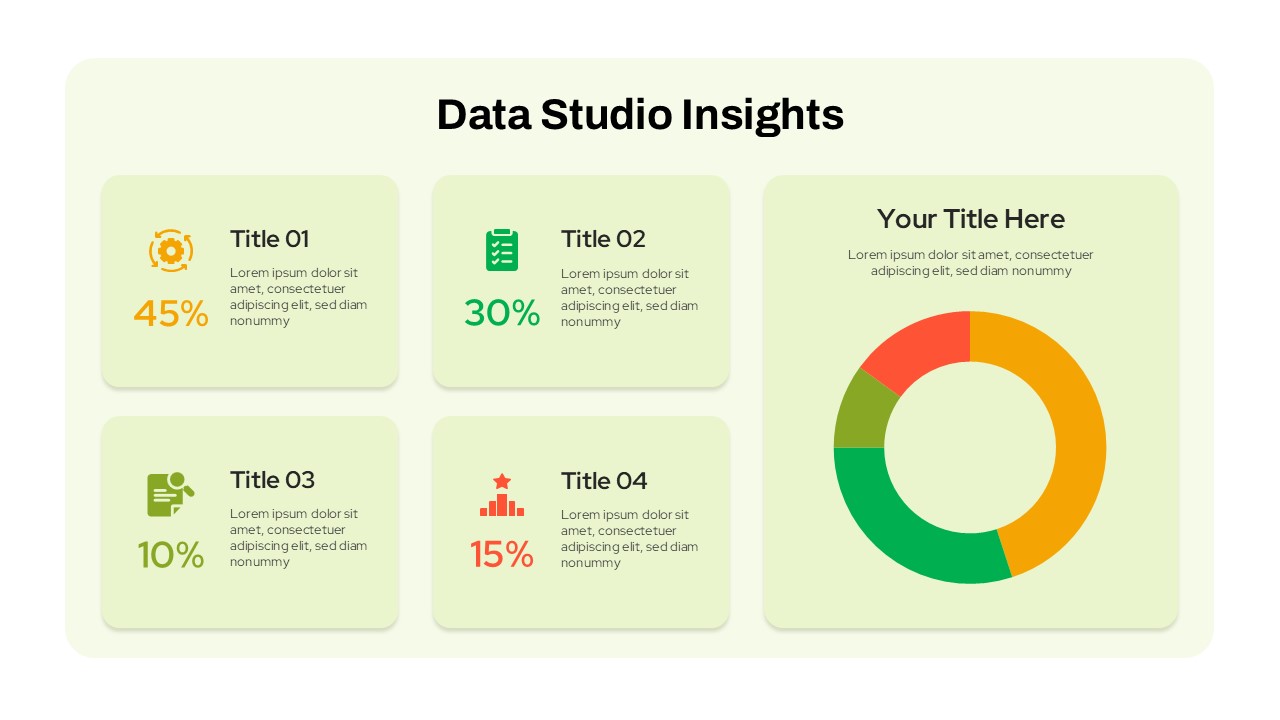
This Data Studio Insights template provides a sleek and organized layout for presenting analytical data and performance metrics. Featuring a clean design with color-coded sections for each insight, this slide makes it easy to display percentages and details across multiple categories. The inclusion of a central pie chart allows for a clear visual representation of data breakdowns, ideal for showcasing key insights in business, marketing, or performance reviews.
With sections to include titles, descriptions, and relevant data percentages (e.g., 45%, 30%, 10%, 15%), this template supports a structured and professional presentation style. Perfect for stakeholders or teams needing to report on data analysis, trends, and results, it ensures that all key points are clearly communicated.
Who is it for
This template is suited for data analysts, business managers, marketing professionals, and anyone involved in data presentation. It’s especially beneficial for individuals presenting data reports in meetings, sales, or marketing strategies.
Other Uses
Besides business insights, this template can also be adapted for educational purposes, offering a clear breakdown of research results, survey findings, or performance evaluations. It can also be used for project status reports or any situation where multiple data points need to be presented in an organized and visually appealing format.
Login to download this file


