Customer Satisfaction Survey Result Presentation Template


Customer Satisfaction Report PowerPoint and Google Slides
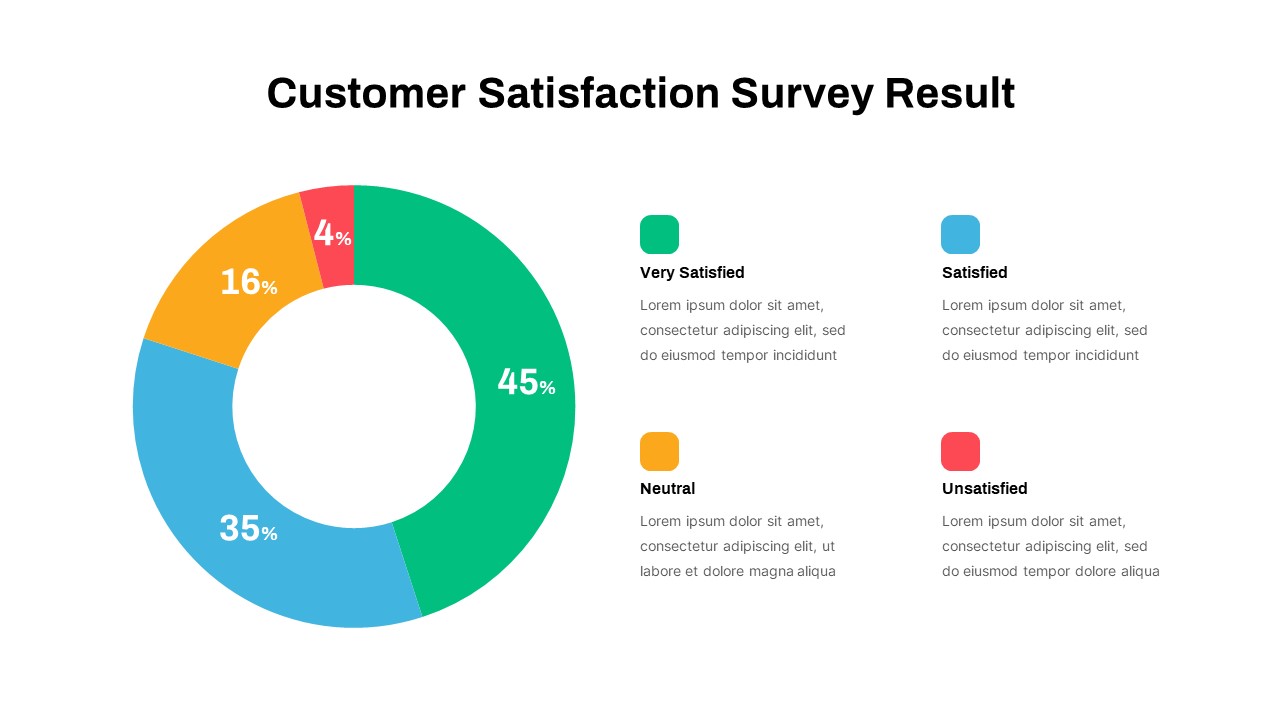
The fully editable customer satisfaction survey results presentation template helps show business research outcomes using high-fidelity layout graphics. This professional presentation model contains four versatile slides across two variant infographic designs that are ideal for delivering detailed customer survey reports. By transforming raw questionnaire feedback into a clear visual story using color-coded percentages, this marketing presentation template enables businesses to quickly understand client feedback, benchmark performance, and communicate customer experience (CX) trends to stakeholders and executive decision-makers cleanly.
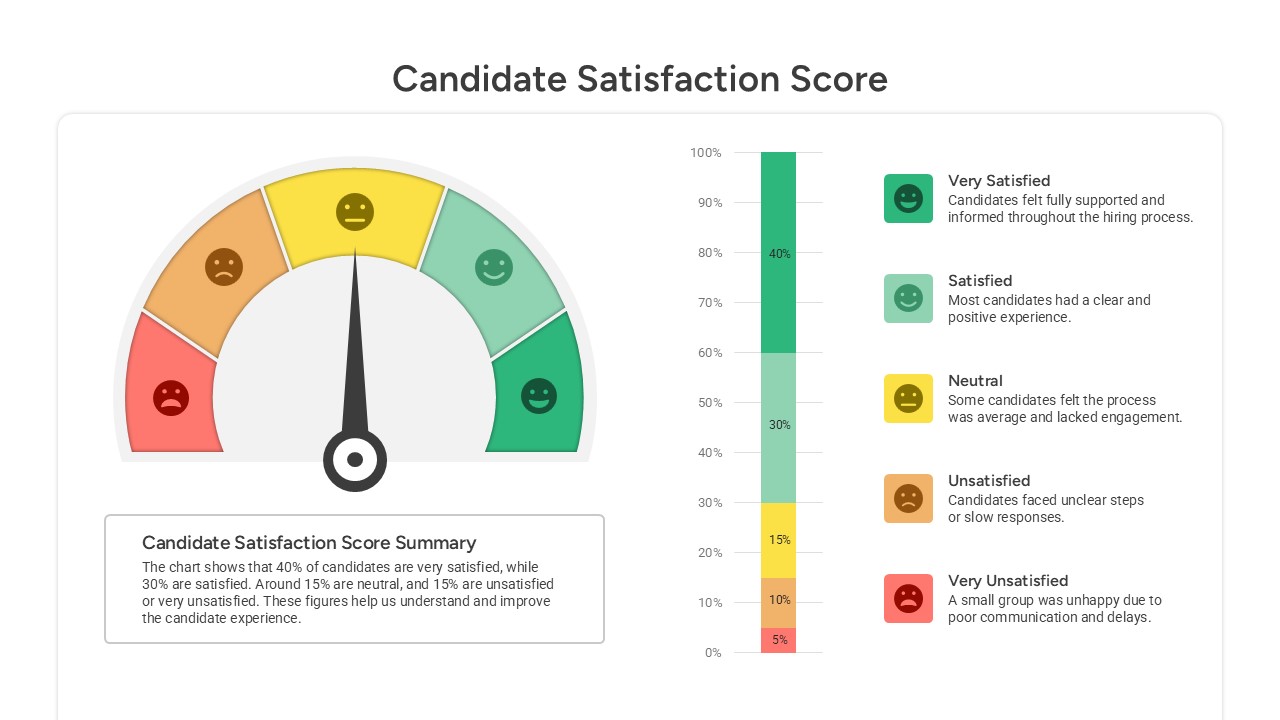
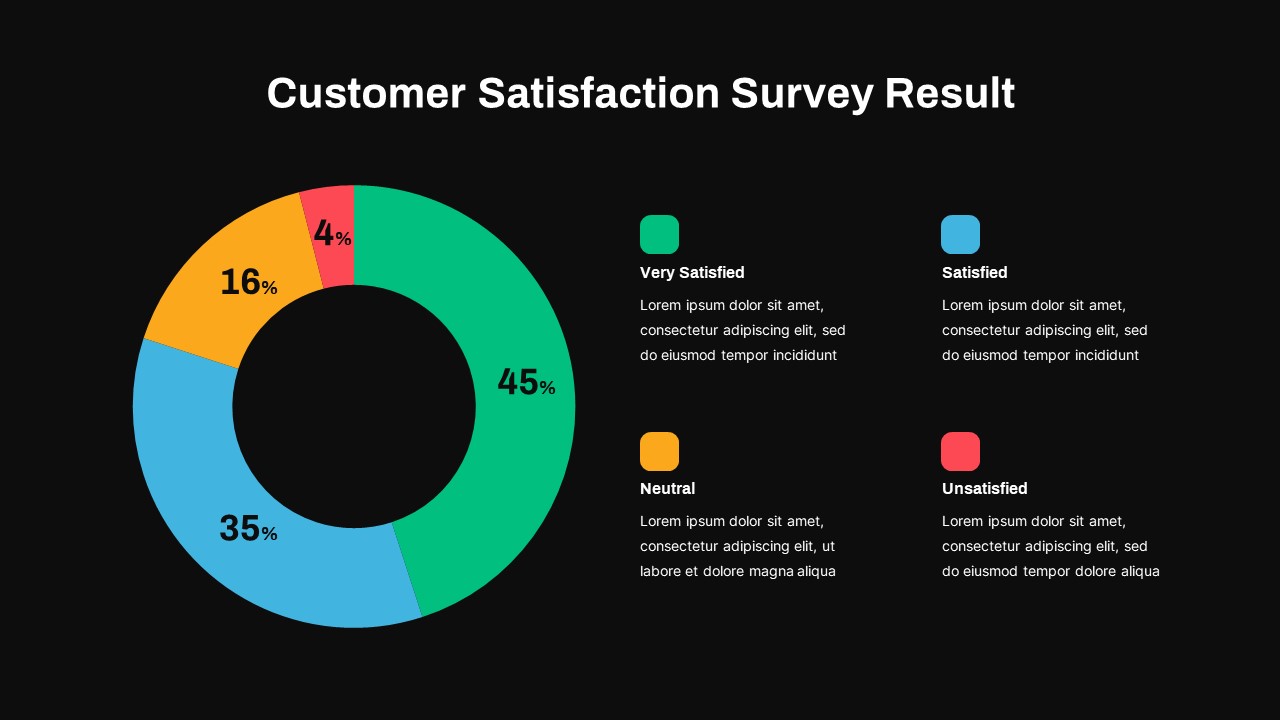
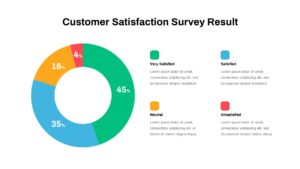
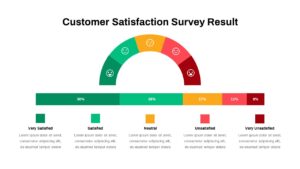
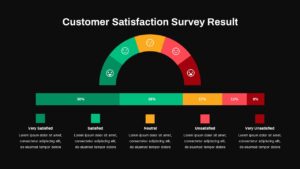
The first slide layout inside this customer satisfaction survey result toolkit features a clean donut chart segmented into four critical points: Very Satisfied, Satisfied, Neutral, and Unsatisfied. This neatly structured template uses a color-coded matrix grid—filling Very Satisfied with green, Satisfied in blue, Neutral in yellow, and Unsatisfied in red—paired with text placeholders along the side for detailed description notes. The second slide transforms your survey metrics into an interactive semi-circular gauge infographic and rating scale using five emotive icon emojis. This customer satisfaction survey presentation slides maps out customer sentiment distributions across matching color zones, underpinned by a 100% horizontal bar chart for precise percentages. Both unique slide variations are available in clean white layouts and premium dark theme presets to ensure total font legibility on large boardroom screens.
Optimized seamlessly for offline Microsoft PowerPoint suites and cloud-based Google Slides workspaces, every element functions as a 100% editable vector shape. Presenters can modify embedded chart values, alter the color schemes to match strict corporate branding guidelines, or adjust text placeholders instantly with just a few clicks. Download this polished corporate timeline and results deck to streamline your quarterly business reviews, product feedback summaries, and sales presentations with zero design hassle.
Login to download this file

Item ID
SB03601
Related Templates

Employee Satisfaction Survey Dashboard Template for PowerPoint & Google Slides
Employee Performance
Customer Satisfaction KPI Dashboard Template for PowerPoint & Google Slides
Customer Experience

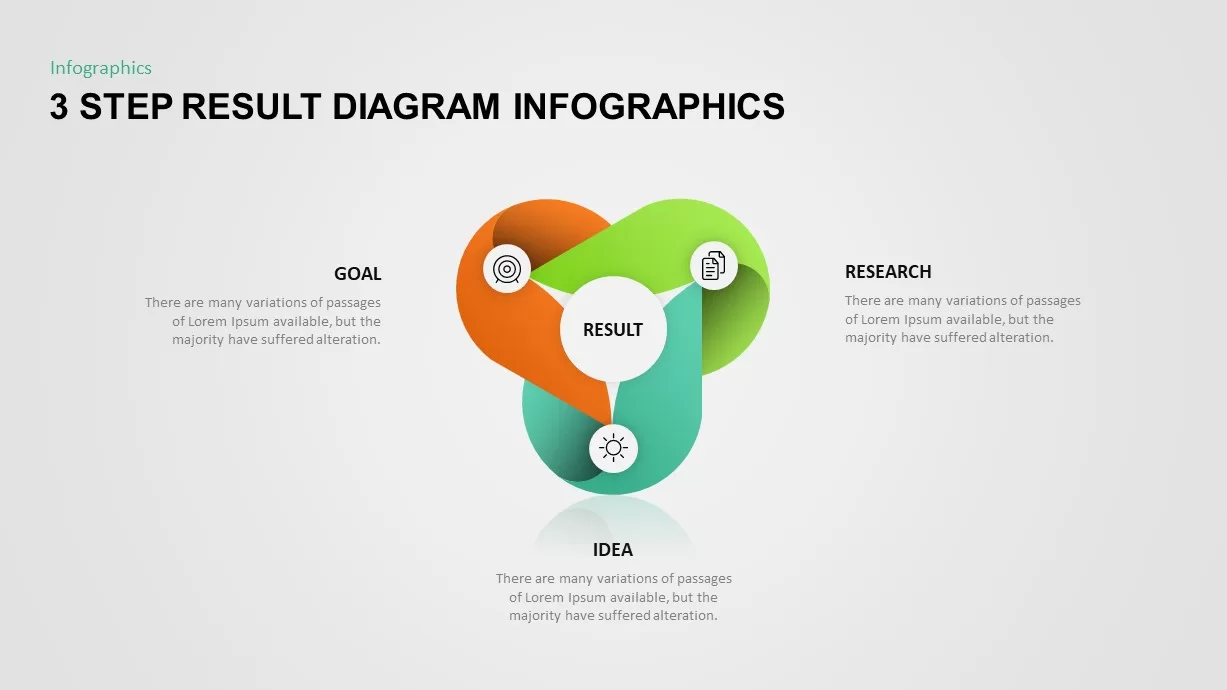
Three-Step Result Diagram Infographic Template for PowerPoint & Google Slides
Process
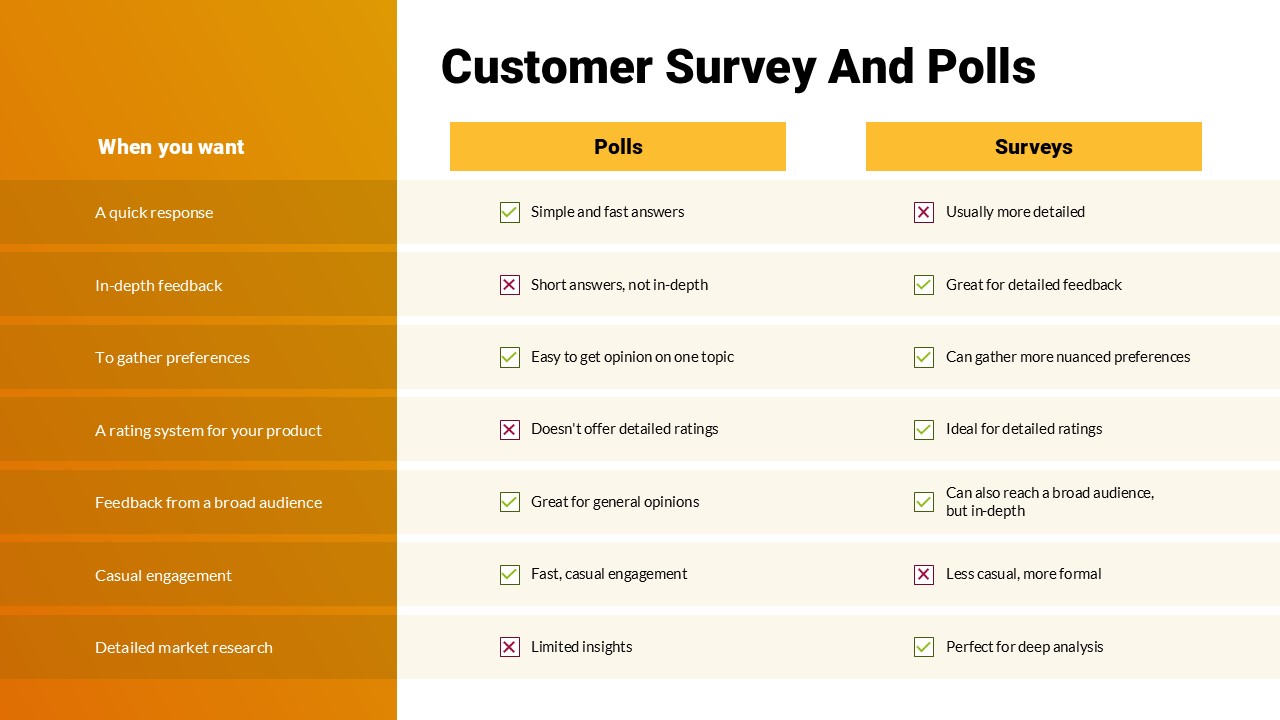
Customer Survey & Polls Comparison PowerPoint Template
Customer Experience
Candidate Satisfaction Score template for PowerPoint & Google Slides
Business
Patient-Satisfaction KPI Dashboard for PowerPoint & Google Slides
Business
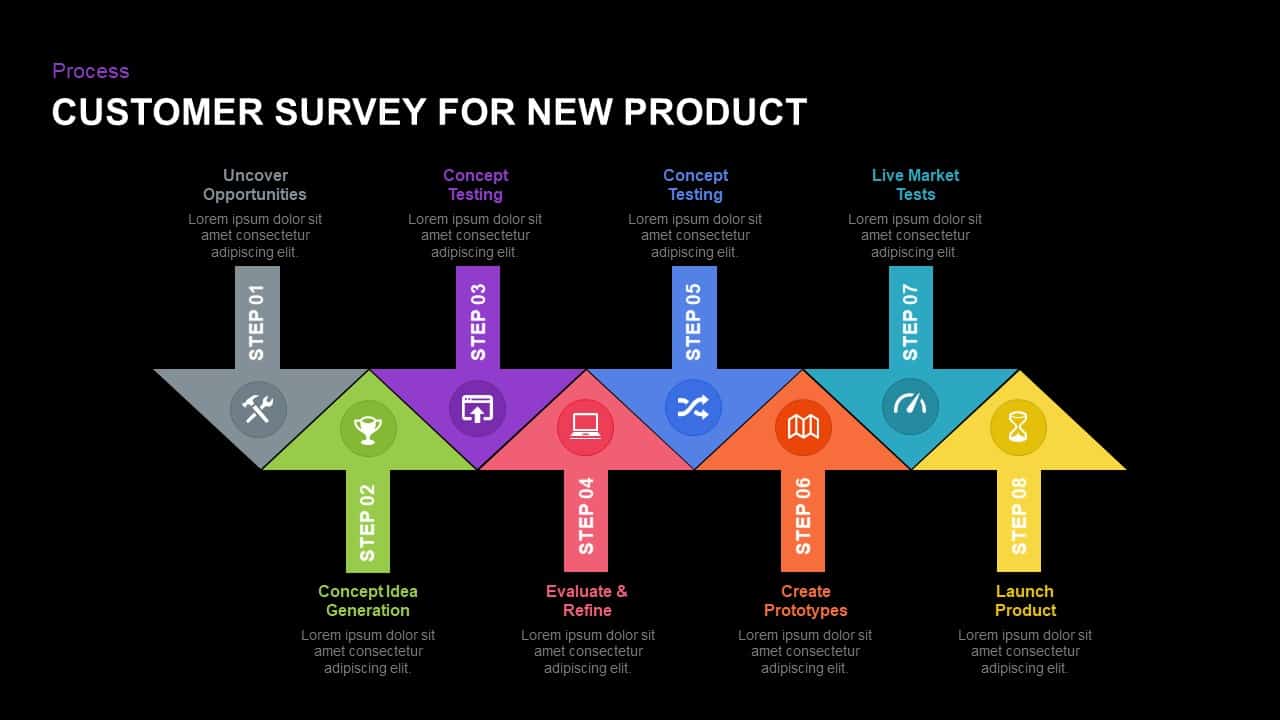
Eight-Step New Product Survey Process Template for PowerPoint & Google Slides
Process

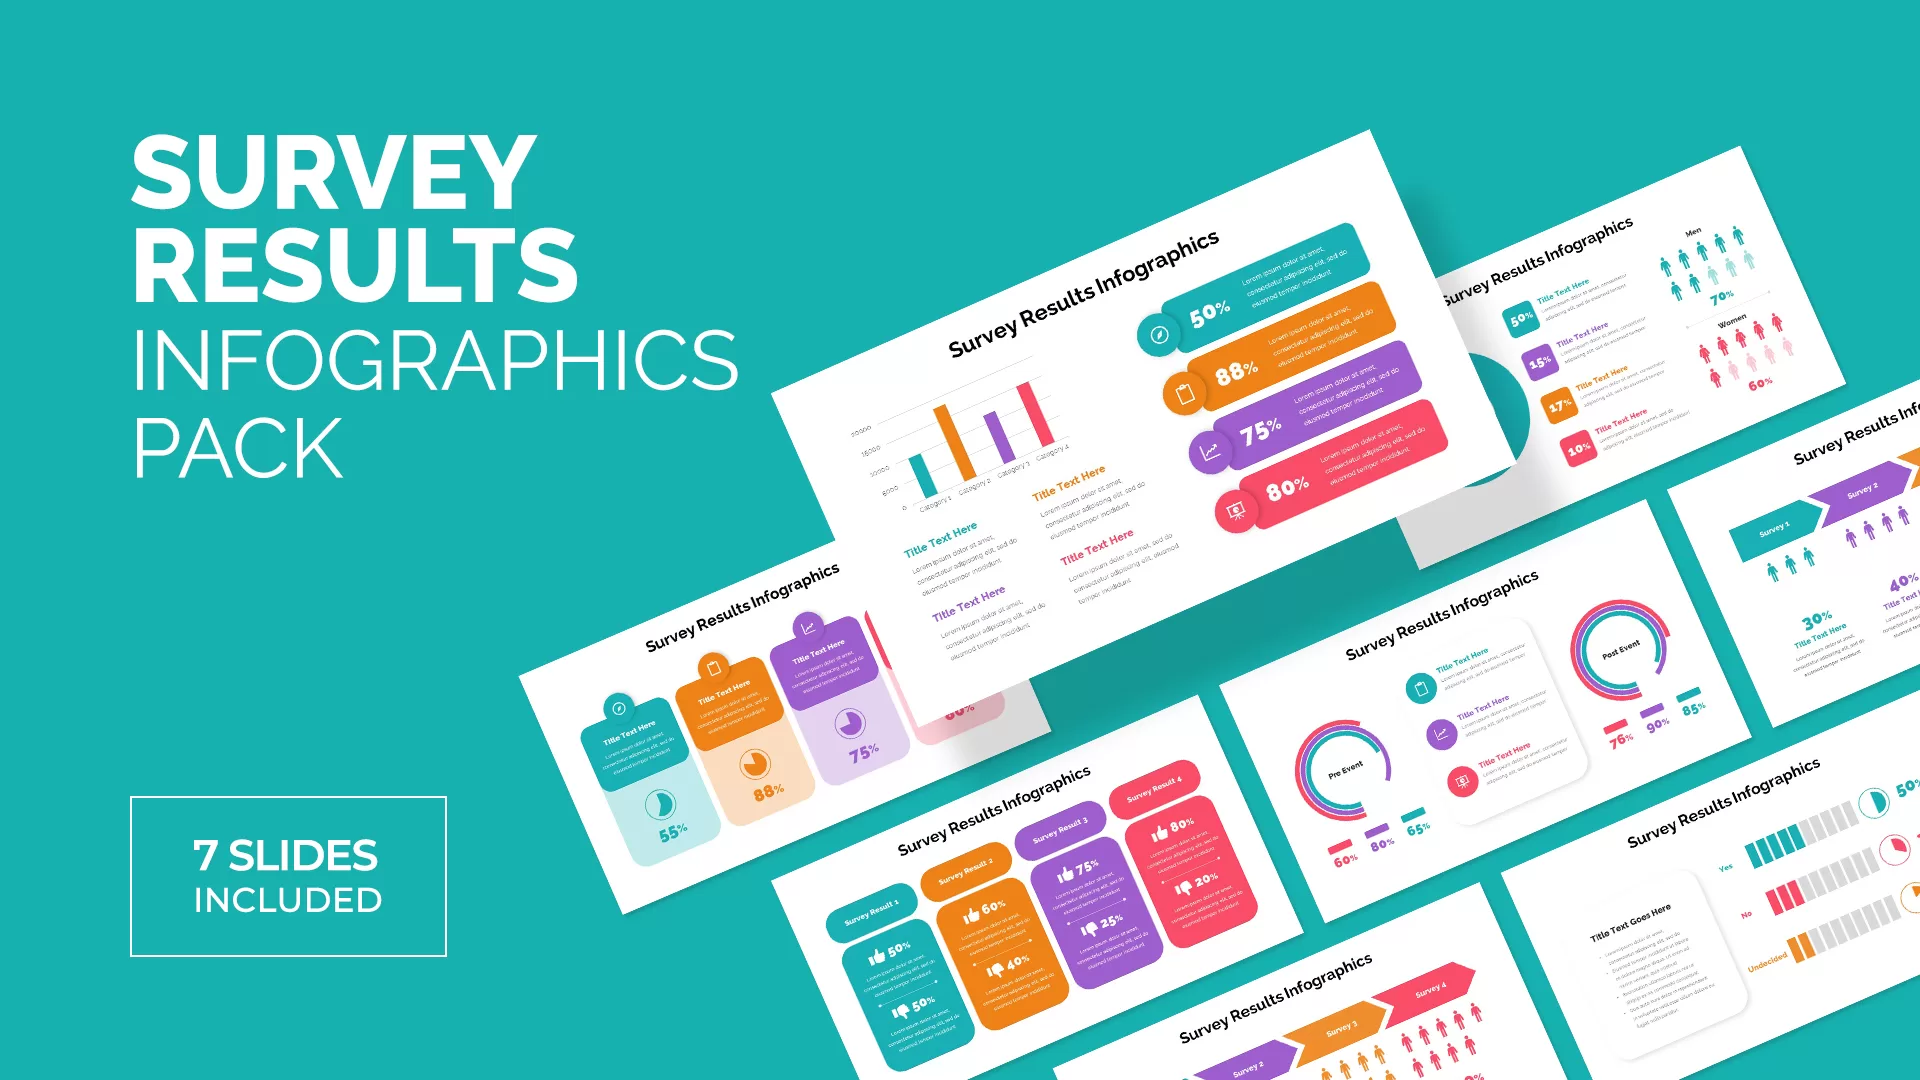
Survey Results Template Infographics
Infographics
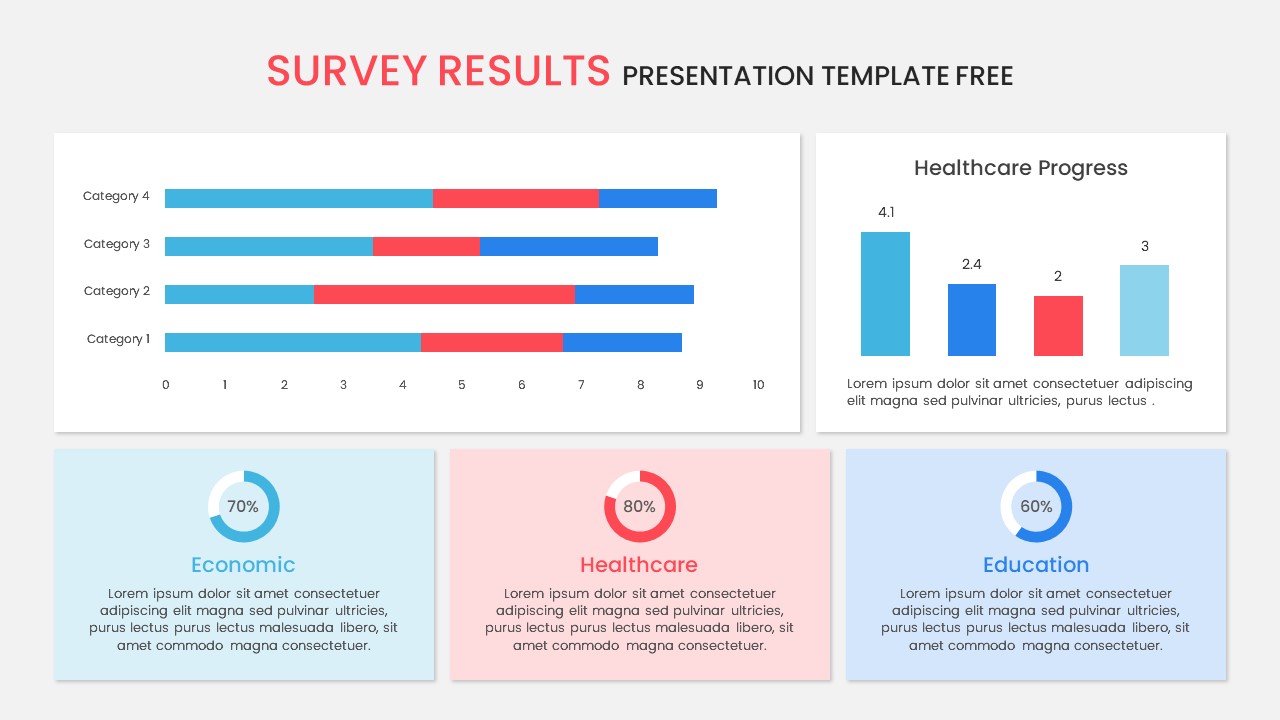
Free Survey Results Analysis Slide for PowerPoint & Google Slides
Business Report
Free

Customer Relationship Management (CRM) Presentation Template for PowerPoint
Decks
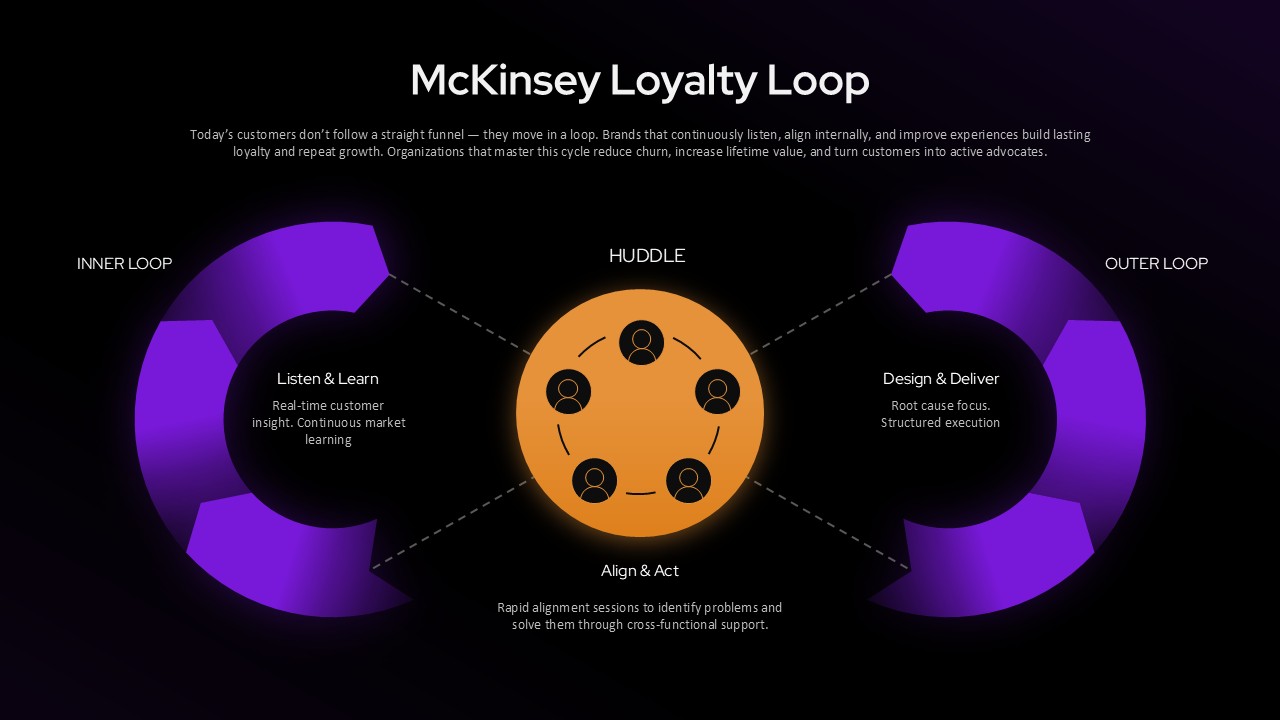
Customer Loyalty Loop (McKinsey Model) Presentation Template
Customer Experience
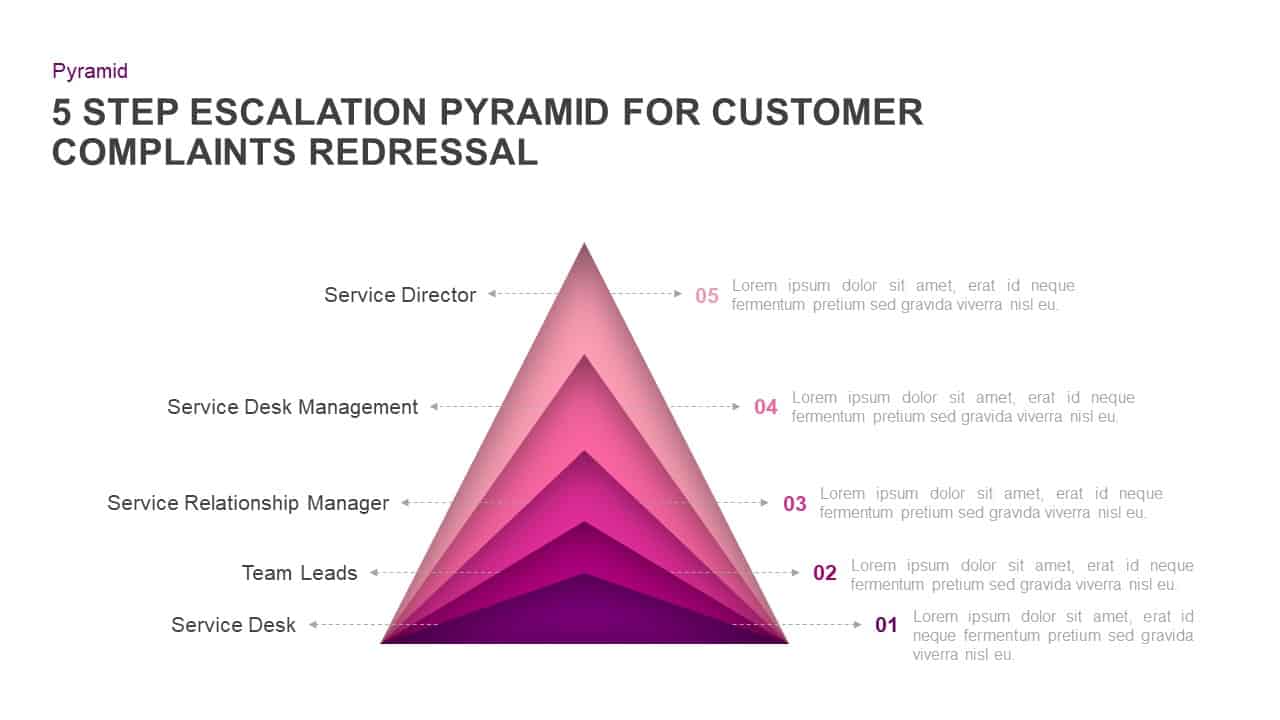
Customer Complaints Escalation Pyramid Template for PowerPoint & Google Slides
Infographics
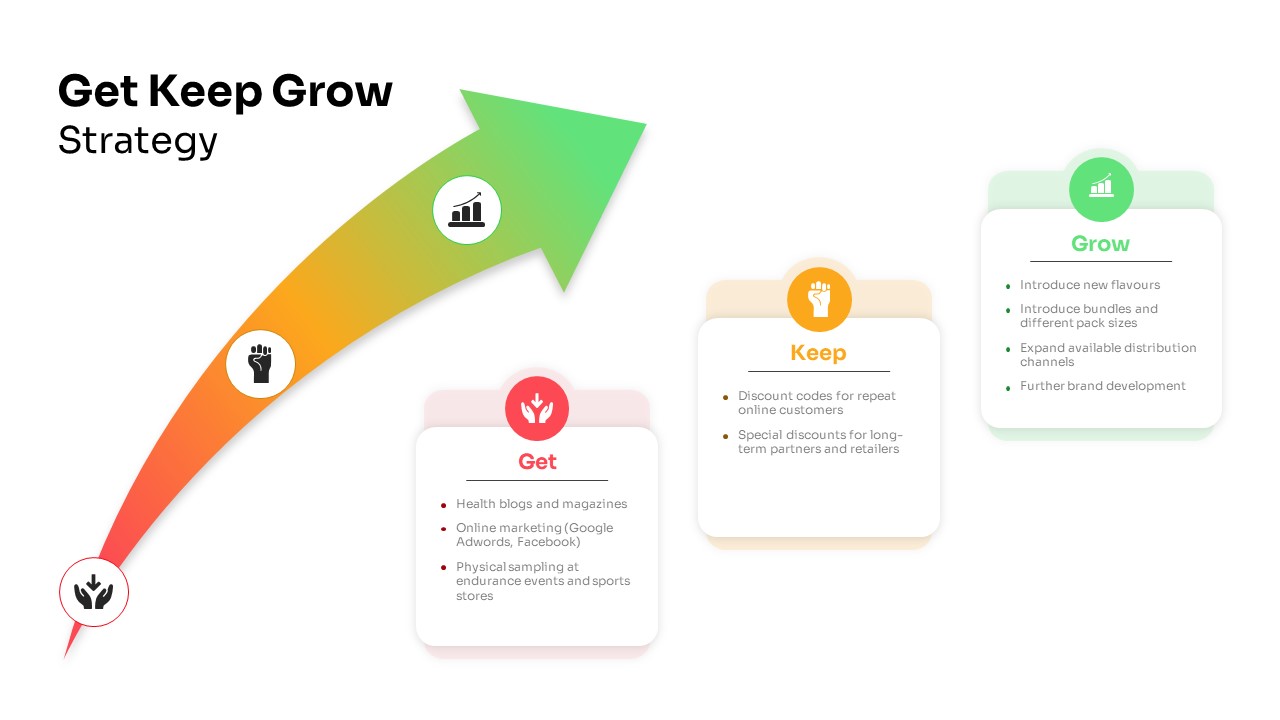
Get Keep Grow Customer Strategy Template for PowerPoint & Google Slides
Business Strategy
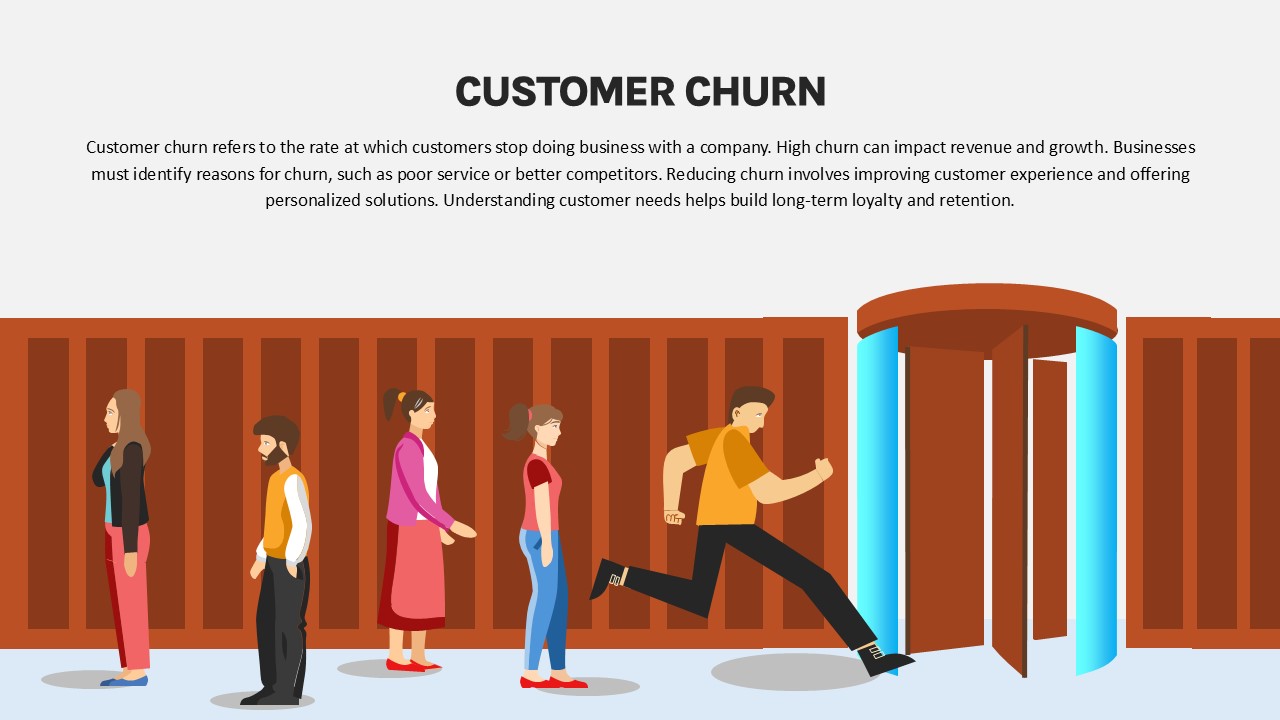
Customer Churn Illustration Diagram Template for PowerPoint & Google Slides
Customer Journey
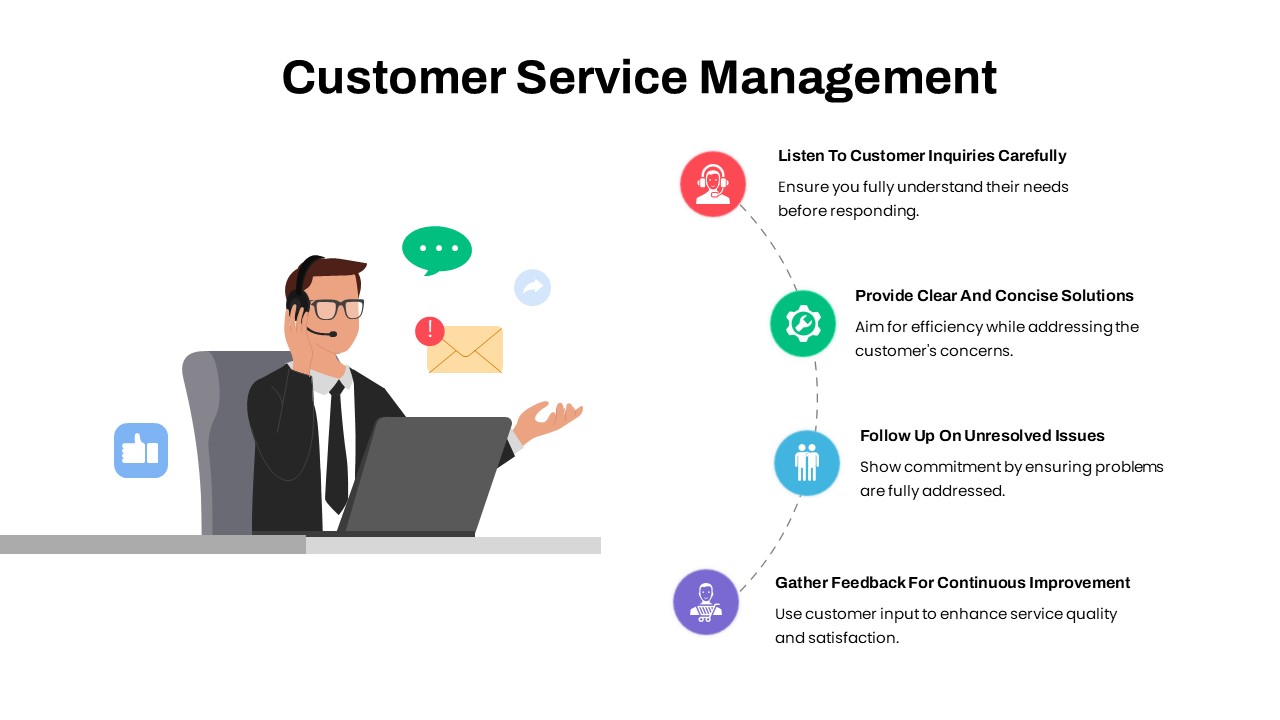
Customer Service Management Process Template for PowerPoint & Google Slides
Process
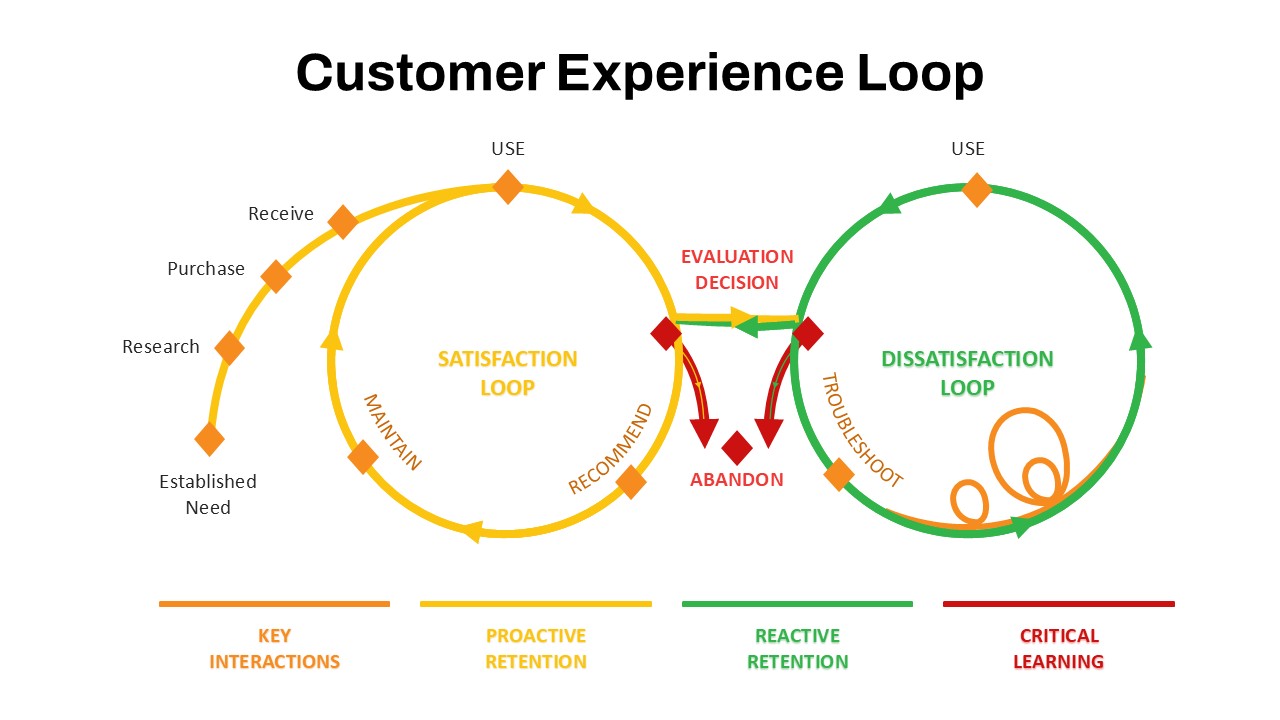
Customer Experience Loop Template for PowerPoint & Google Slides
Customer Experience
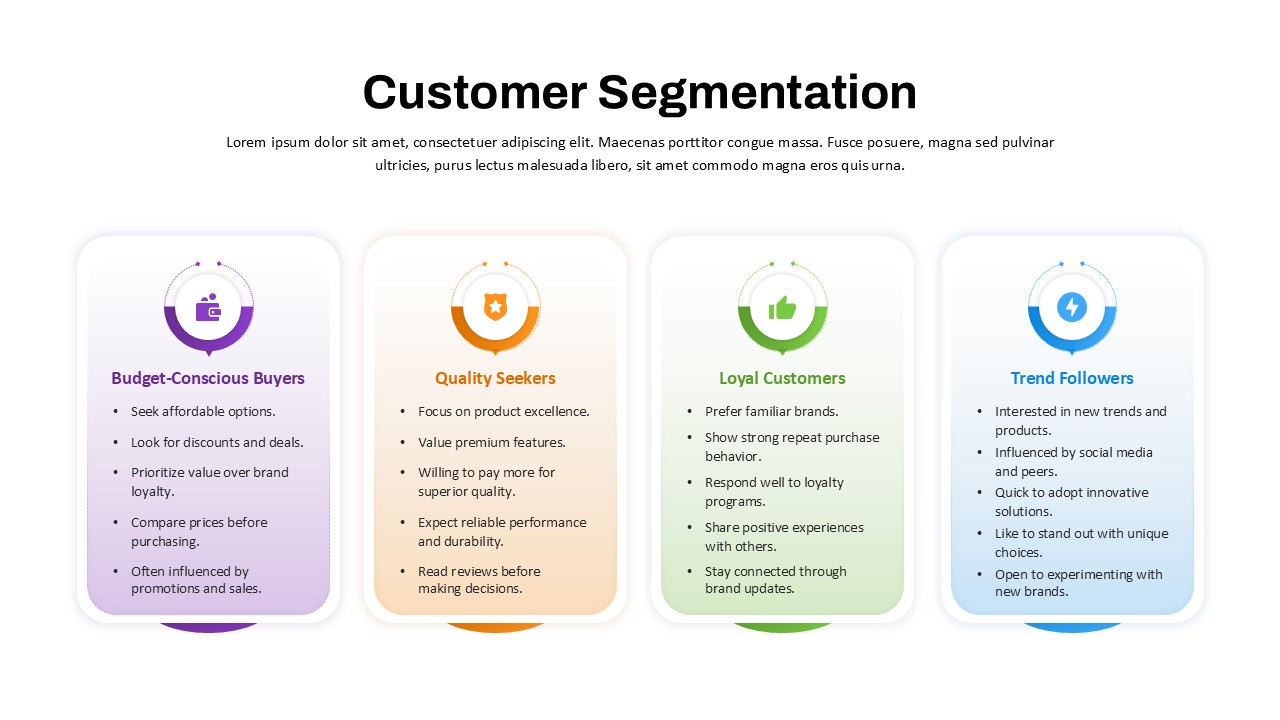
Customer Segmentation Overview template for PowerPoint & Google Slides
Marketing
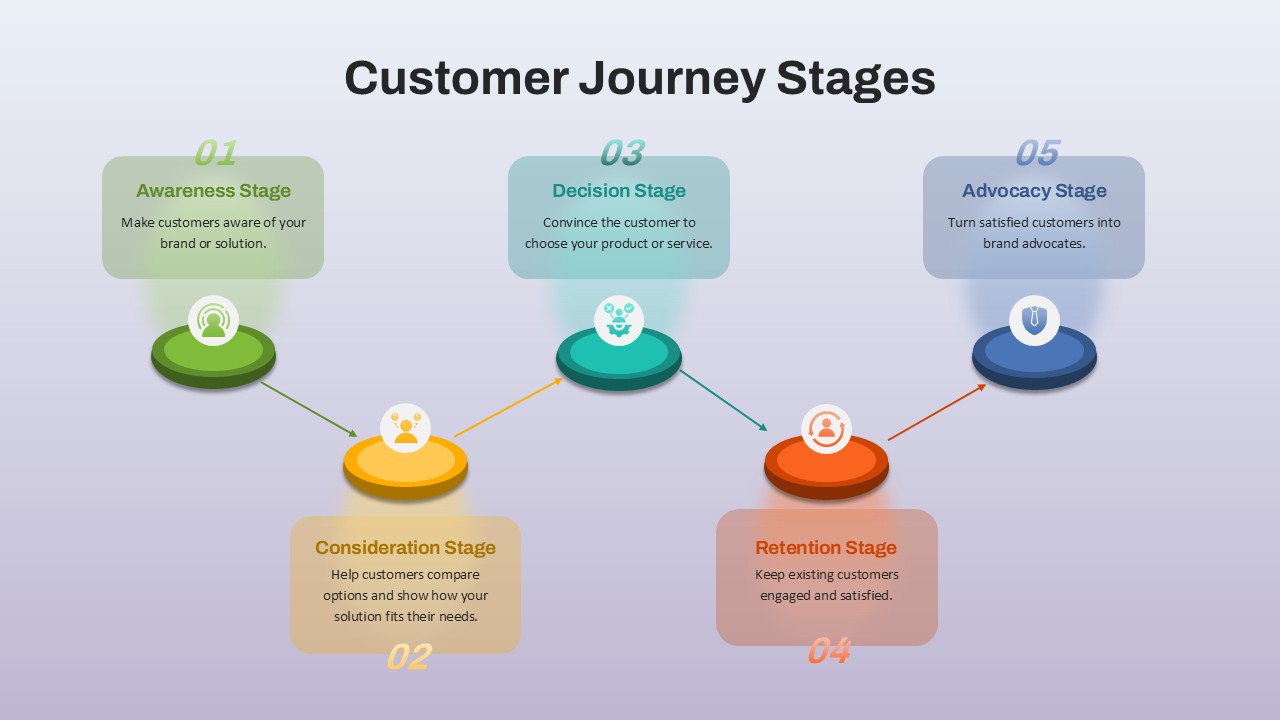
Customer Journey Stages template for PowerPoint & Google Slides
Business
Customer Experience Journey Template for PowerPoint & Google Slides
Customer Journey
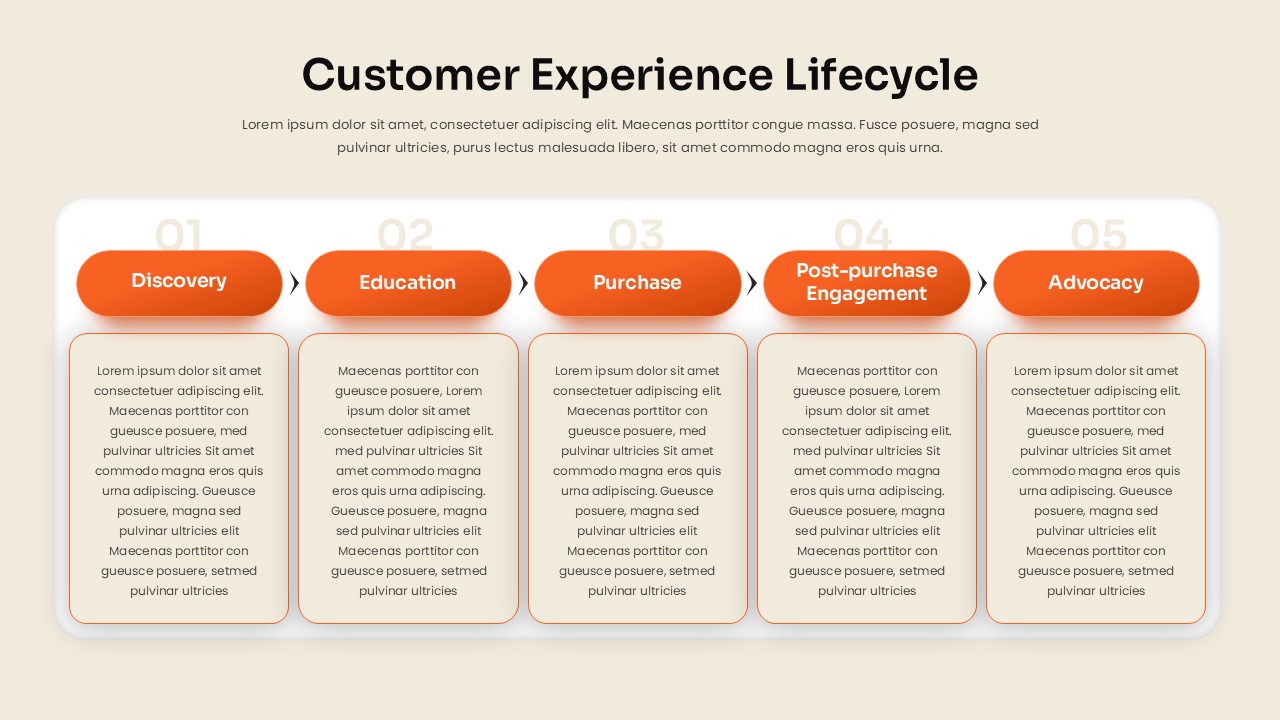
Customer Experience Lifecycle Template for PowerPoint & Google Slides
Customer Journey