Customer Experience & Journey Infographic Templates for PowerPoint & Google Slides


Description
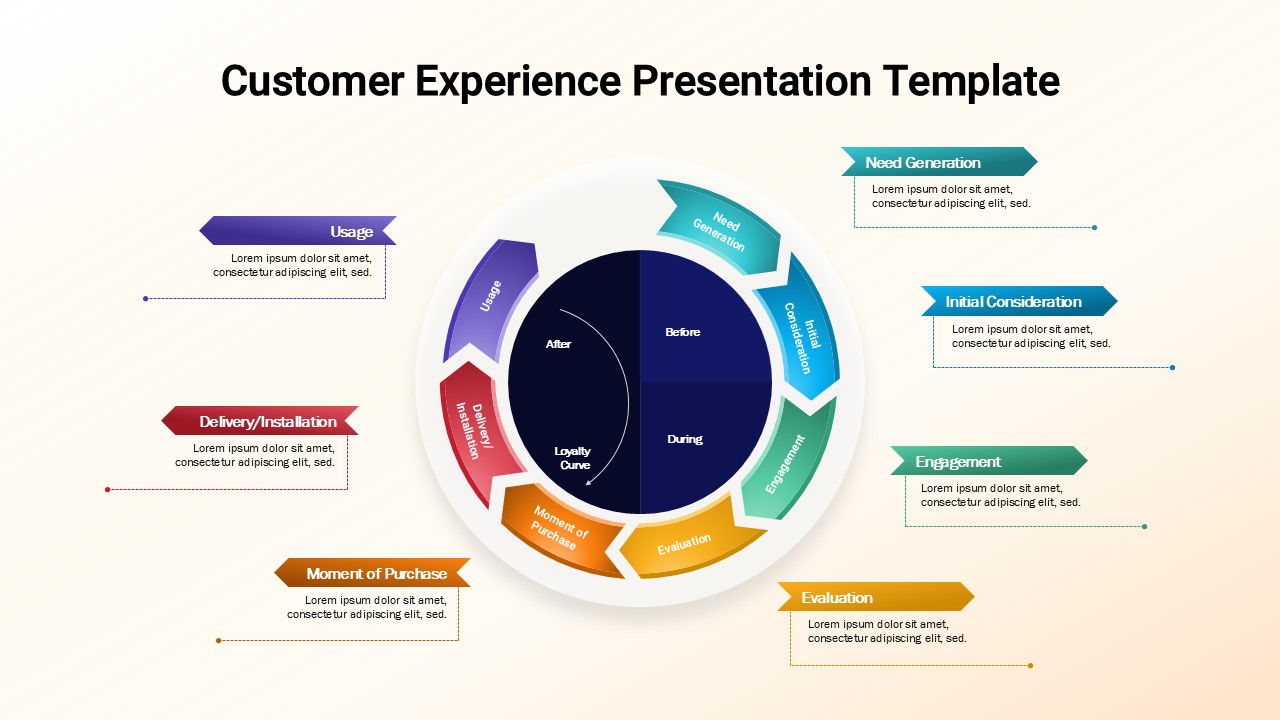
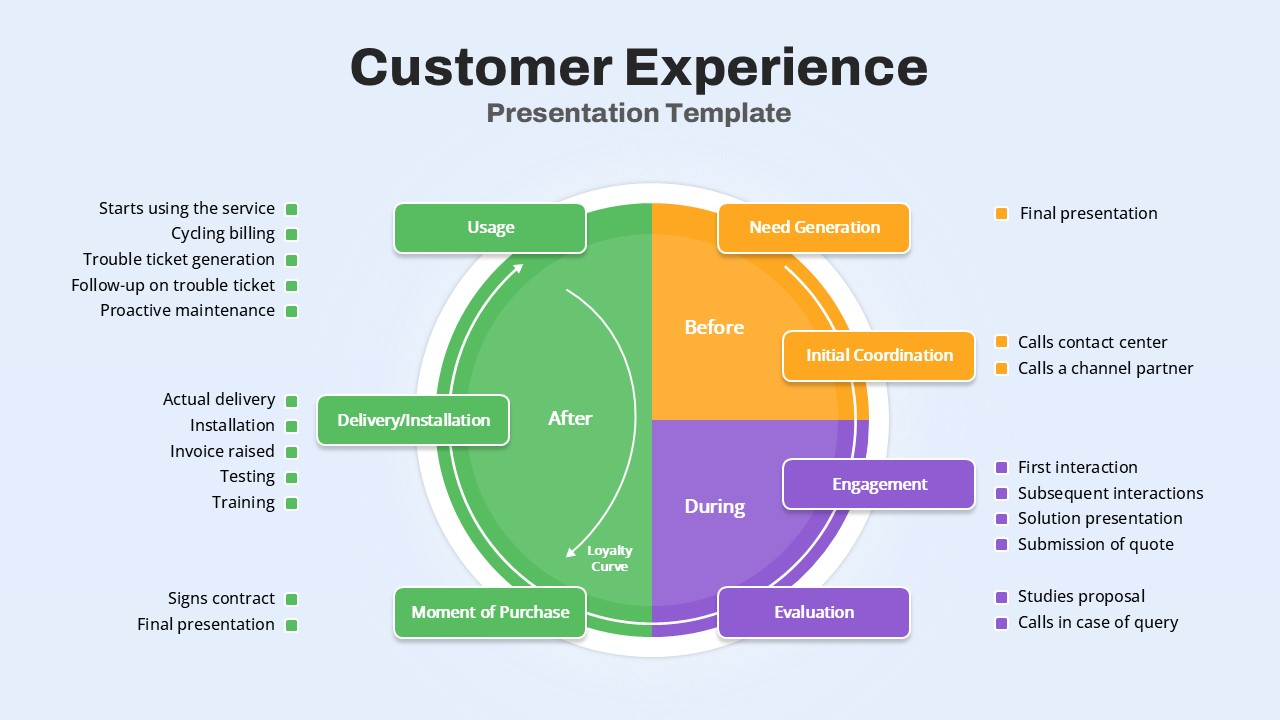
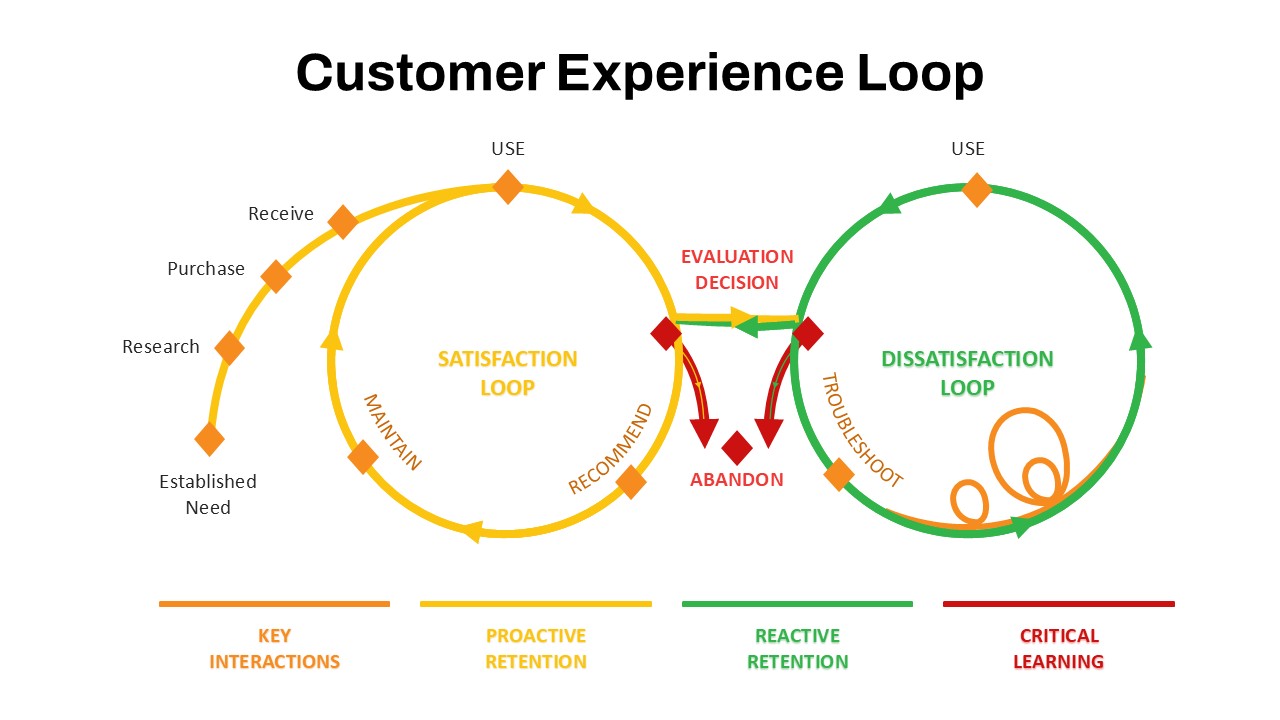
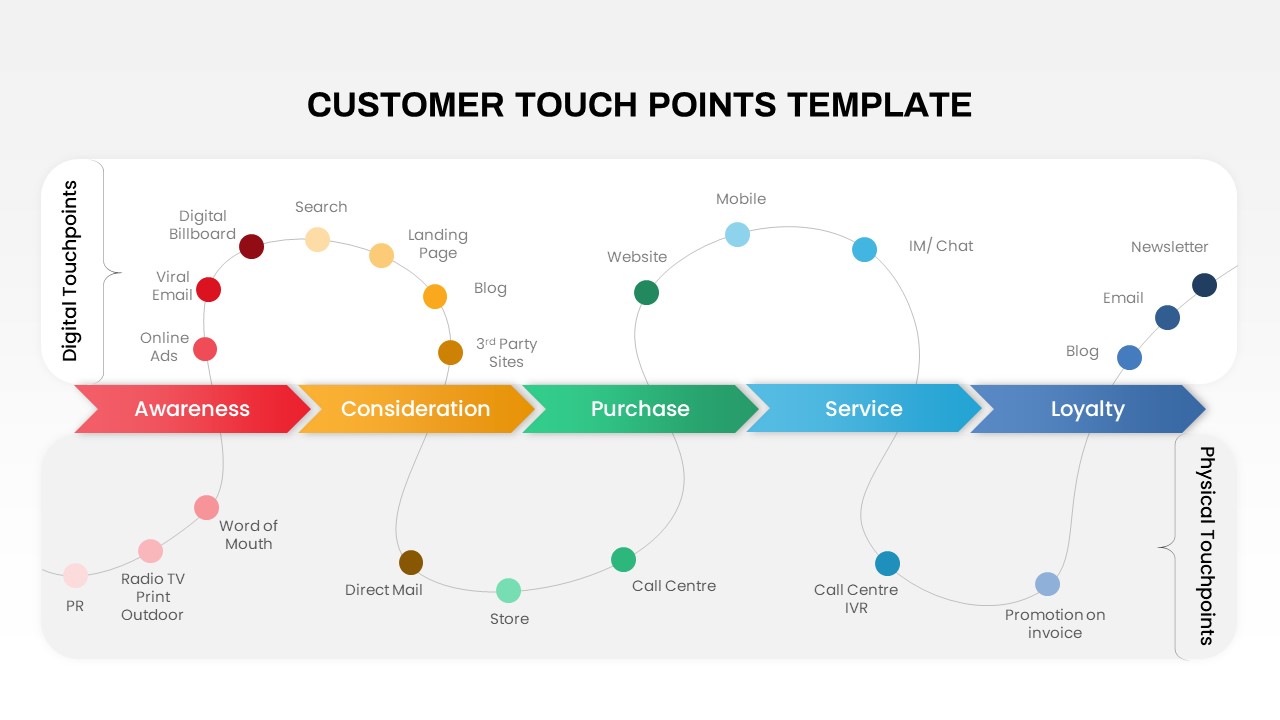
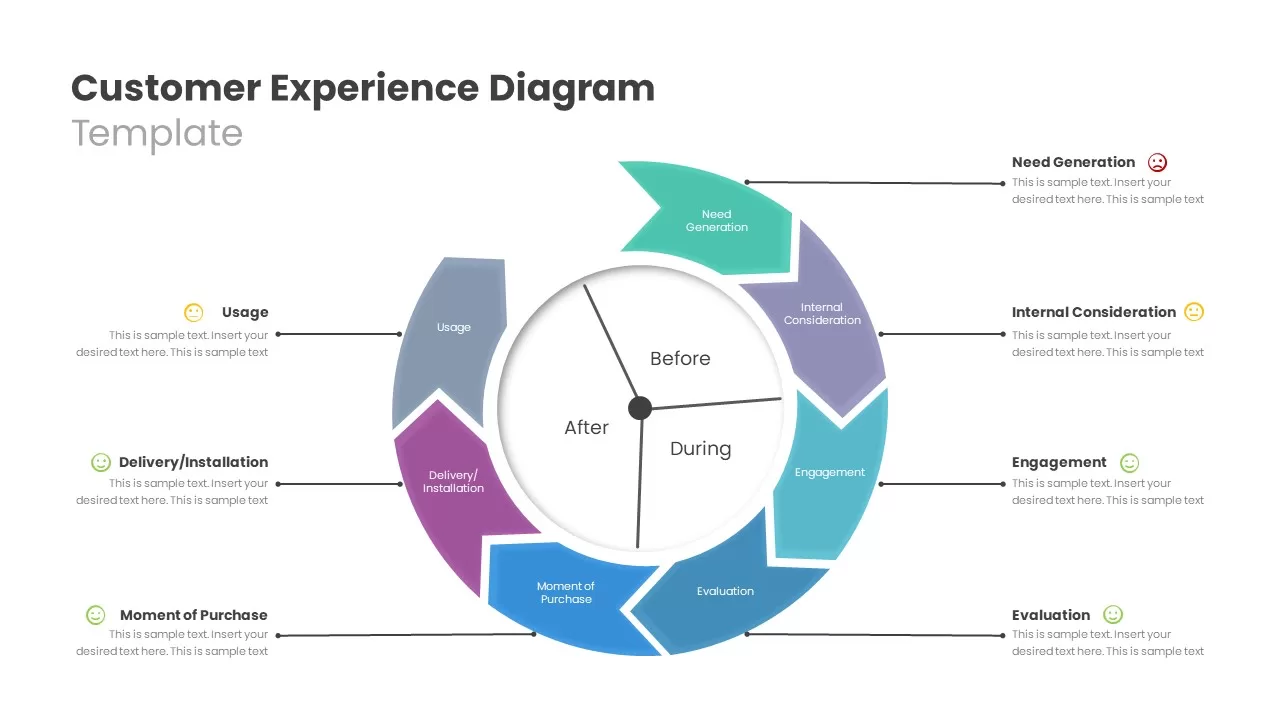
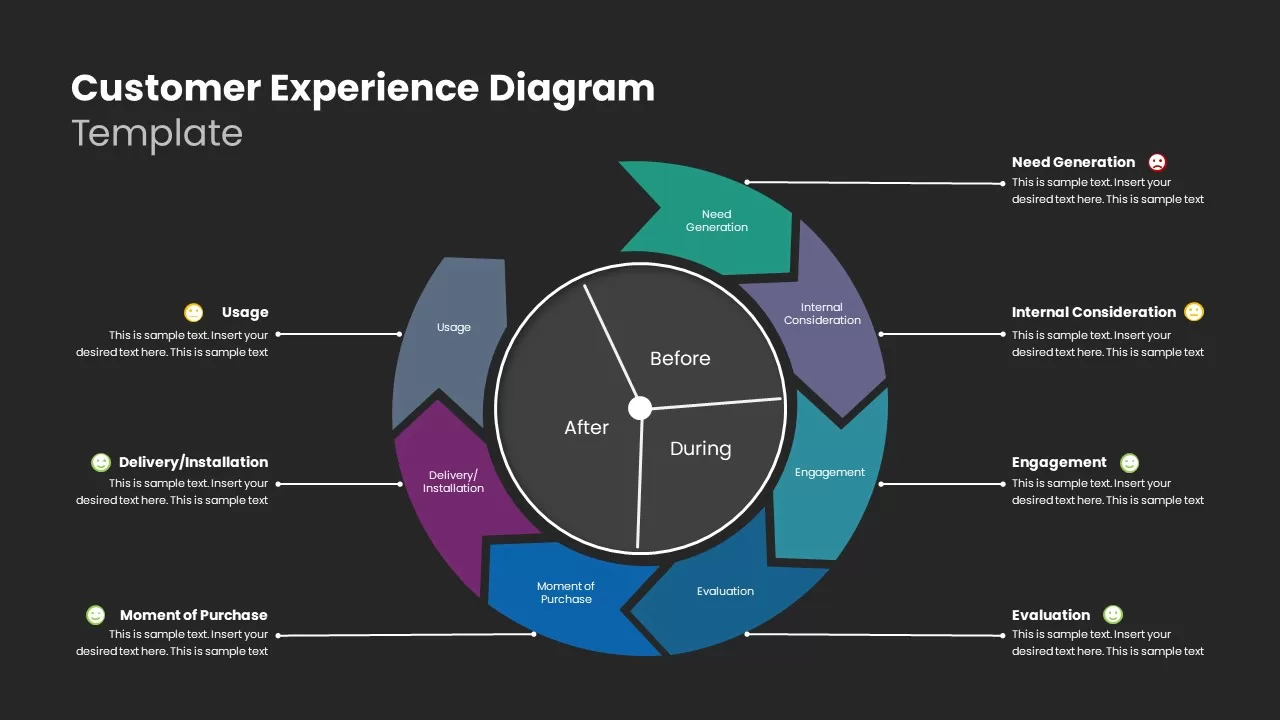
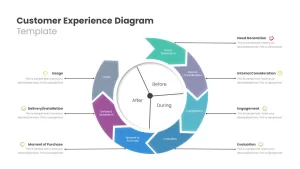
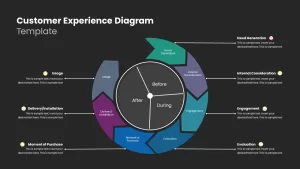
Transform your customer insights into compelling visuals with this pack of three fully editable infographics. First, the Circular Experience Diagram maps “Before,” “During,” and “After” phases in a striking ring, segmented into Need Generation, Internal Consideration, Engagement, Evaluation, Moment of Purchase, Delivery/Installation, and Usage. Connector lines and emotion icons let you annotate each phase with observations or sentiment markers.
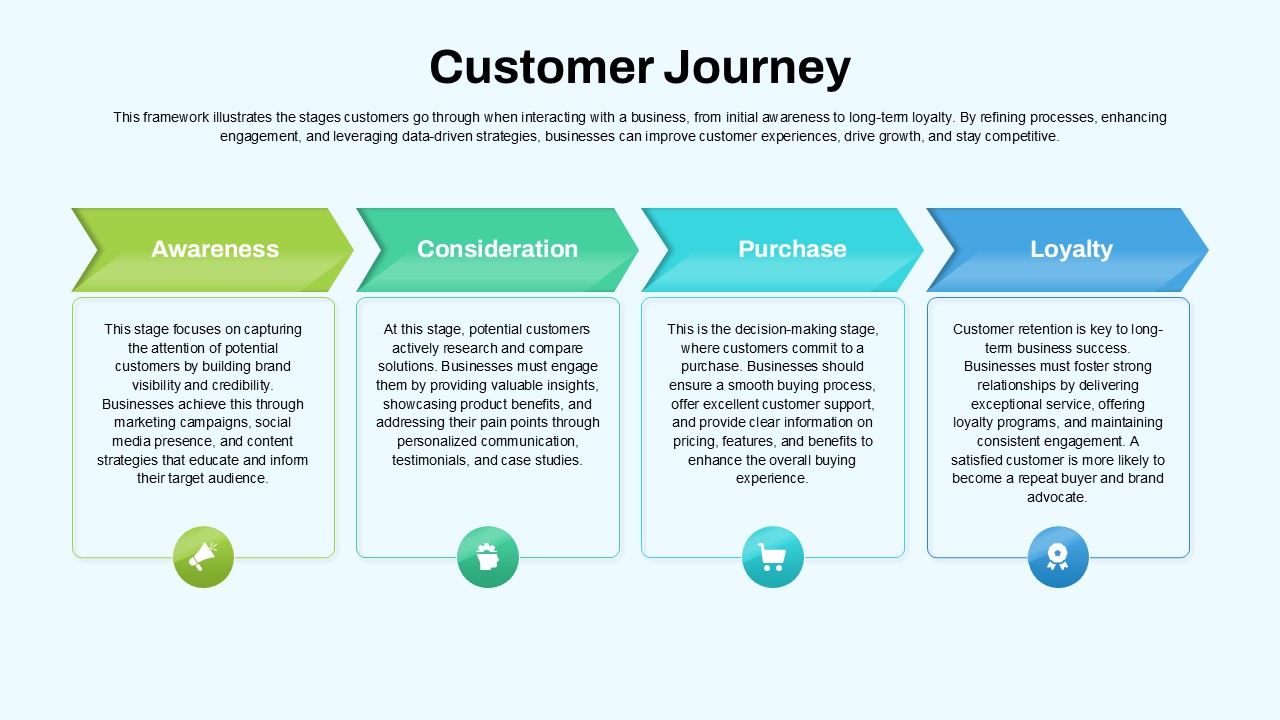
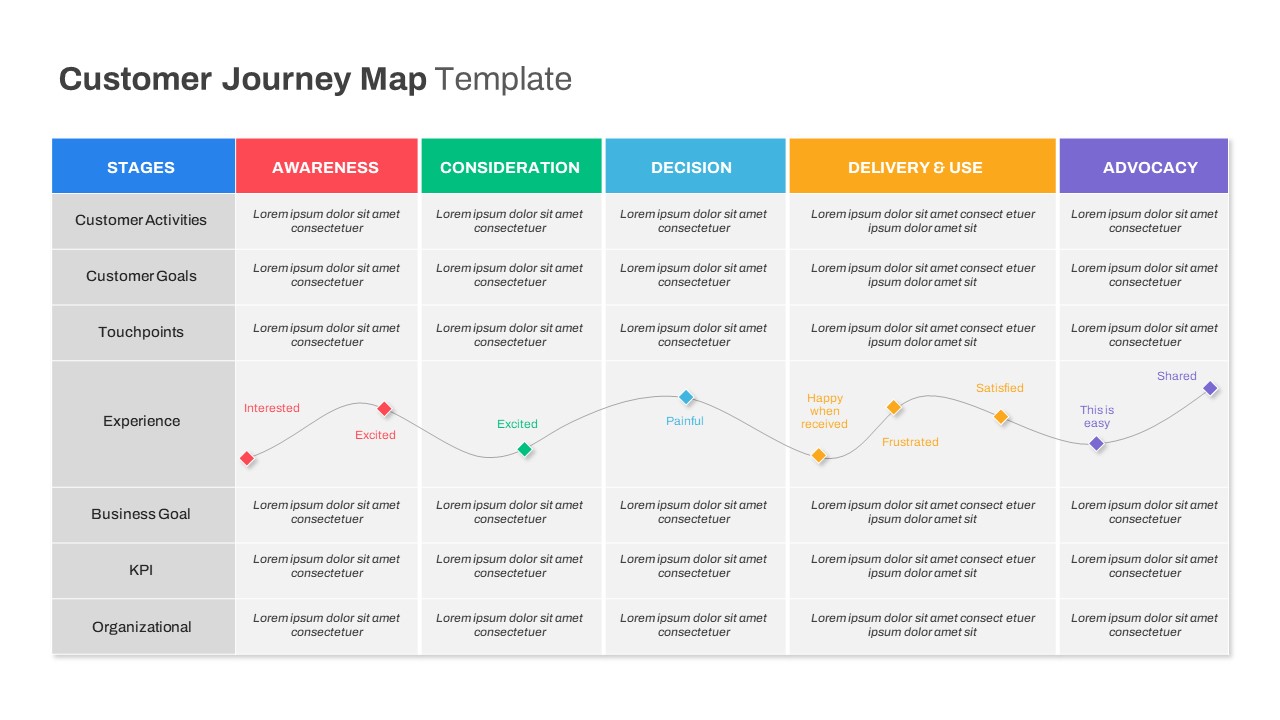
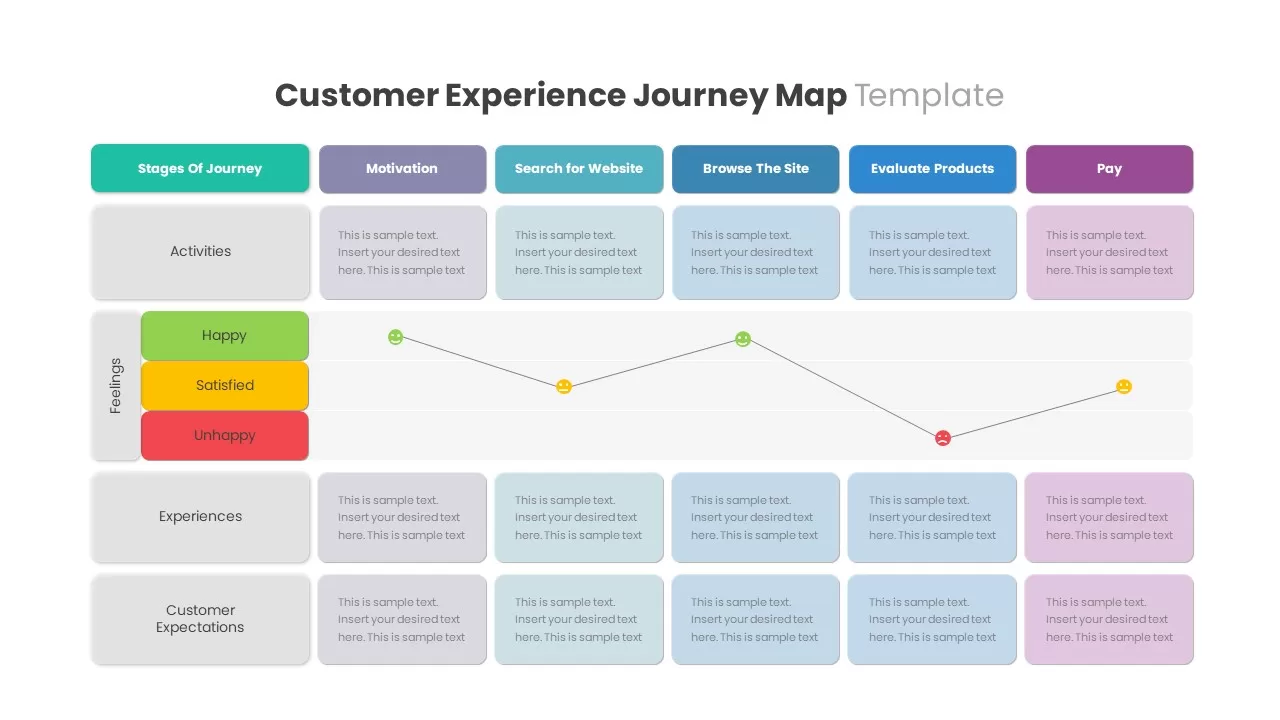
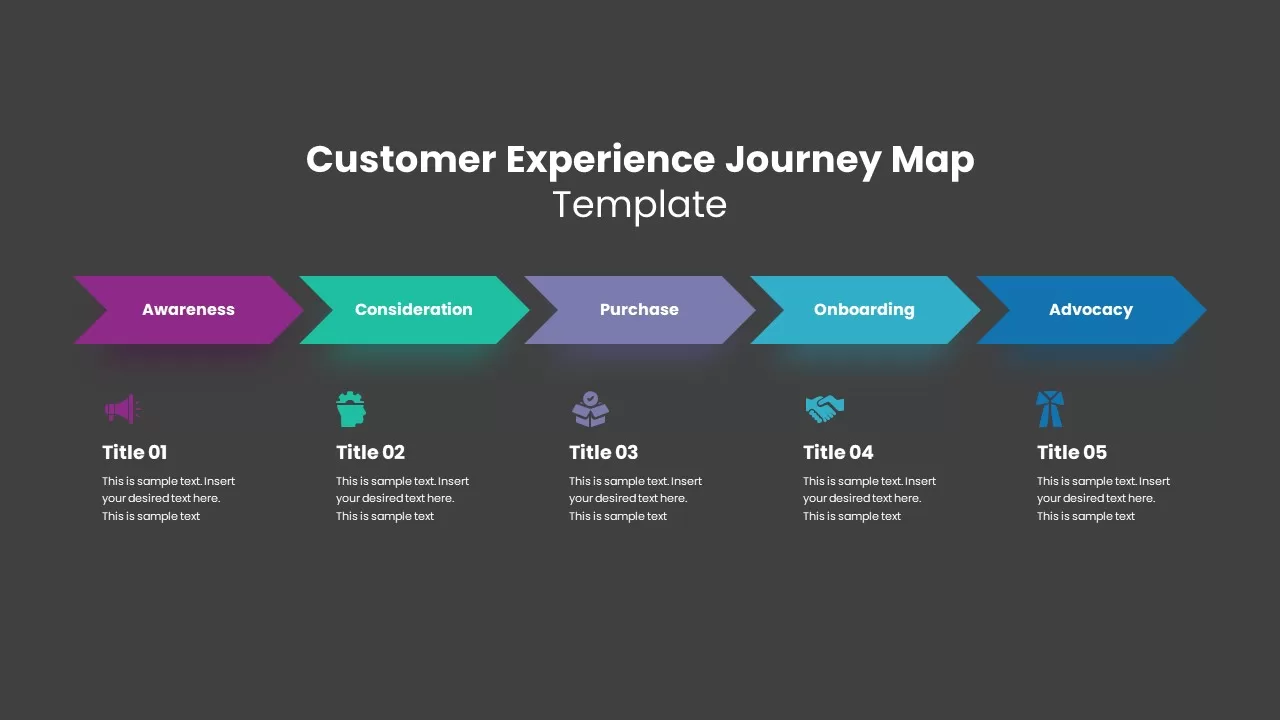
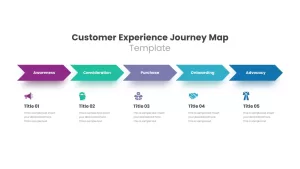
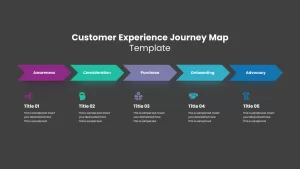
Next, the Linear Journey Map lays out five journey stages—Motivation, Search for Website, Browse the Site, Evaluate Products, and Pay—in a clear, horizontal flow. Dedicated rows capture Activities, Customer Feelings (with an overlaid sentiment line chart), Experiences, and Expectations, making it easy to visualize emotional highs and lows alongside key touchpoints.
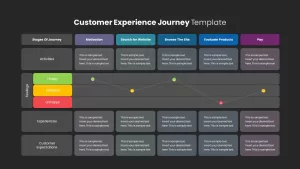
Finally, the Tabular Expectations Grid provides a quick snapshot of customer needs versus outcomes in a simple matrix, ideal for workshop exercises or summary reports.
All templates sit on master slides so you can instantly swap colors to match your brand, resize shapes, adjust sentiment icons, or duplicate segments for additional steps. Use entrance animations to reveal each phase sequentially, guiding your audience through the customer lifecycle with clarity. Whether you’re presenting market research findings, service-design workshops, or CX strategy proposals, this infographic pack streamlines slide creation and elevates your narrative with data-driven storytelling. Browse our Customer Experience Templates collection to discover professionally crafted slides that help you present customer journeys, engagement insights, and service strategies with confidence.
Who is it for
Customer-experience professionals, UX/UI designers, product managers, marketers, and consultants who need to map, analyze, and present customer journeys and experience phases in a visually engaging format.
Other Uses
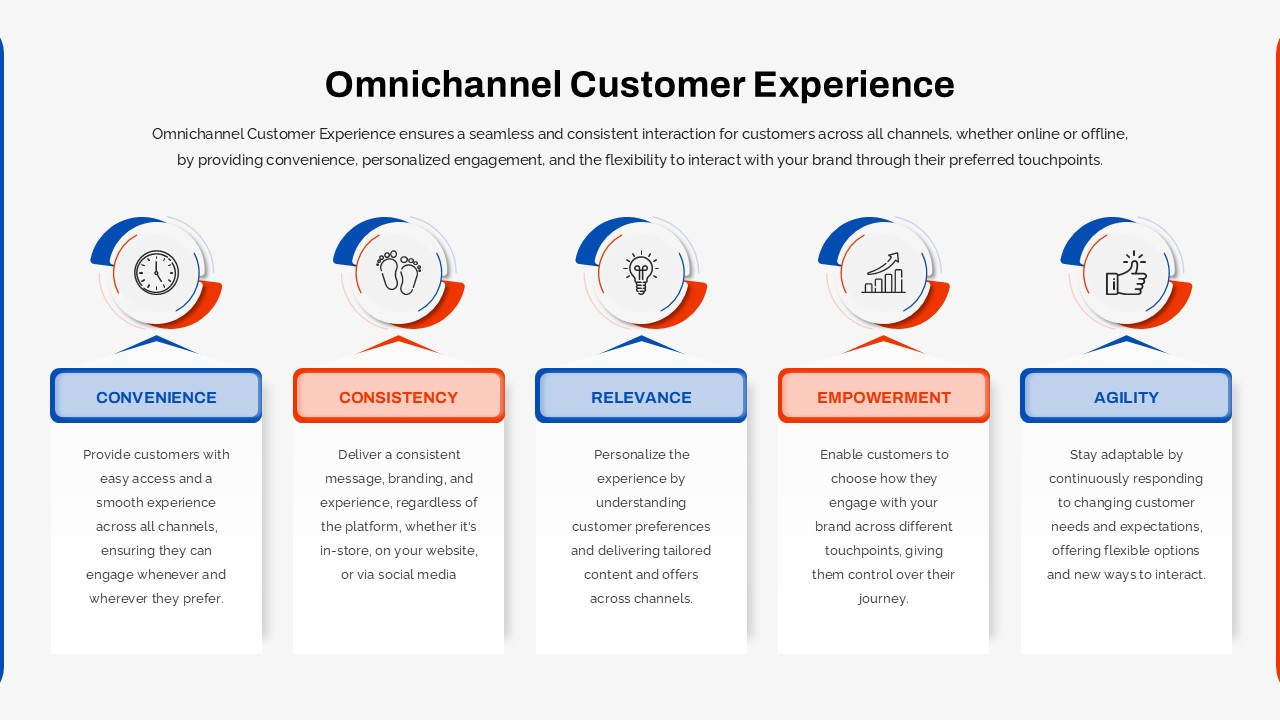
Repurpose these layouts as stakeholder-journey maps, employee-onboarding flows, service-blueprint overviews, or product lifecycle diagrams by relabeling phases and adjusting chart elements to suit any sequential process. You can also explore the Omnichannel Customer Experience Overview and Customer Experience Journey Infographics templates — two versatile slide decks that make it easy to convey multi-channel engagement and customer journey insights in a clear, visually engaging way.
Login to download this file

Item ID
SB03099
Related Templates

Customer Experience Journey Template for PowerPoint & Google Slides
Customer Journey
Customer Experience Journey Template for PowerPoint & Google Slides
Customer Journey
Customer Experience Journey Diagram Template for PowerPoint & Google Slides
Customer Journey
Customer Experience 4-Step Journey Template for PowerPoint & Google Slides
Customer Journey
Customer Journey Mountain Infographic Template for PowerPoint & Google Slides
Customer Journey
Customer Journey Process Map Infographic Template for PowerPoint & Google Slides
Customer Journey

Customer Experience Loyalty Deck for PowerPoint & Google Slides
Customer Experience
Omnichannel Customer Experience Overview Template for PowerPoint & Google Slides
Customer Journey
Customer Experience Loop Template for PowerPoint & Google Slides
Customer Experience
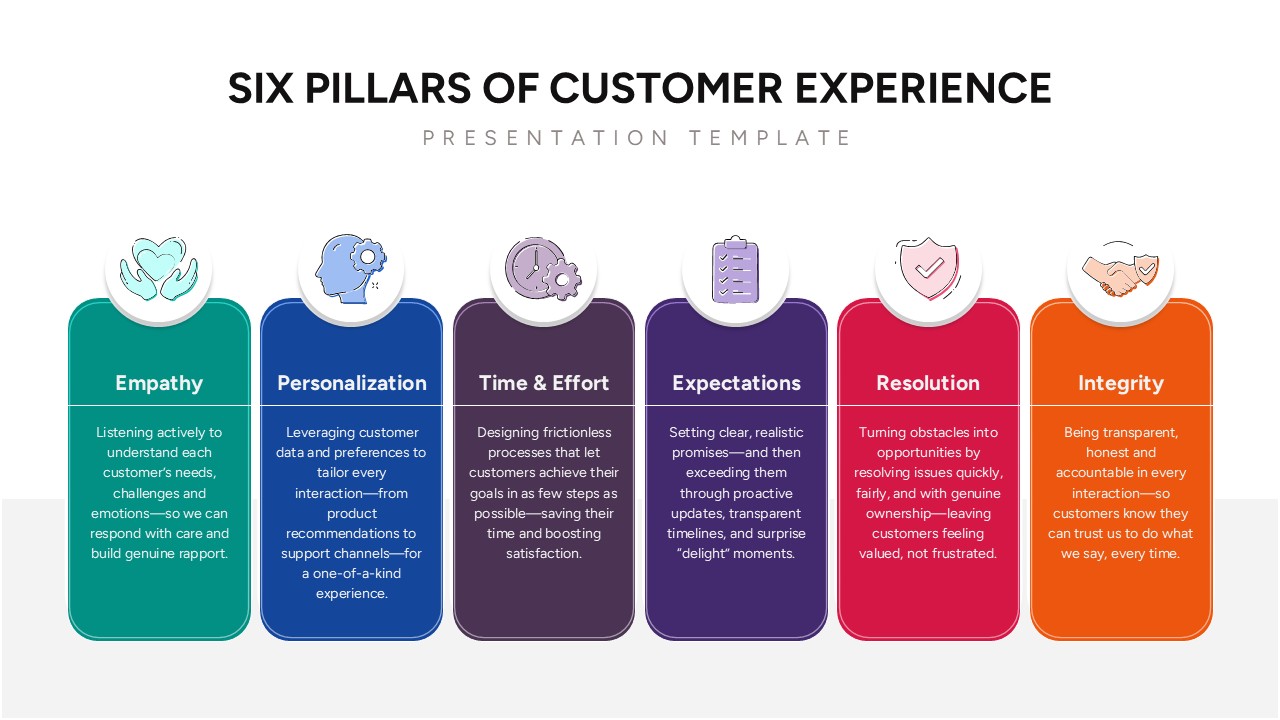
Pillars of Customer Experience Template for PowerPoint & Google Slides
Customer Experience
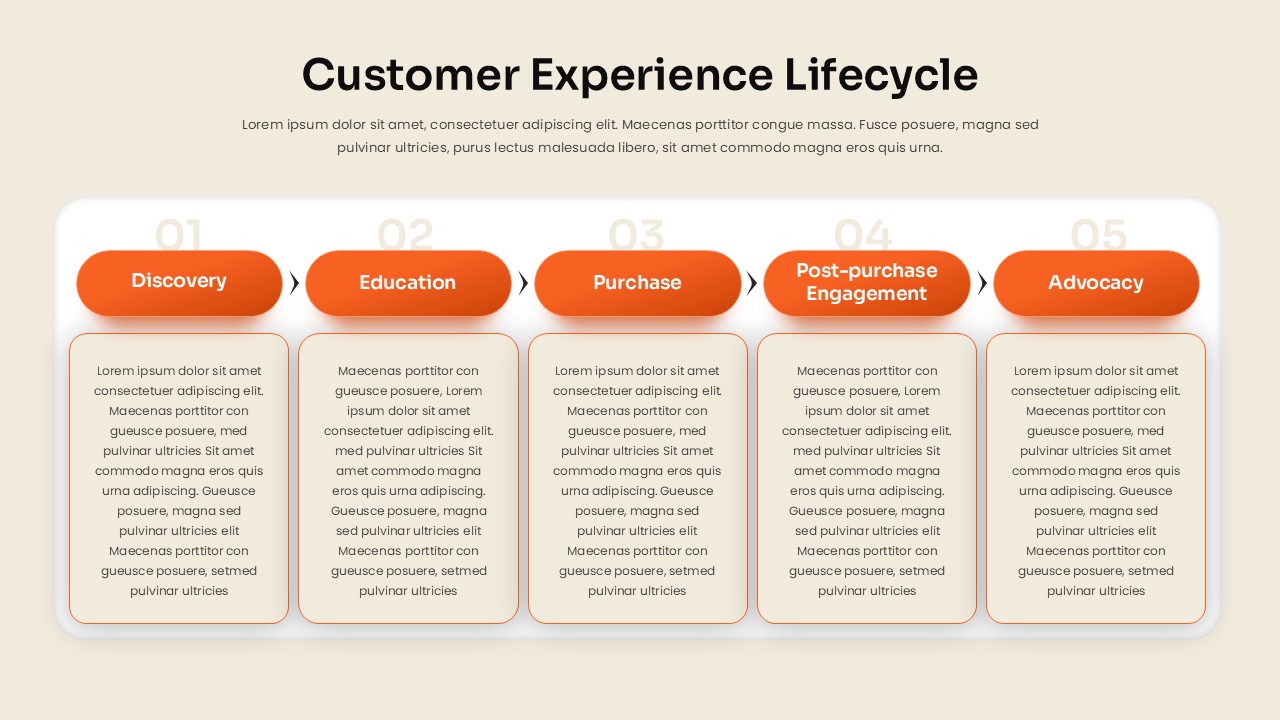
Customer Experience Lifecycle Template for PowerPoint & Google Slides
Customer Journey

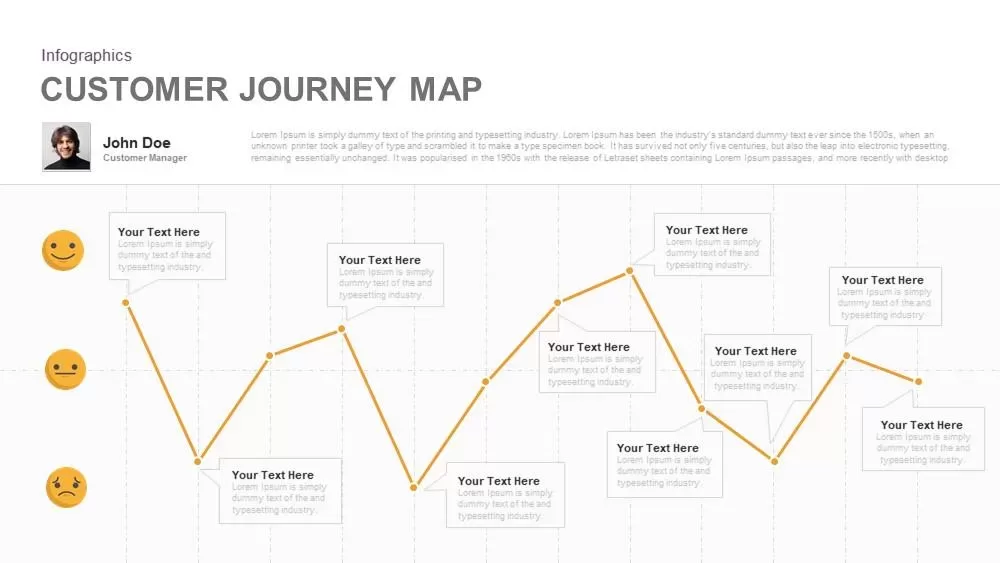
Emotional Customer Journey Map Template for PowerPoint & Google Slides
Customer Journey
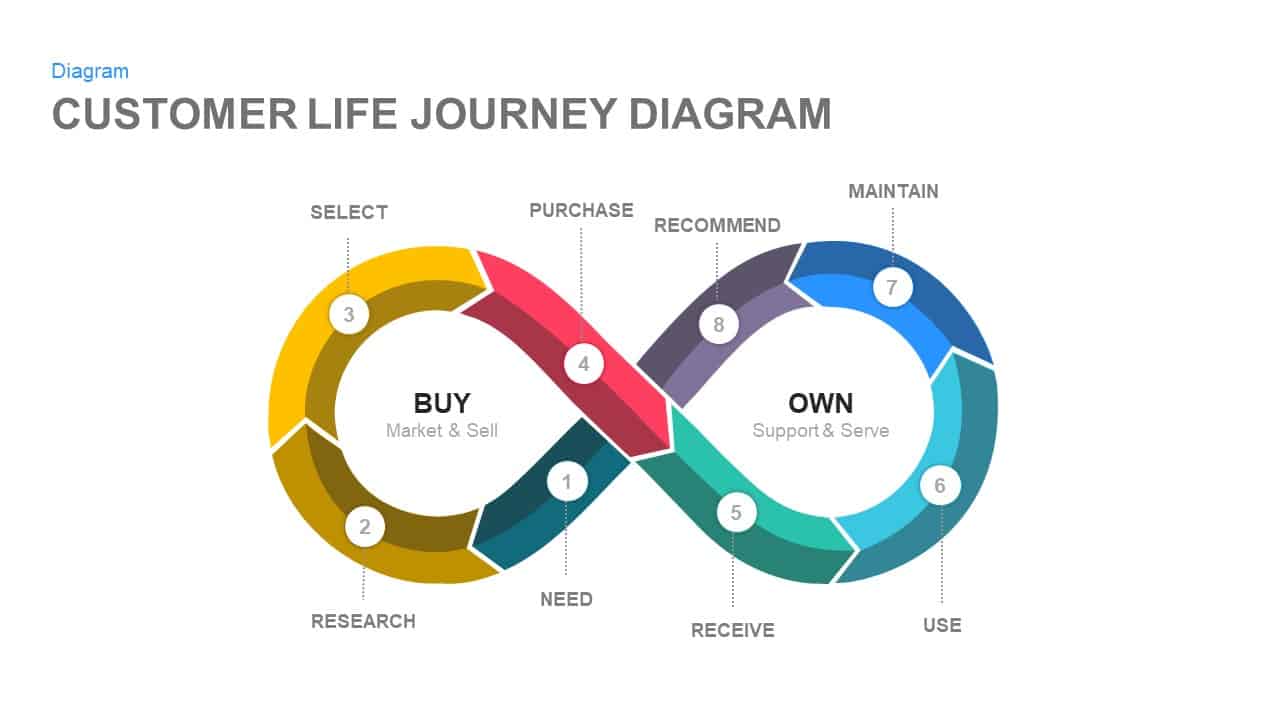
Customer Life Journey Infinity Diagram Template for PowerPoint & Google Slides
Customer Journey

Isometric Customer Journey Path Template for PowerPoint & Google Slides
Customer Journey
Customer Journey Activities Diagram Template for PowerPoint & Google Slides
Customer Journey
Versatile Customer Journey Map Template for PowerPoint & Google Slides
Customer Journey
Moment of Truth Customer Journey Process Template for PowerPoint & Google Slides
Timeline
Customer Touchpoints Journey & Hub Template for PowerPoint & Google Slides
Customer Journey
Comprehensive Customer Journey Map Template for PowerPoint & Google Slides
Customer Journey
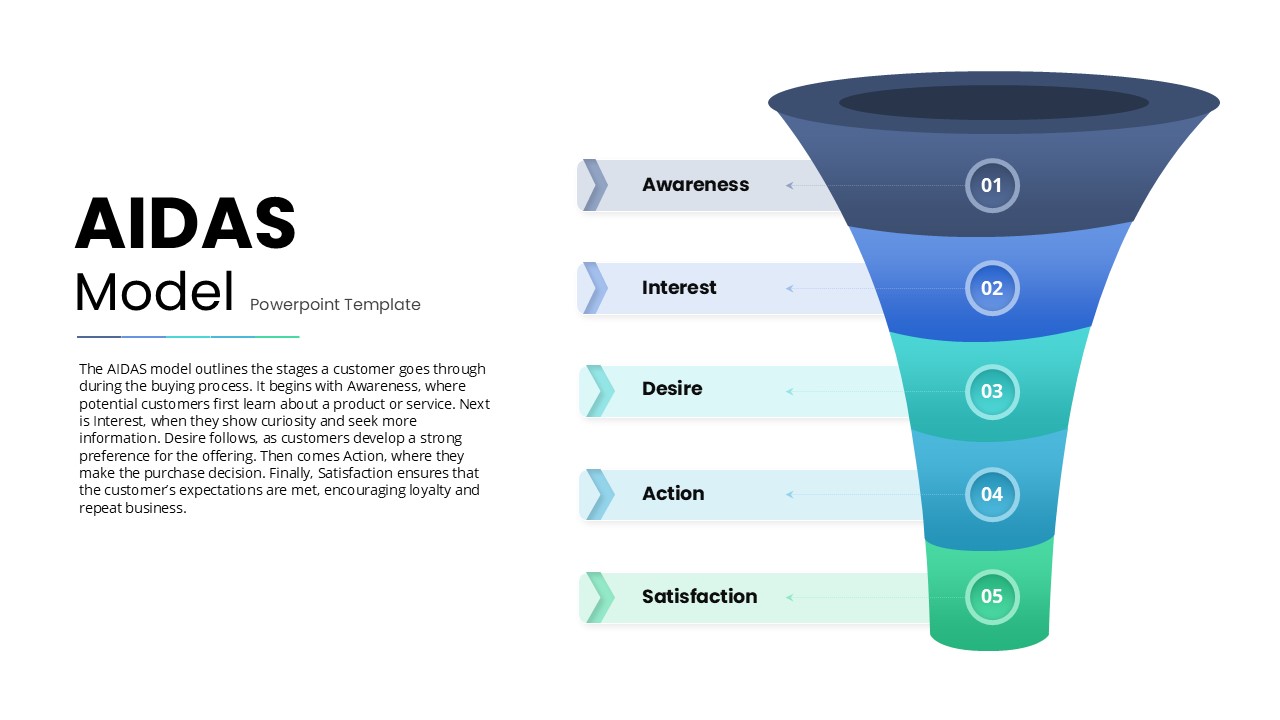
AIDAS Customer Journey Funnel Diagram Template for PowerPoint & Google Slides
Marketing Funnel
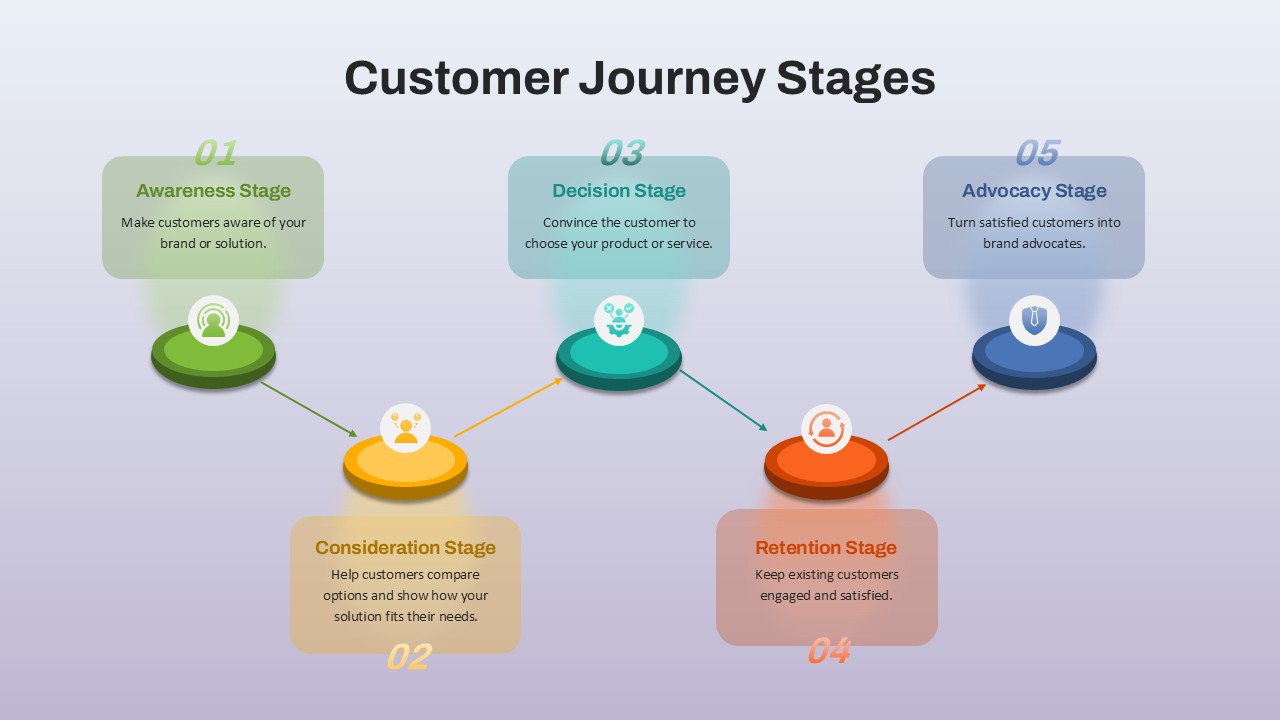
Customer Journey Stages template for PowerPoint & Google Slides
Business
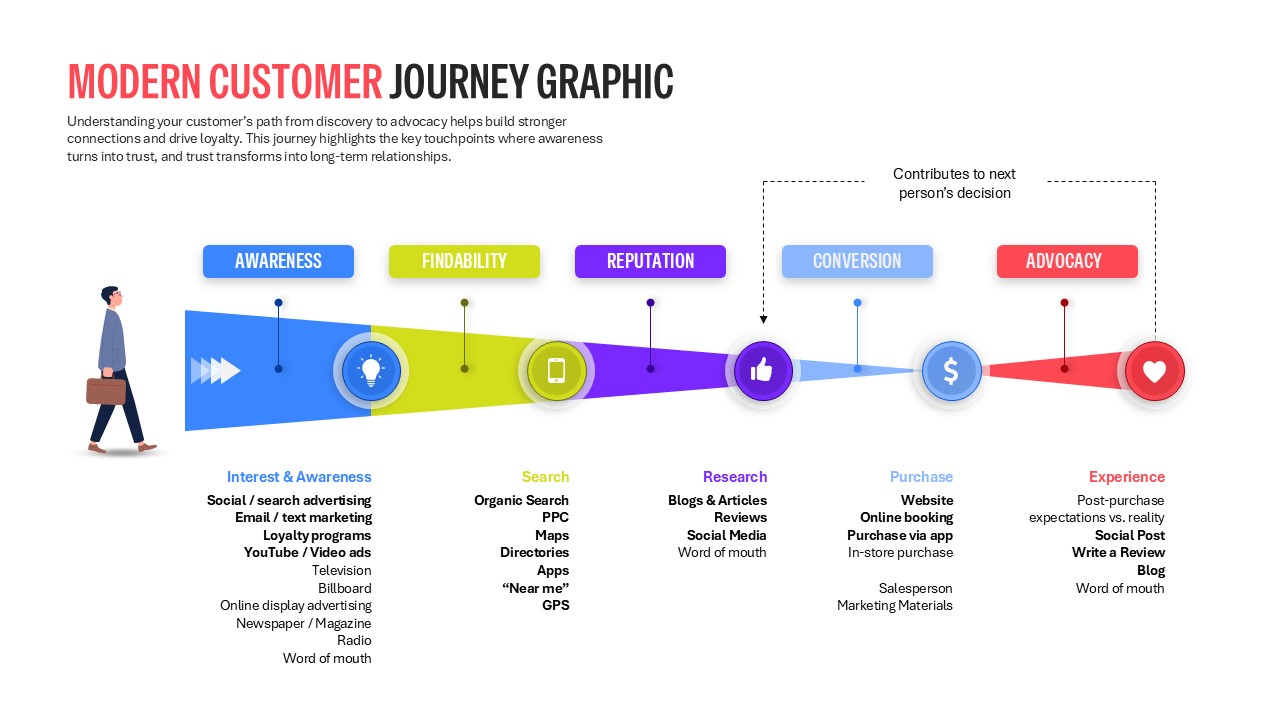
Modern Customer Journey Graphic Funnel Template for PowerPoint & Google Slides
Customer Journey
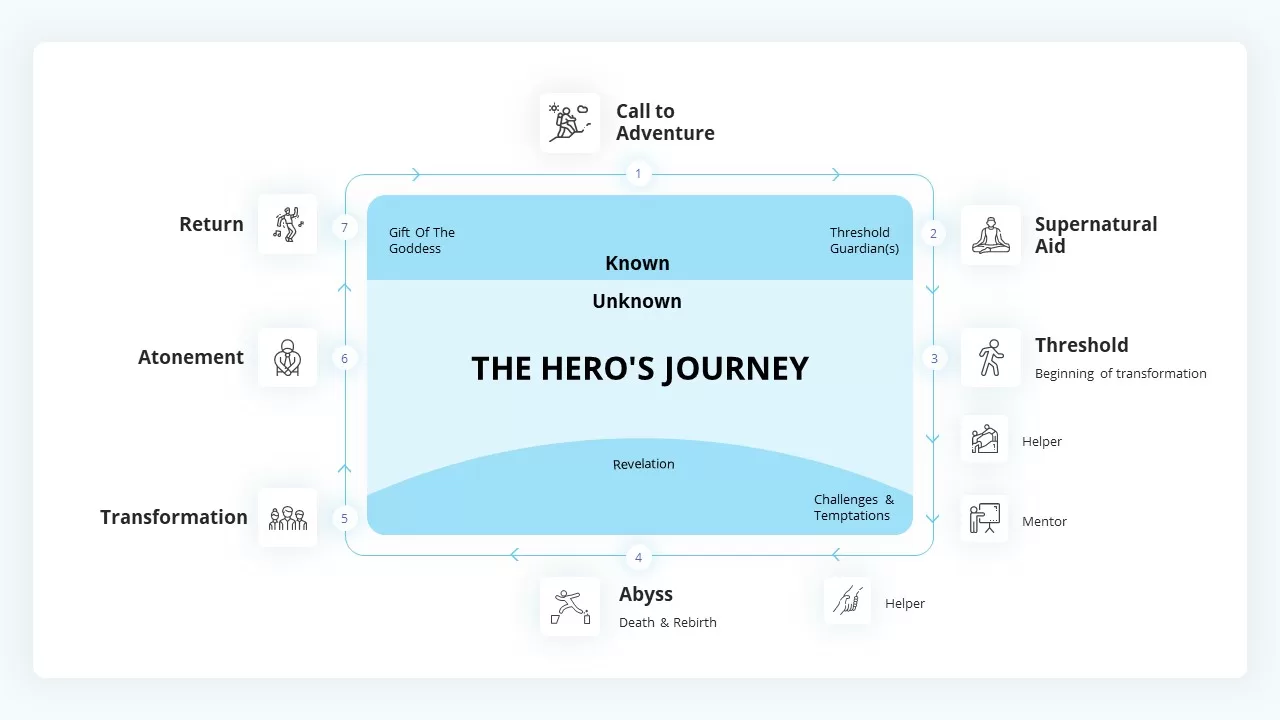
The Hero’s Journey Infographic Framework Template for PowerPoint & Google Slides
Customer Journey
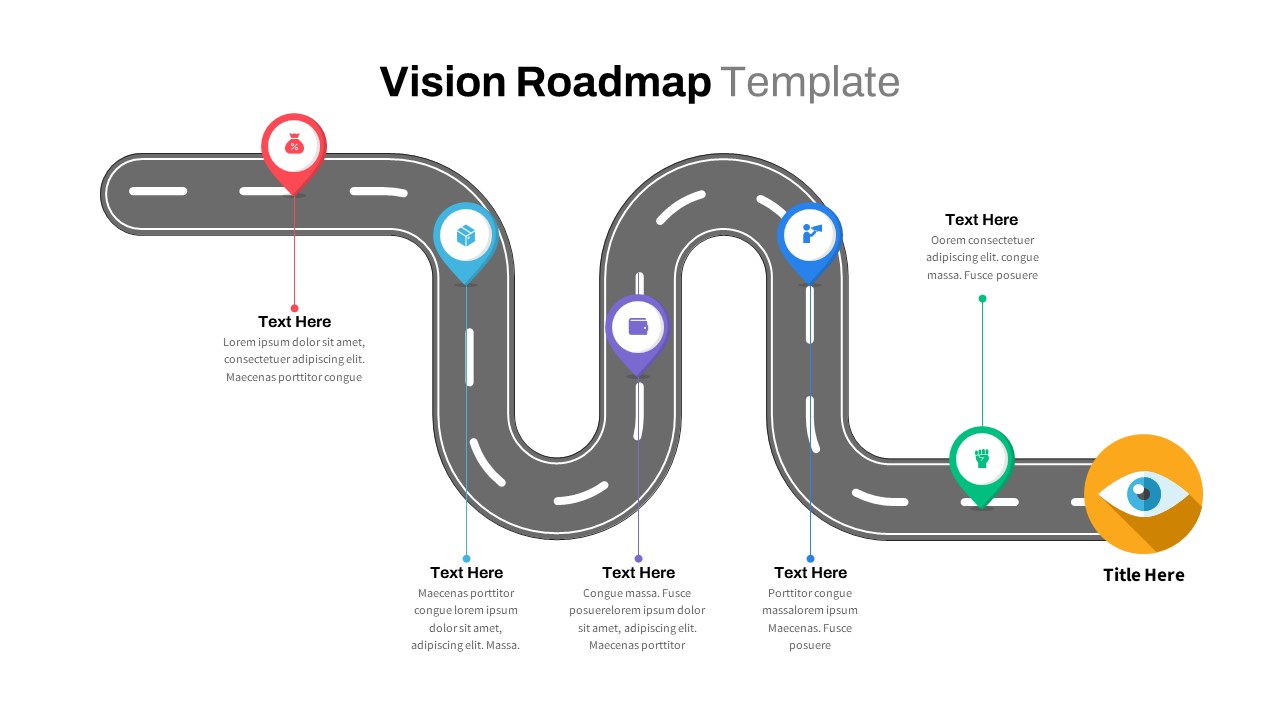
Curved Roadmap Infographic Vision Journey Template for PowerPoint & Google Slides
Business Strategy
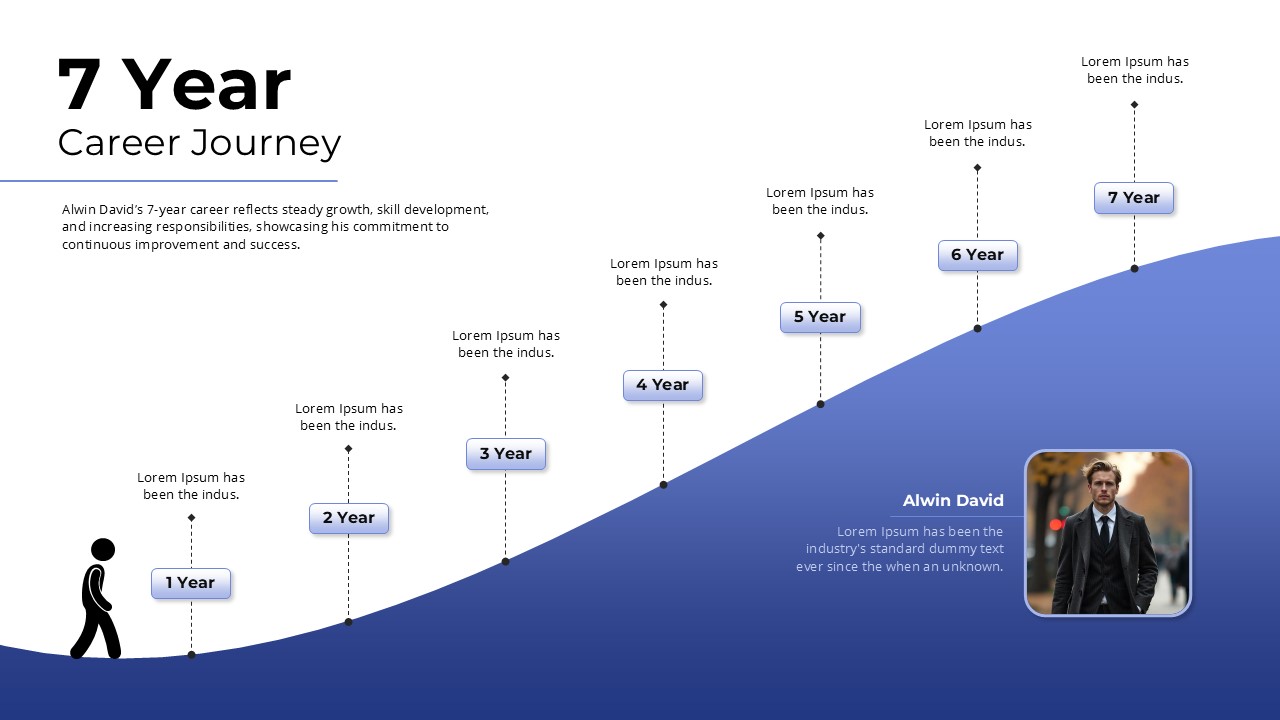
Career Journey Infographic Pack Template for PowerPoint & Google Slides
Timeline
Transformation Journey Infographic Template for PowerPoint & Google Slides
Process
Experience Curve Analysis Diagram Template for PowerPoint & Google Slides
Business Strategy
Experience Pyramid Hierarchy Diagram Template for PowerPoint & Google Slides
Pyramid
First-Day Experience Onboarding Schedule template for PowerPoint & Google Slides
Recruitment
Search Generative Experience template for PowerPoint & Google Slides
Digital Marketing
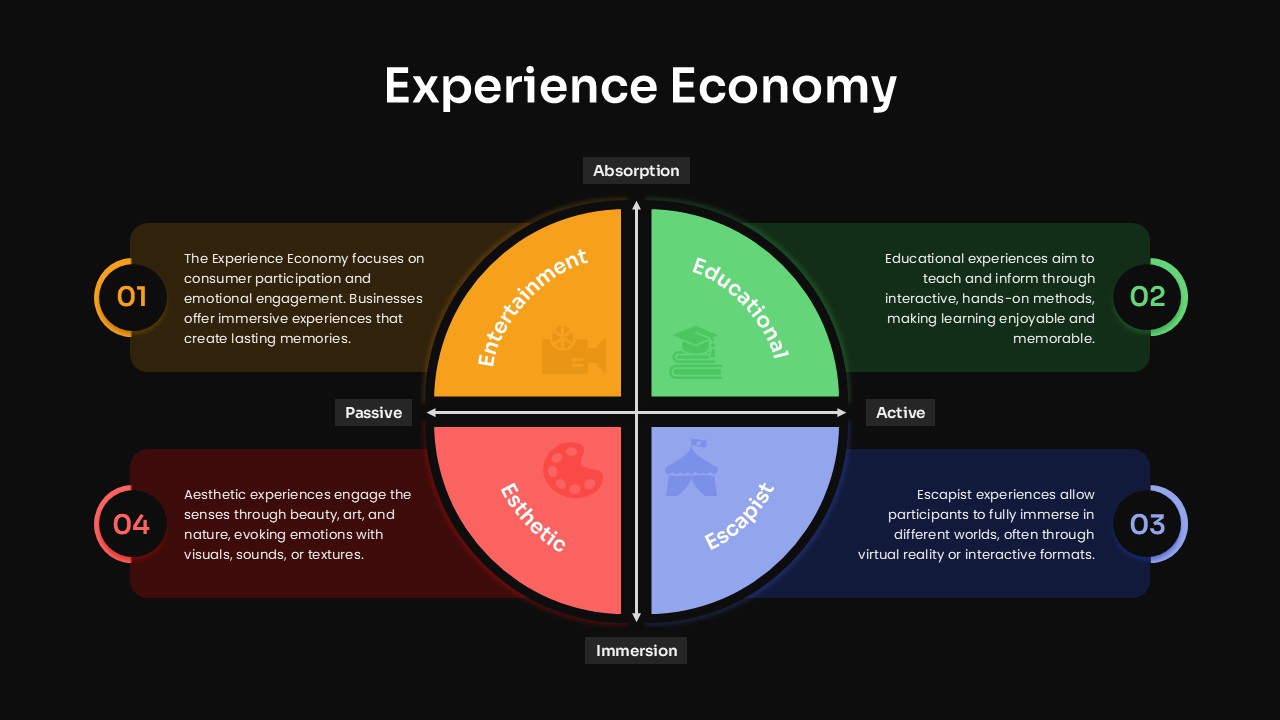
Experience Economy Quadrant Diagram Template for PowerPoint & Google Slides
Circular
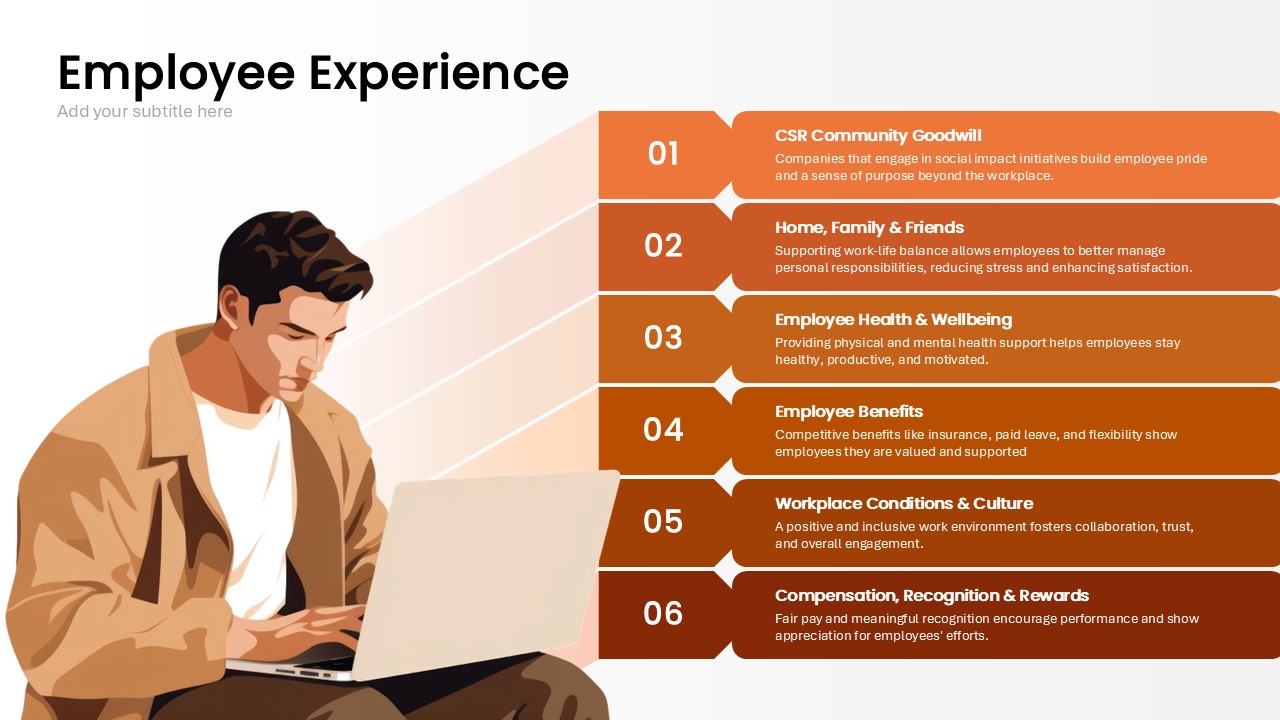
Employee Experience Template for PowerPoint & Google Slides
Employee Performance
Customer Feedback Infographic Slide Template for PowerPoint & Google Slides
Customer Experience
Customer Service Metaphor Infographic Template for PowerPoint & Google Slides
Customer Experience

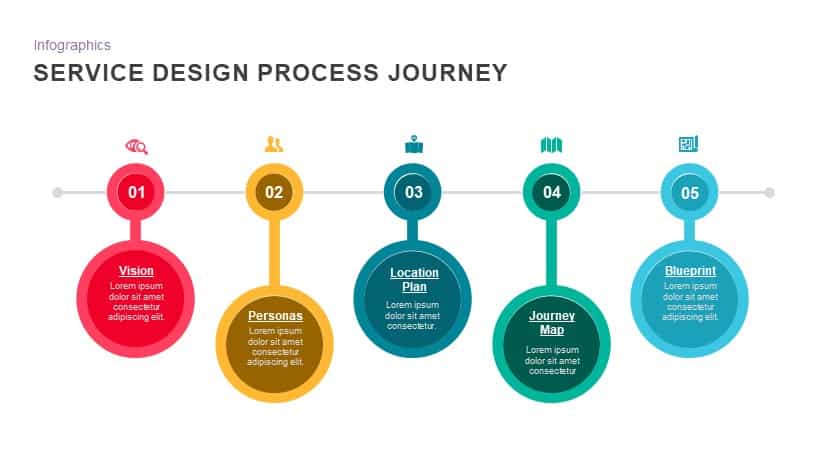
Service Design Process Journey template for PowerPoint & Google Slides
Process
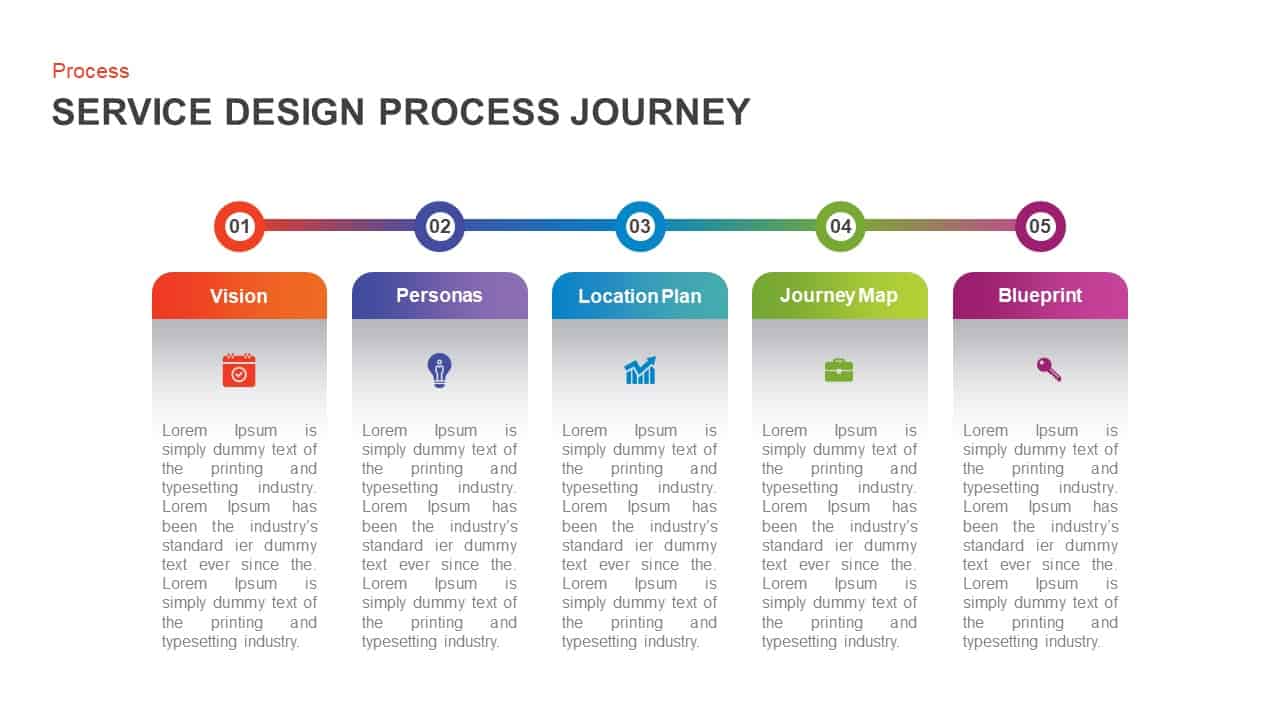
Service Design Process Journey Template for PowerPoint & Google Slides
Process
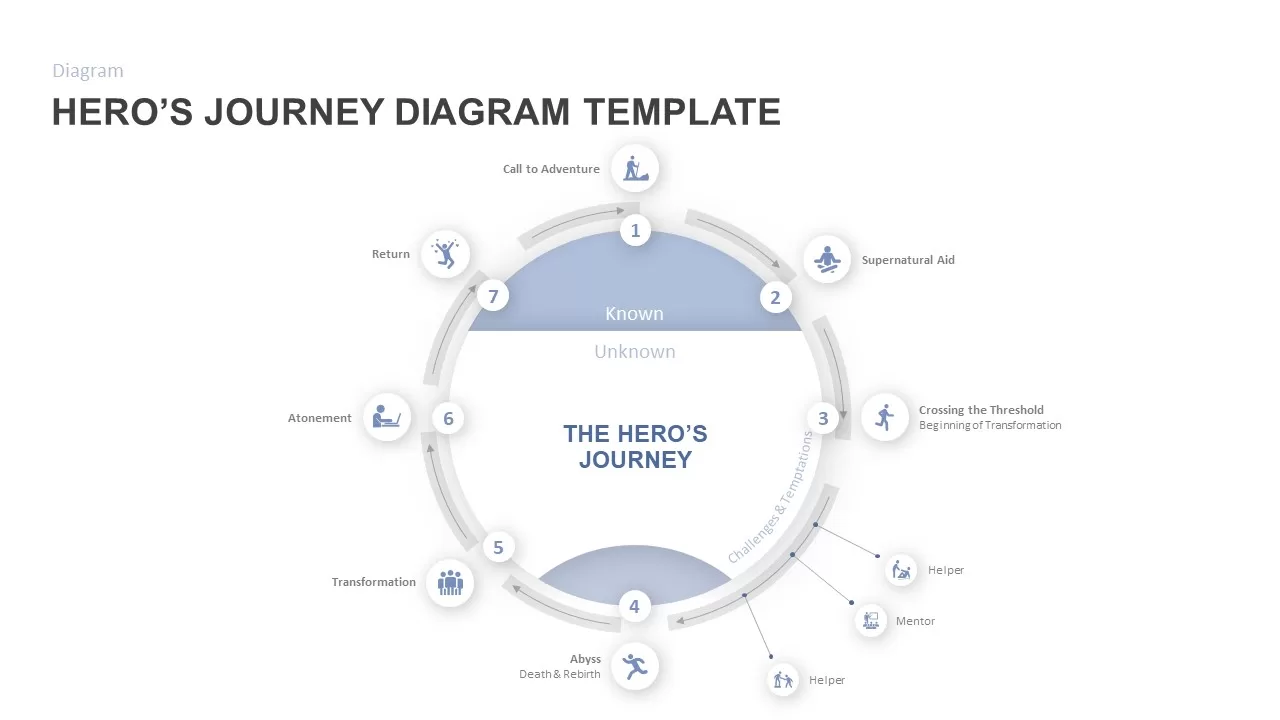
Hero’s Journey Diagram Template for PowerPoint & Google Slides
Customer Journey
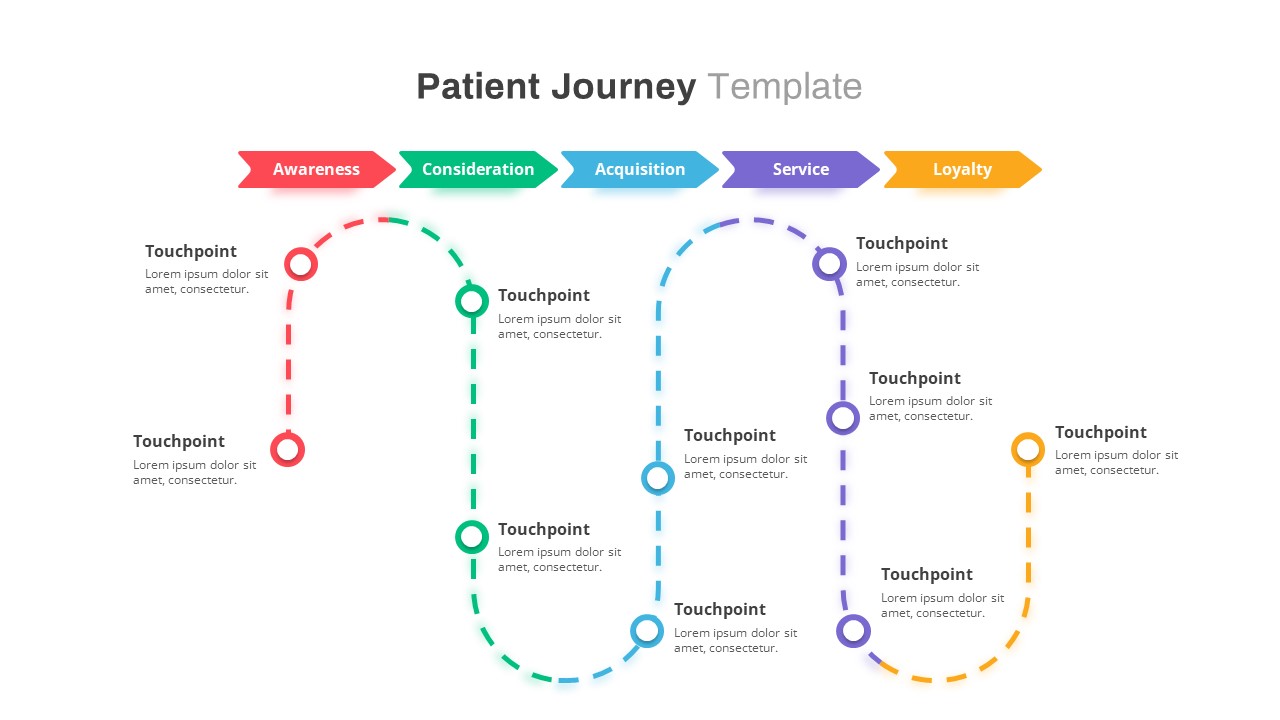
Healthcare Patient Journey Map Overview Template for PowerPoint & Google Slides
Health
Free Journey Slide with Four Icons Diagram Template for PowerPoint & Google Slides
Process
Free
Consumer Decision Journey Radial Diagram Template for PowerPoint & Google Slides
Circular
Fully Editable Career Journey Roadmap Template for PowerPoint & Google Slides
Customer Journey
Free
Five-Segment Pentagon Digital Journey Template for PowerPoint & Google Slides
Process
Modern Business Journey Roadmap Template for PowerPoint & Google Slides
Roadmap
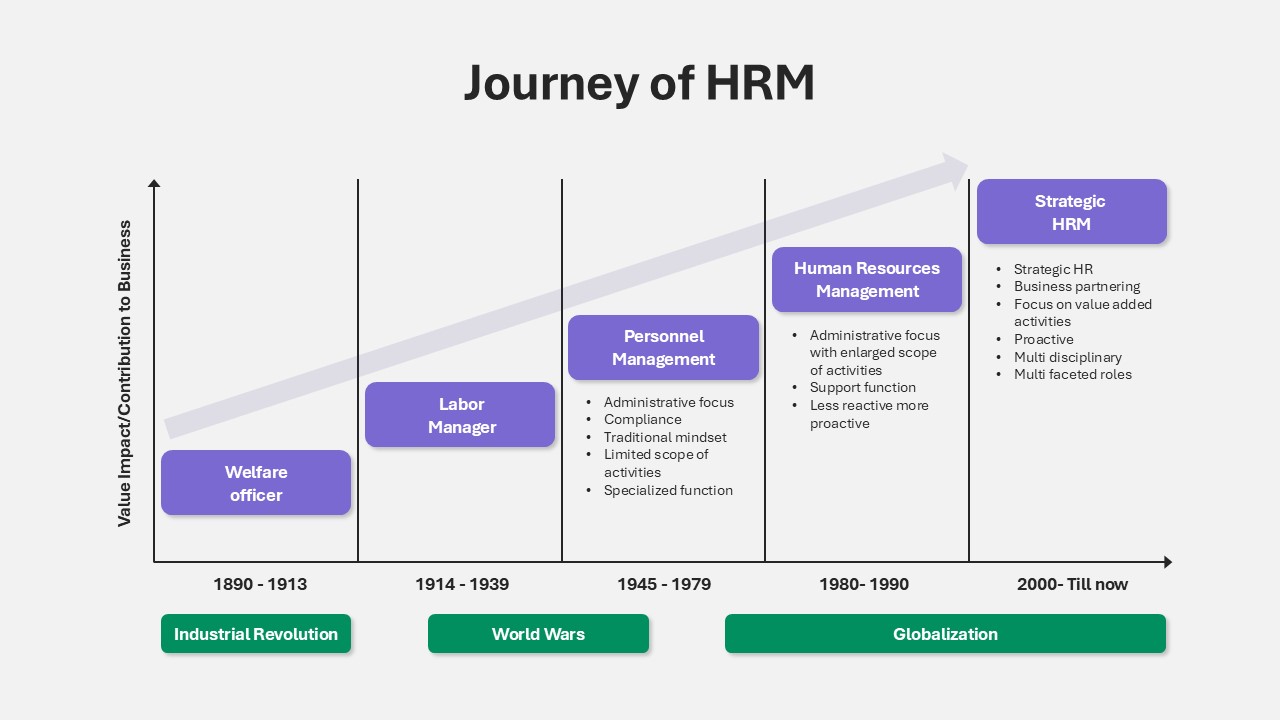
Journey of HRM Timeline Evolution Template for PowerPoint & Google Slides
HR
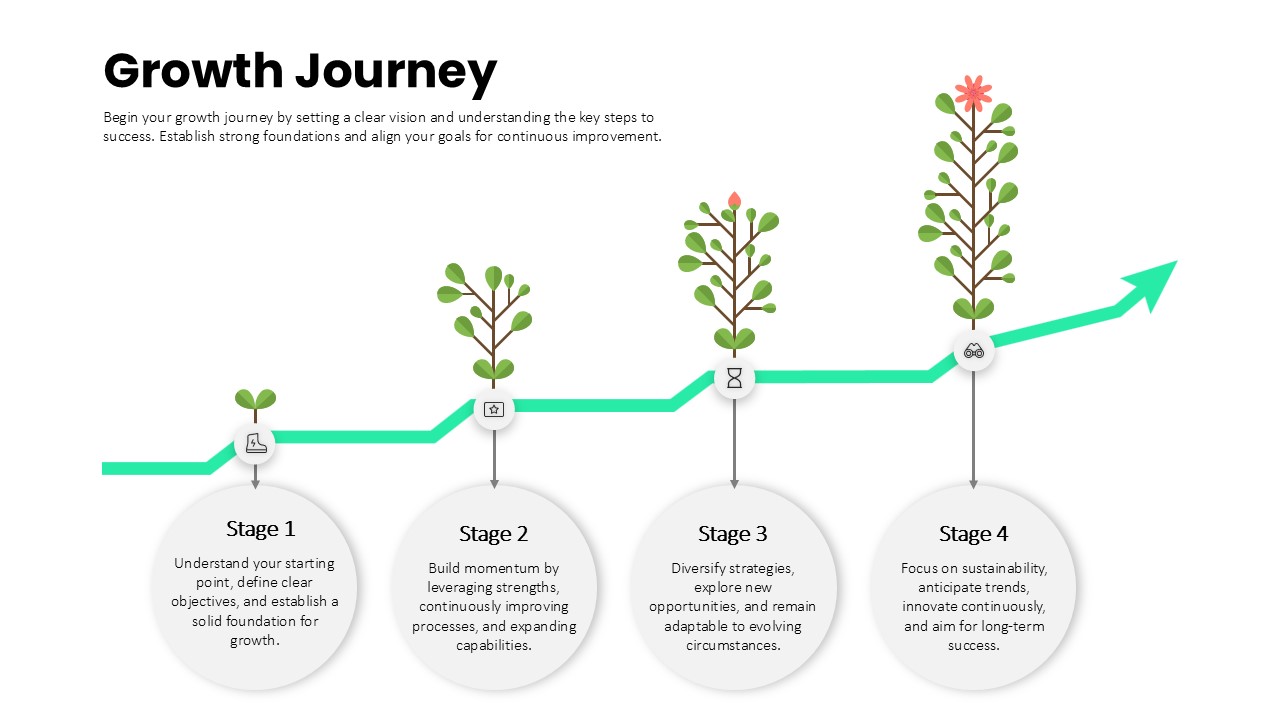
Growth Journey Stages Process template for PowerPoint & Google Slides
Business Strategy
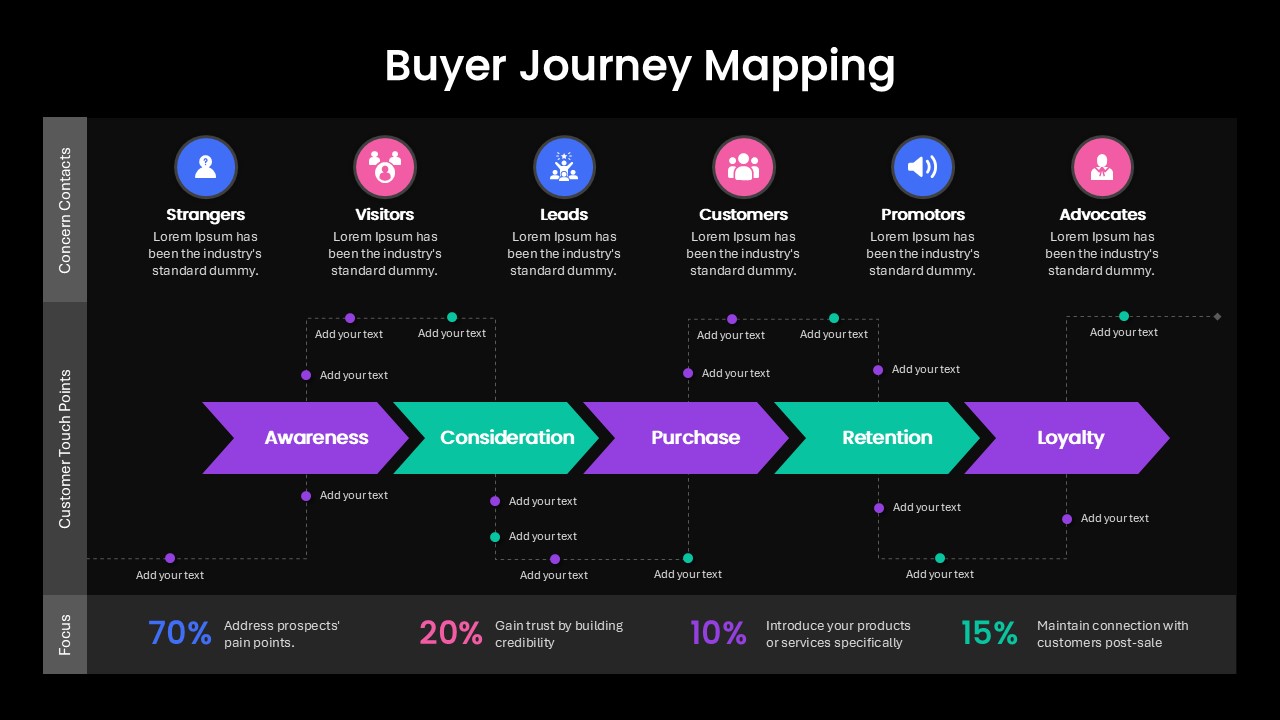
Buyer Journey Mapping Process Diagram Template for PowerPoint & Google Slides
Process
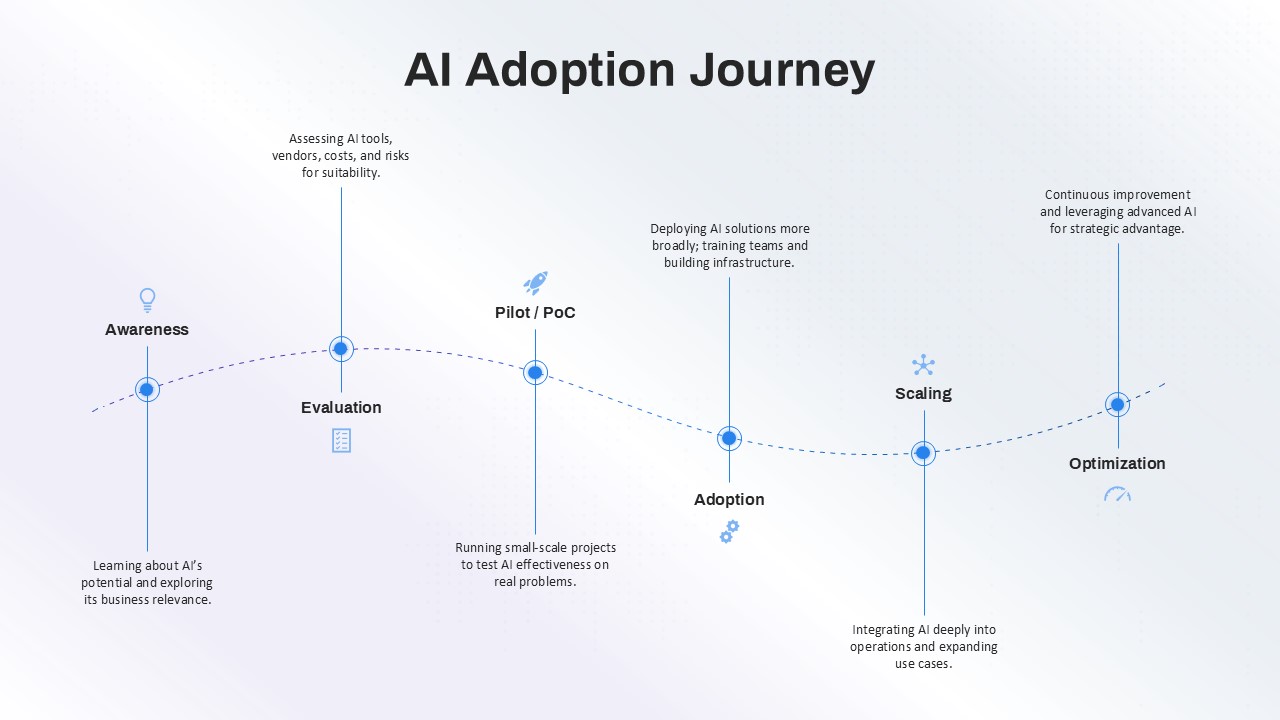
AI Adoption Journey template for PowerPoint & Google Slides
AI
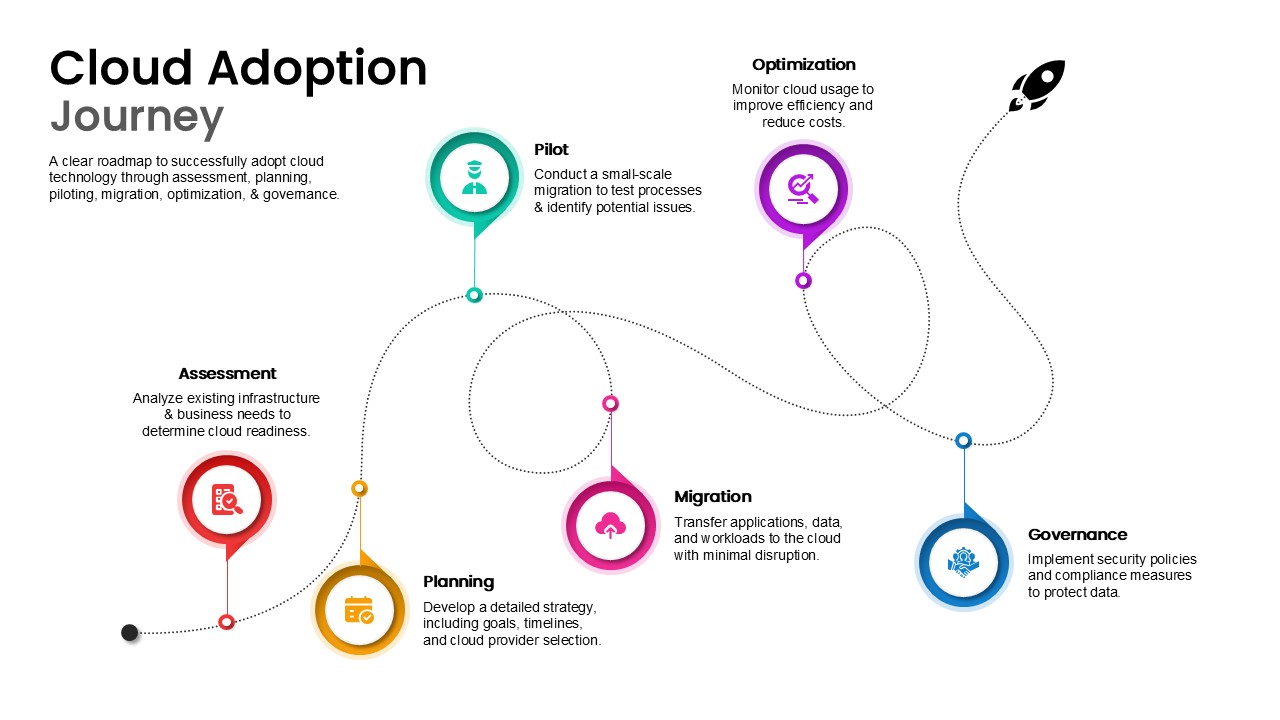
Cloud Adoption Journey Roadmap Template for PowerPoint & Google Slides
Cloud Computing
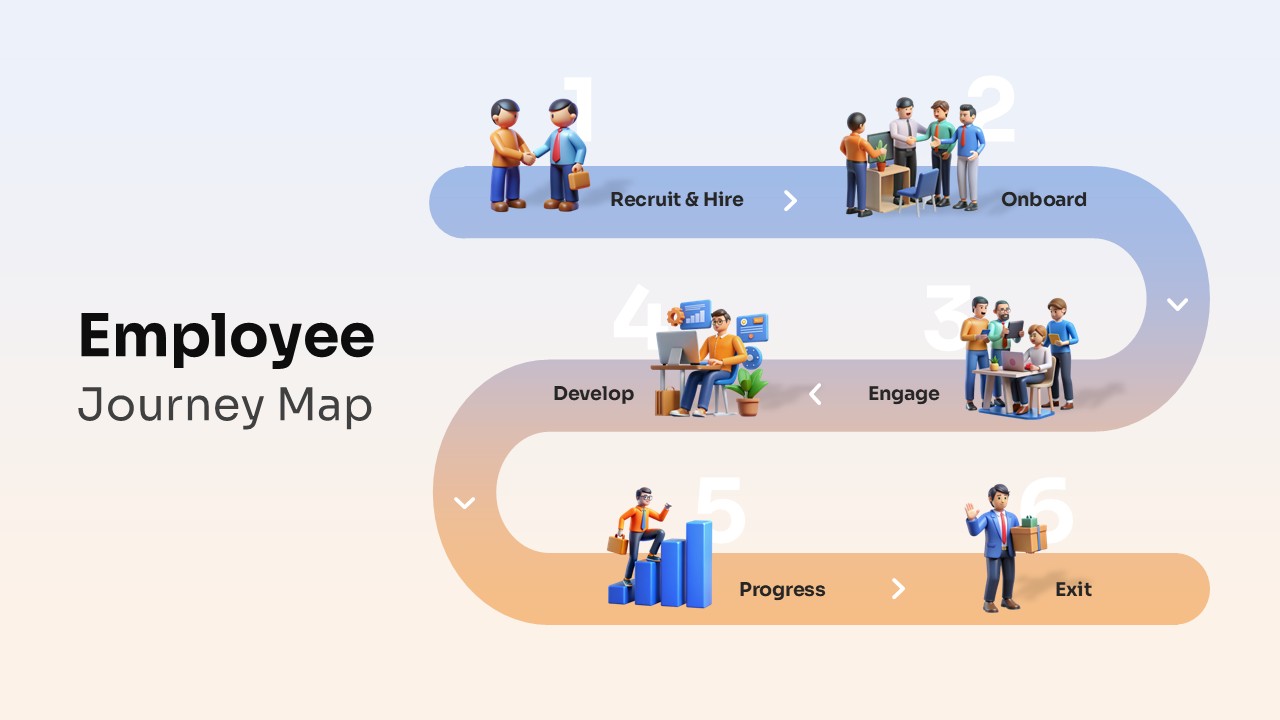
Employee Journey Map with Stages template for PowerPoint & Google Slides
Recruitment
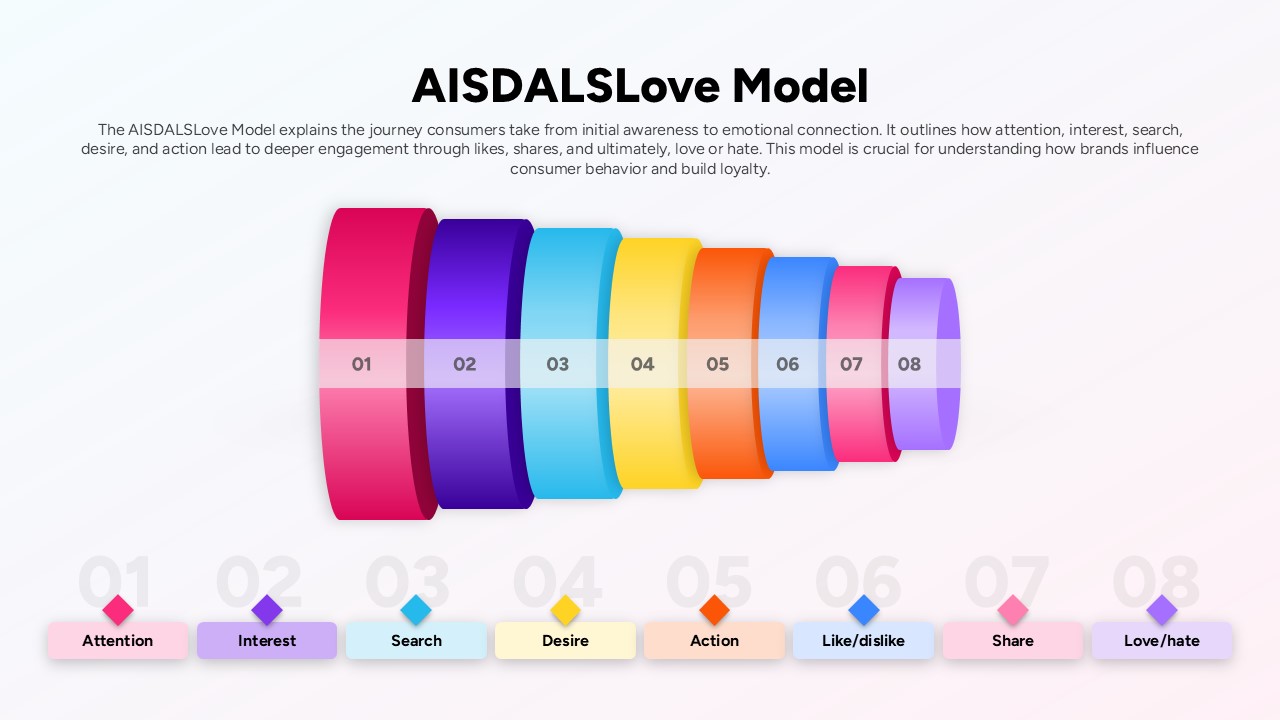
AISDALSLove Consumer Journey Model Slide Template for PowerPoint & Google Slides
Customer Journey
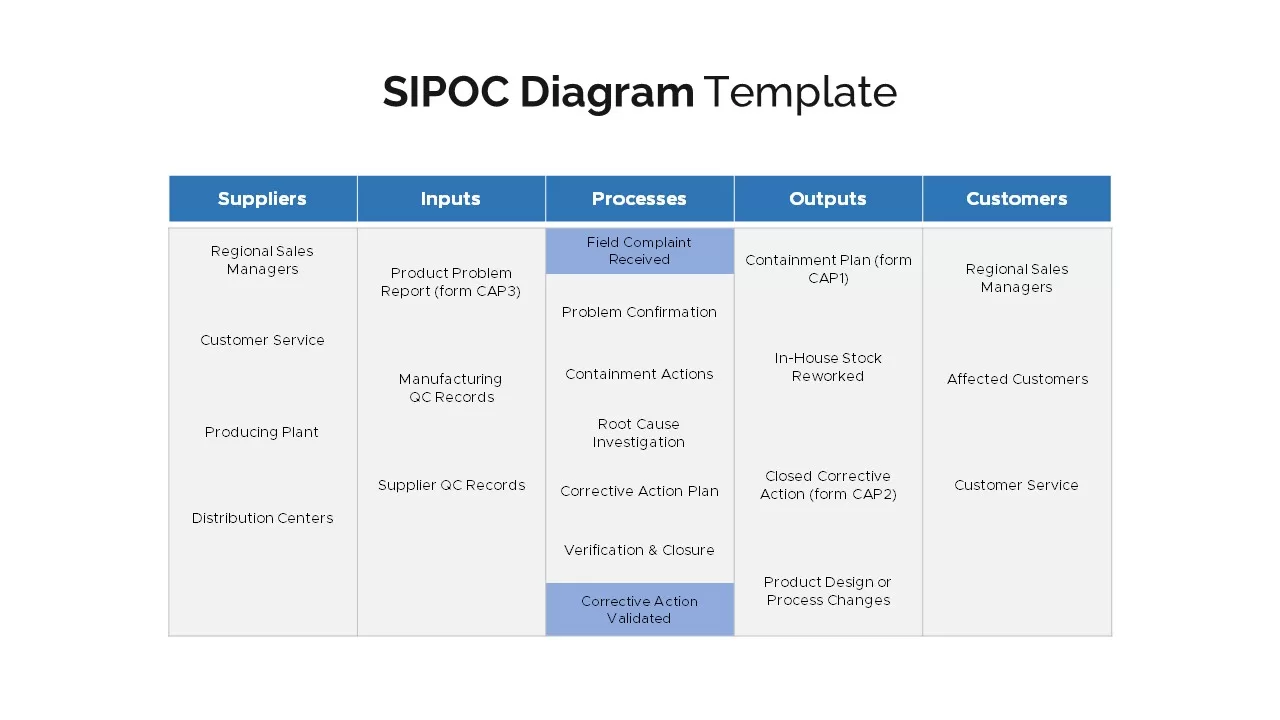
Four SIPOC Diagram Infographic Templates for PowerPoint & Google Slides
Business Plan
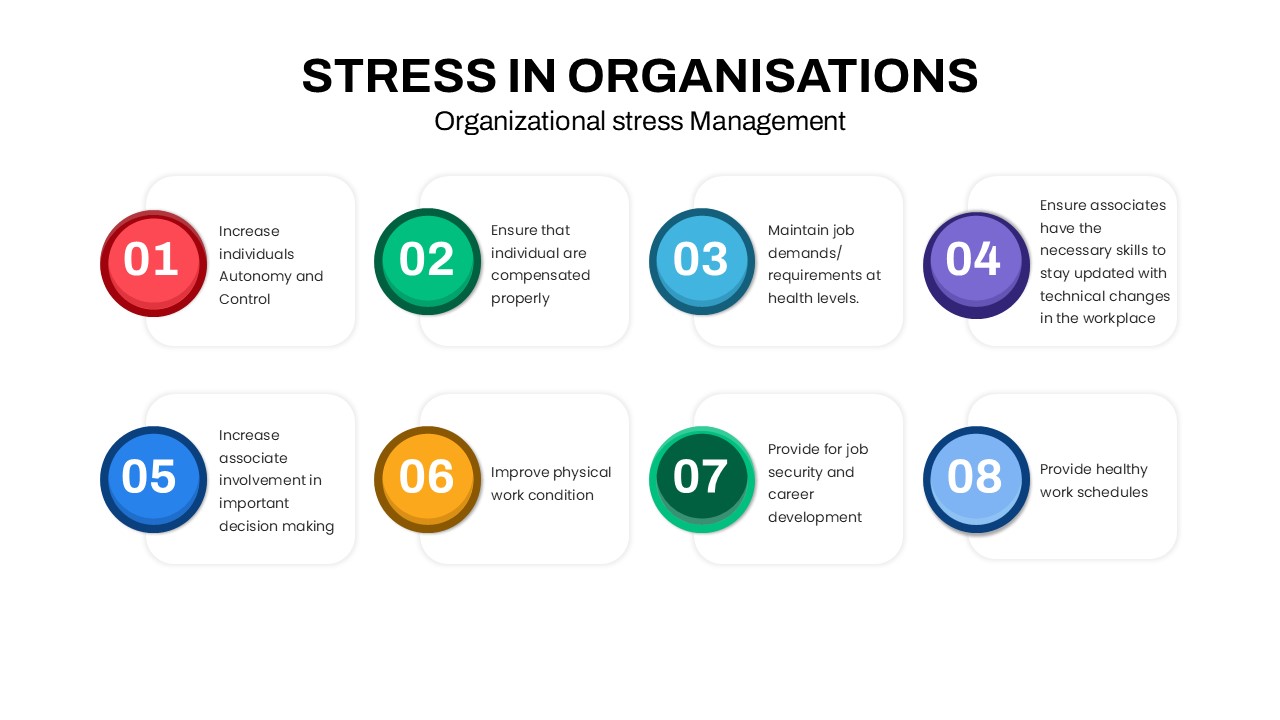
Stress in Organisations Infographic Templates for PowerPoint & Google Slides
Process
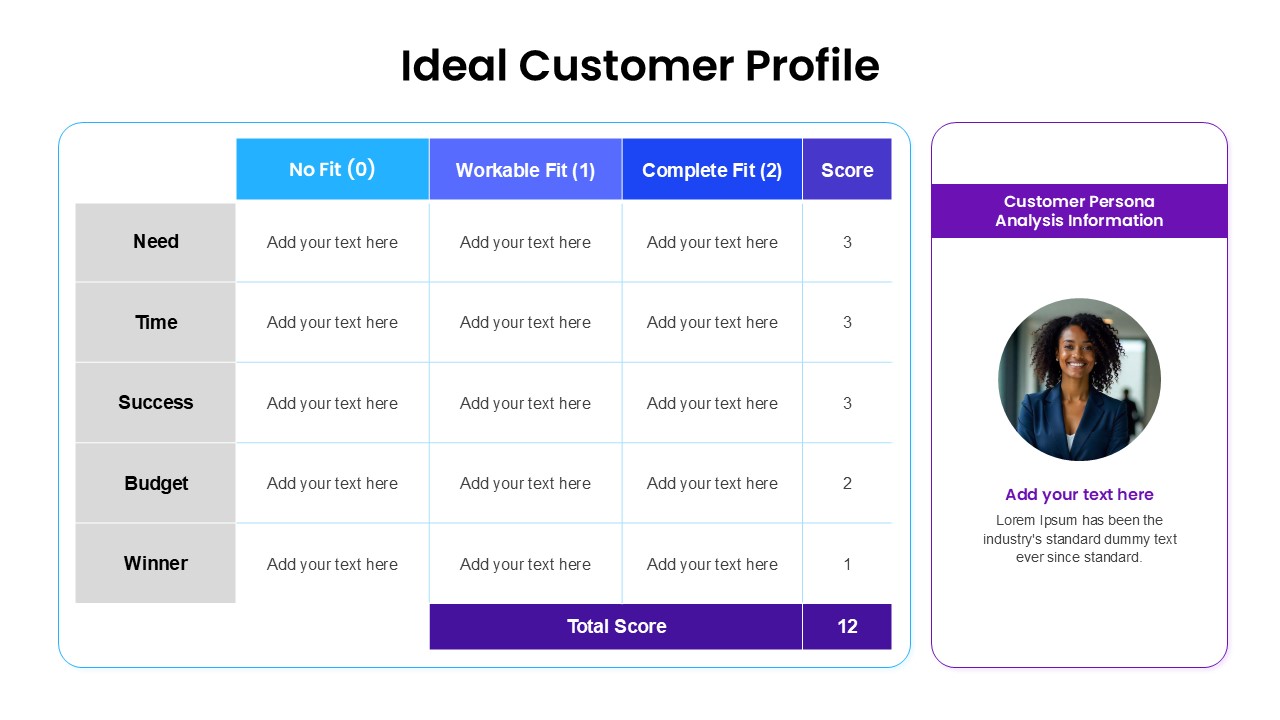
Ideal Customer Profile PowerPoint Template for PowerPoint & Google Slides
Business Strategy

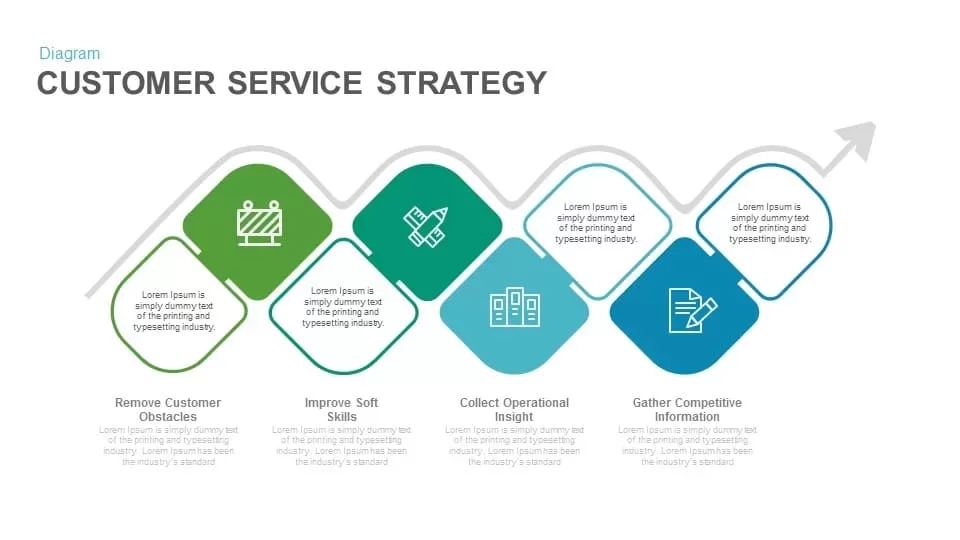
Customer Service Strategy template for PowerPoint & Google Slides
Business Strategy
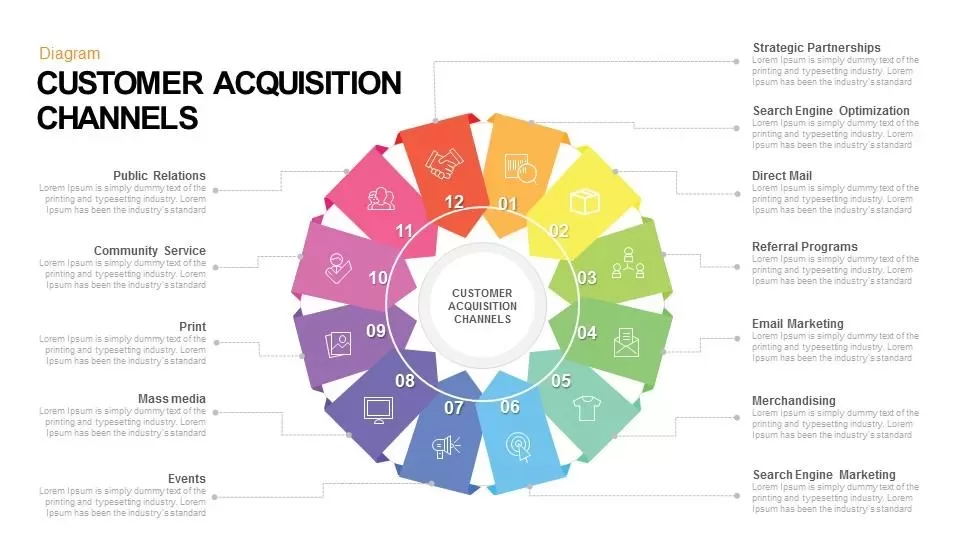
Customer Acquisition Channels Diagram for PowerPoint & Google Slides
Business Strategy
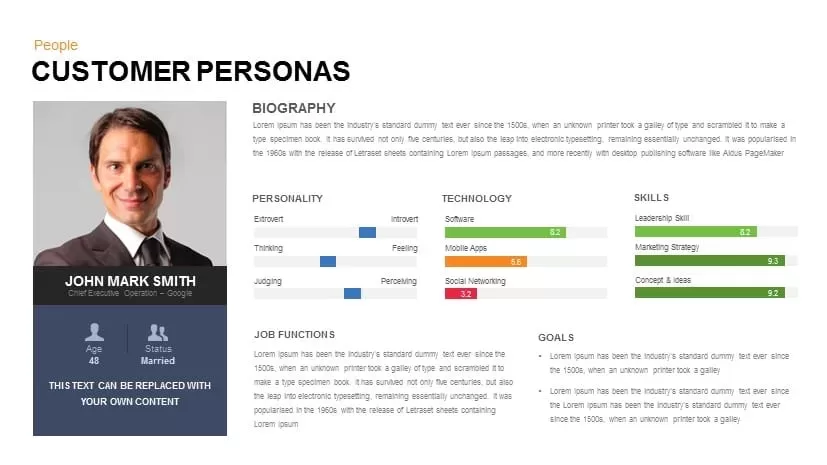
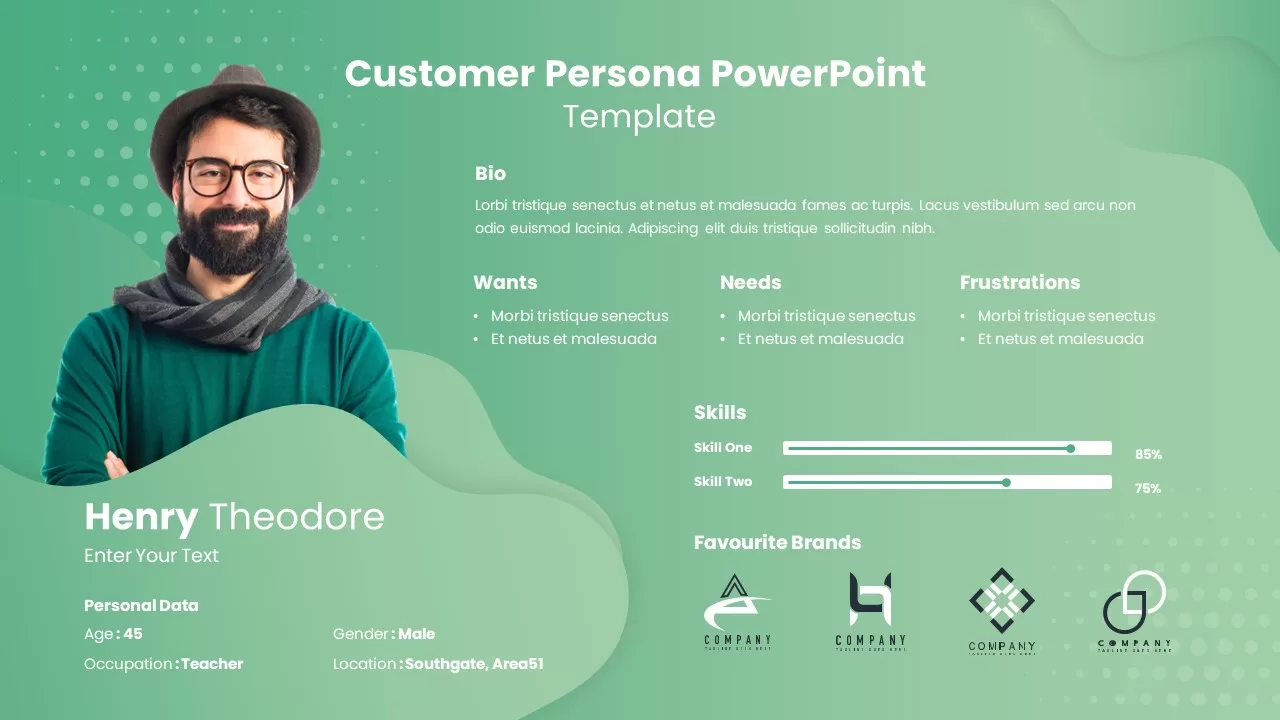
Customer Persona Template for PowerPoint & Google Slides
Customer Journey
Modern Customer Acquisition Strategy Template for PowerPoint & Google Slides
Customer Journey
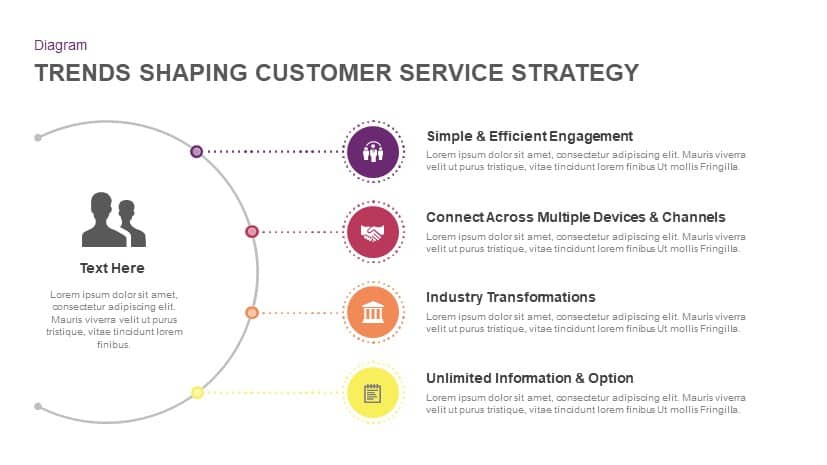
Trends Shaping Customer Service Strategy template for PowerPoint & Google Slides
Marketing
Customer Value Proposition Diagram Template for PowerPoint & Google Slides
Circular
Customer Acquisition Framework Template for PowerPoint & Google Slides
Funnel
Customer Complaints Escalation Pyramid Template for PowerPoint & Google Slides
Infographics
Customer Loyalty Lifecycle Process Template for PowerPoint & Google Slides
Process
Customer-Centric Hub and Spoke Diagram Template for PowerPoint & Google Slides
Customer Experience
Customer Acquisition Strategy Diagram Template for PowerPoint & Google Slides
Customer Journey
Voice of Customer Overview template for PowerPoint & Google Slides
Customer Journey
RFM Customer Segmentation Template for PowerPoint & Google Slides
Business Models
Customer Persona Profile template for PowerPoint & Google Slides
Marketing
Customer Persona template for PowerPoint & Google Slides
Customer Journey
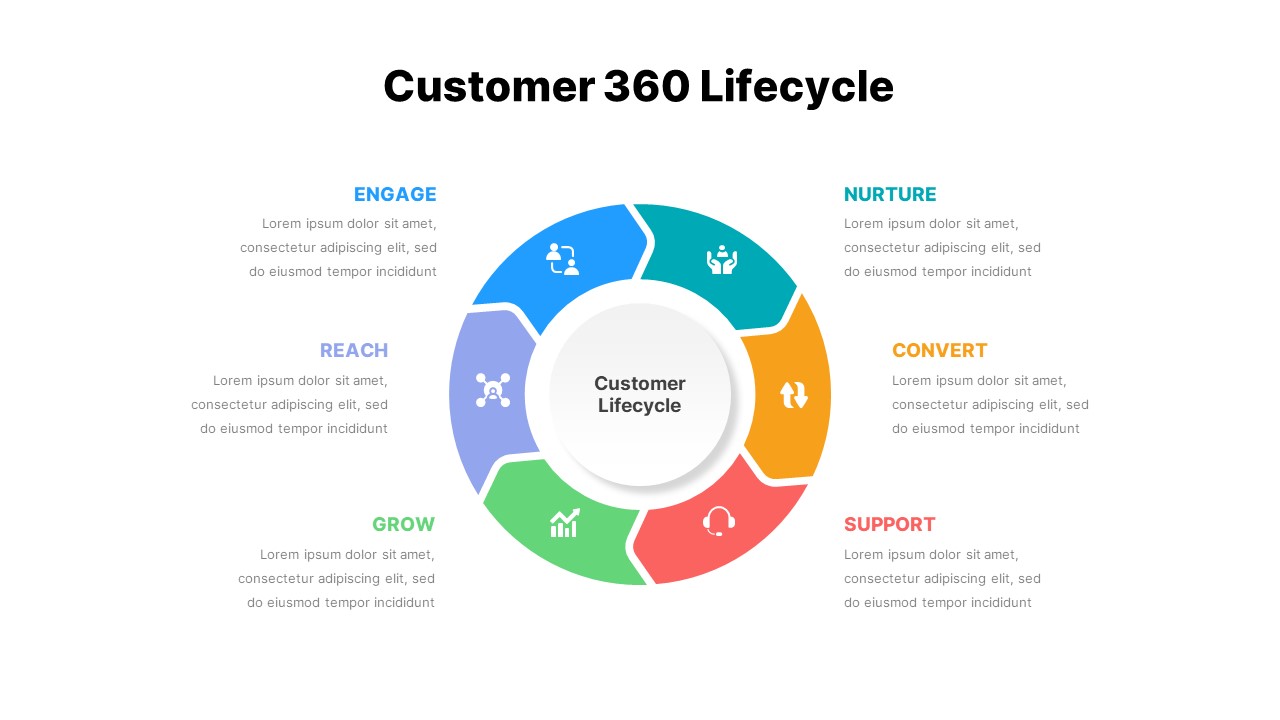
Customer 360 Lifecycle Slide for PowerPoint & Google Slides
Customer Journey
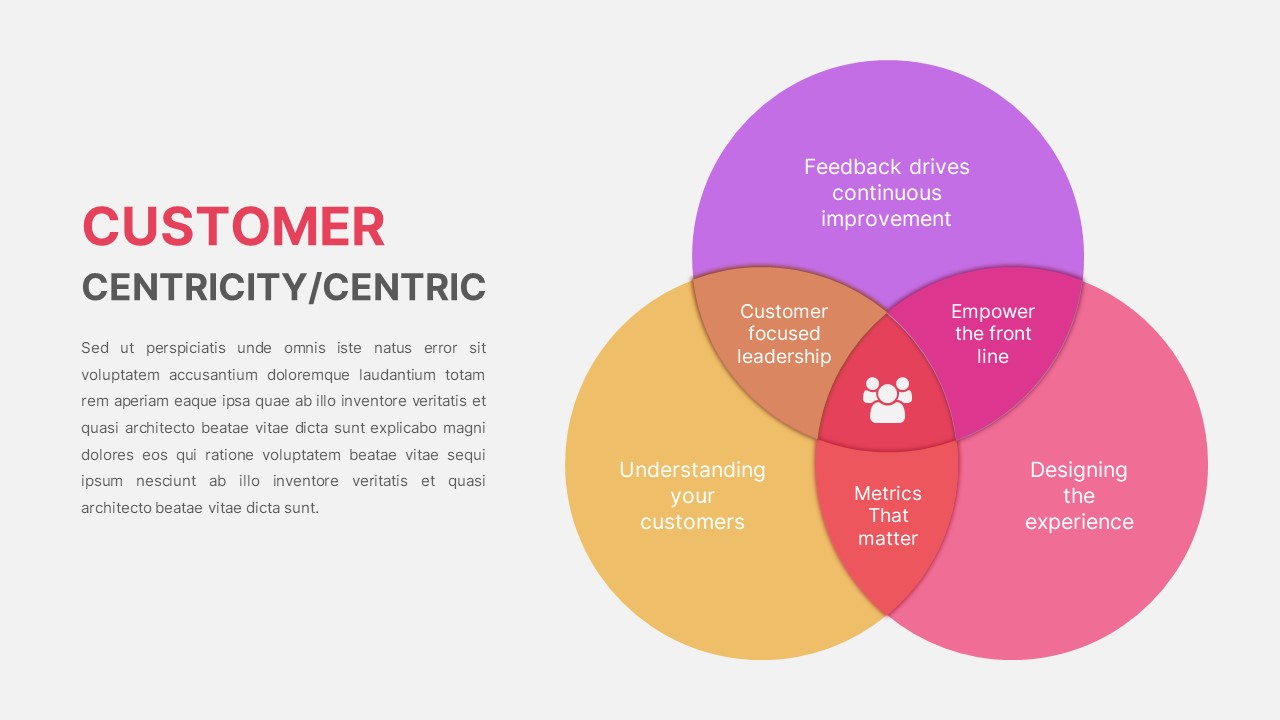
Customer Centricity Venn Diagram template for PowerPoint & Google Slides
Infographics
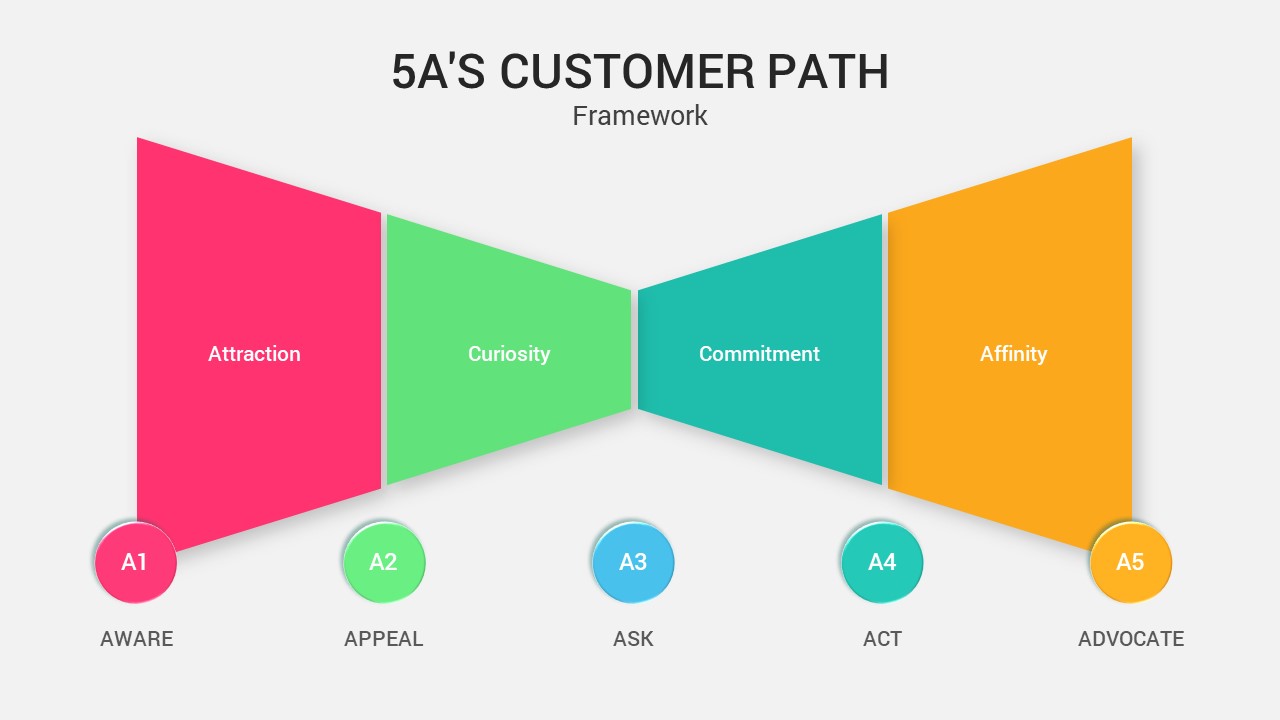
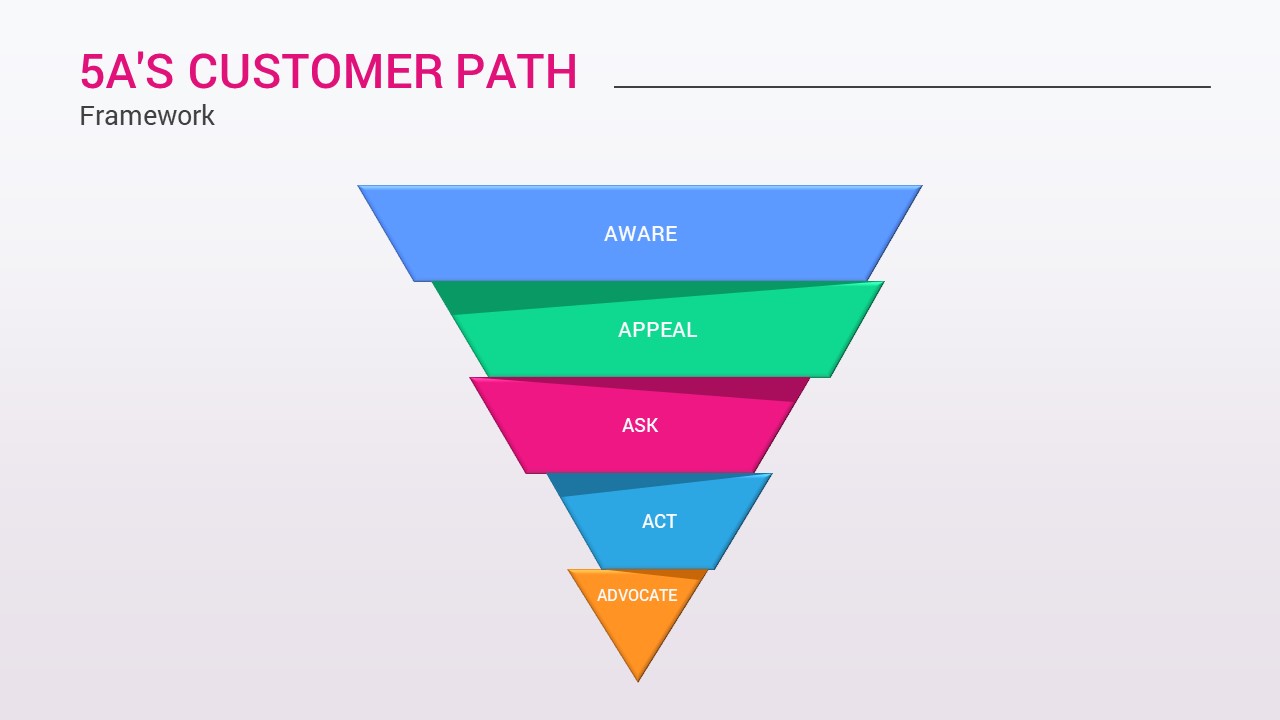
5A’s Customer Path Framework Diagram Template for PowerPoint & Google Slides
Process
5A’s Customer Path Funnel Diagram Template for PowerPoint & Google Slides
Funnel
Customer Support Template for PowerPoint & Google Slides
Customer Experience
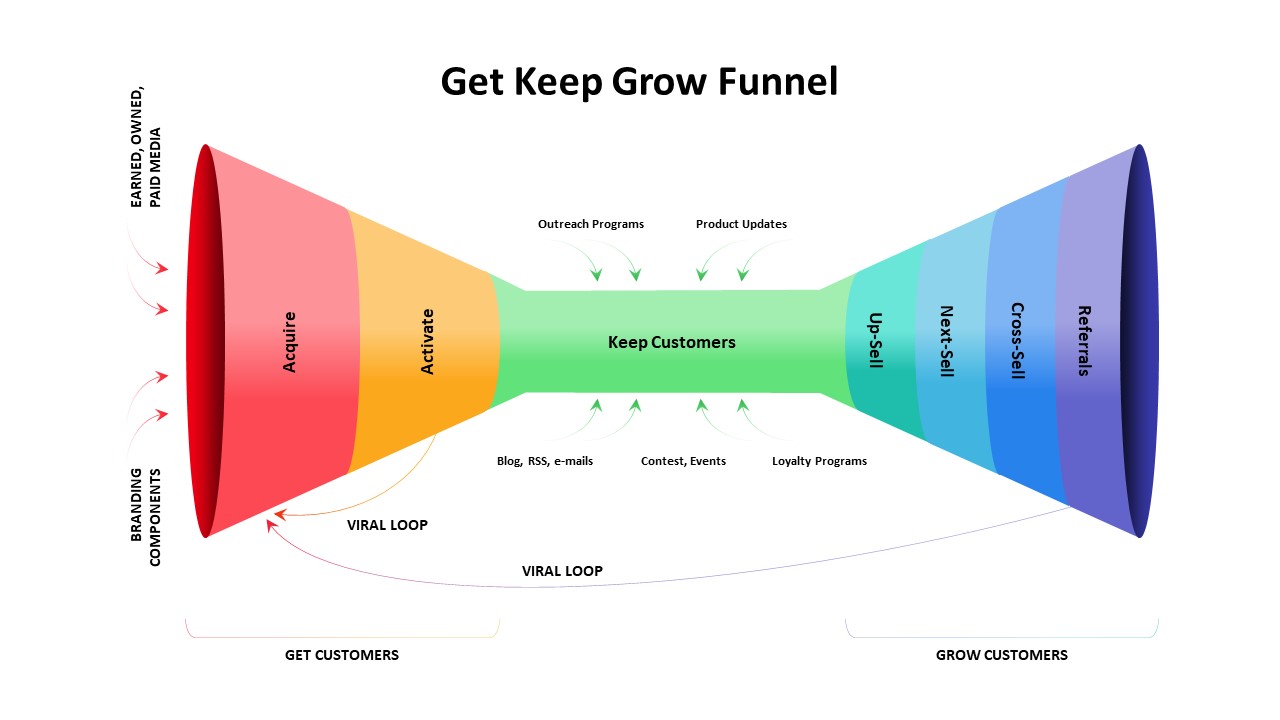
Get Keep Grow Customer Funnel Lifecycle Template for PowerPoint & Google Slides
Funnel
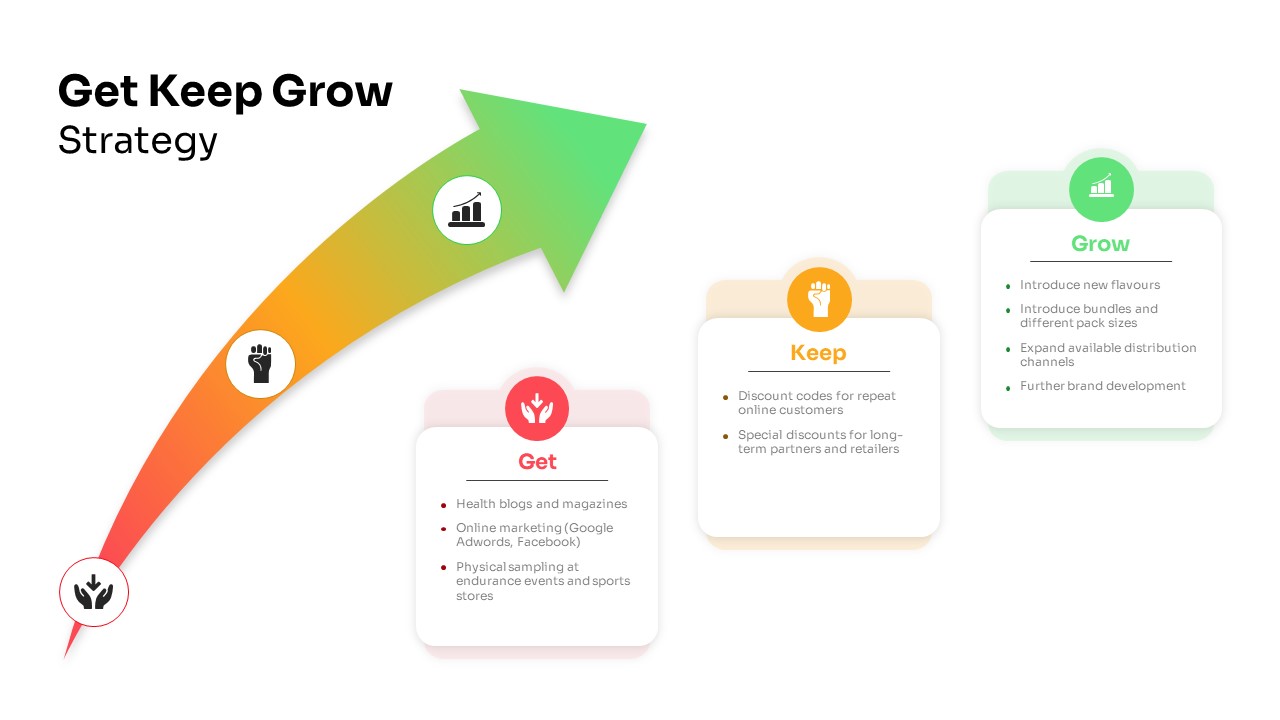
Get Keep Grow Customer Strategy Template for PowerPoint & Google Slides
Business Strategy
Customer Satisfaction KPI Dashboard Template for PowerPoint & Google Slides
Customer Experience
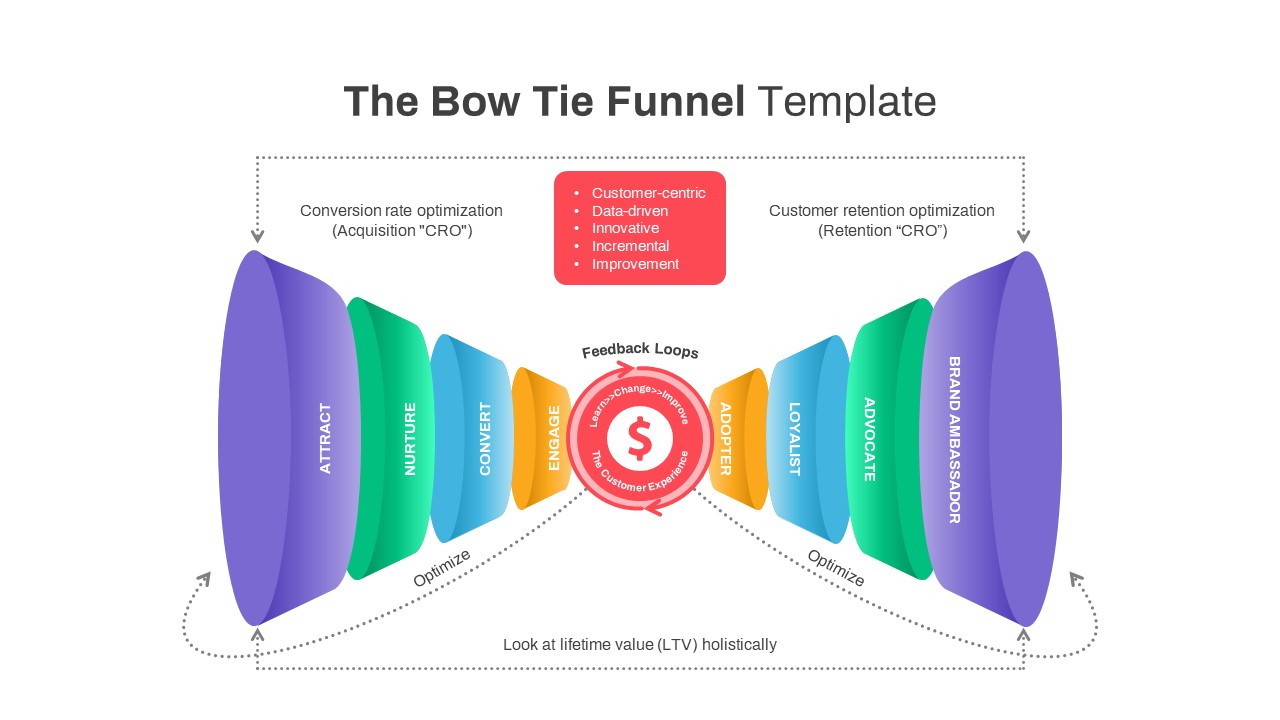
Bow Tie Customer Funnel Presentation Template for PowerPoint & Google Slides
Funnel
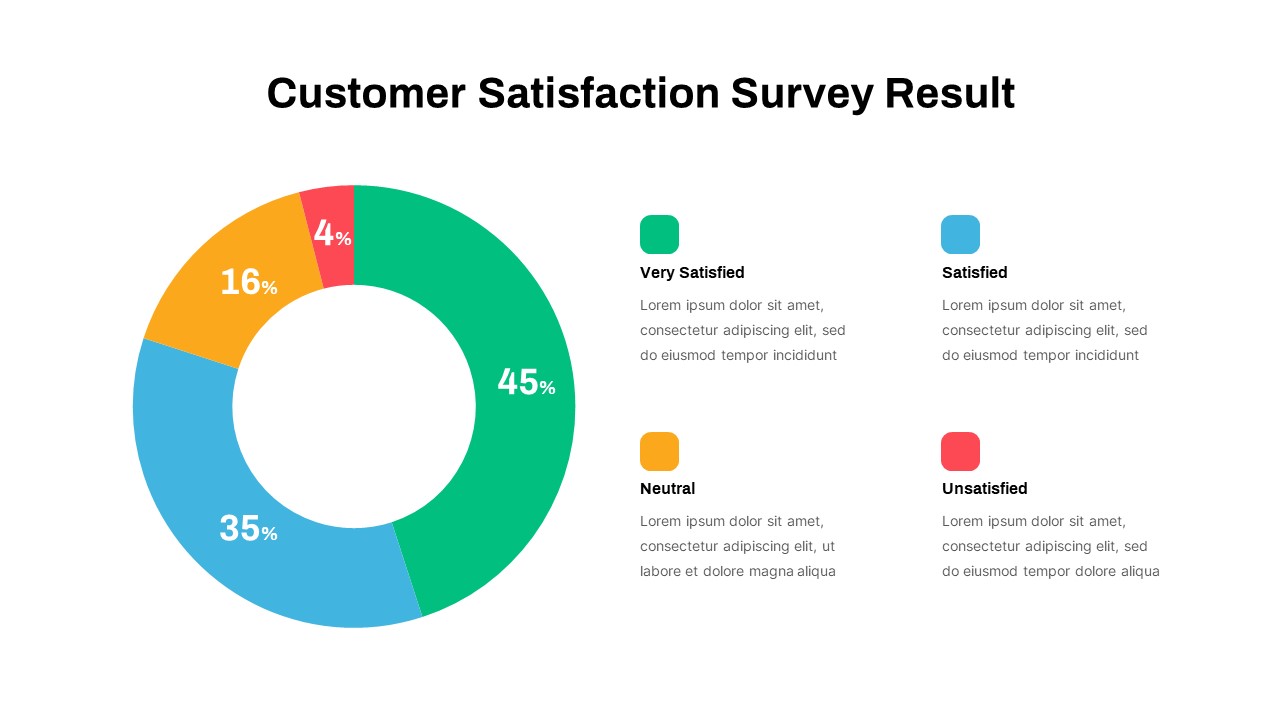
Customer Satisfaction Survey Result Template for PowerPoint & Google Slides
Marketing
Custom Customer Service Infographics Template for PowerPoint & Google Slides
Process
Free Customer Service Breakdown Slide for PowerPoint & Google Slides
Infographics
Free
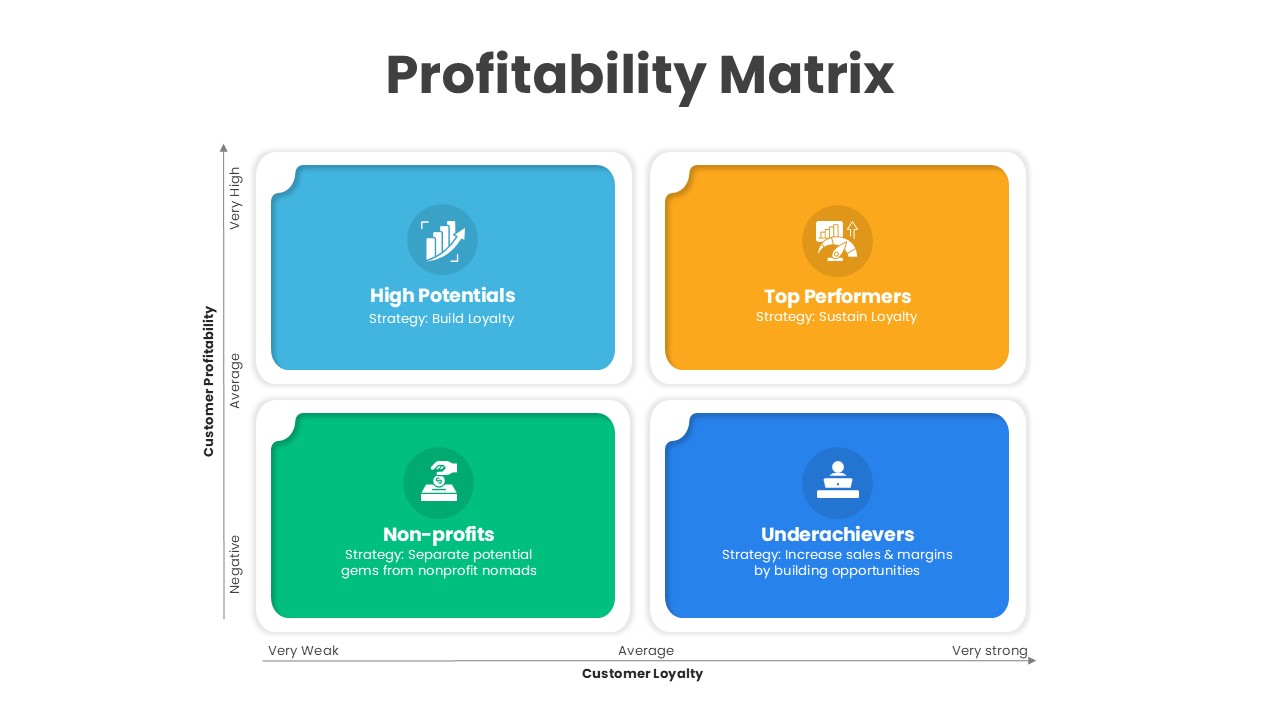
Customer Loyalty & Profitability Matrix Template for PowerPoint & Google Slides
Comparison
Customer Churn Illustration Diagram Template for PowerPoint & Google Slides
Customer Journey
Customer Issue Resolving Template for PowerPoint & Google Slides
Customer Experience
Customer Loyalty & Retention Strategy Deck for PowerPoint & Google Slides
Business Strategy
Customer Service Management Process Template for PowerPoint & Google Slides
Process
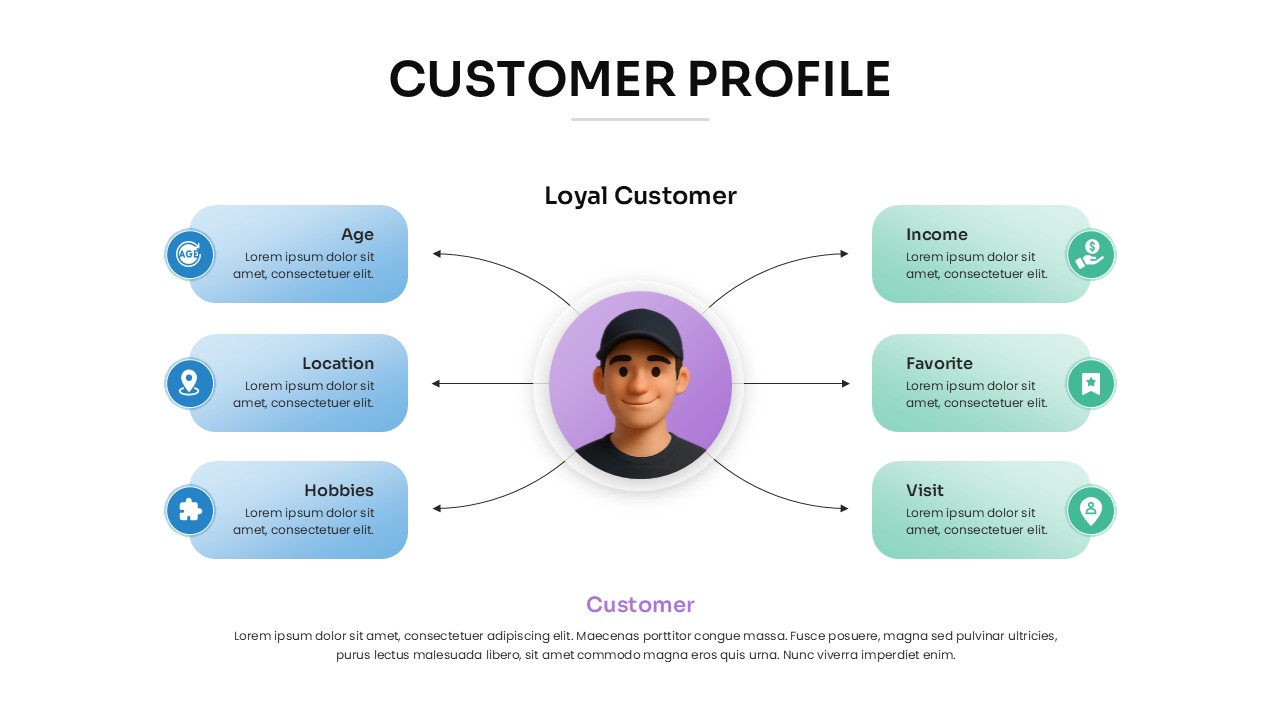
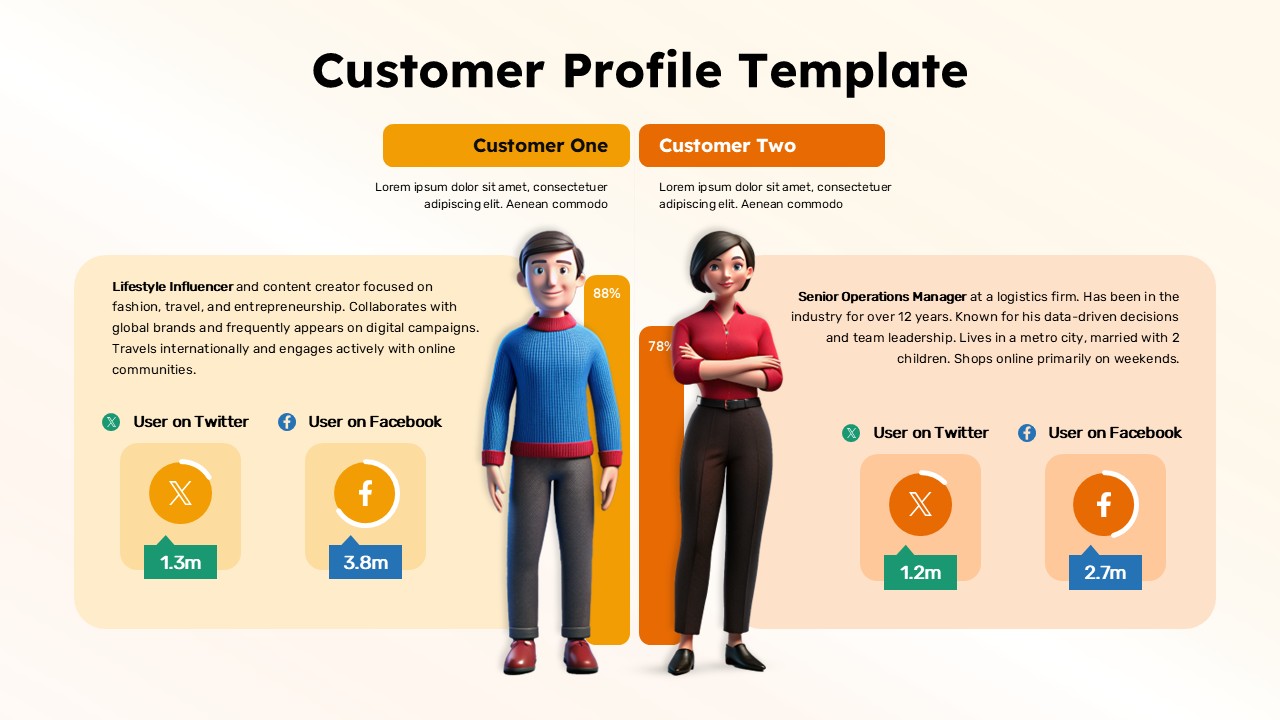
Customer Profile Overview Template for PowerPoint & Google Slides
Customer Journey
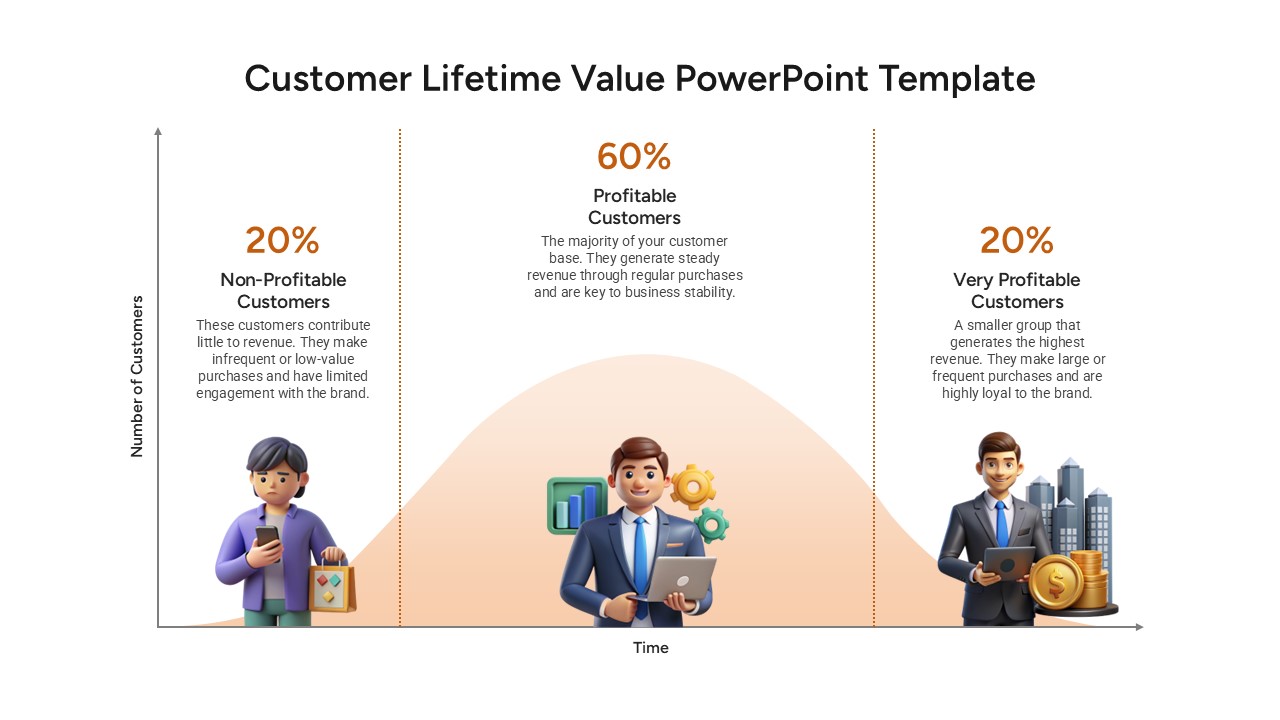
Customer Lifetime Value Analysis for PowerPoint & Google Slides
Customer Journey
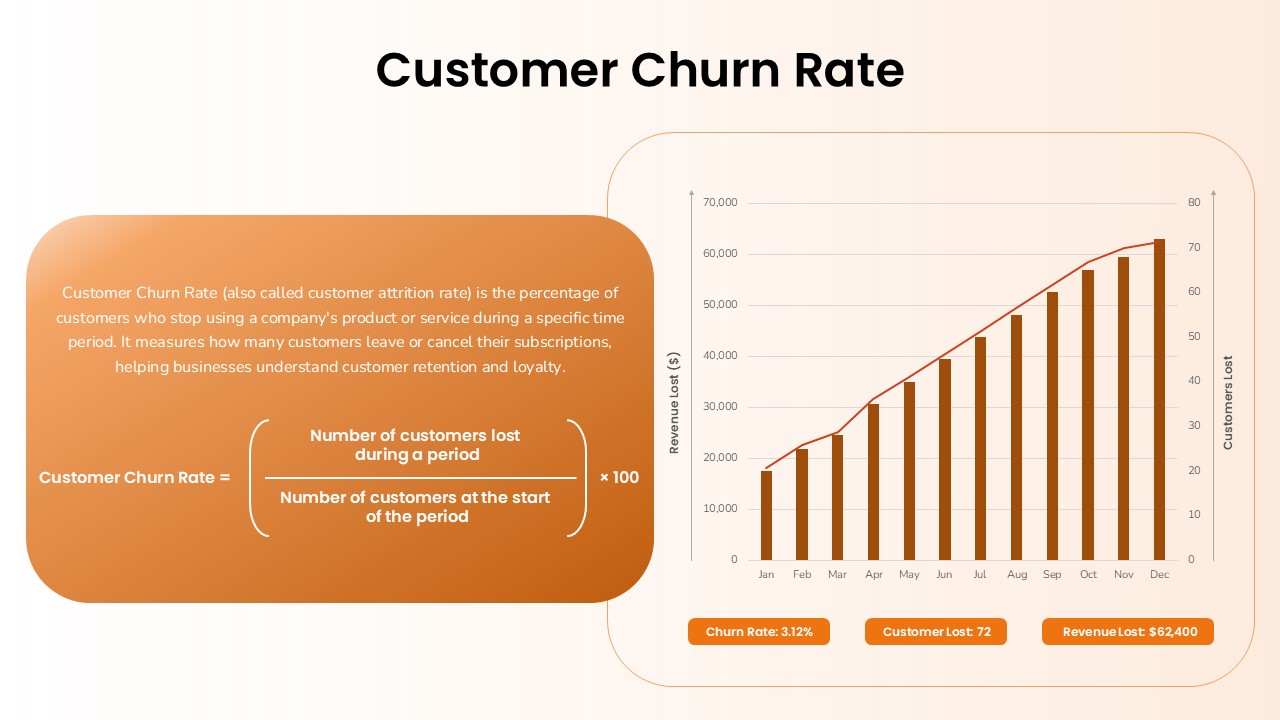
Customer Churn Rate Analysis template for PowerPoint & Google Slides
Business Report
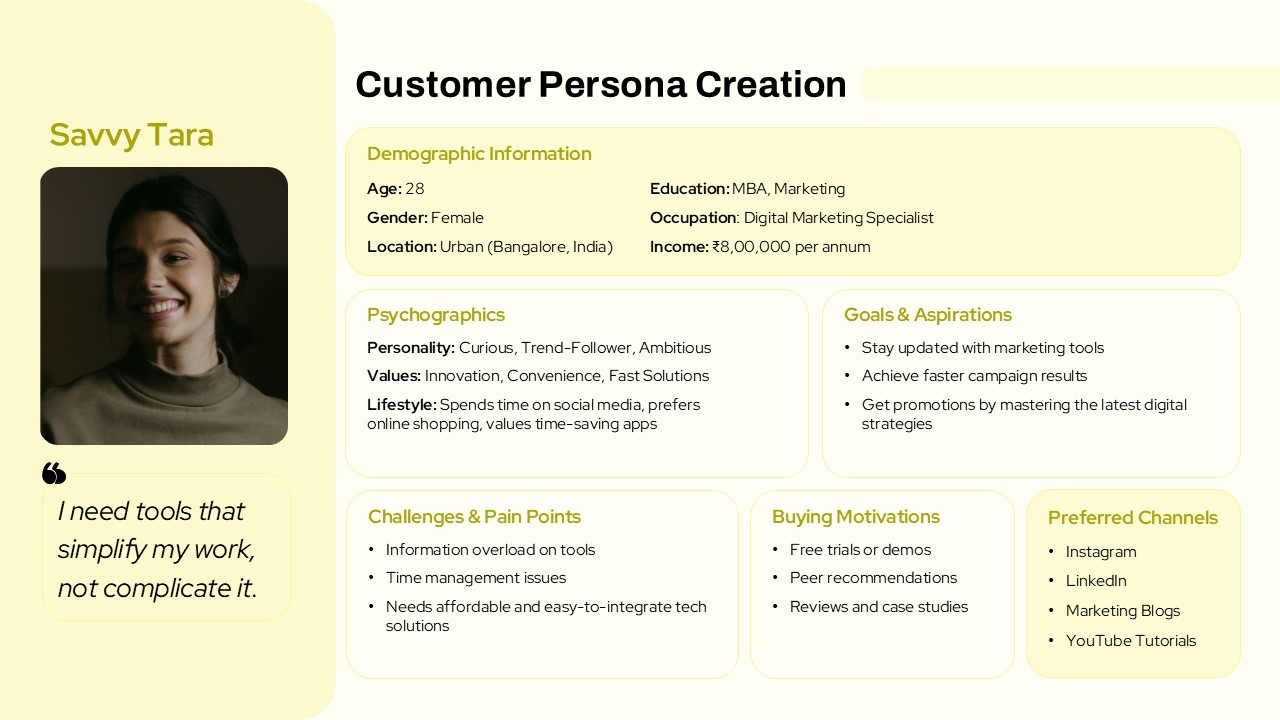
Customer Persona Creation template for PowerPoint & Google Slides
Marketing
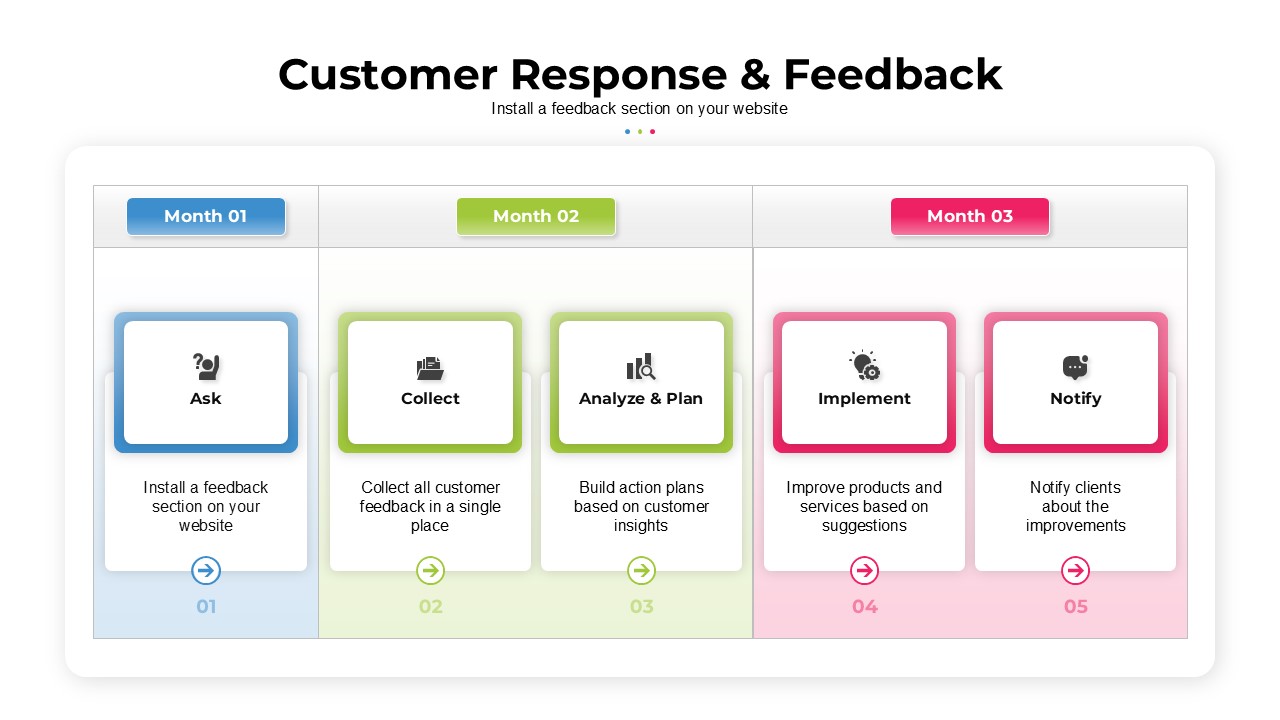
Customer Response & Feedback Process template for PowerPoint & Google Slides
Business Proposal
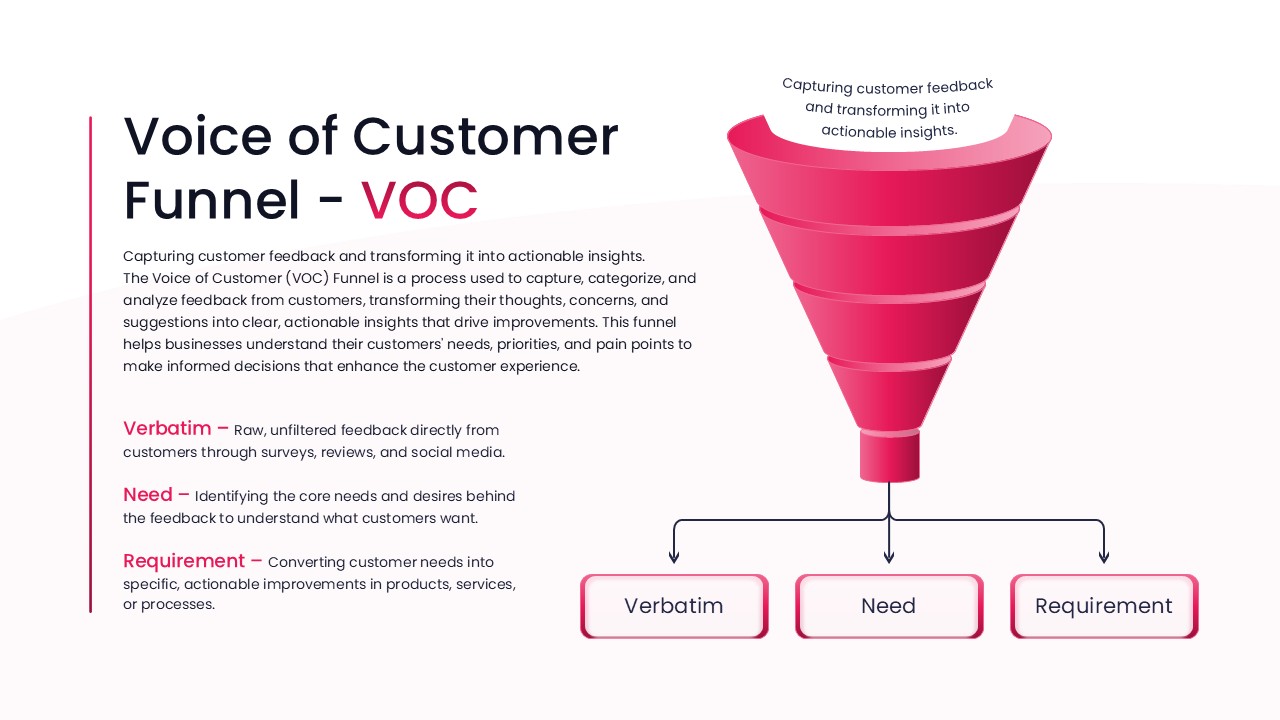
Voice of Customer Funnel (VOC) template for PowerPoint & Google Slides
Marketing
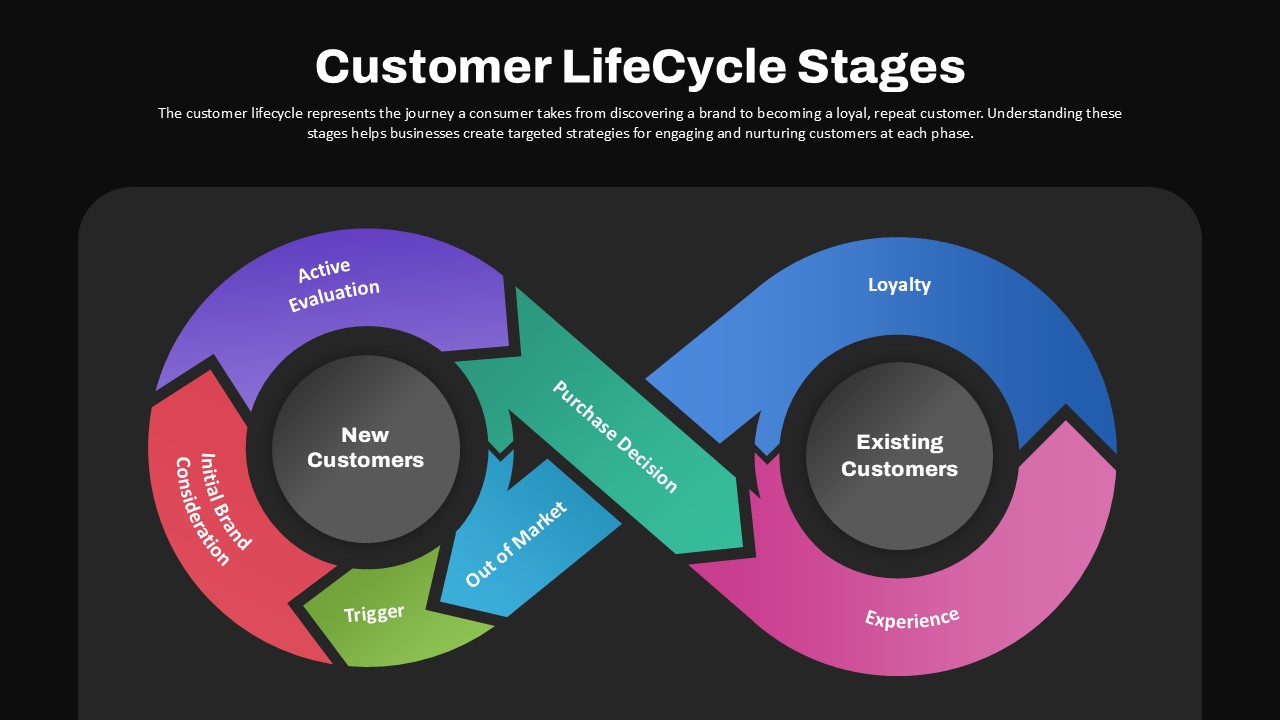
Customer Lifecycle Stages Infinity Loop Template for PowerPoint & Google Slides
Customer Journey
Customer Data Platform Workflow Diagram Template for PowerPoint & Google Slides
Information Technology
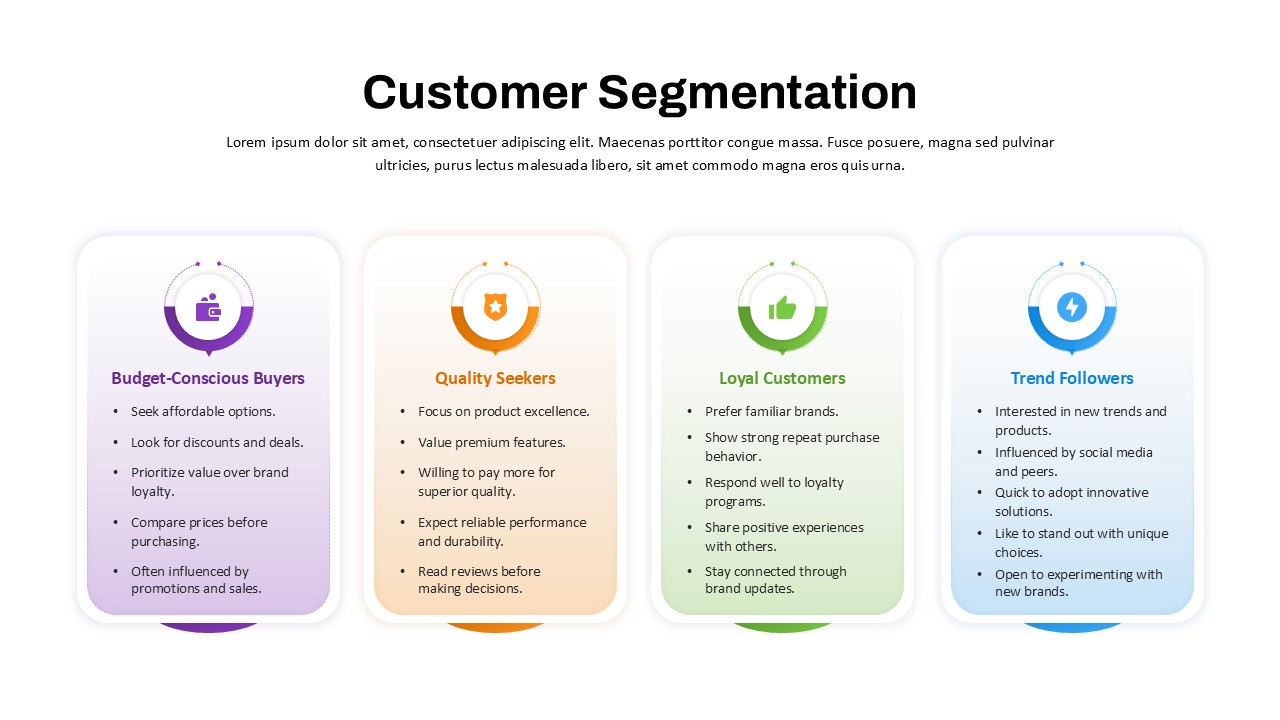
Customer Segmentation Overview template for PowerPoint & Google Slides
Marketing
Customer Interview Insights Dashboard Template for PowerPoint & Google Slides
Customer Experience
Customer Persona Comparison Profile Template for PowerPoint & Google Slides
Business
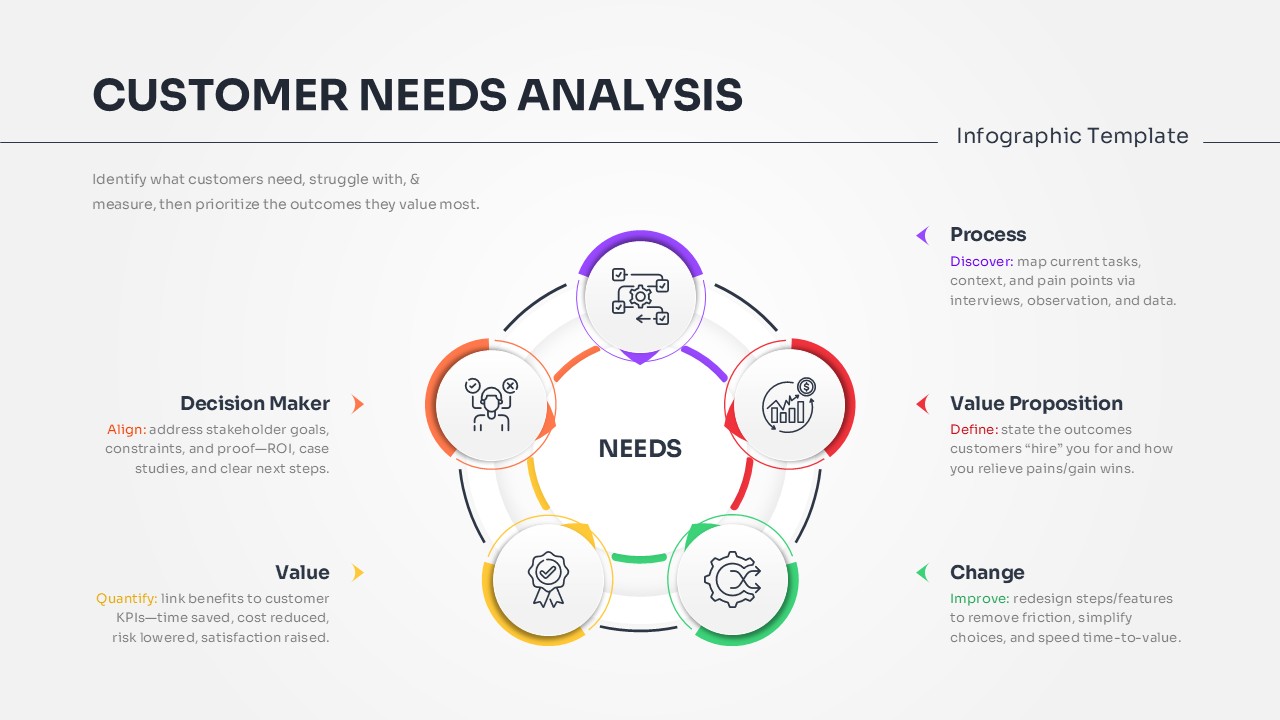
Customer Needs Analysis Template for PowerPoint & Google Slides
Customer Experience
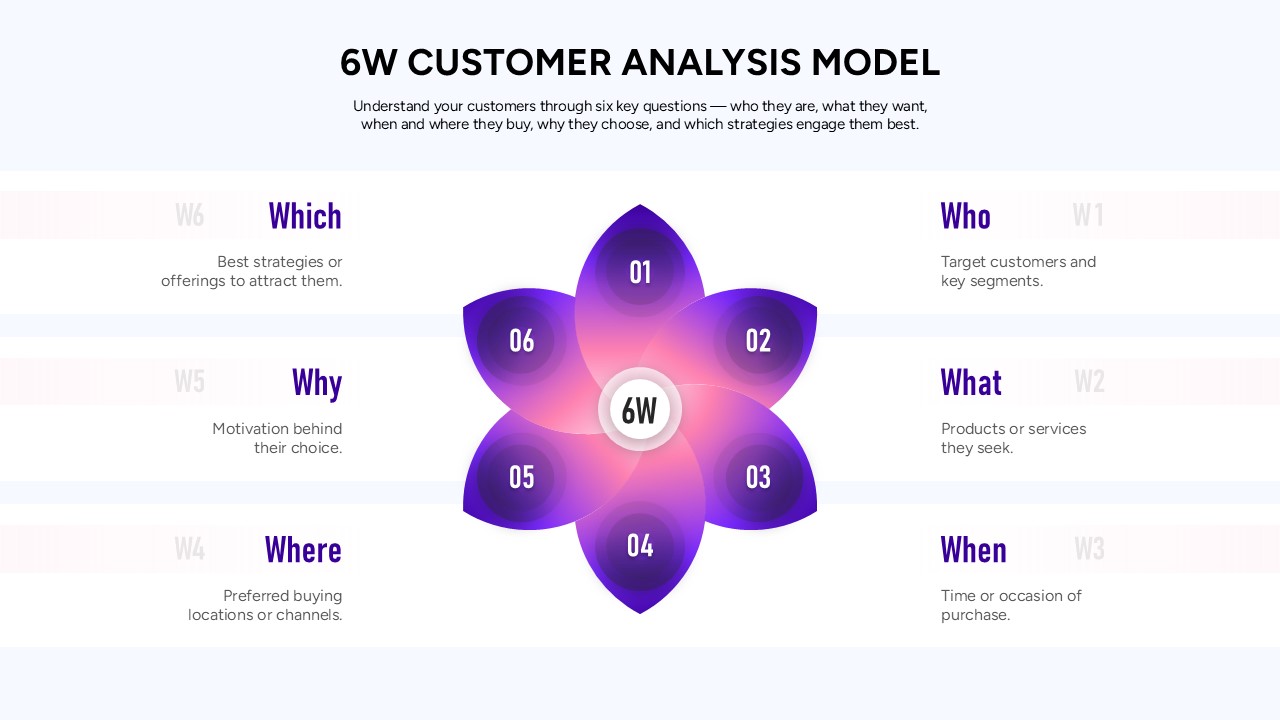
6W Customer Analysis Model Template for PowerPoint & Google Slides
Customer Experience
Customer Relationship Management (CRM) Presentation Template for PowerPoint
Decks
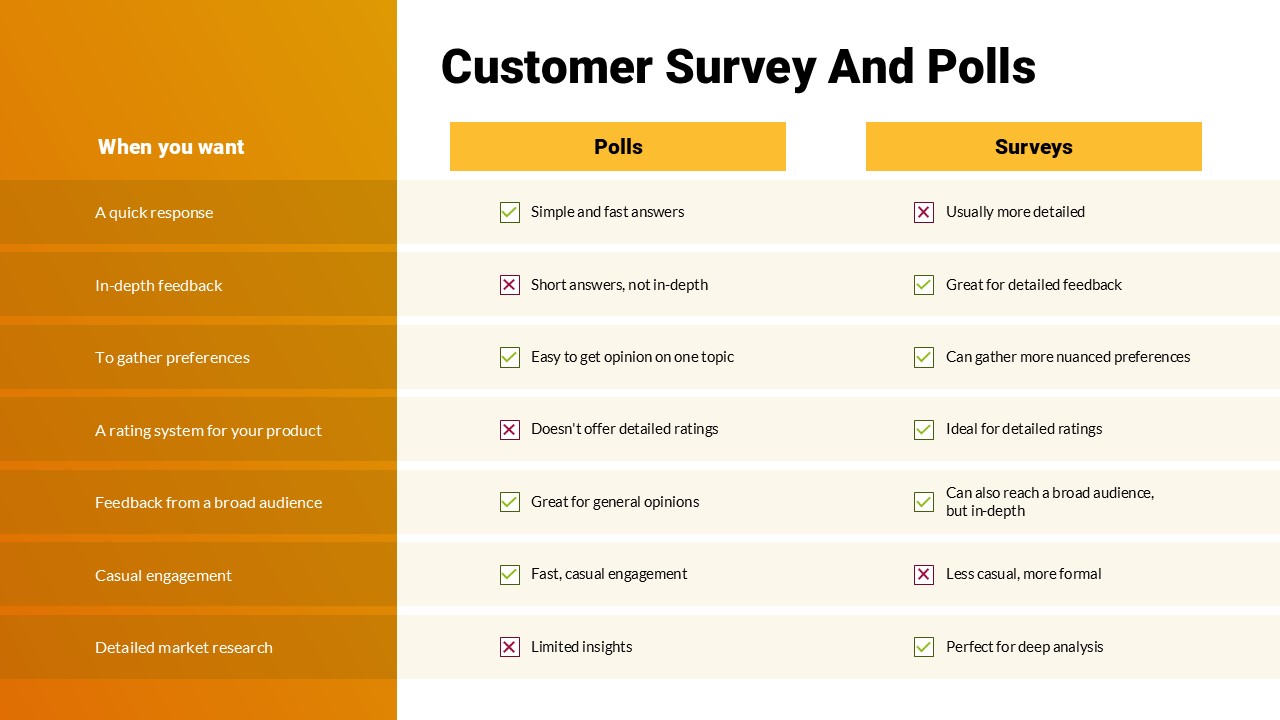
Customer Survey & Polls Comparison PowerPoint Template
Customer Experience