Business Quarter Timeline PowerPoint Template


Quarterly Roadmap PowerPoint Template & Google Slides
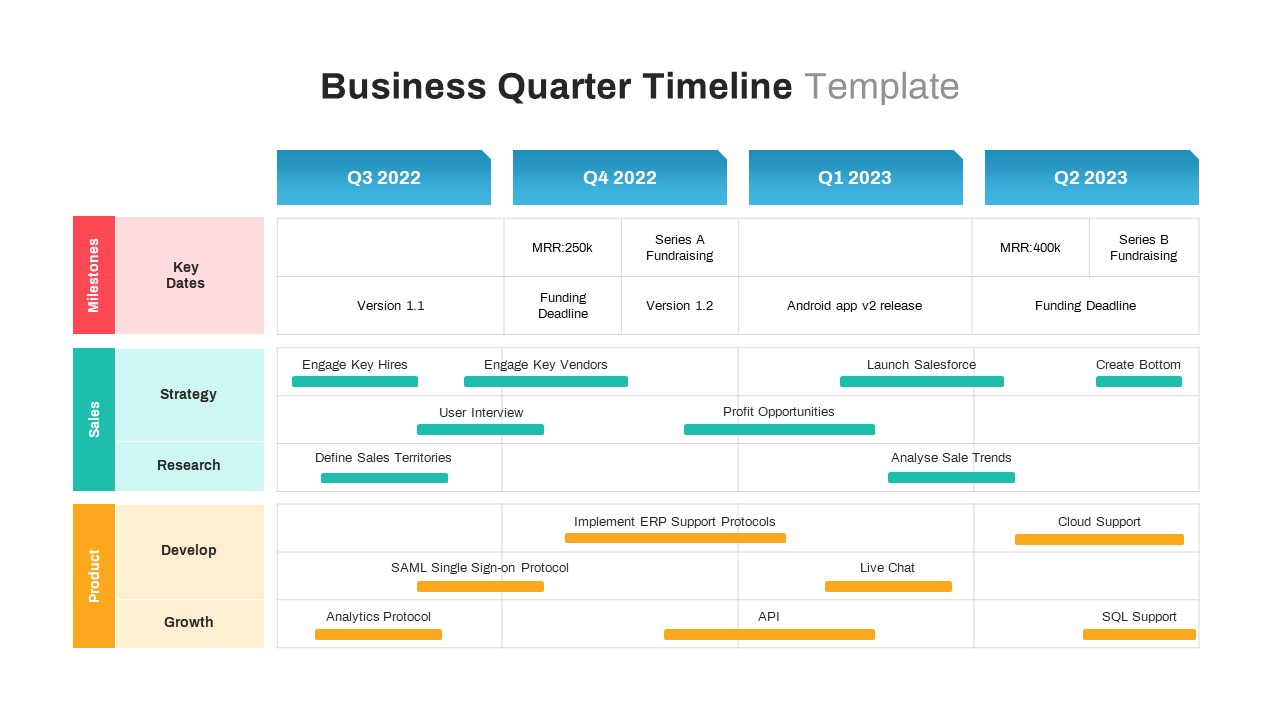
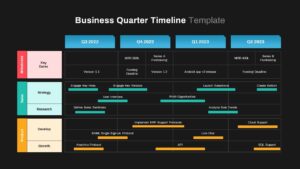
The Business Quarter Timeline PowerPoint Template is a professional project roadmap slideshow featuring an annual business progression. It contains two slides of timeline designs representing a highly functional Gantt chart design, perfectly reproduced across clean light layouts and premium dark theme variations. This graphical matrix gives an easy-to-understand data table layout for project updates, mapping out key milestones and departmental initiatives across fiscal quarters from Q3 2022 to Q2 2023. This business timeline infographic displays structured rows and columns that identify Milestones (pink), Sales (teal), and Product (amber) categories. Within the matrix grid, strategically placed horizontal task bars denote high-level Strategy, Research, Development, and Growth activities. The project quarter timeline template enables viewers to instantly understand the exact amount of effort, deadlines, and resources required for each process, dividing separate topics such as key dates, task priorities, and department benchmarks clearly.
This business quarter PowerPoint timeline template aids seamlessly in delivering your company’s goals divided into strategic units. Each column denotes a fiscal quarter and contains customizable square shapes and colored horizontal process bars to demonstrate various tasks. These color bars feature intuitive text placeholders to enter titles, technical details, and specific milestones—such as MRR milestones, fundraising targets, application releases, and platform support protocols. Presenters can easily change the color and text of these editable slides to match their corporate color palette. Besides, users can easily add more operational activities, duplicate rows for cross-functional teams, or extend the columns for future quarters to highlight tasks with top priorities without any visual layout distortion.
The business quarter timeline PowerPoint chart is a perfect framework for a work plan presentation with strict task prioritization. As a key part of your business timeline presentation, this single-slide quarter tracker provides a clean work breakdown structure in a memorable visual timeline format. All design elements are fully vector-based, leveraging master layouts to guarantee seamless brand alignment, limitless scalability, and crisp printing across screens. Download these premium one-pager timeline templates now to maximize stakeholder engagement and enhance corporate transparency!
Frequently Asked Questions
What Are the Business Quarters?
Login to download this file

Item ID
SB03428
Related Templates

Arrow Timeline Infographic Timeline Template
Timeline
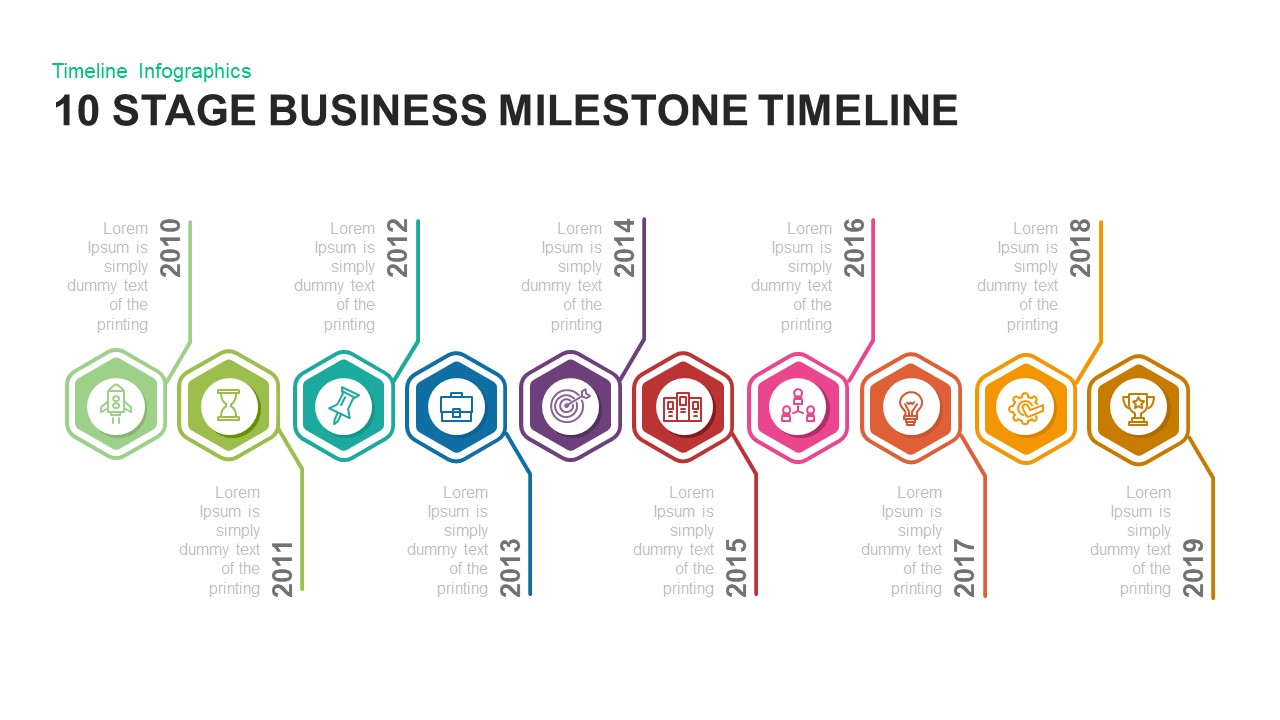
10 Stage Business Milestone Timeline PowerPoint Template for PowerPoint & Google Slides
Timeline
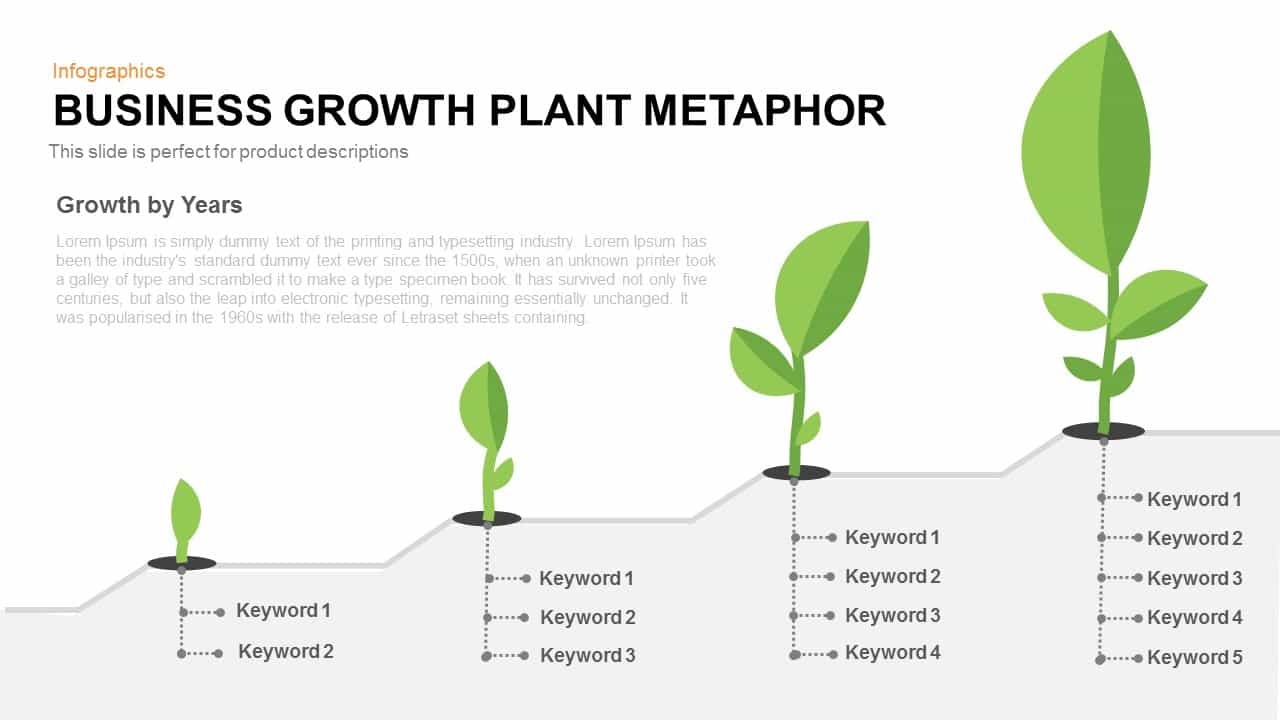
Business Growth Plant Metaphor Timeline Template for PowerPoint & Google Slides
Business Strategy
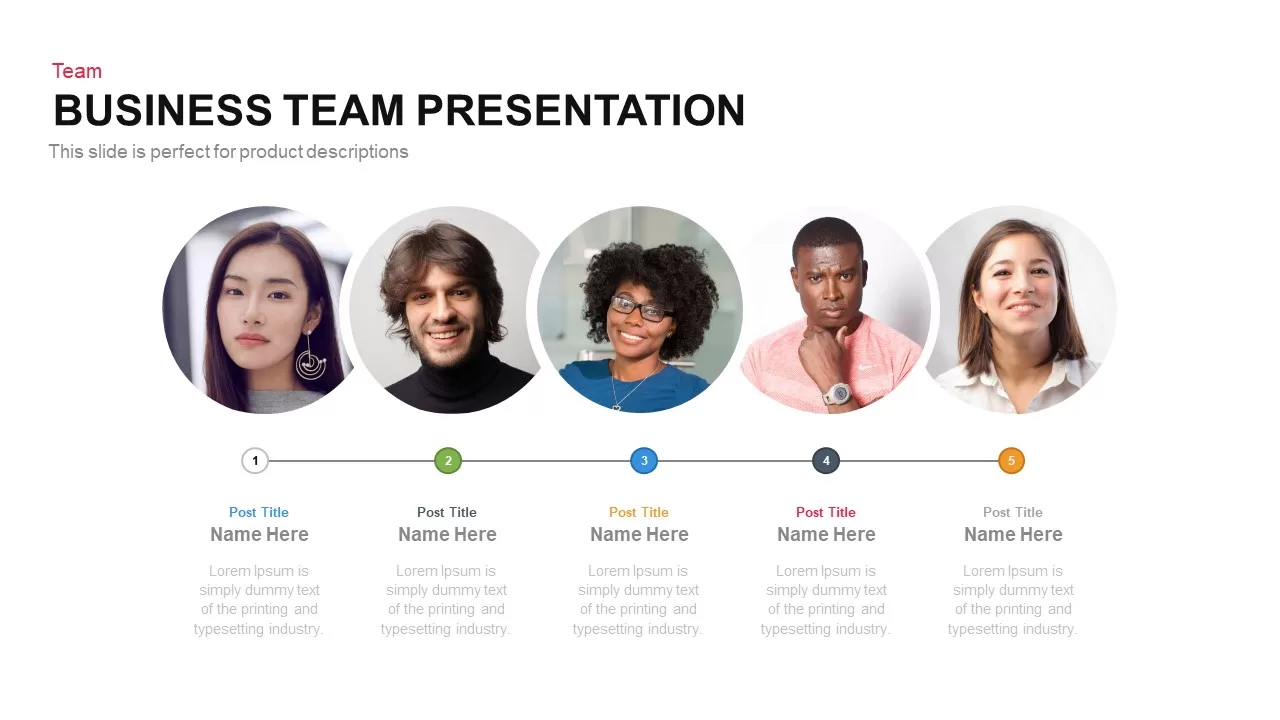
Business Team Timeline Presentation Template for PowerPoint & Google Slides
Our Team

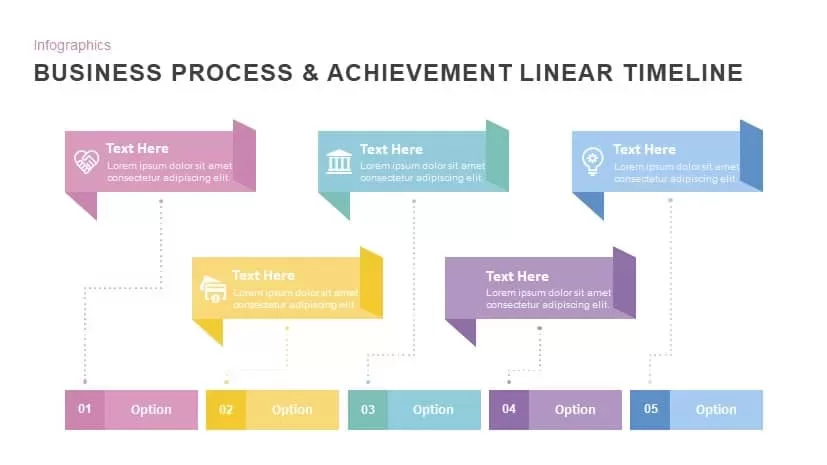
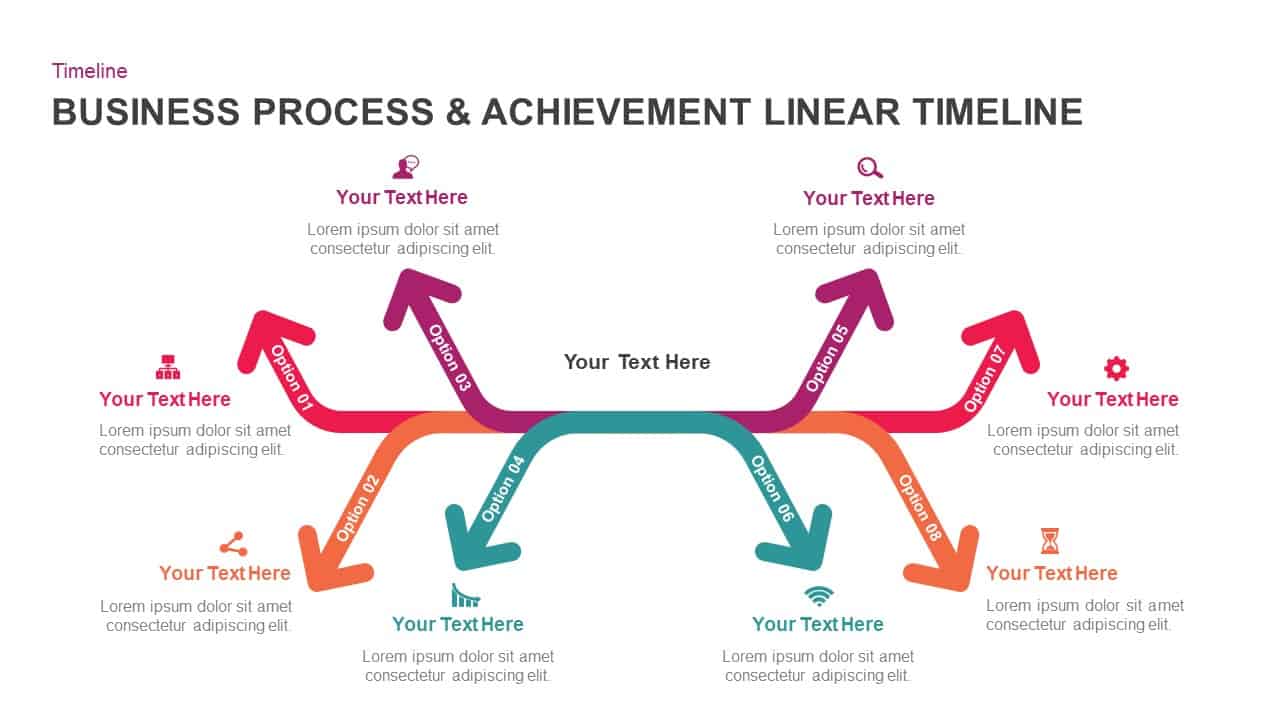
Business Process & Achievement Linear Timeline template for PowerPoint & Google Slides
Timeline
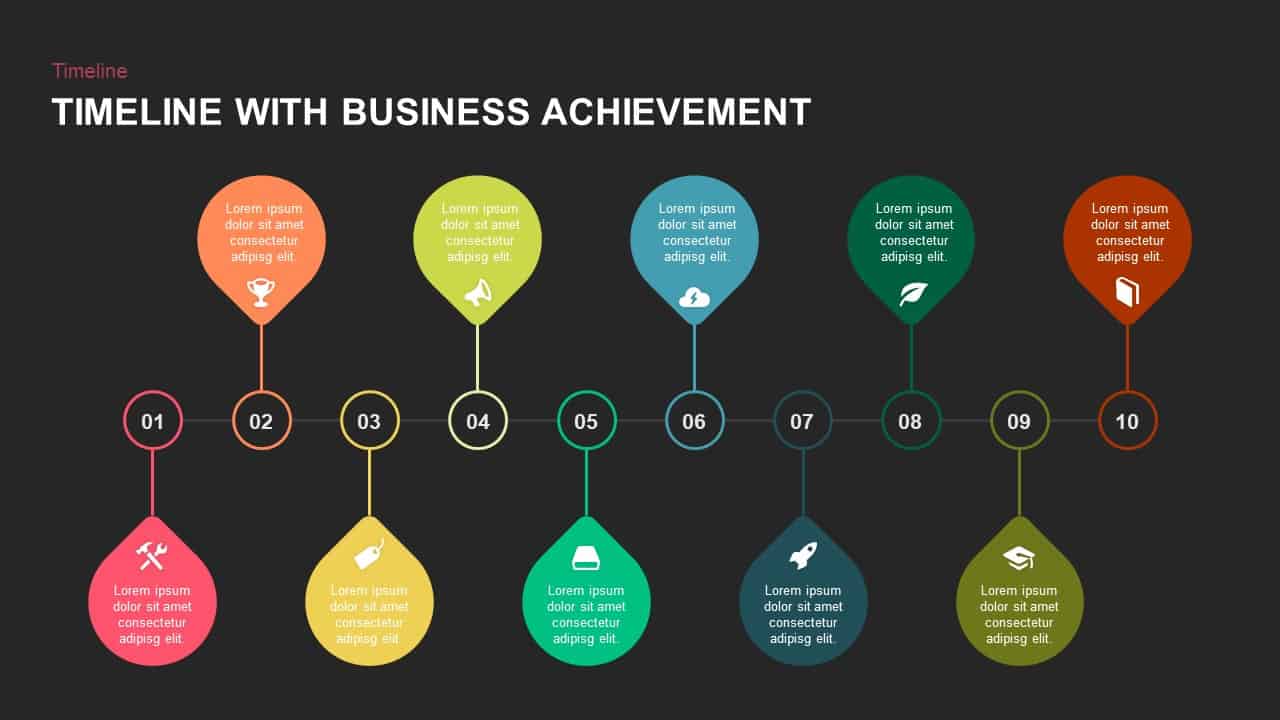
10-Stage Timeline with Business Achievements Template for PowerPoint & Google Slides
Timeline
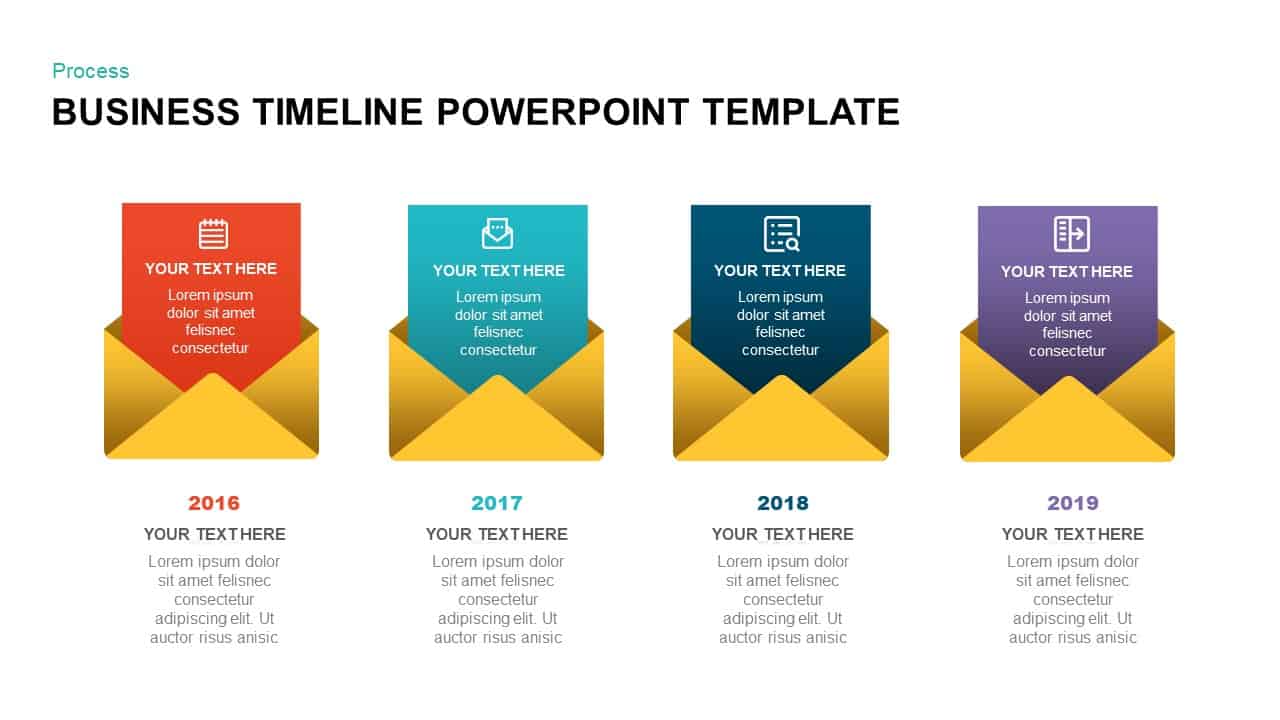
Business Timeline Envelope Infographic Template for PowerPoint & Google Slides
Timeline
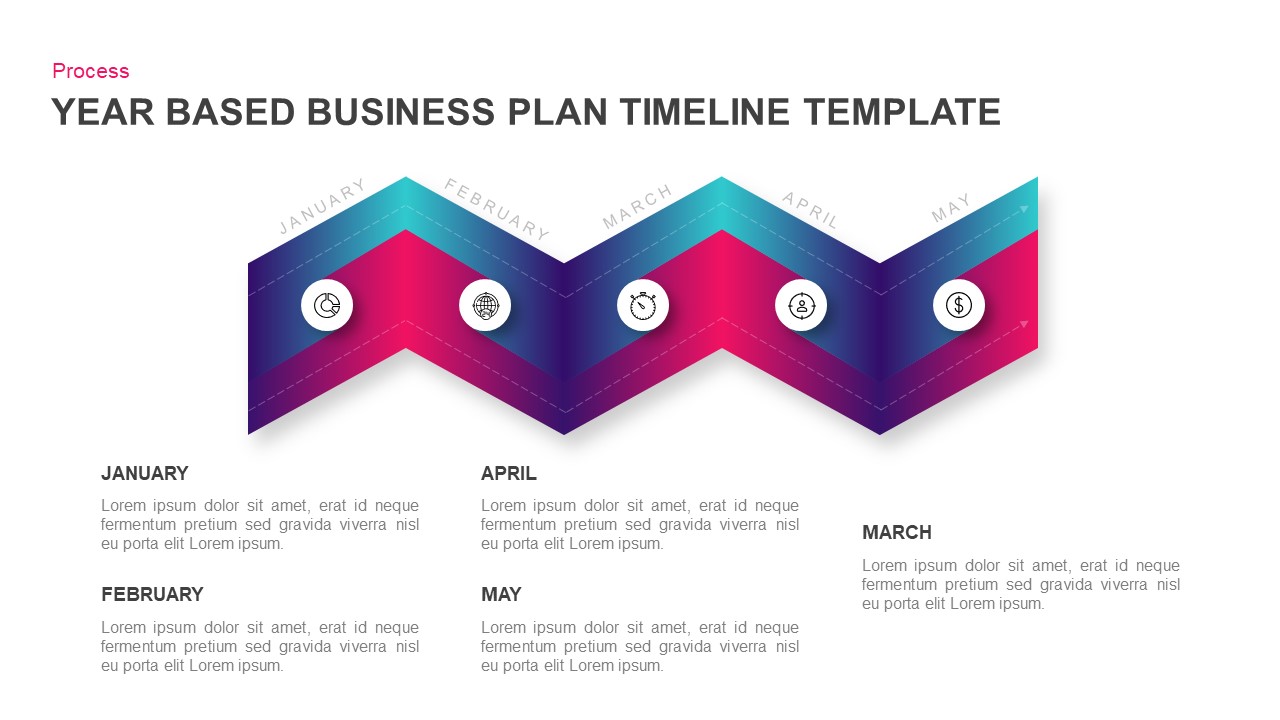
Year-Based Business Plan Zigzag Timeline Template for PowerPoint & Google Slides
Business Plan
Business Process Achievement Timeline Template for PowerPoint & Google Slides
Timeline
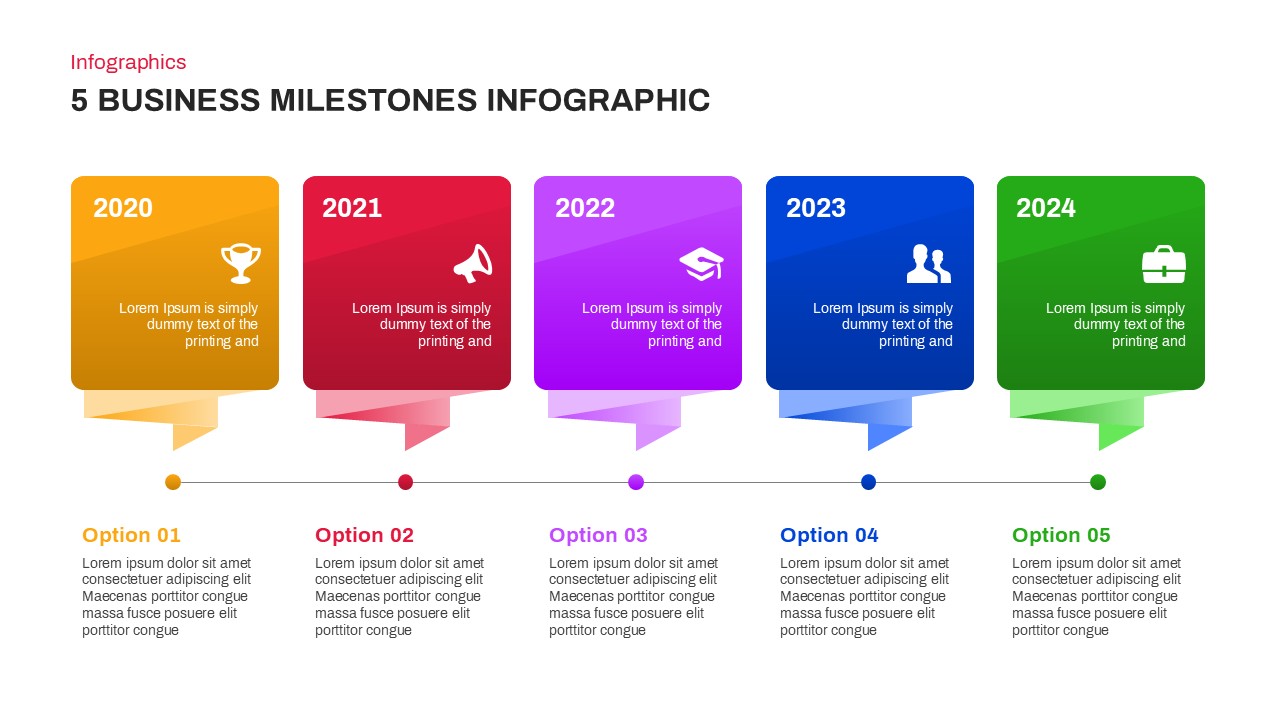
5 Business Milestones Timeline Template for PowerPoint & Google Slides
Timeline
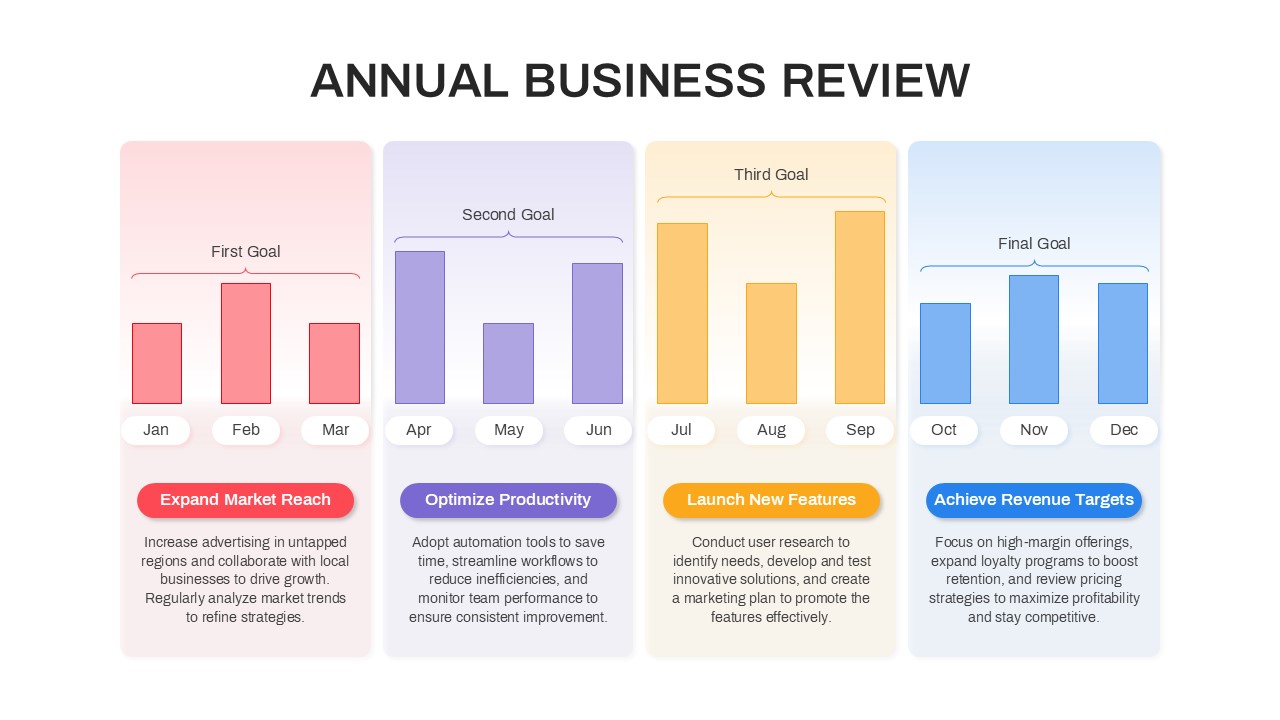
Annual Business Review Timeline Template for PowerPoint & Google Slides
Timeline
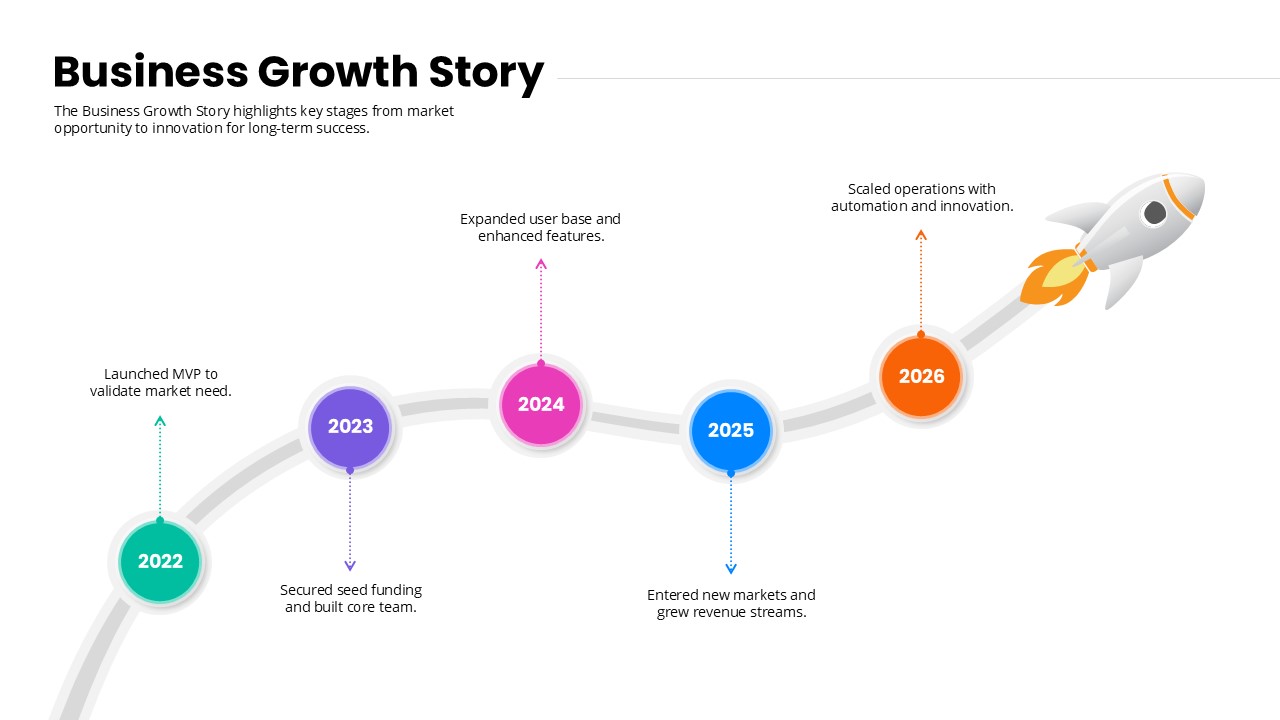
Business Growth Story timeline template for PowerPoint & Google Slides
Timeline
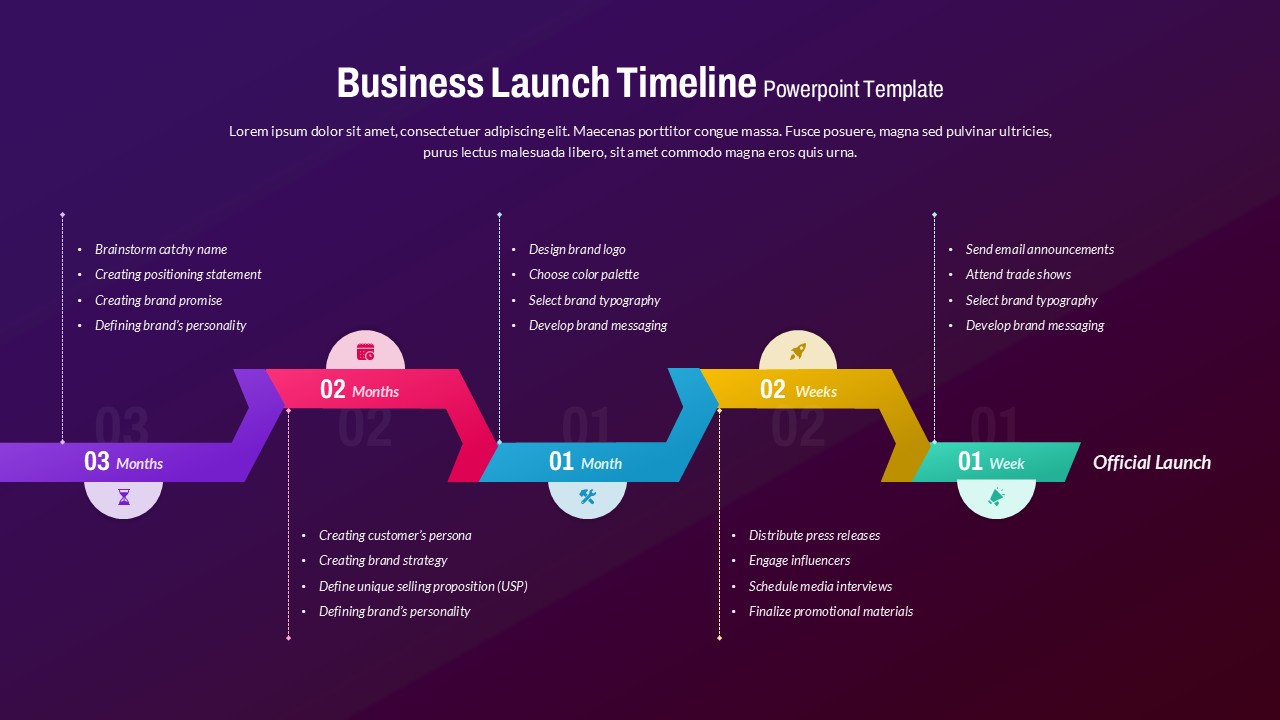
Business Launch Timeline Roadmap 5-Phase Template for PowerPoint & Google Slides
Business
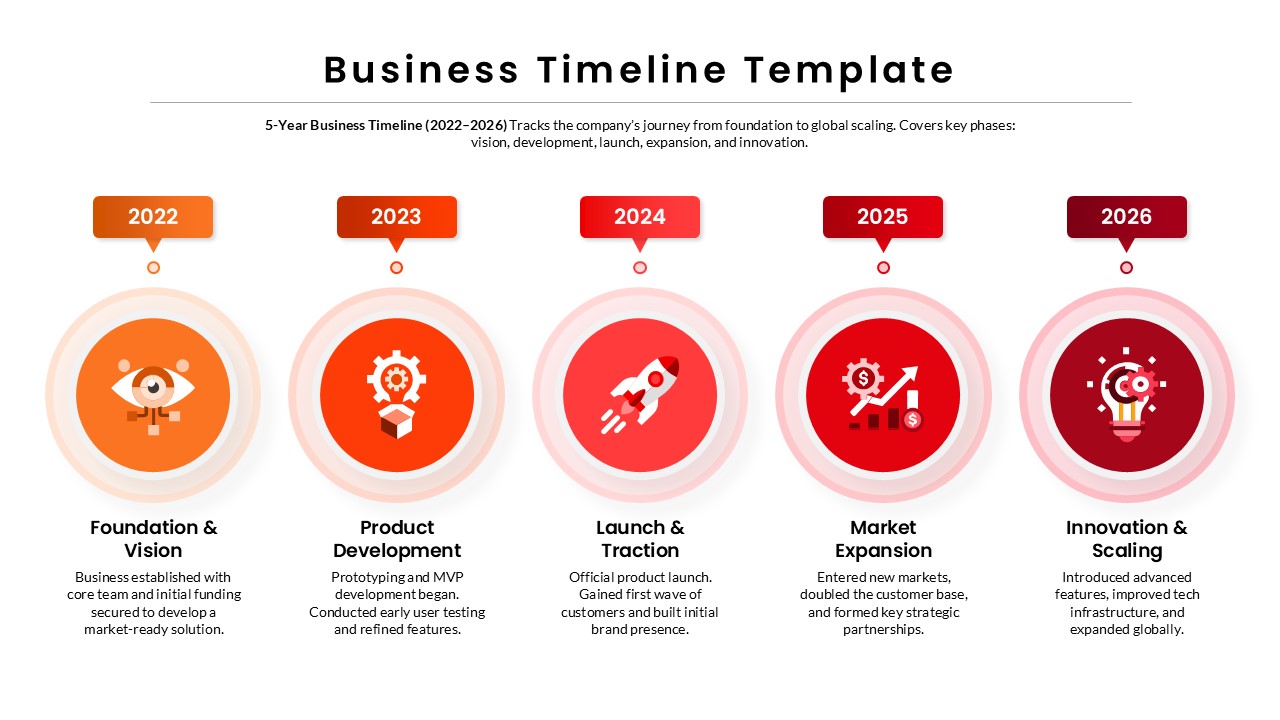
5-Year Business Timeline Template for PowerPoint & Google Slides
Timeline

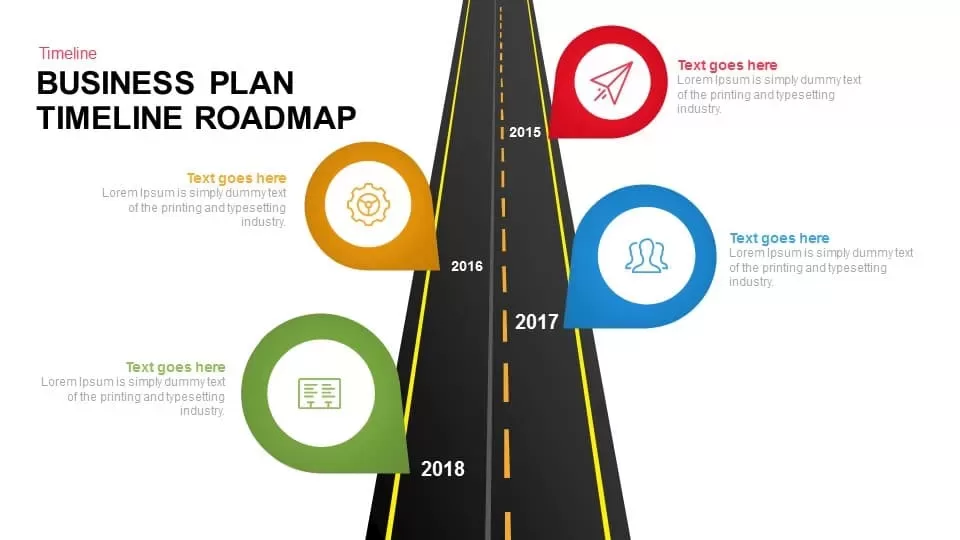
Business Plan Timeline Roadmap for PowerPoint & Google Slides
Roadmap
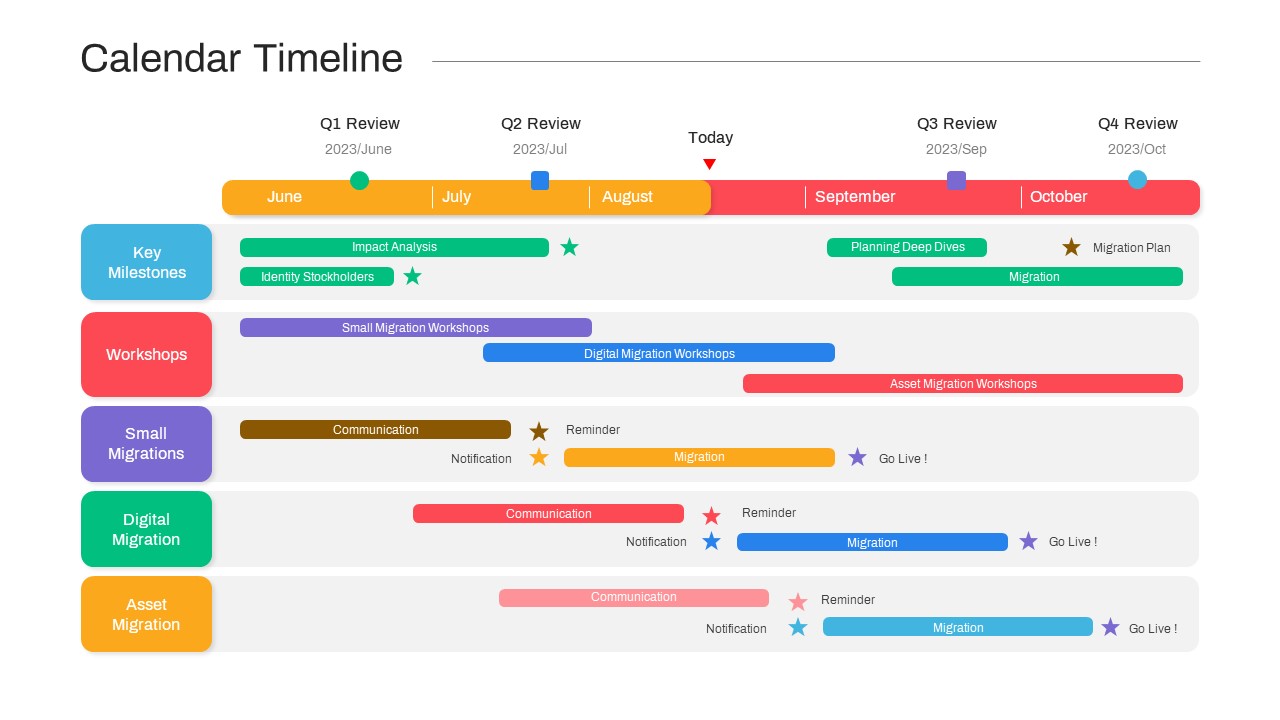
Calendar Timeline Template PowerPoint Template
Timeline
7-Stage Colorful Timeline Infographic Template for PowerPoint & Google Slides
Timeline
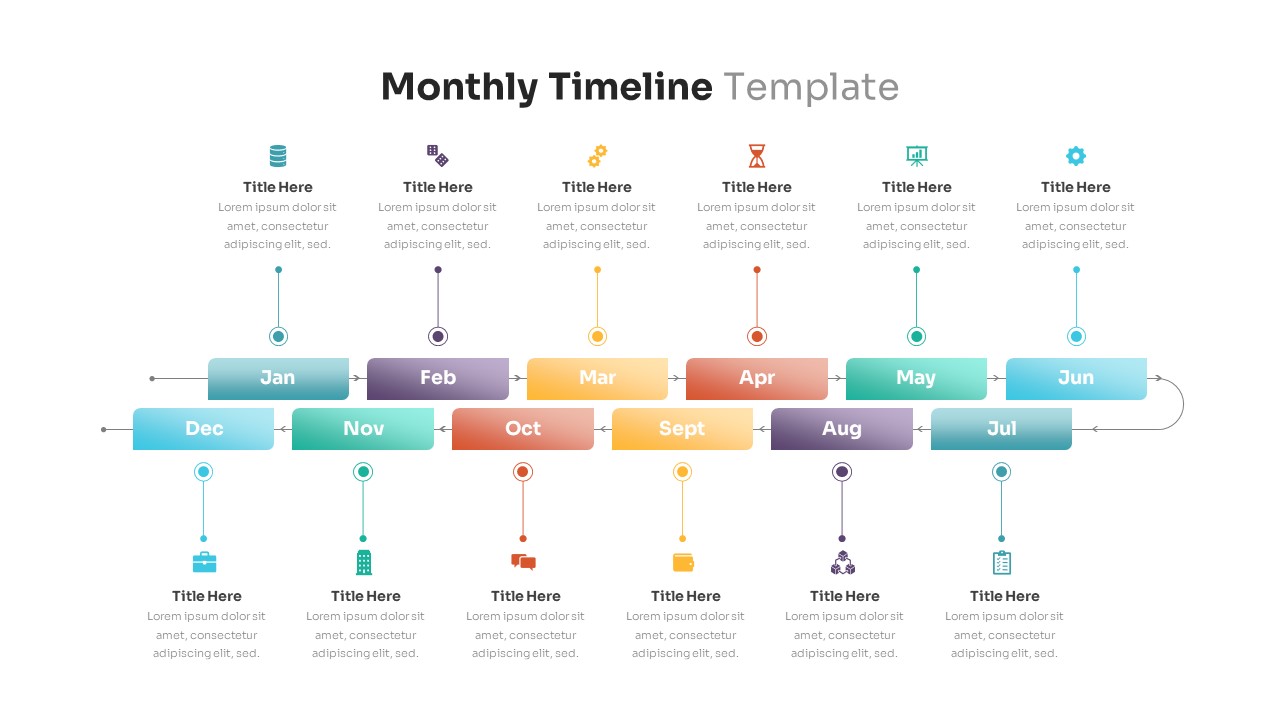
Editable Monthly Timeline Infographic Template for PowerPoint & Google Slides
Timeline
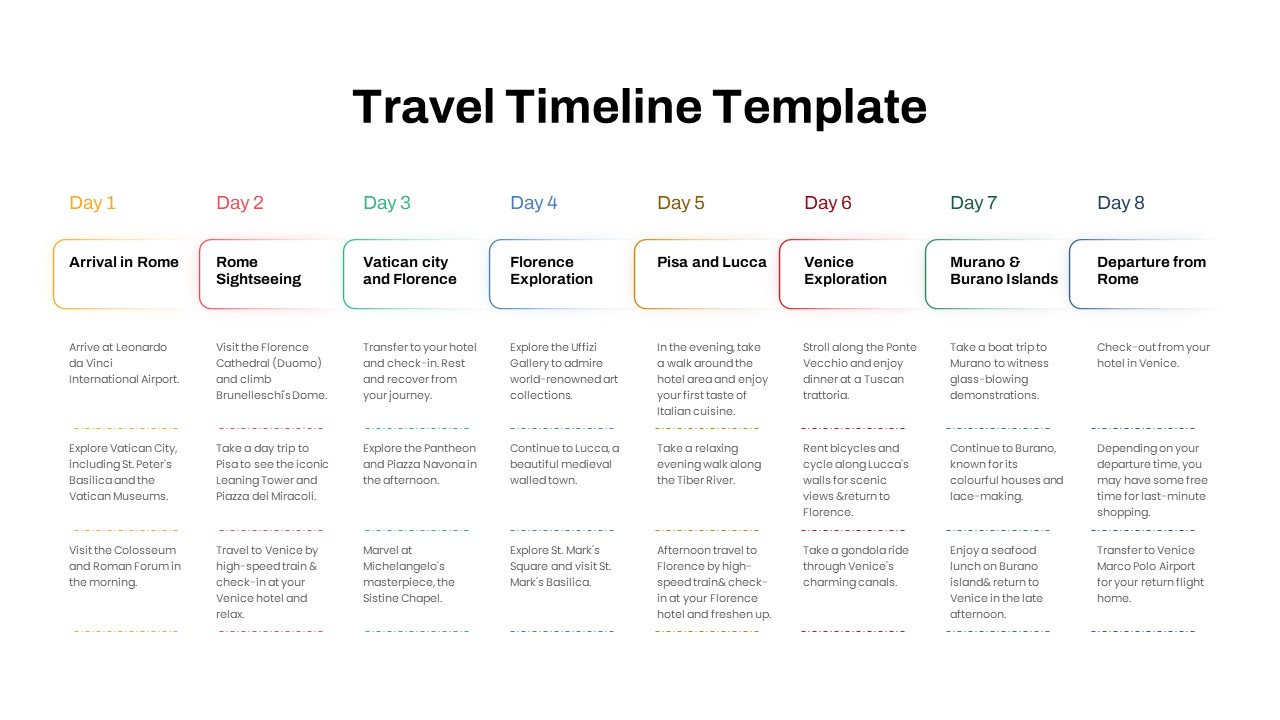
Free Elegant Multi-Day Travel Timeline Template for PowerPoint & Google Slides
Timeline
Free
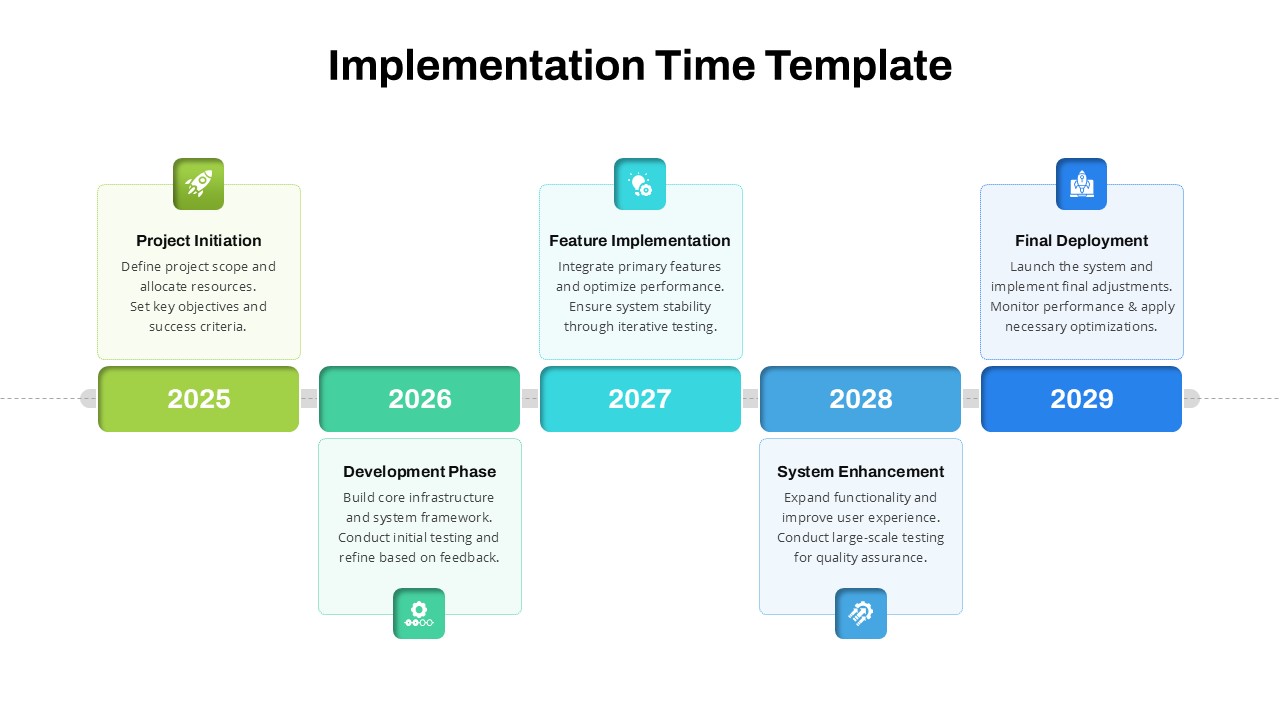
Strategic Implementation Time Timeline Template for PowerPoint & Google Slides
Timeline