Business Process Automation Diagram Template for PowerPoint & Google Slides

Description
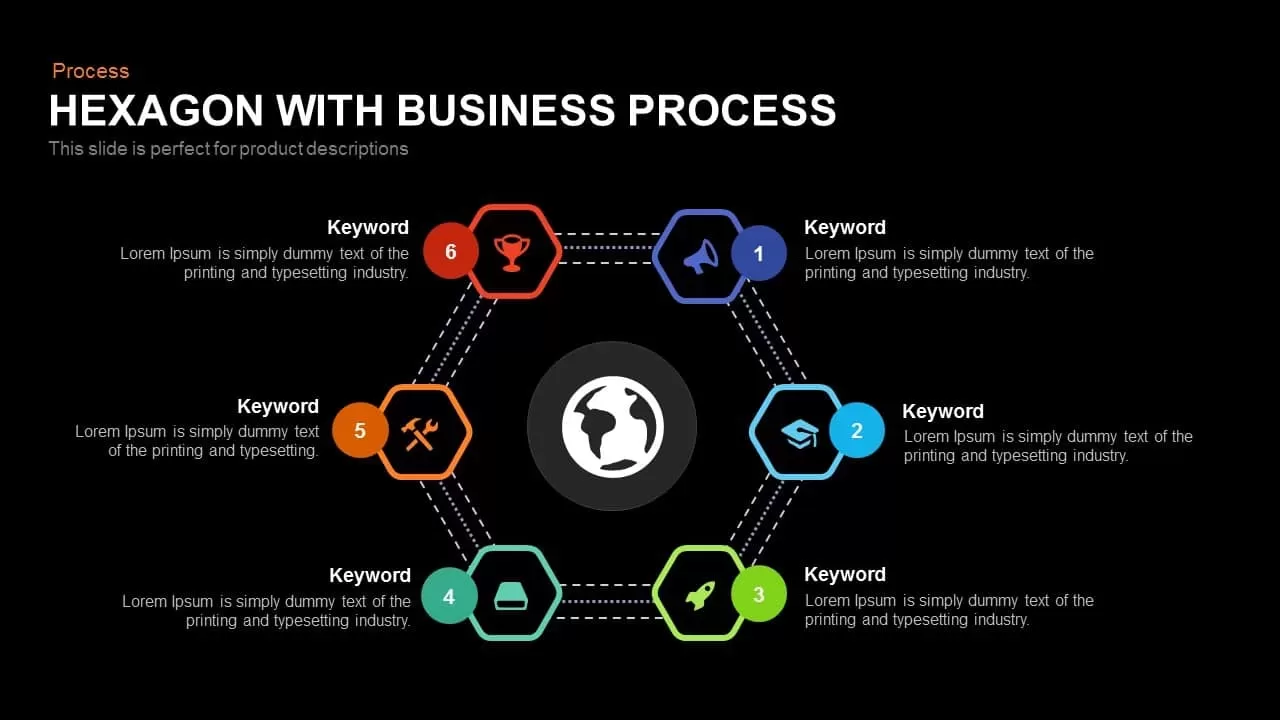
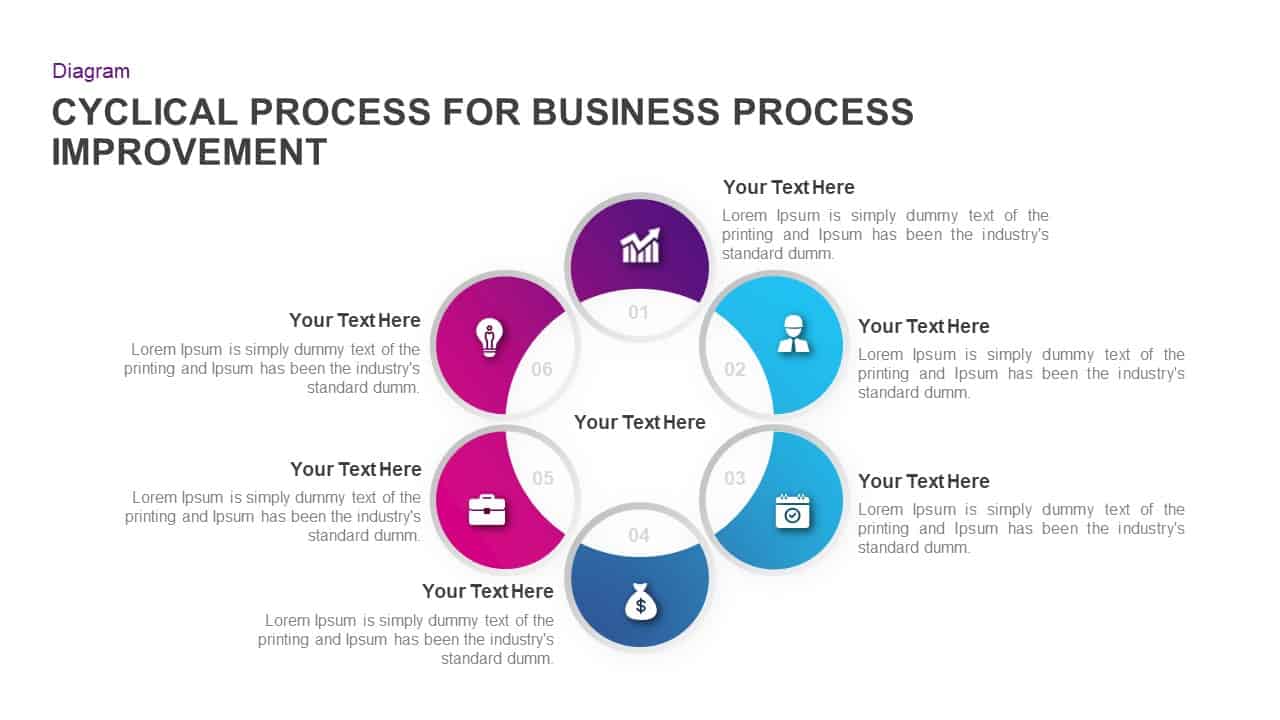
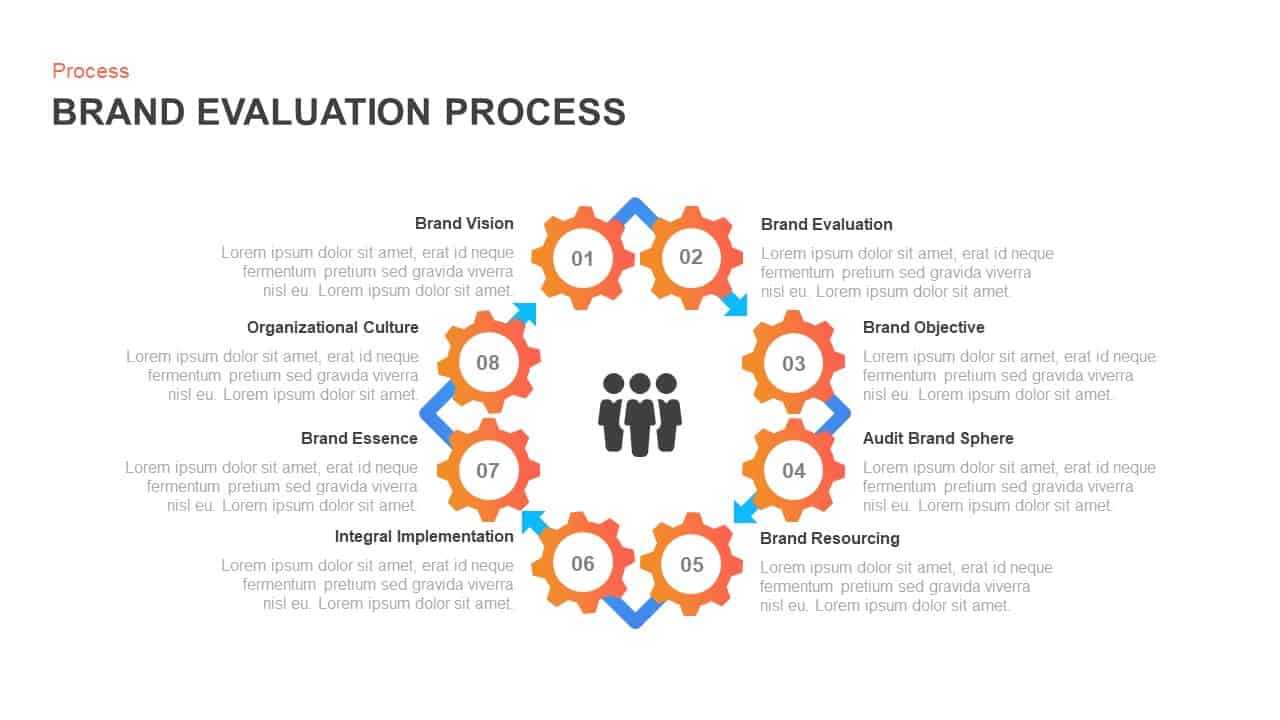
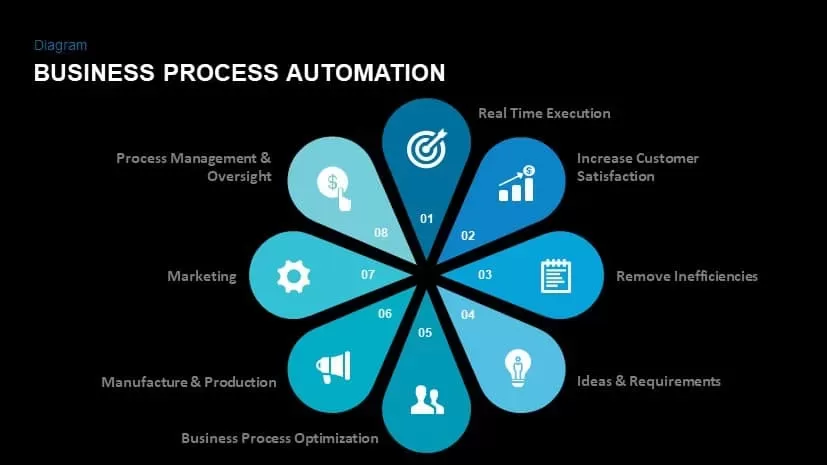
This 8-stage business process automation diagram template offers a visually engaging flower-like layout to represent sequential workflows. Eight gradient petals radiate from a central hub, each containing a distinct icon and step number, guiding viewers through Real Time Execution, Increase Customer Satisfaction, Remove Inefficiencies, Ideas & Requirements, Business Process Optimization, Manufacture & Production, Marketing, and Process Management & Oversight. The combination of clean typography and subtle connector lines enhances readability while maintaining a professional aesthetic.
Built with editable master slides, this asset enables rapid customization of icons, colors, and text placeholders to align with corporate branding. The gradient blue tones create a cohesive visual theme, while customizable guides ensure precise alignment and consistent spacing. Whether you are presenting automation strategies, operational workflows, or optimized procedures, this template scales perfectly across different departments and project types without sacrificing clarity or design integrity.
Optimized for both PowerPoint and Google Slides, this diagram maintains high-resolution fidelity and seamless compatibility on all devices. Collaboration is simplified through intuitive layout structures and preformatted sections that minimize version control issues. Use built-in guides to adjust element sizes or duplicate petals for additional steps. This flexible diagram accelerates slide development and enhances stakeholder engagement by making complex process sequences easy to comprehend and visually compelling.
The flower-shaped radial format draws attention to the interconnected nature of each phase, emphasizing the continuous cycle of automation optimization. By standardizing icons and color gradients, presenters can reinforce key messages and ensure consistency across multiple slides. With this diagram, teams can quickly iterate through process reviews, training sessions, and executive briefings, transforming abstract concepts into structured visuals that drive stakeholder alignment and informed decision-making.
Who is it for
Process improvement specialists, operations managers, and automation engineers will benefit from this diagram for mapping end-to-end procedures and identifying optimization opportunities. Business analysts, project leaders, and IT professionals can leverage the radial design to communicate automation roadmaps, resource allocations, and KPI-driven workflows during executive presentations, stakeholder workshops, or cross-functional team briefings.
Other Uses
Repurpose this template for quality control cycles, compliance audits, performance dashboards, marketing campaign lifecycles, or training modules. Replace icons and labels to illustrate supply chain stages, risk management checkpoints, customer journey mapping, or software deployment pipelines, making this diagram a versatile framework for diverse business scenarios.
Login to download this file

Item ID
SB01053
Related Templates

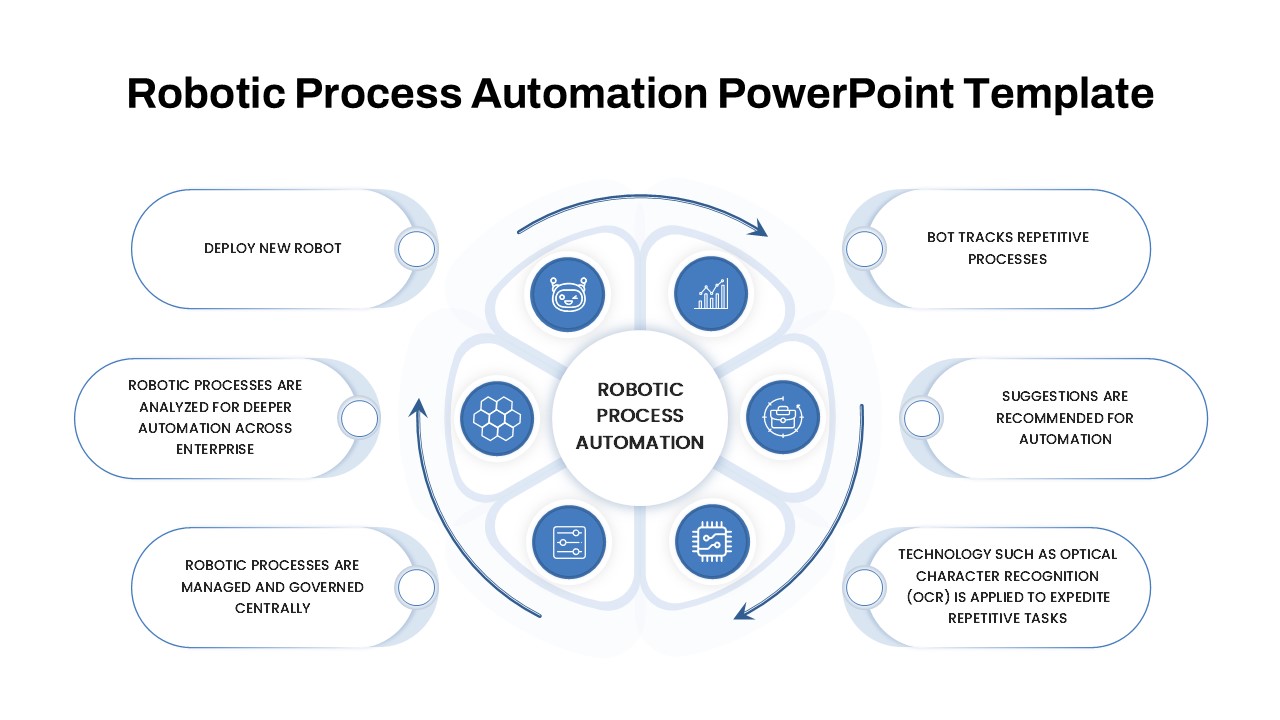
Robotic Process Automation Diagram Template for PowerPoint & Google Slides
Process
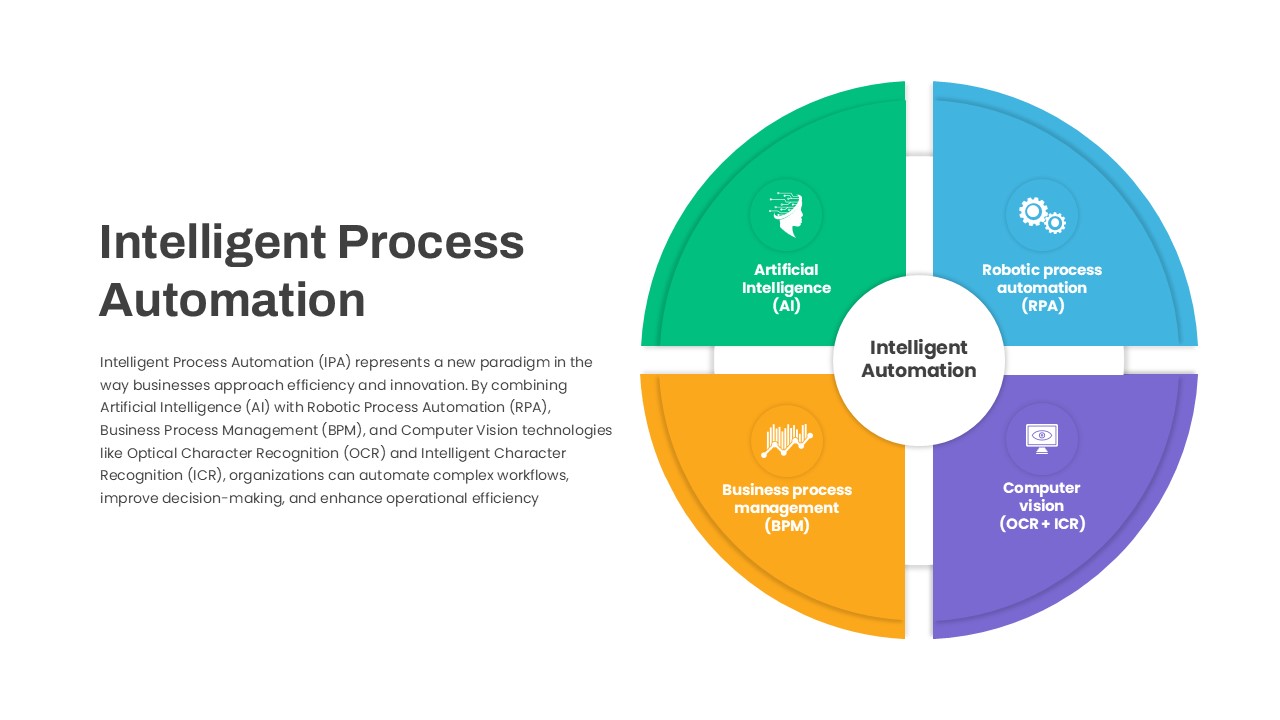
Intelligent Process Automation Diagram Template for PowerPoint & Google Slides
Circular
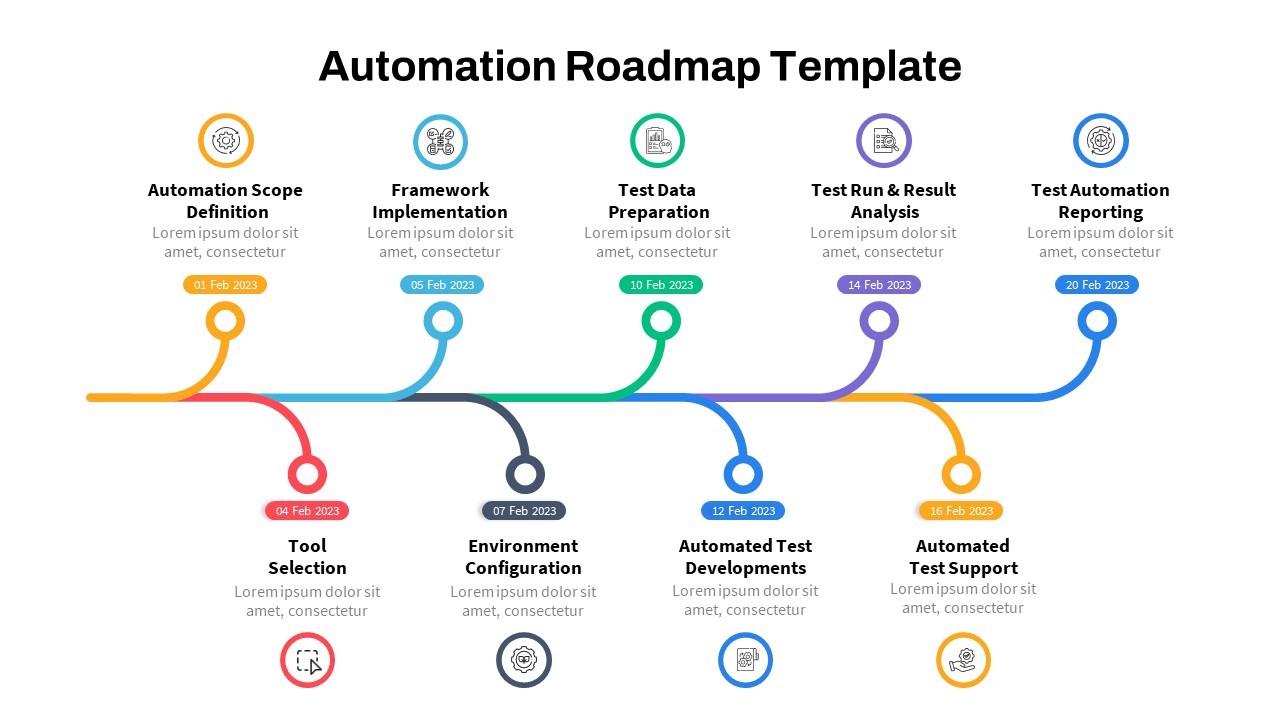
Automation Process Roadmap Infographic Template for PowerPoint & Google Slides
Roadmap
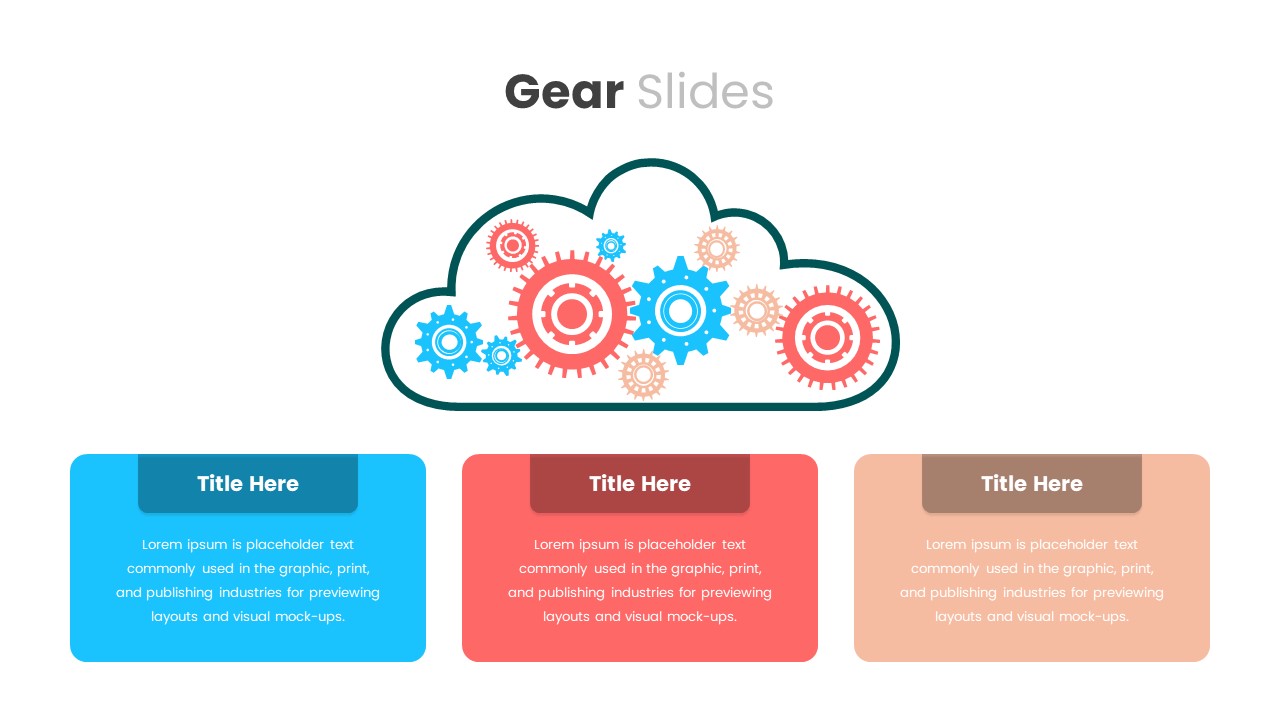
Cloud Gear Automation Diagram Template for PowerPoint & Google Slides
Cloud Computing
Manufacturing And Automation Presentation Template for PowerPoint & Google Slides
Company Profile
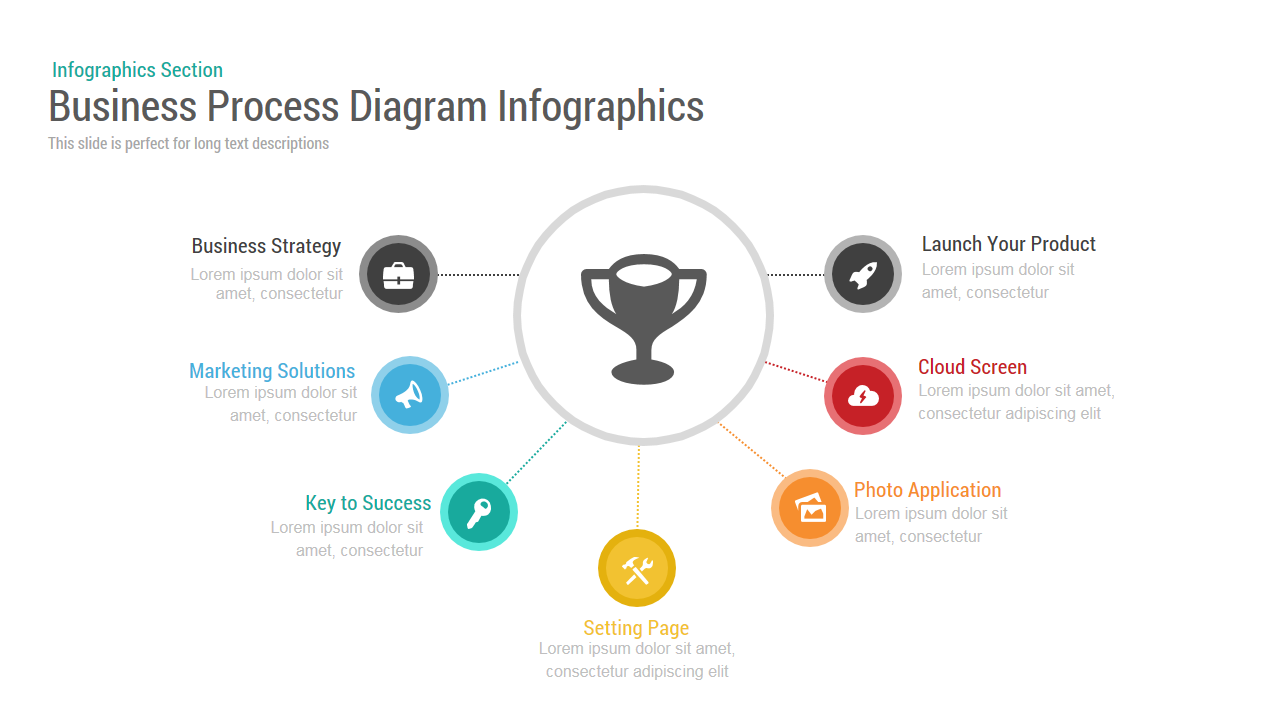
Business Process Diagram template for PowerPoint & Google Slides
Process
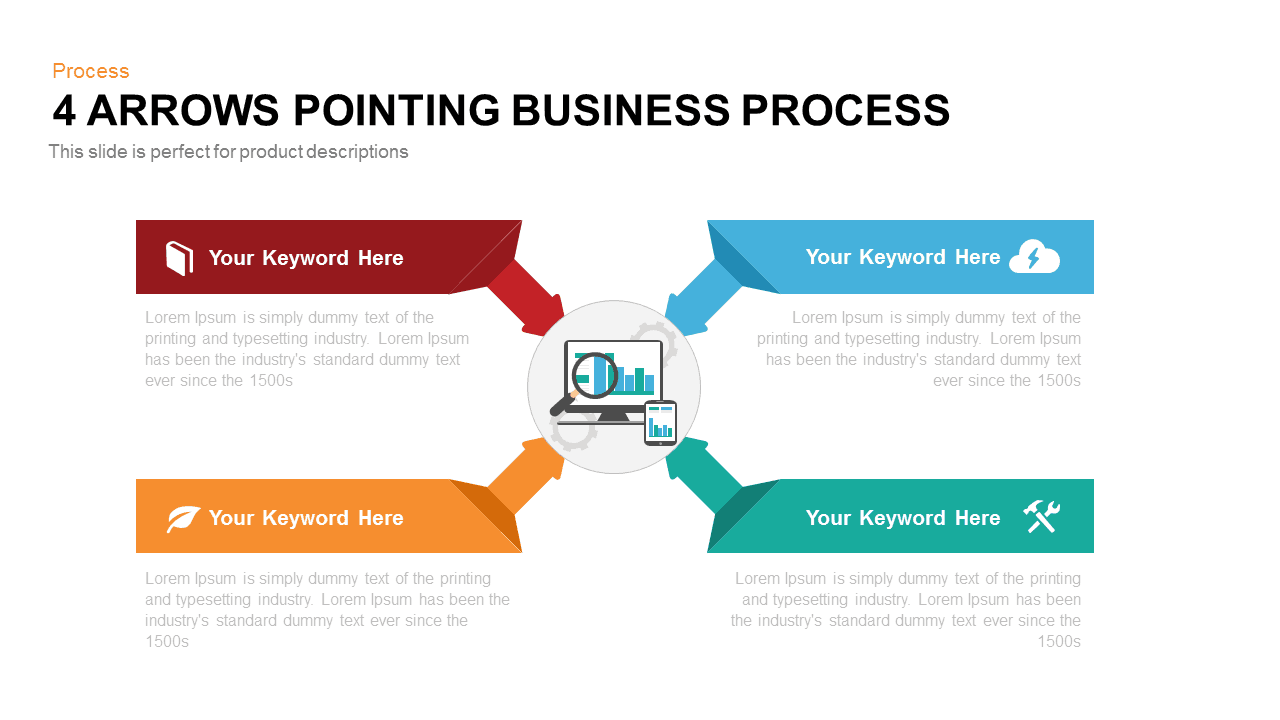
Four Arrows Business Process Diagram template for PowerPoint & Google Slides
Process
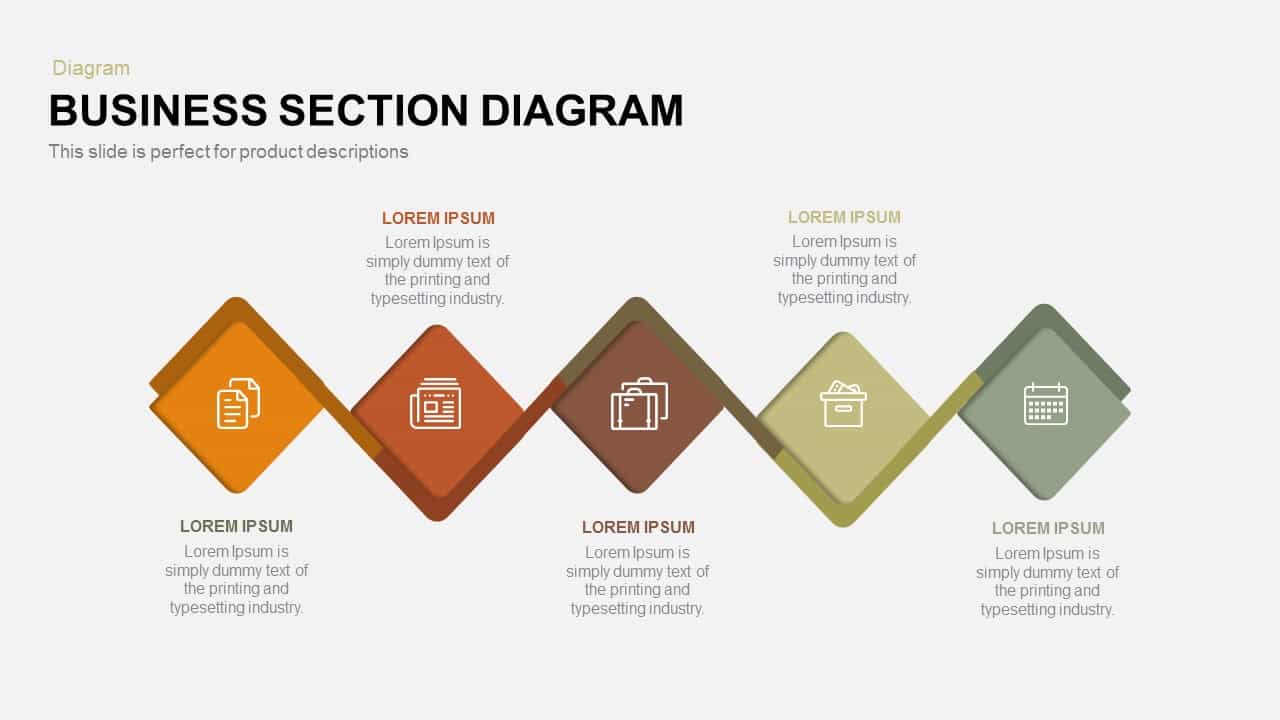
Business Section Diamond Process Diagram Template for PowerPoint & Google Slides
Process
Vertical Business Process Flow Diagram Template for PowerPoint & Google Slides
Process

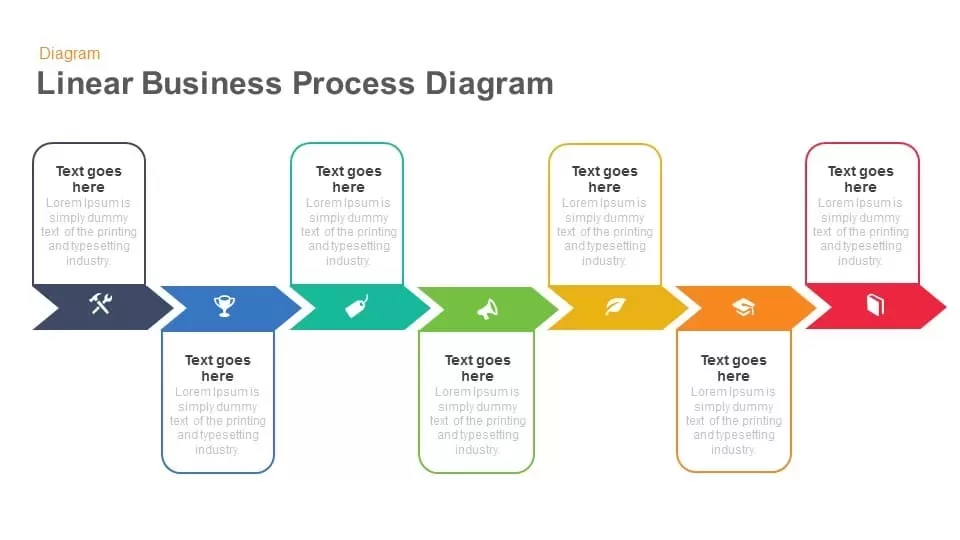
Linear Business Process Diagram template for PowerPoint & Google Slides
Process
10 Stages Business Flow Process Diagram template for PowerPoint & Google Slides
Business
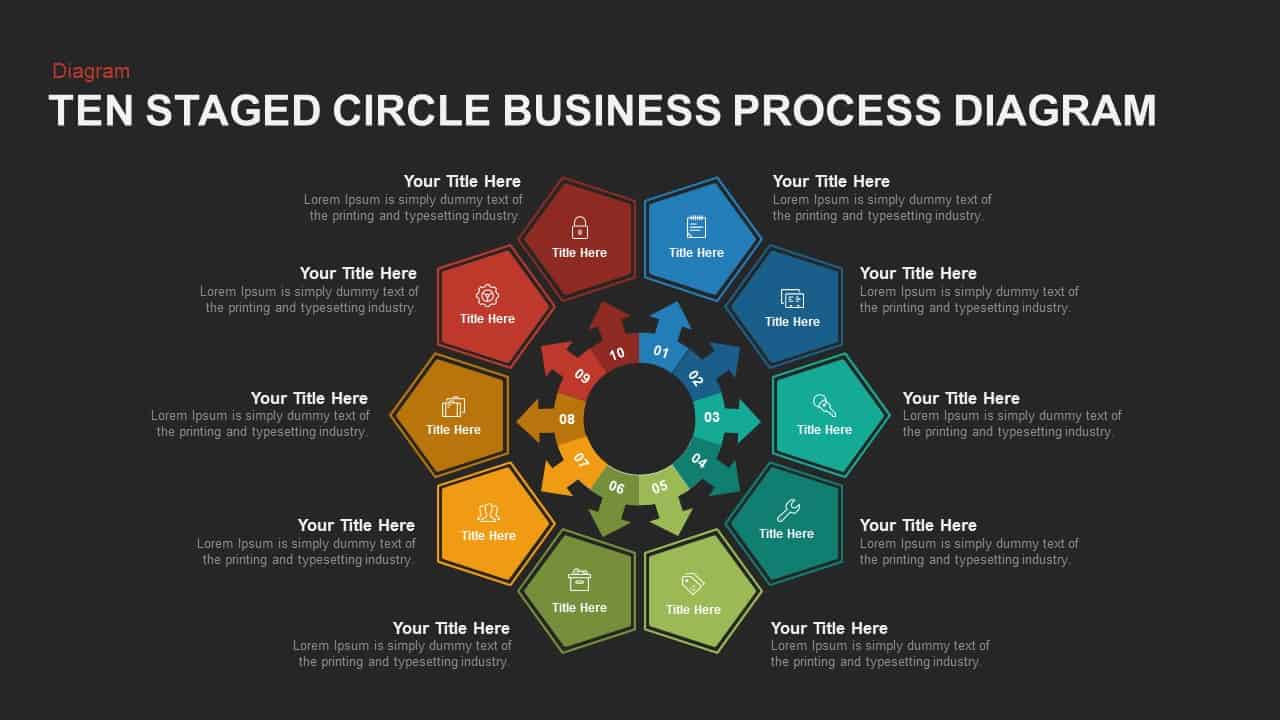
Ten-Stage Business Process Diagram Template for PowerPoint & Google Slides
Process
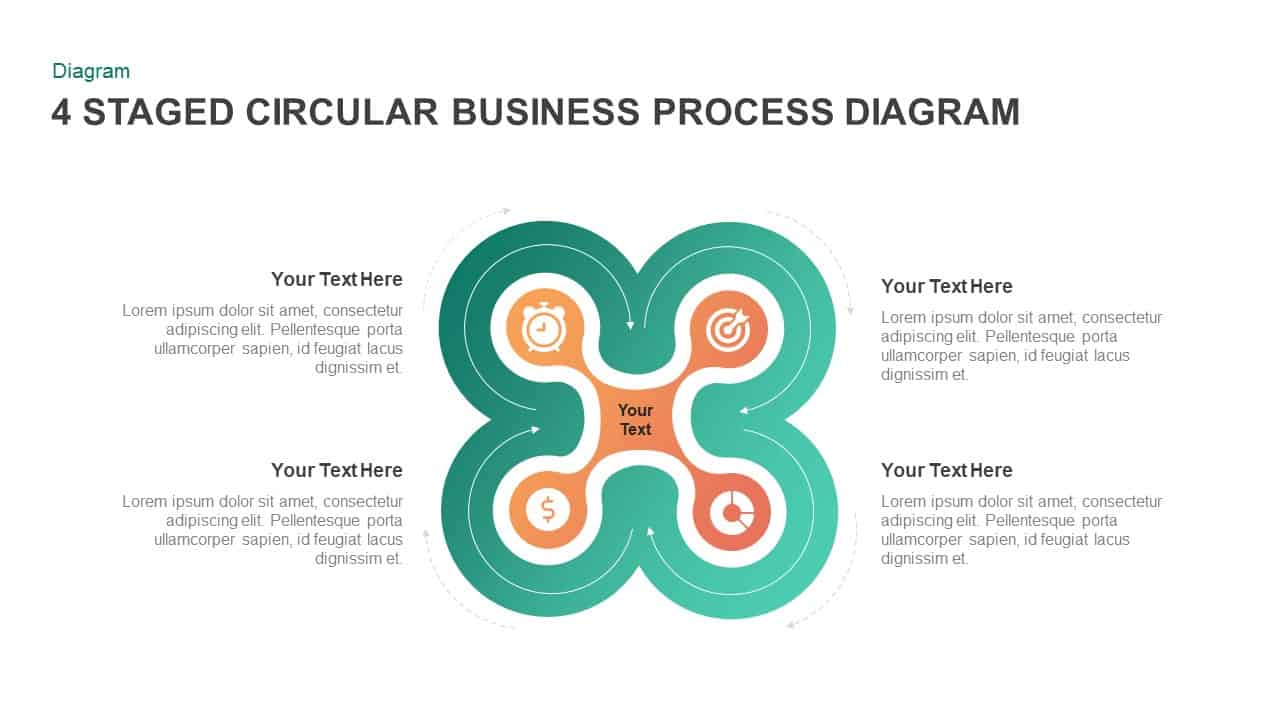
4 Staged Circular Business Process Diagram template for PowerPoint & Google Slides
Process
6-Step Business Process Flow Diagram Template for PowerPoint & Google Slides
Process
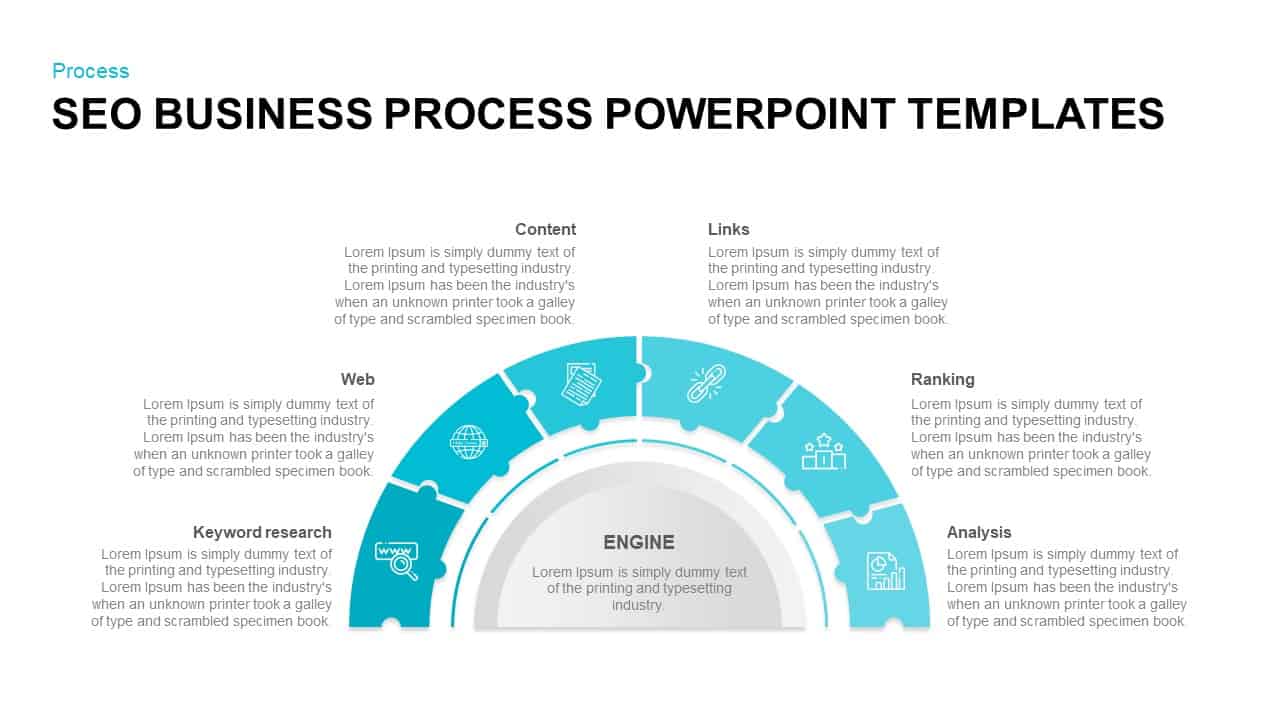
SEO Business Process Puzzle Diagram Template for PowerPoint & Google Slides
Process
Business Process Management Flow Diagram Template for PowerPoint & Google Slides
Process
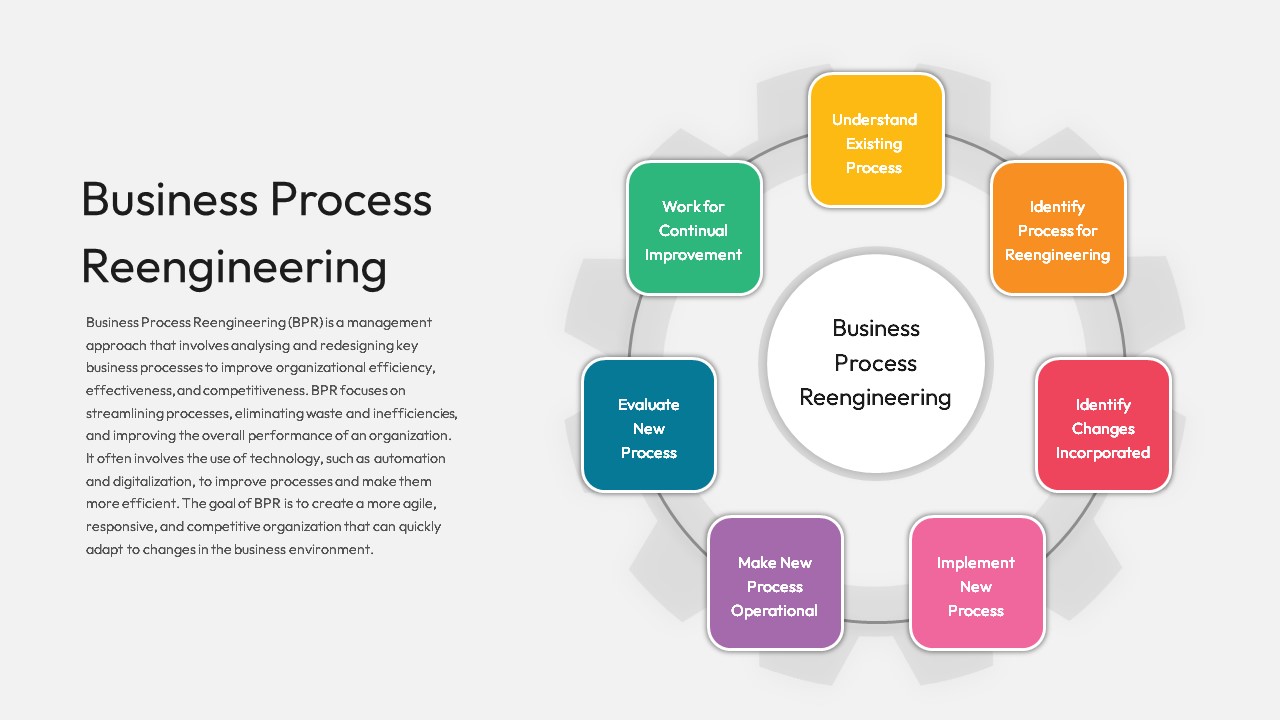
Business Process Reengineering Diagram Template for PowerPoint & Google Slides
Circular
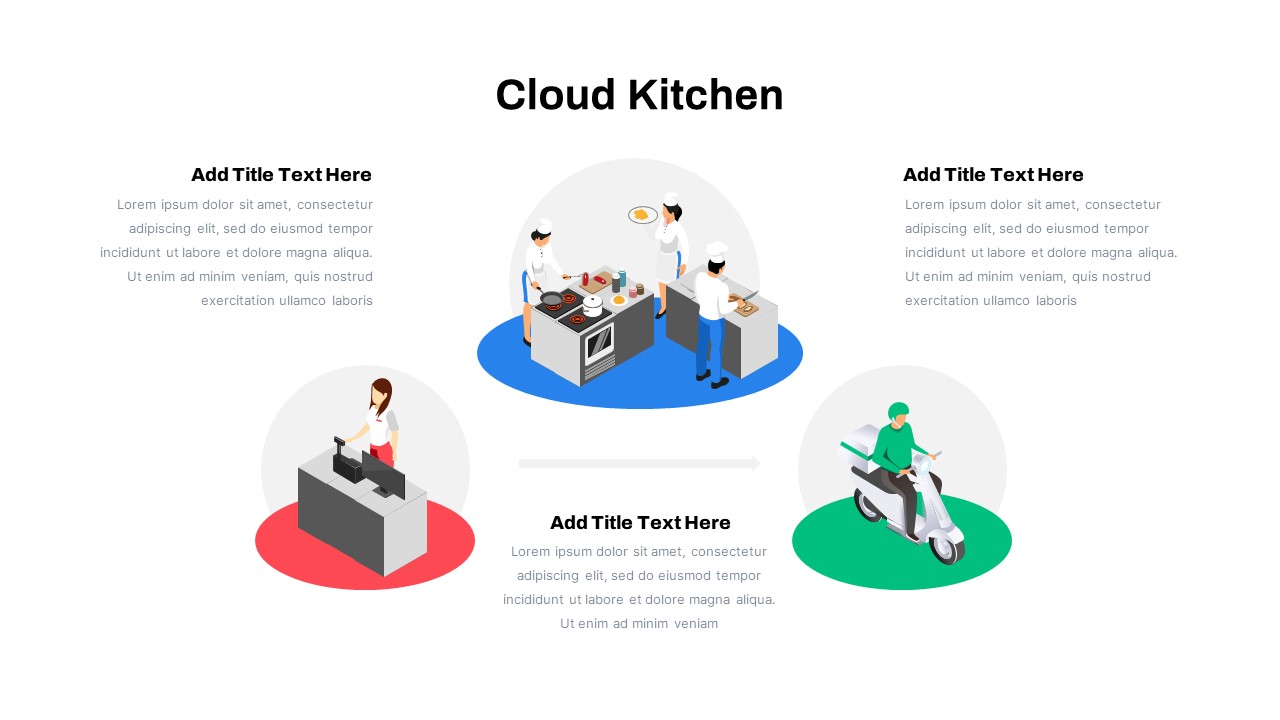
Cloud Kitchen Business Process Diagram Template for PowerPoint & Google Slides
Process
Business Process Analysis Cycle Diagram Template for PowerPoint & Google Slides
Business Strategy
4 Staged Circular Business Process Diagram for PowerPoint & Google Slides
Process
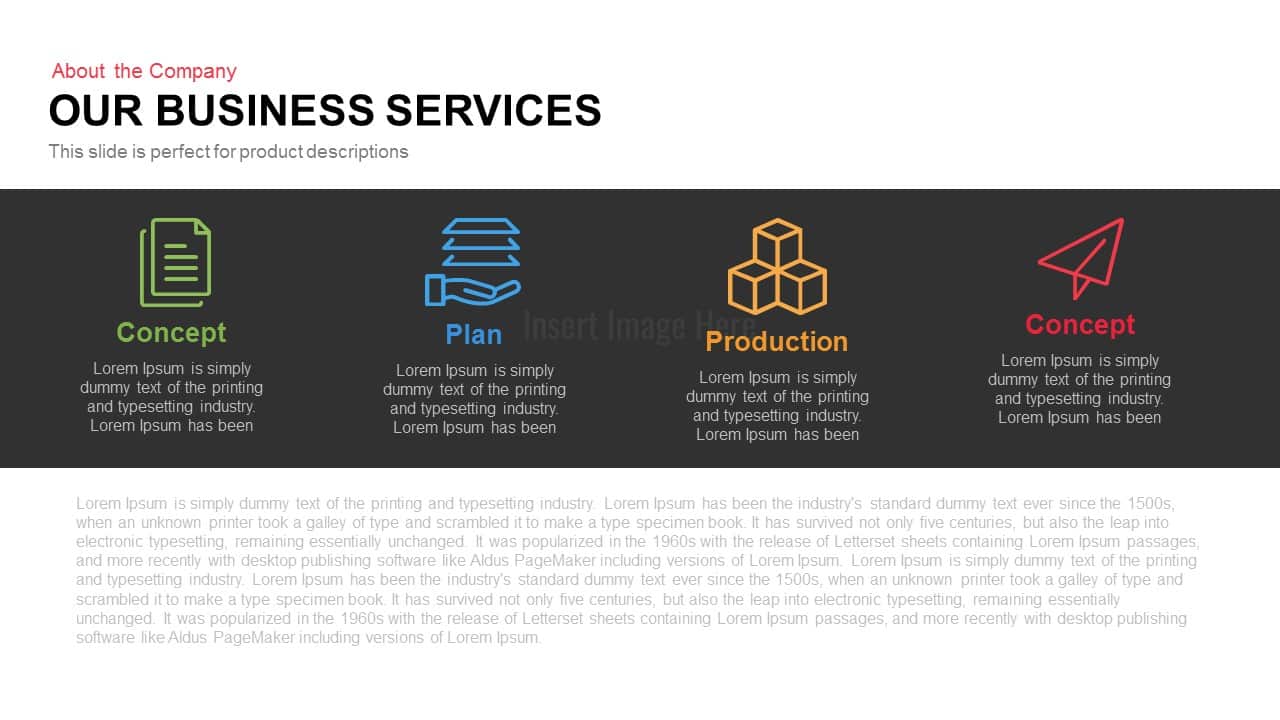
Business Services 4-Step Process Template for PowerPoint & Google Slides
Process
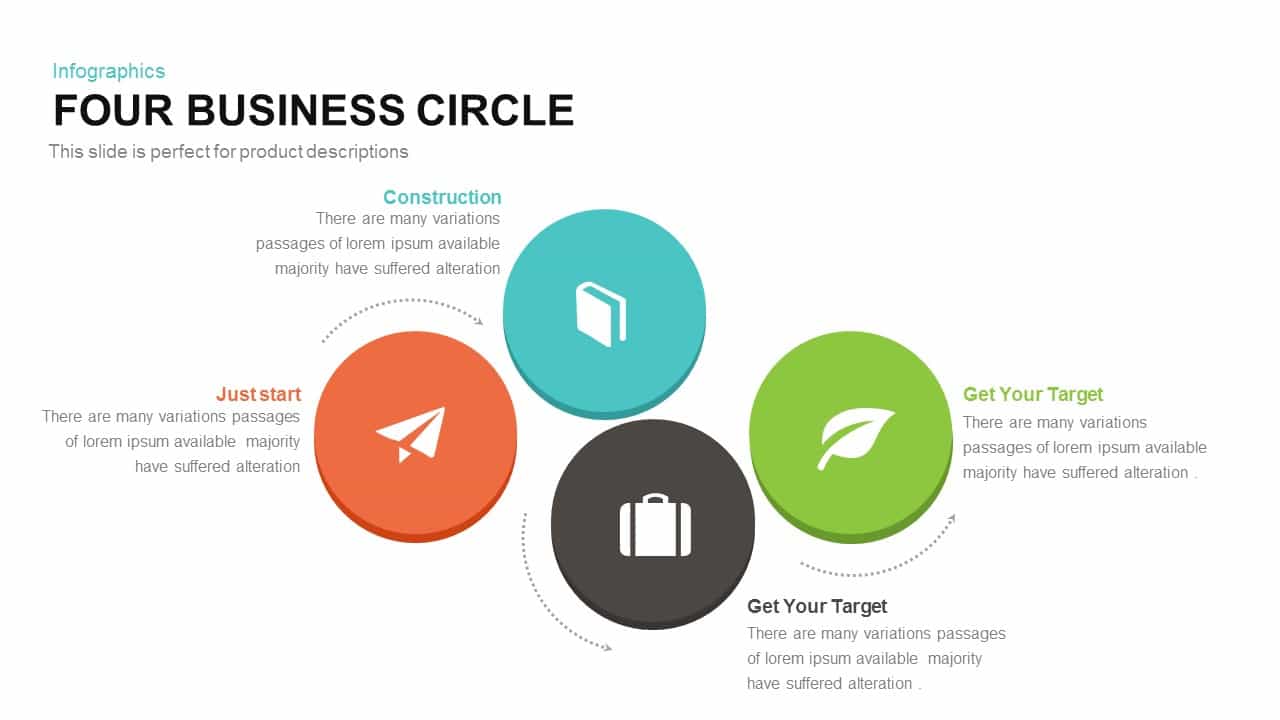
Four-Circle Business Process Infographic Template for PowerPoint & Google Slides
Circular
Global Hexagon Six-Step Business Process Template for PowerPoint & Google Slides
Process
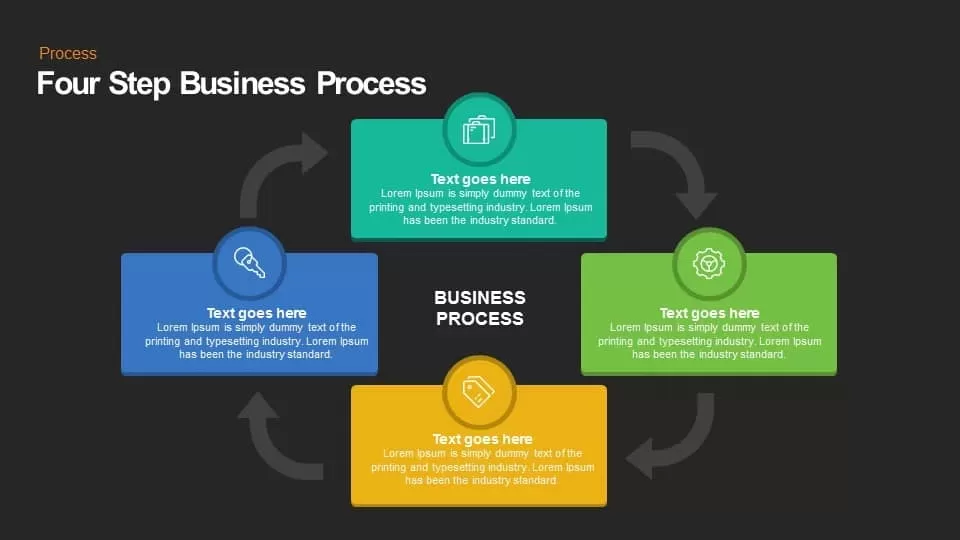
Four Step Business Process template for PowerPoint & Google Slides
Process

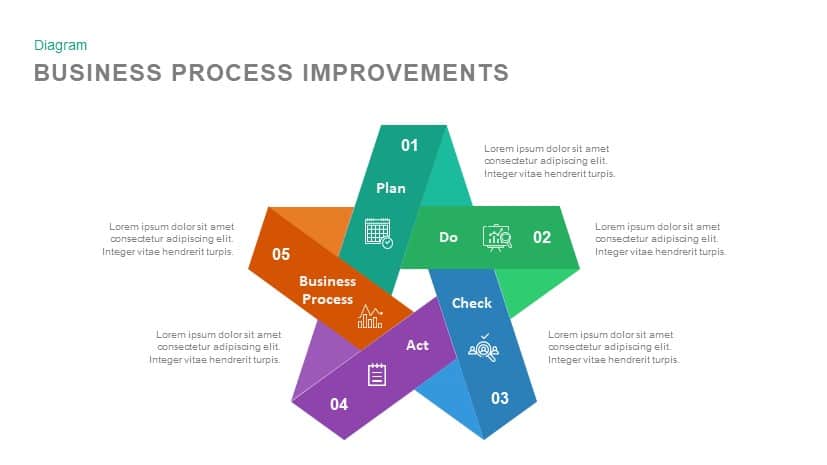
Business Process Improvements template for PowerPoint & Google Slides
Process
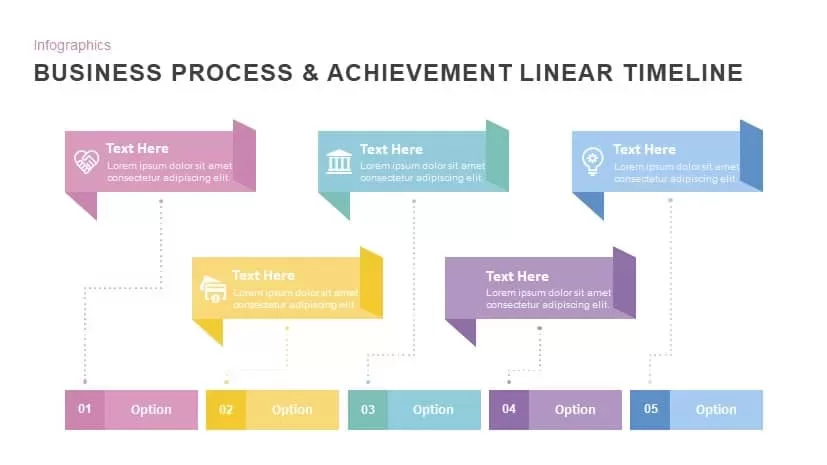
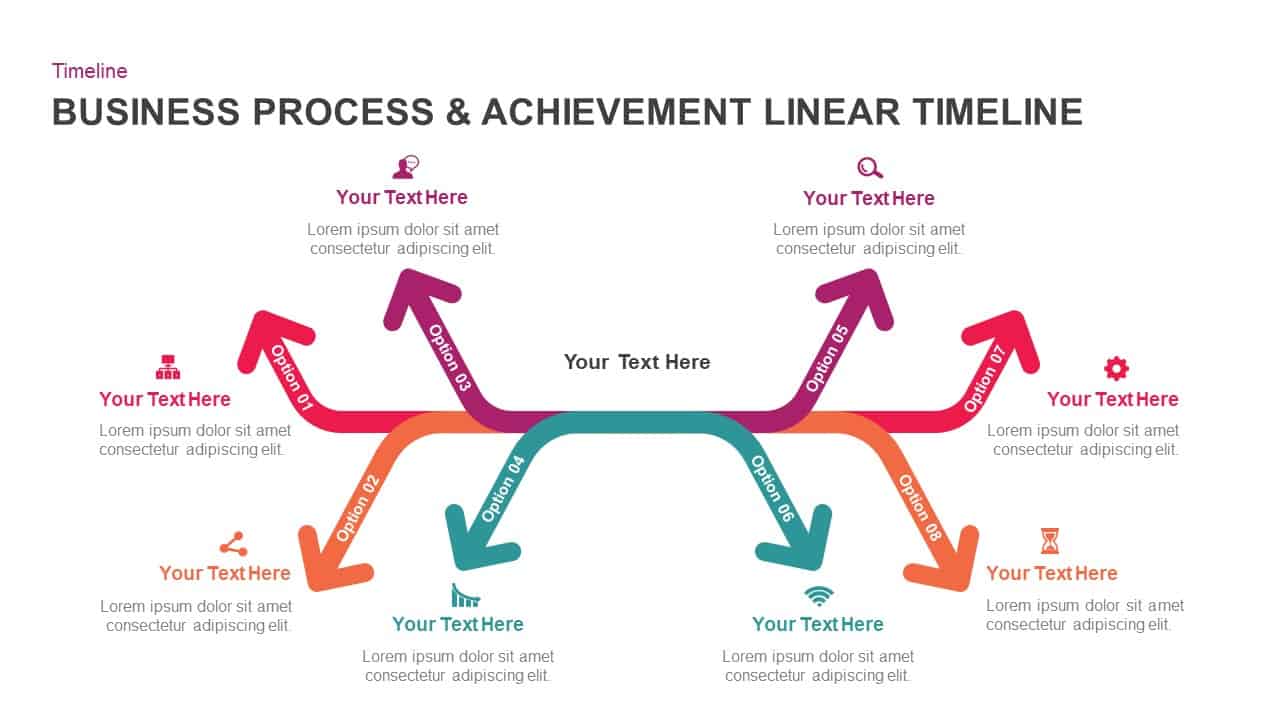
Business Process & Achievement Linear Timeline template for PowerPoint & Google Slides
Timeline
Business Process Improvement Cycle Template for PowerPoint & Google Slides
Process
7-Stage Zig-Zag Business Process Template for PowerPoint & Google Slides
Process
Four-Step Hourglass Business Process Template for PowerPoint & Google Slides
Process
Business System Five-Step Process Template for PowerPoint & Google Slides
Process
Business Process Improvement Cycle Template for PowerPoint & Google Slides
Circular
Business Process Achievement Timeline Template for PowerPoint & Google Slides
Timeline
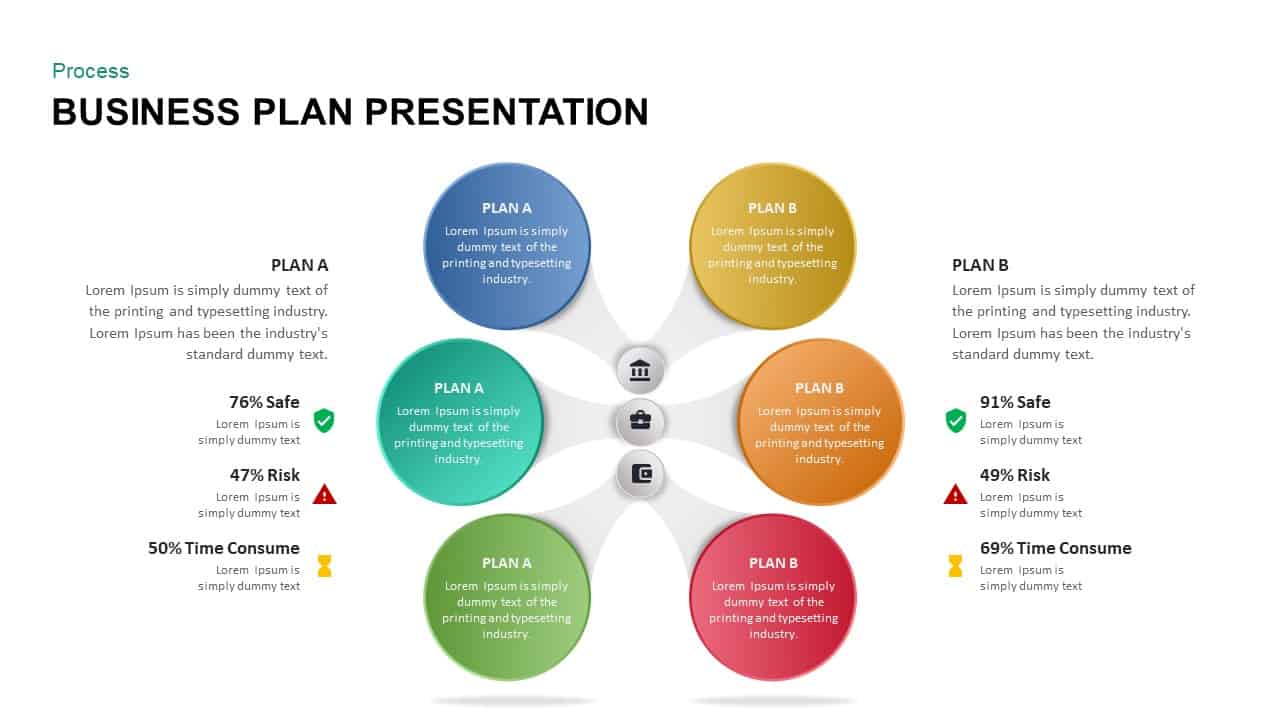
Business Plan Presentation Process template for PowerPoint & Google Slides
Business Plan
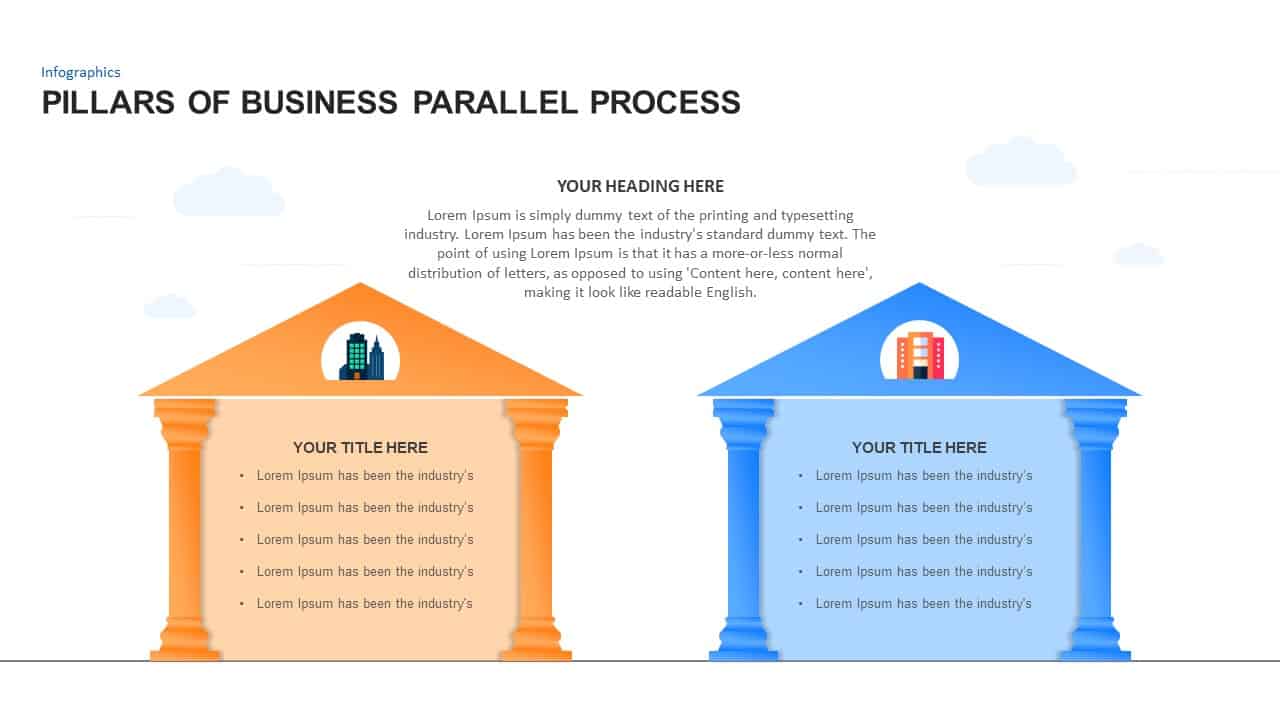
Pillars of Business Parallel Process template for PowerPoint & Google Slides
Process
Business Process Reengineering Cycle Template for PowerPoint & Google Slides
Circular
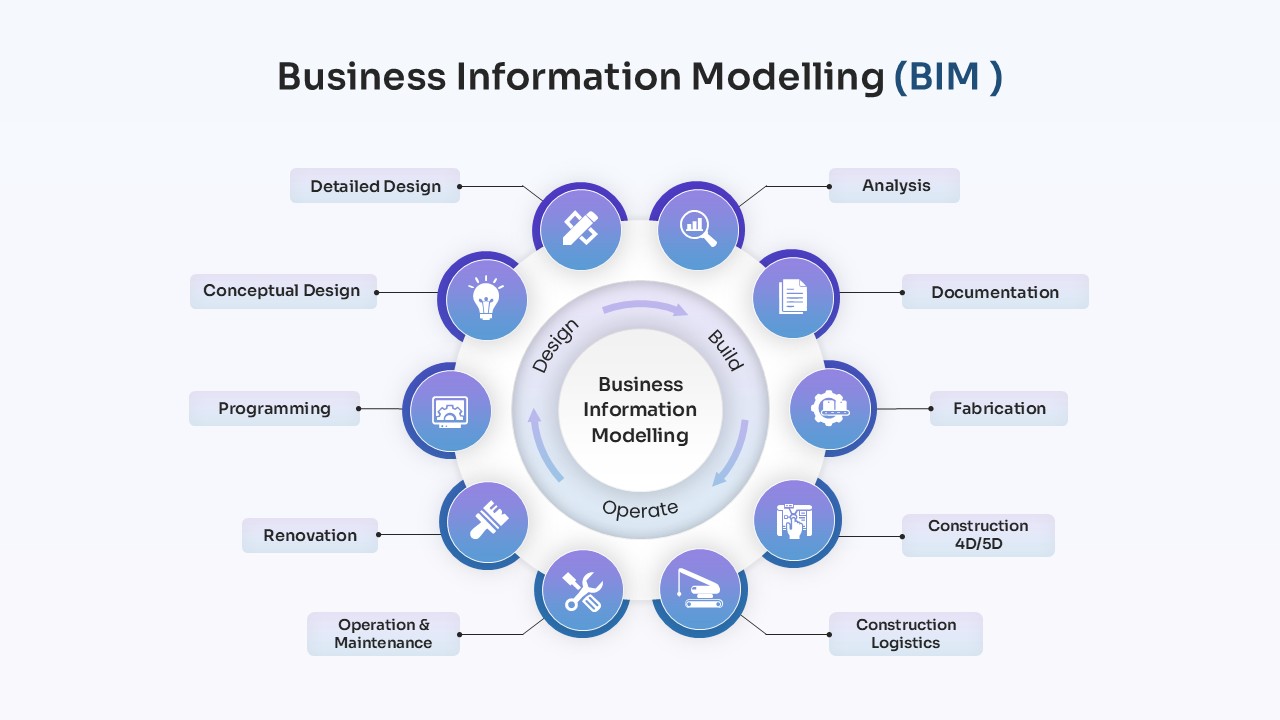
Business Information Modelling Process Template for PowerPoint & Google Slides
Process
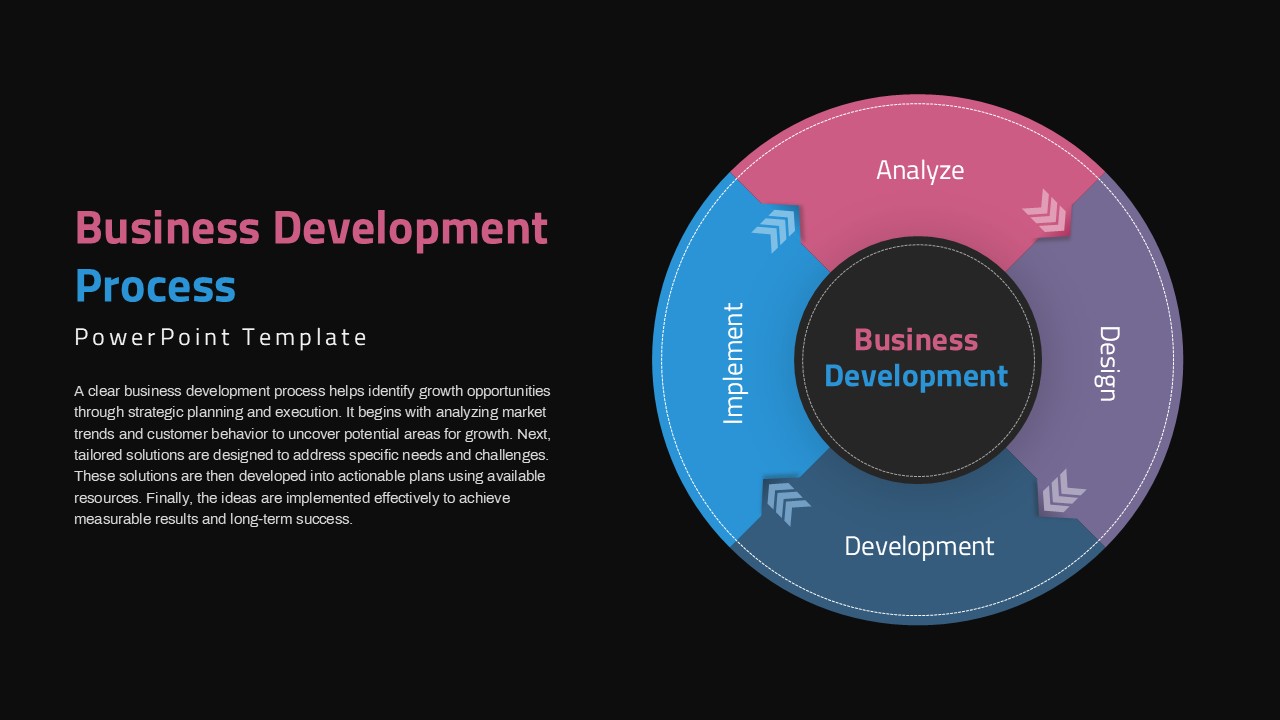
Circular Business Development Process Template for PowerPoint & Google Slides
Process
Gear Process Diagram PowerPoint Template for PowerPoint & Google Slides
Process
Sales Process Workflow Funnel Diagram PowerPoint Template for PowerPoint & Google Slides
Funnel
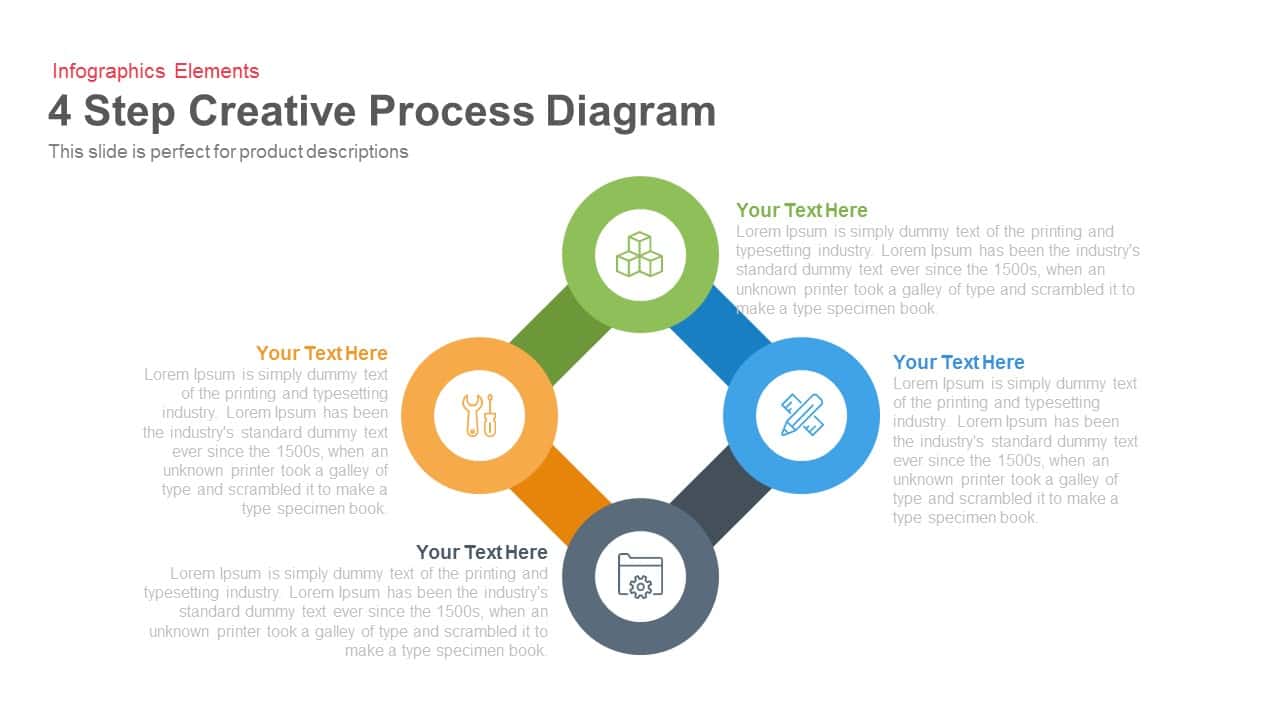
4 Step Creative Process Diagram Template for PowerPoint & Google Slides
Infographics
4 Section Pipe Diagram Process Flow Template for PowerPoint & Google Slides
Process
Dynamic Shield Process Flow Diagram template for PowerPoint & Google Slides
Process
Six Arrow Radial Process Diagram template for PowerPoint & Google Slides
Infographics
4 Step 3D Circular Process Diagram template for PowerPoint & Google Slides
Process
Three-Section Fishbone Process Diagram template for PowerPoint & Google Slides
Process
Six Stage Zigzag Process Diagram Template for PowerPoint & Google Slides
Process

15-Step Process Flow Diagram Template for PowerPoint & Google Slides
Process
Roadmap Six-Step Process Diagram Template for PowerPoint & Google Slides
Roadmap
3 Stage Section Process Diagram Template for PowerPoint & Google Slides
Process
Four-Circle Venn Process Diagram template for PowerPoint & Google Slides
Process
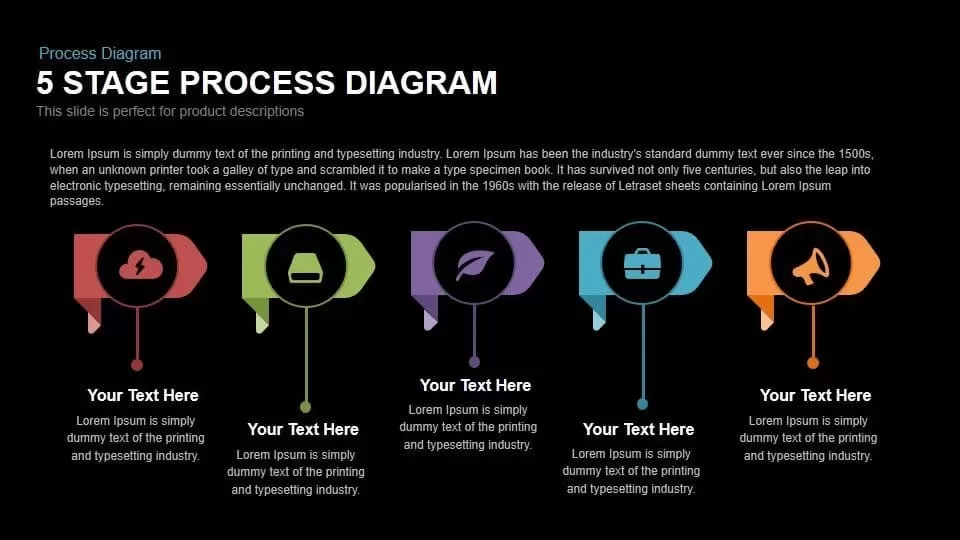
5 Stage Process Diagram Slide Overview Template for PowerPoint & Google Slides
Process
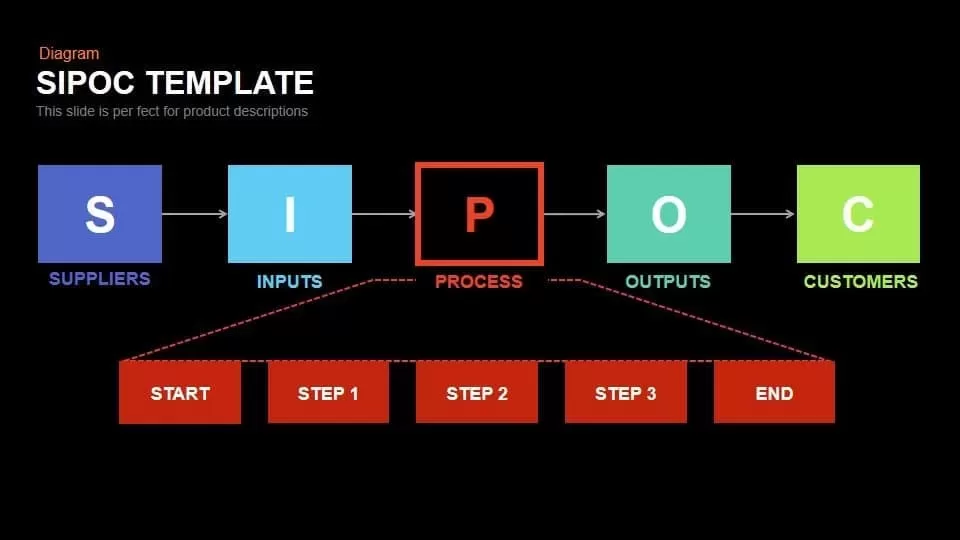
SIPOC Diagram with Process Breakdown Template for PowerPoint & Google Slides
Process
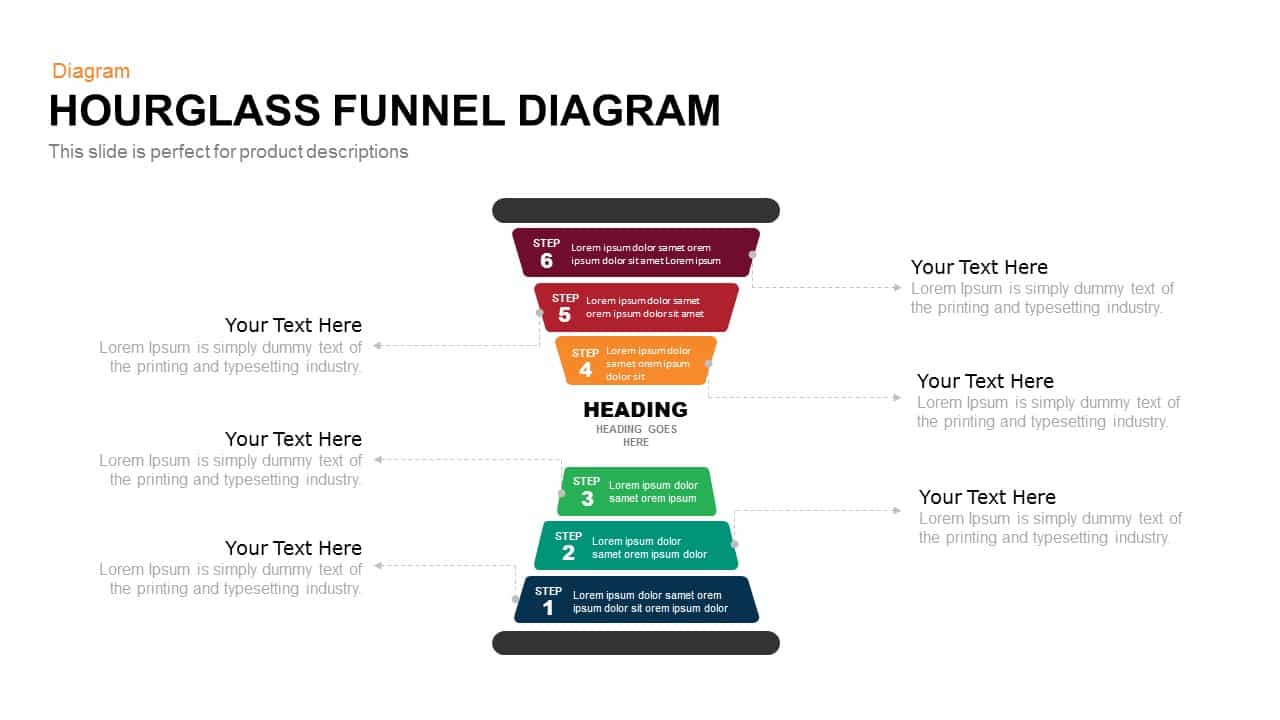
Hourglass Funnel Diagram Process Template for PowerPoint & Google Slides
Funnel
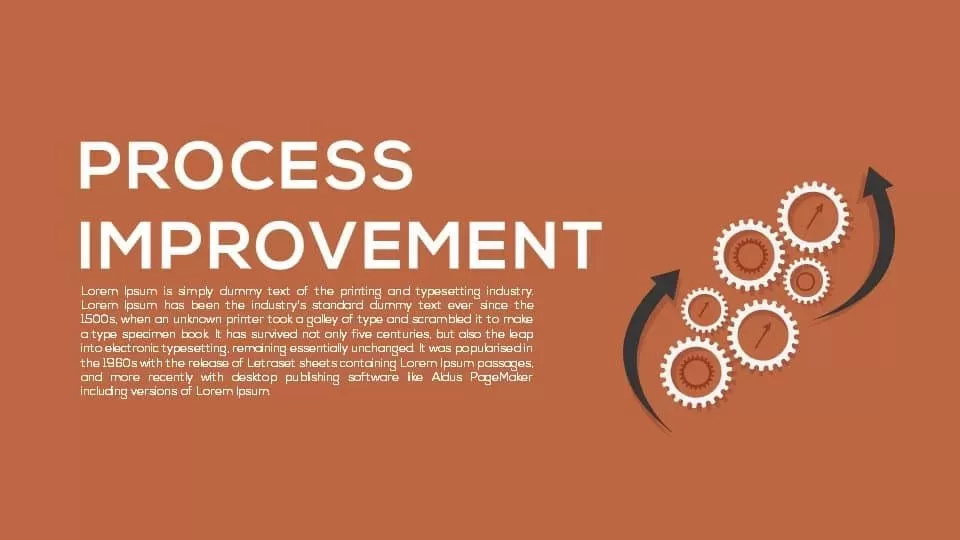
Process Improvement Metaphor Diagram Template for PowerPoint & Google Slides
Process
Engaging Five-Stage Process Diagram Template for PowerPoint & Google Slides
Process
8 Steps Arrow Process Diagram template for PowerPoint & Google Slides
Process
Five Stage Process Diagram template for PowerPoint & Google Slides
Process
Free

Five-Stage Cyclic Process Arrow Diagram Template for PowerPoint & Google Slides
Process
Ten-Stage Hub and Spoke Process Diagram Template for PowerPoint & Google Slides
Process
DevOps Infinity Loop Process Diagram Template for PowerPoint & Google Slides
Process
Five-Stage Linear Process Flow Diagram Template for PowerPoint & Google Slides
Process
Four-Stage Cycle Process Diagram Template for PowerPoint & Google Slides
Process
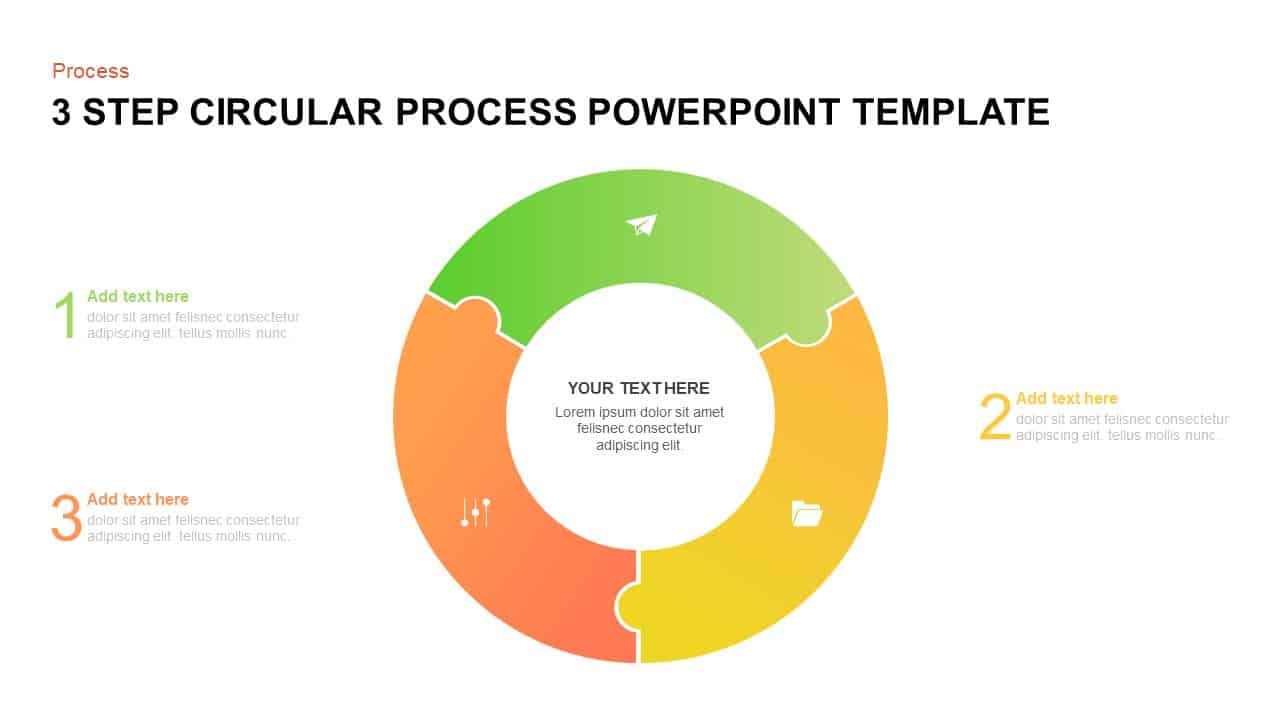
Five-Step Circular Process Diagram Template for PowerPoint & Google Slides
Circular
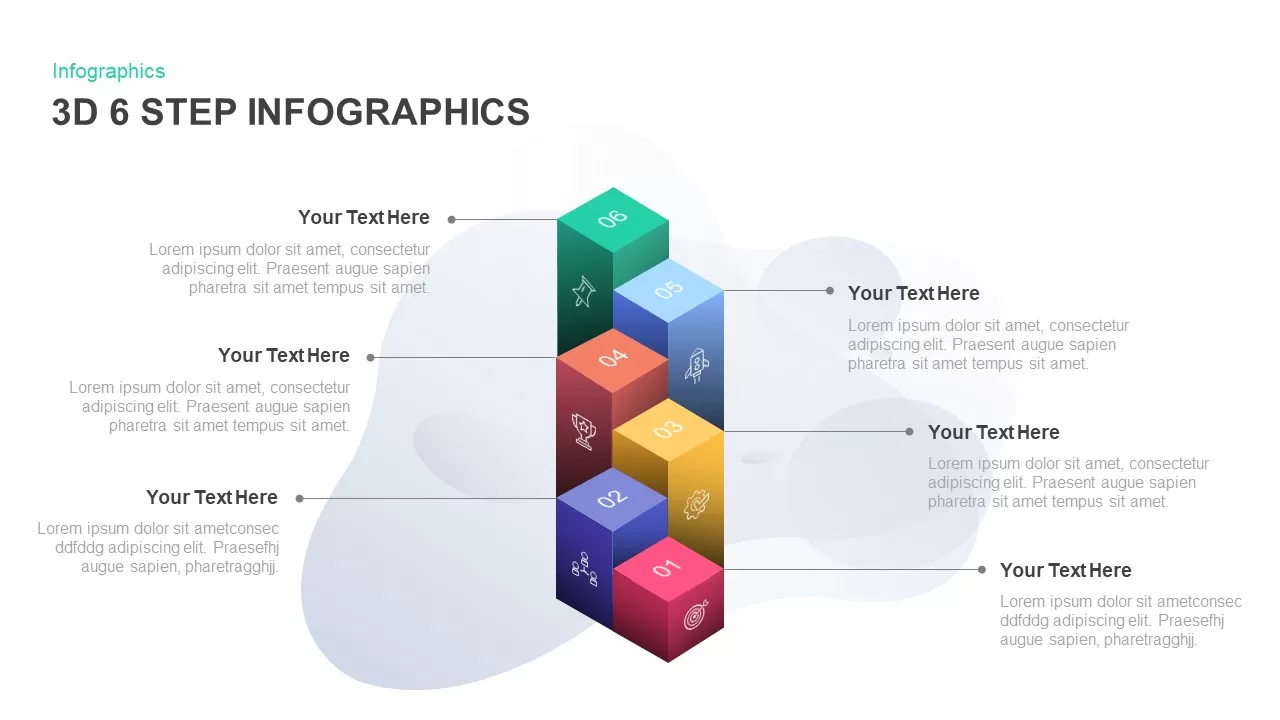
3D 6-Step Infographics Process Diagram Template for PowerPoint & Google Slides
Infographics
Three to Nine-Step Puzzle Ring Process Diagram Template for PowerPoint & Google Slides
Circular
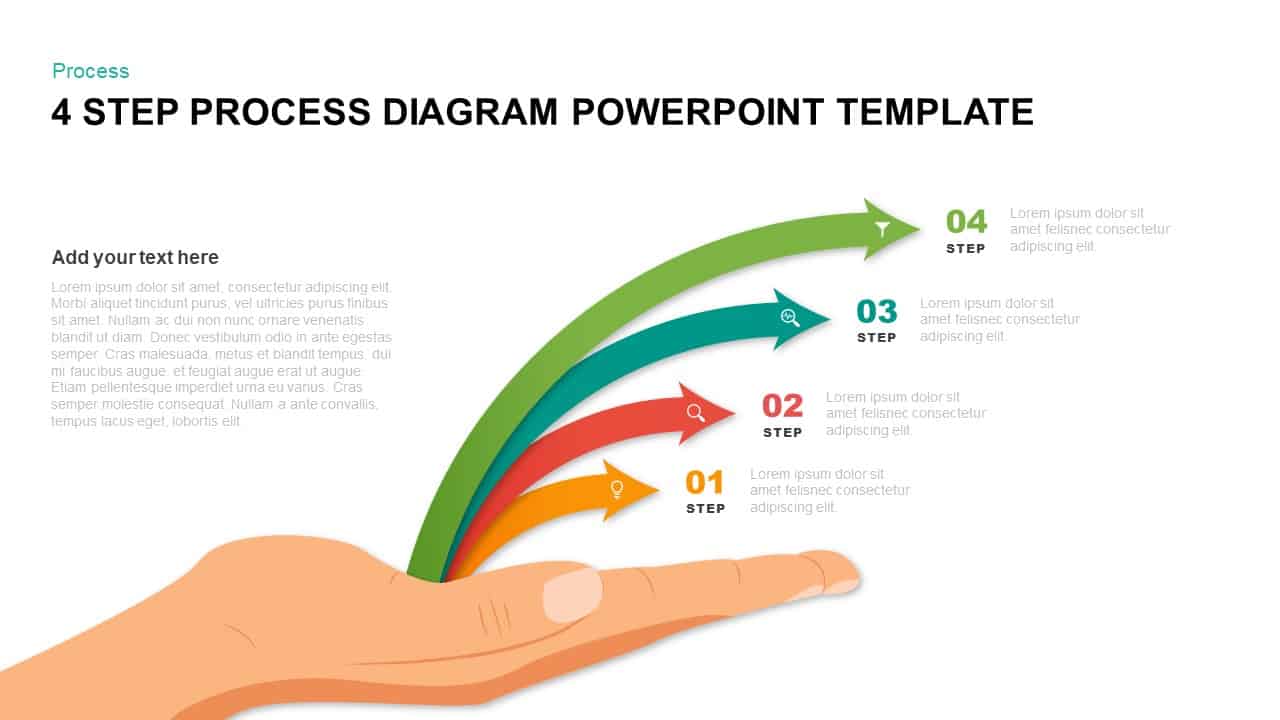
Hand-Held Four-Step Process Diagram Template for PowerPoint & Google Slides
Process
4 Stage Linear Process Flow Diagram Template for PowerPoint & Google Slides
Process
8-Stage Brand Evaluation Process Diagram Template for PowerPoint & Google Slides
Process
8 Step Circular Process Flow Diagram Template for PowerPoint & Google Slides
Process
6-Step Circular Process Flow Diagram Template for PowerPoint & Google Slides
Process
Six-Step Infinity Loop Process Diagram Template for PowerPoint & Google Slides
Process
Six-Circle Process Infographic Diagram Template for PowerPoint & Google Slides
Circular
Vertical 4-Step Puzzle Process Diagram Template for PowerPoint & Google Slides
Process

Circular CRM Process Infographic Diagram Template for PowerPoint & Google Slides
Circular
Modern 4 Section Process Diagram Template for PowerPoint & Google Slides
Process
Communication Cycle Process Diagram template for PowerPoint & Google Slides
Business
Fishbone Process Diagram template for PowerPoint & Google Slides
Infographics
Snowball Effect Process Diagram Template for PowerPoint & Google Slides
Process
Three-Step Curved Arrow Process Diagram Template for PowerPoint & Google Slides
Arrow
Circular Arrow Process Diagram Template for PowerPoint & Google Slides
Circular
Five-Node Hub & Spoke Diagram Process Template for PowerPoint & Google Slides
Business Models
Chain Link Process Infographic Diagram Template for PowerPoint & Google Slides
Process
10-Step Circular Process Diagram Template for PowerPoint & Google Slides
Process
Creative Brainstorming Process Diagram Template for PowerPoint & Google Slides
Process
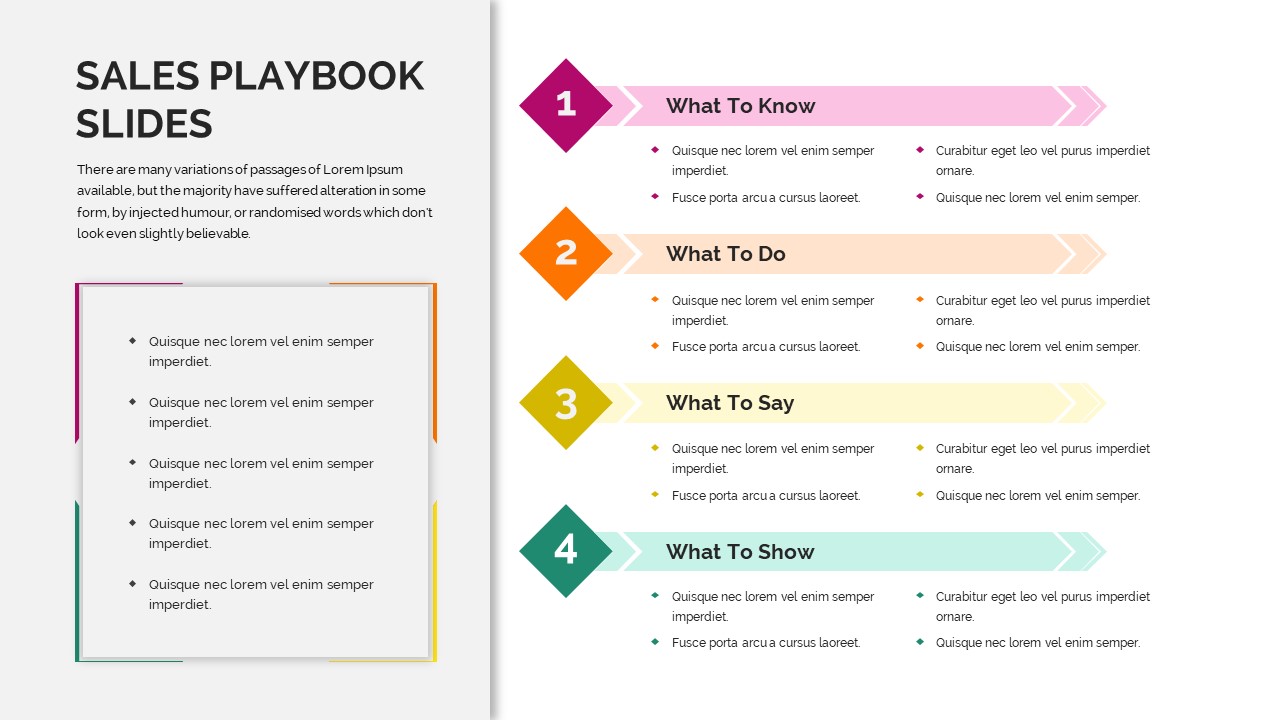
Sales Playbook Process Steps Diagram Template for PowerPoint & Google Slides
Marketing
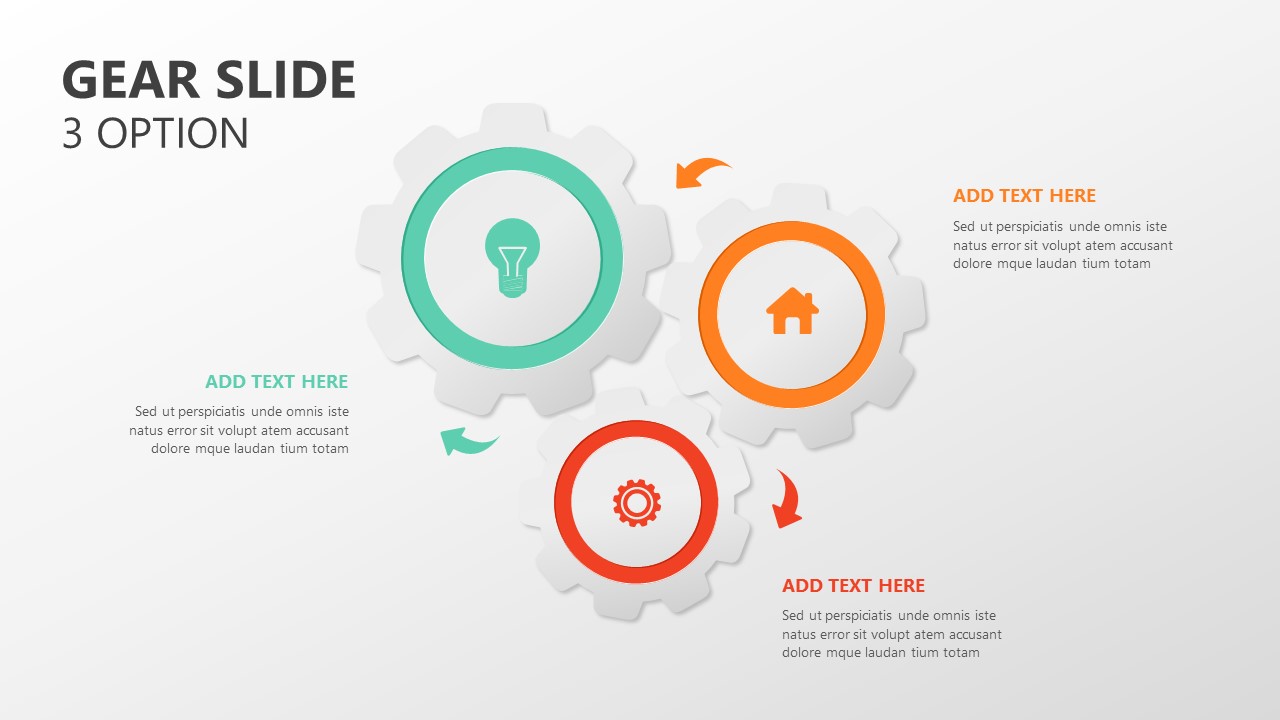
Gear Process Diagram Template for PowerPoint & Google Slides
Process
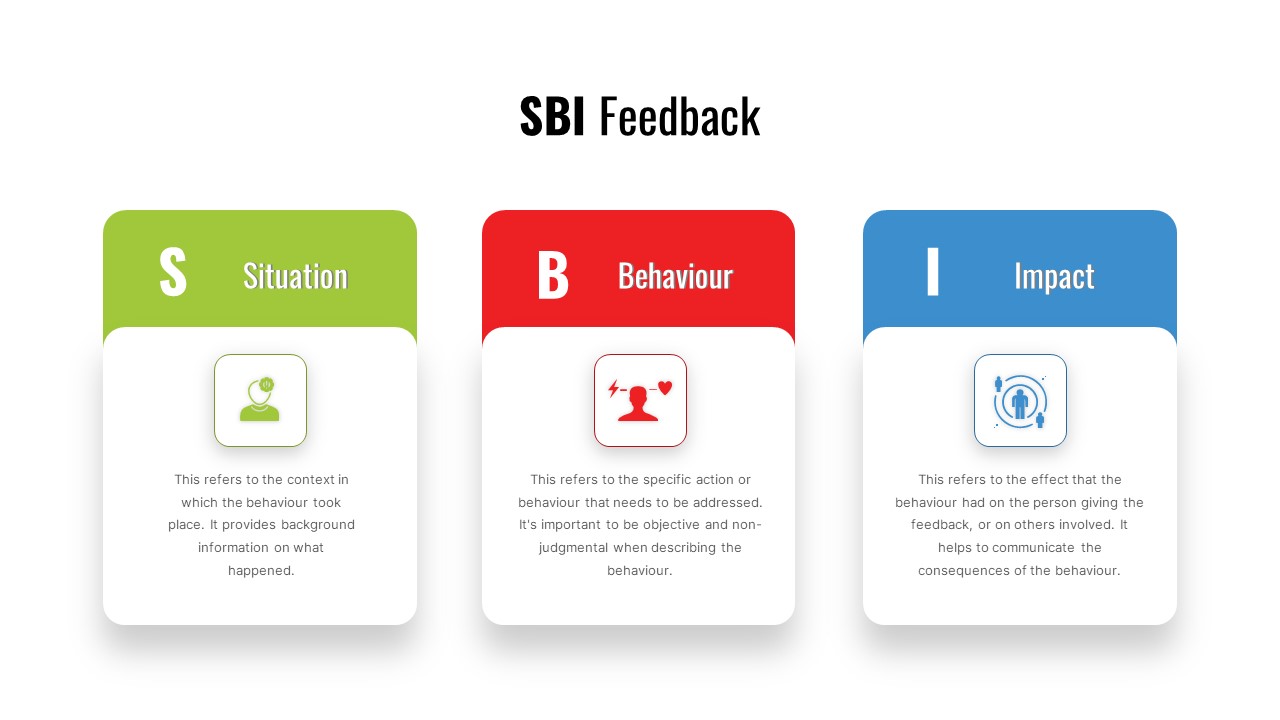
SBI Feedback Model Process Diagram Template for PowerPoint & Google Slides
Process
Simple Flowchart Process Diagram Template for PowerPoint & Google Slides
Flow Charts
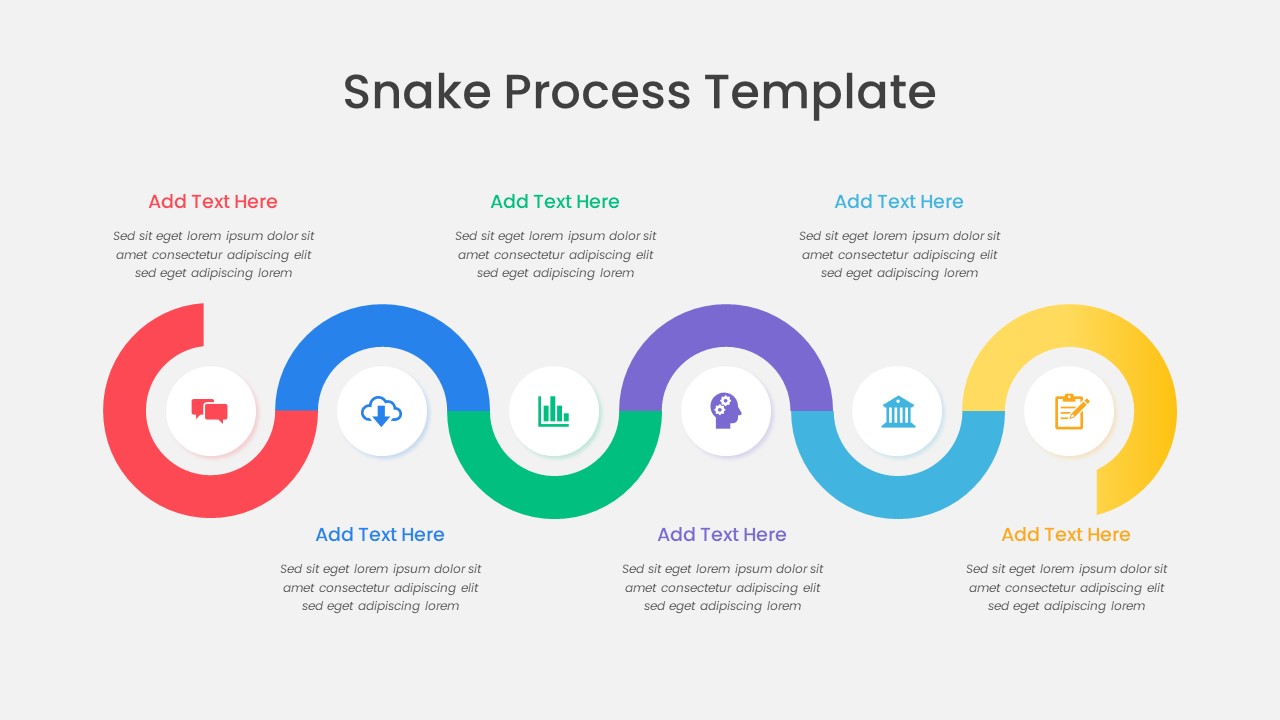
Colorful Snake Process Diagram Template for PowerPoint & Google Slides
Process
Bottleneck Process Analysis Diagram Template for PowerPoint & Google Slides
Process
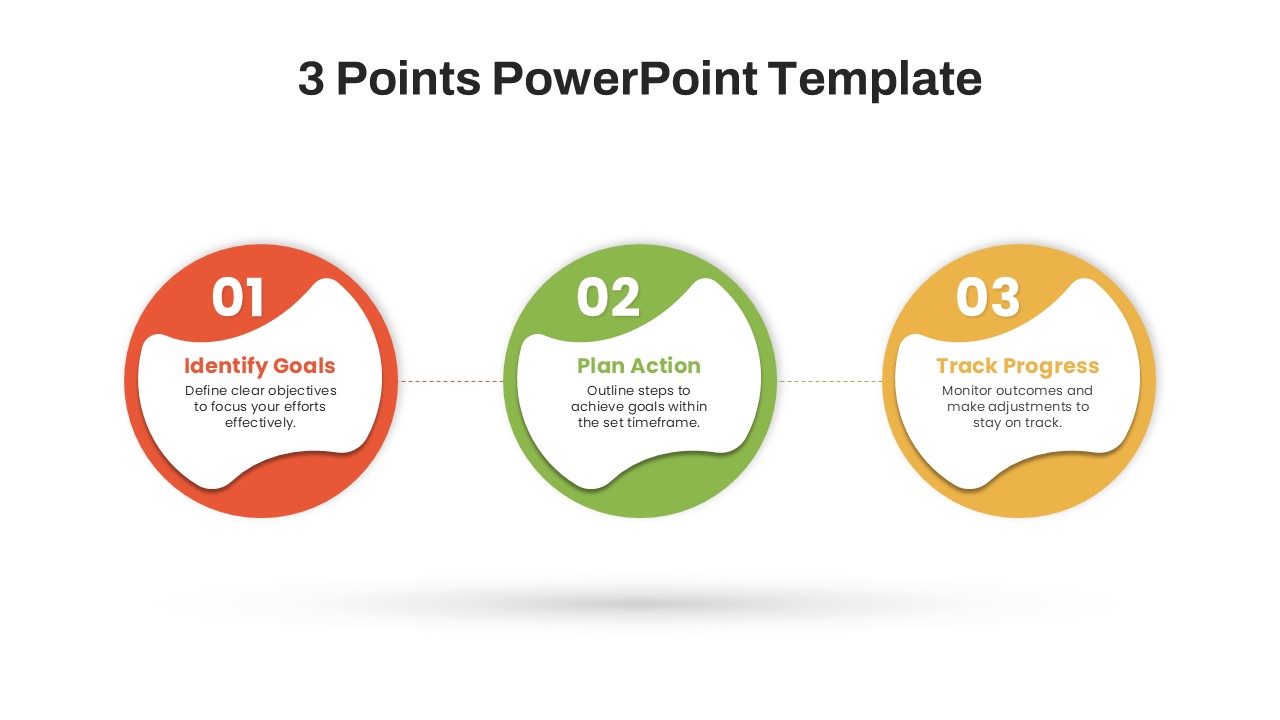
Modern Three-Point Process Diagram Template for PowerPoint & Google Slides
Process
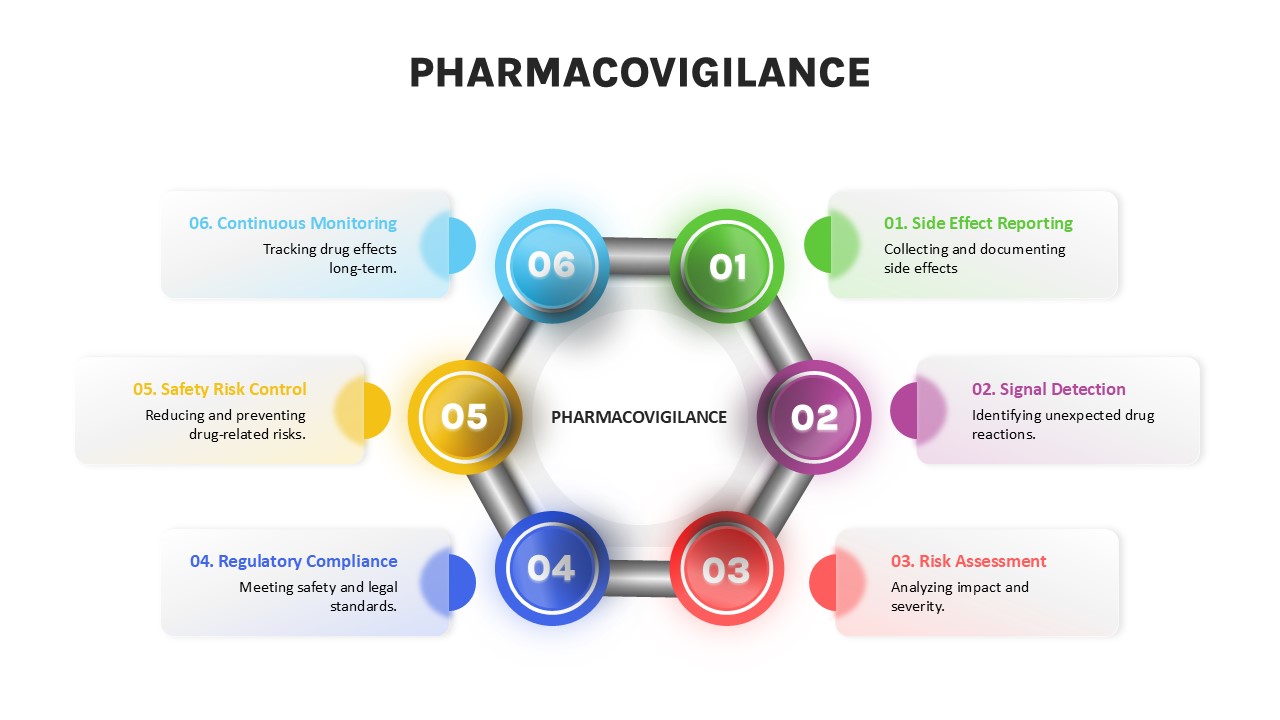
Pharmacovigilance Process Diagram Template for PowerPoint & Google Slides
Process
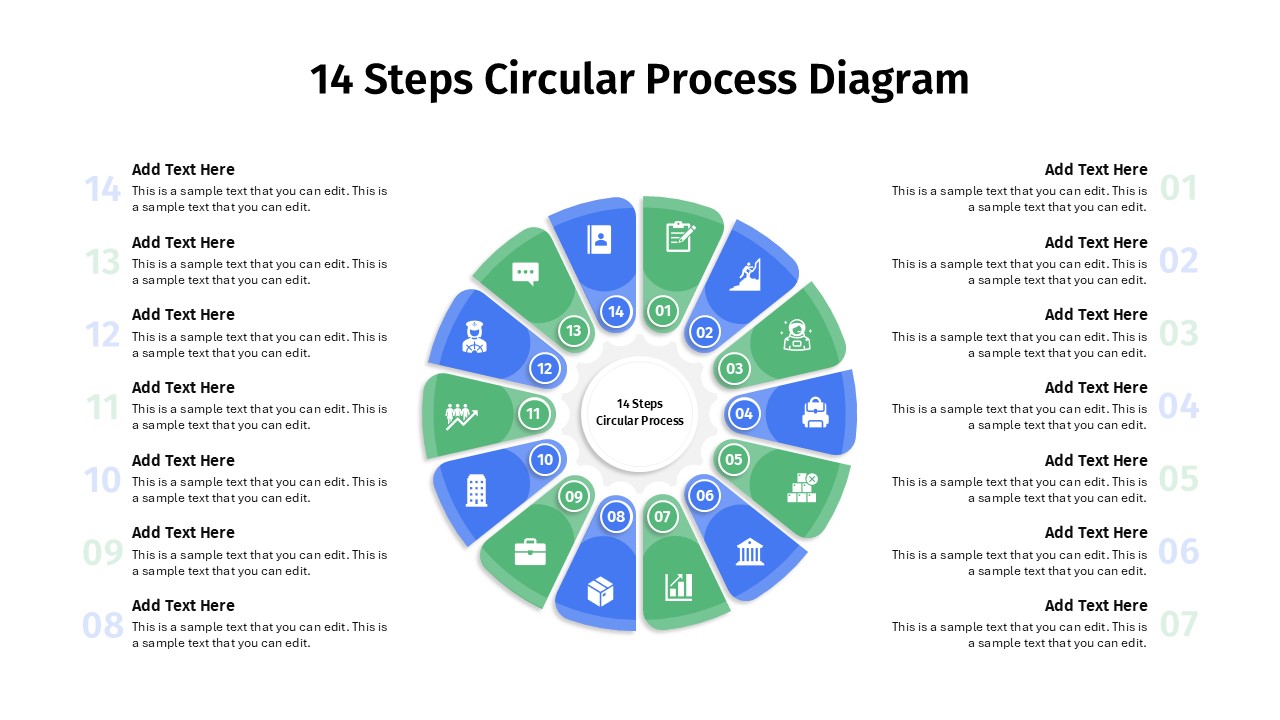
14 Steps Circular Process Diagram Template for PowerPoint & Google Slides
Circular
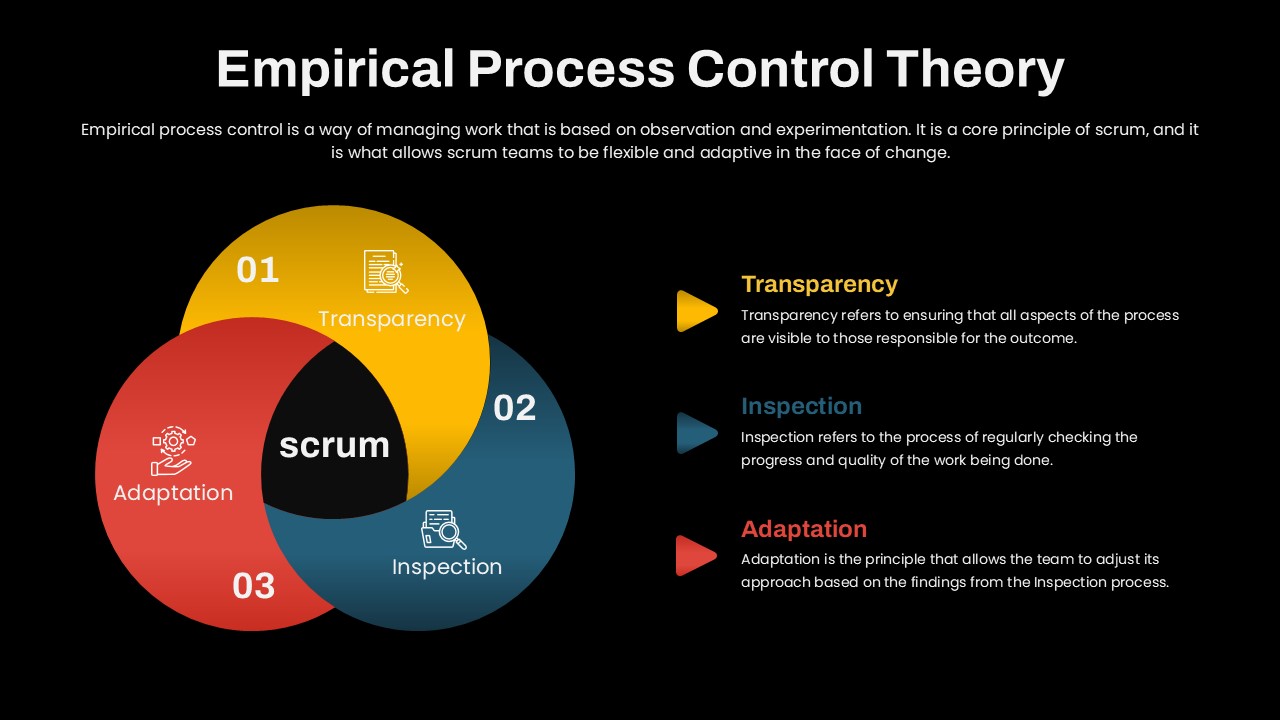
Empirical Process Control Theory Diagram Template for PowerPoint & Google Slides
Circular
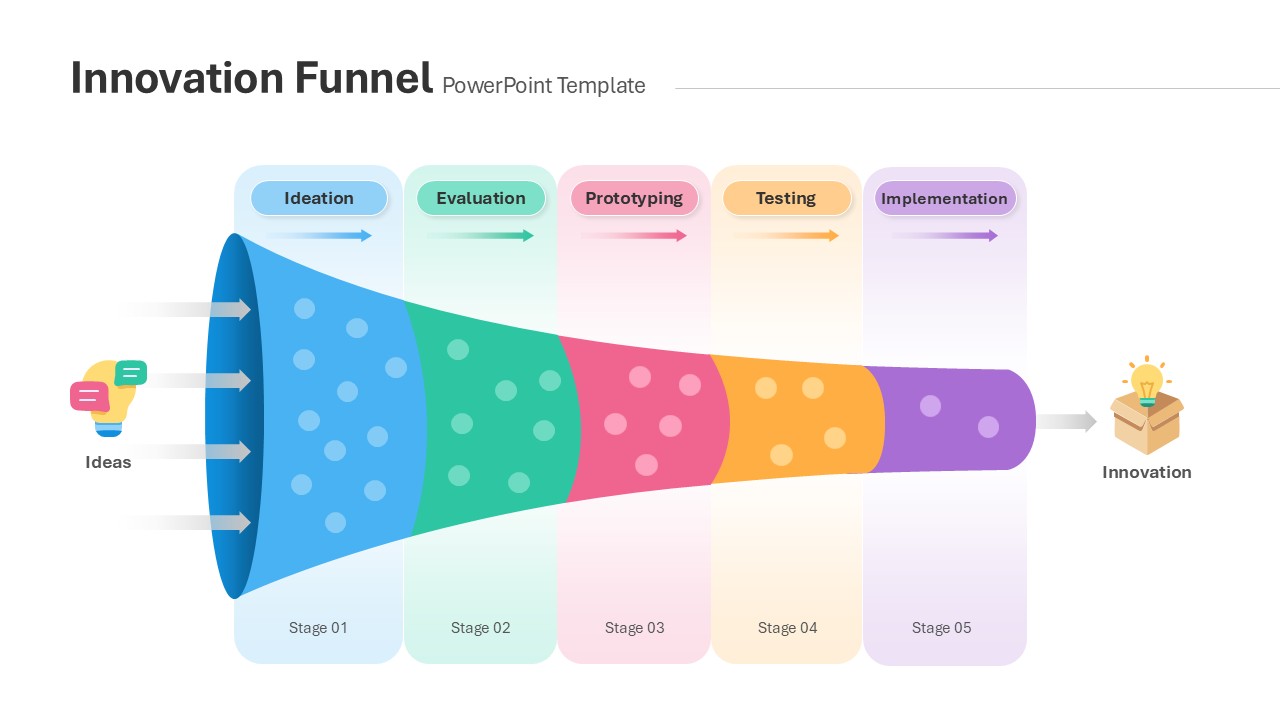
Innovation Funnel Process Diagram Template for PowerPoint & Google Slides
Funnel
Resume Screening Process Flow Diagram Template for PowerPoint & Google Slides
Process
Q-Learning Process Flow Diagram Template for PowerPoint & Google Slides
Process
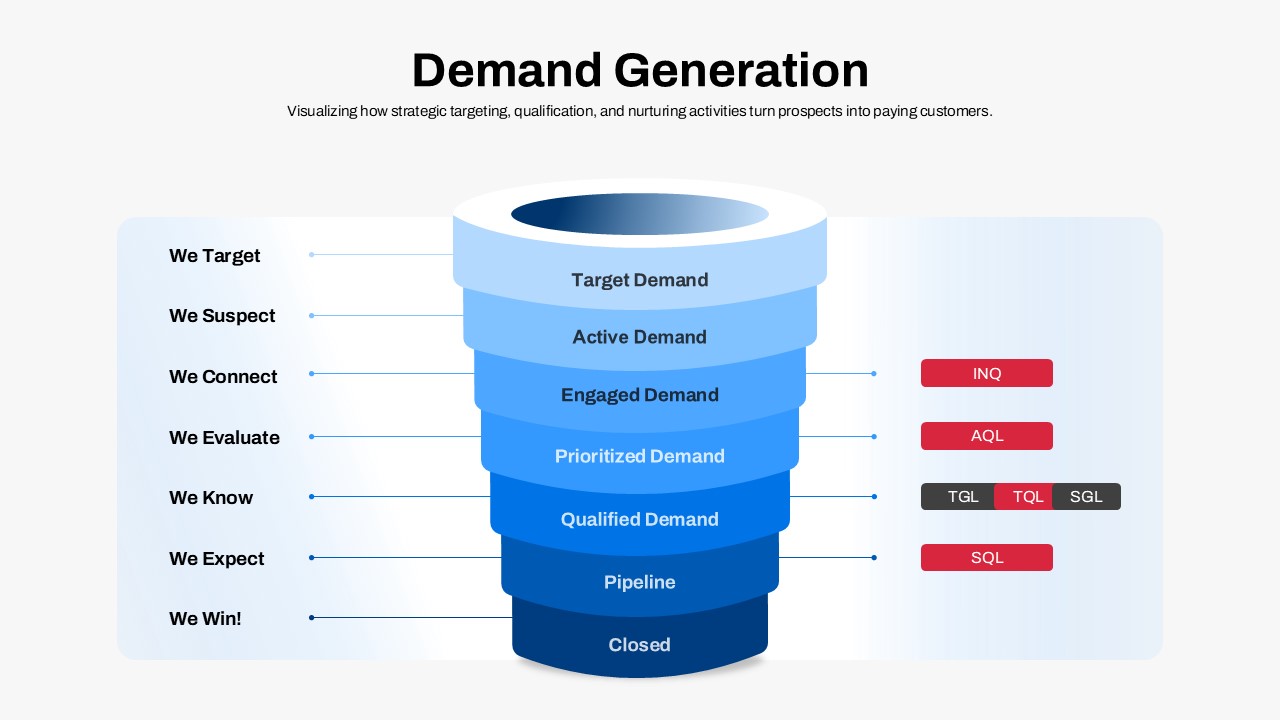
Demand Generation Funnel Process Diagram Template for PowerPoint & Google Slides
Funnel
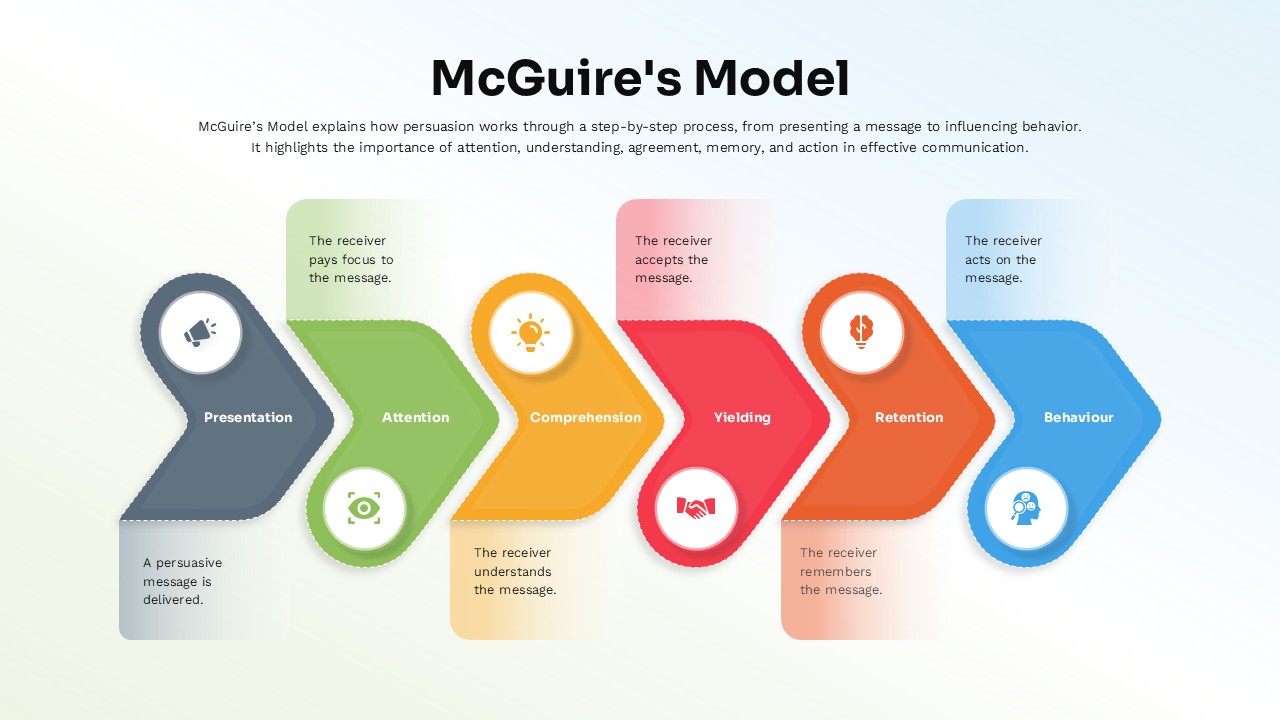
McGuire’s Persuasion Process Flow Diagram Template for PowerPoint & Google Slides
Marketing
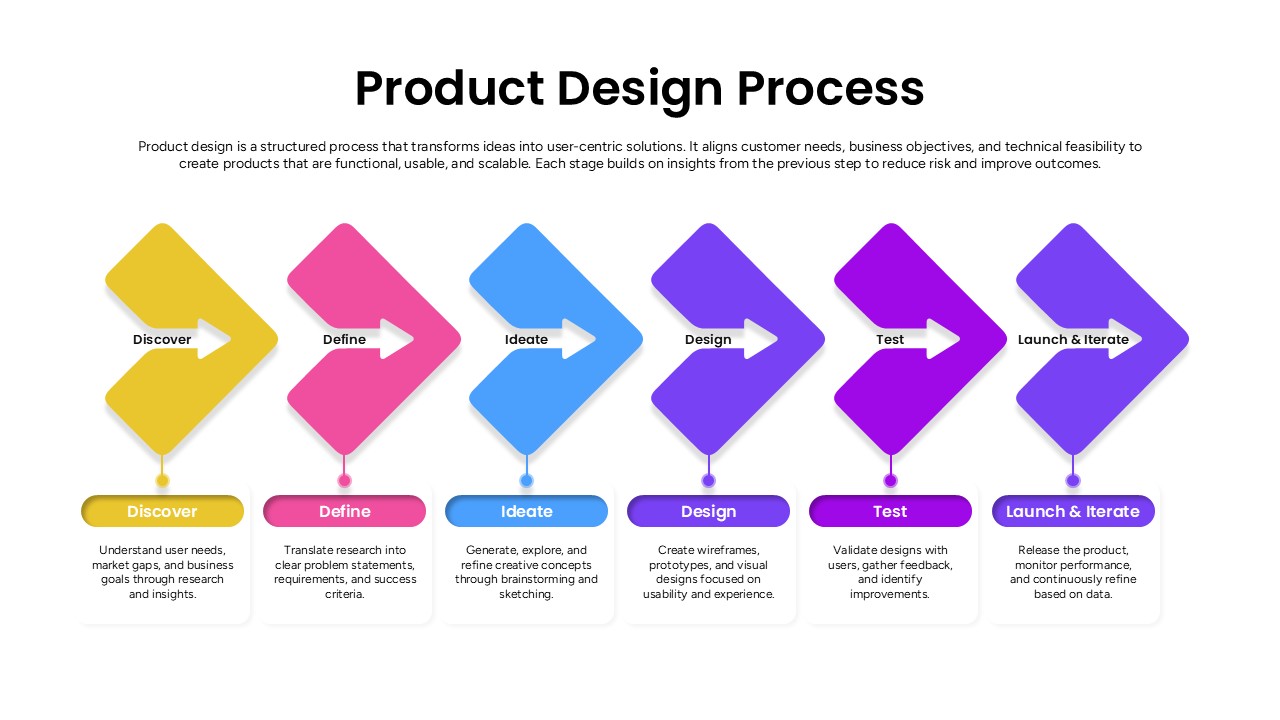
Product Design Process Flow Diagram Template for PowerPoint & Google Slides
Process