Description
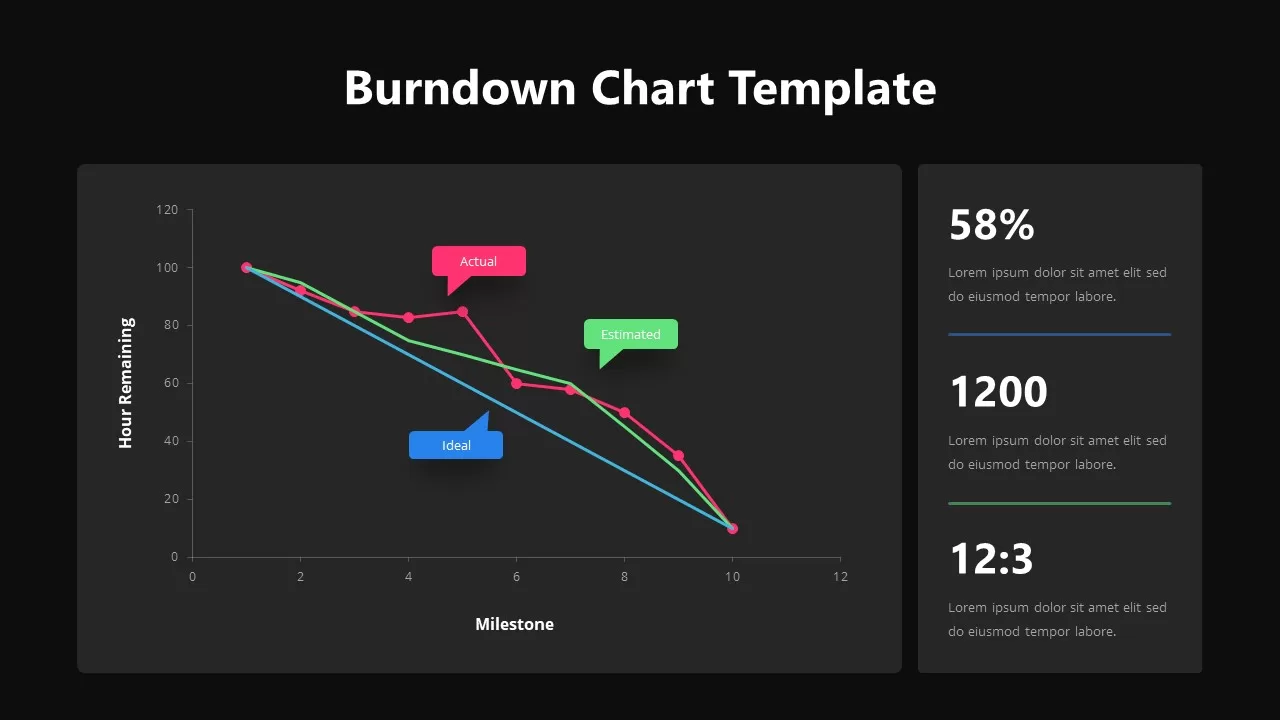
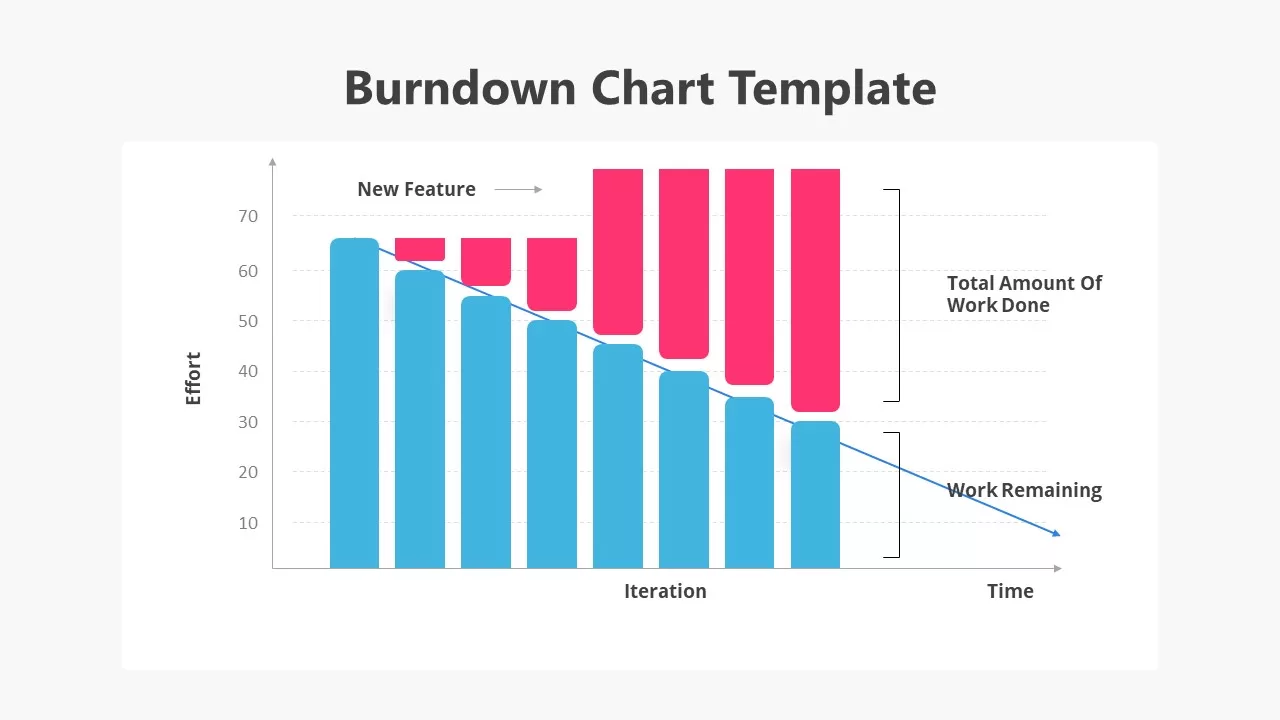
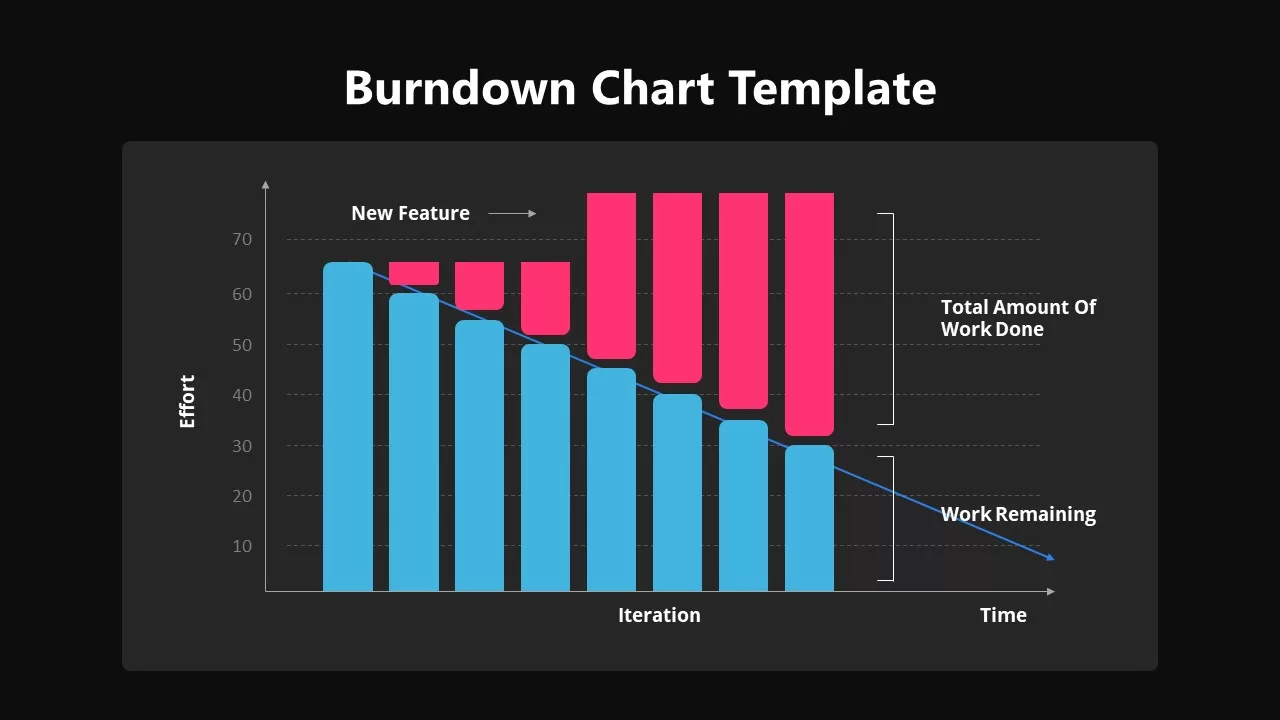
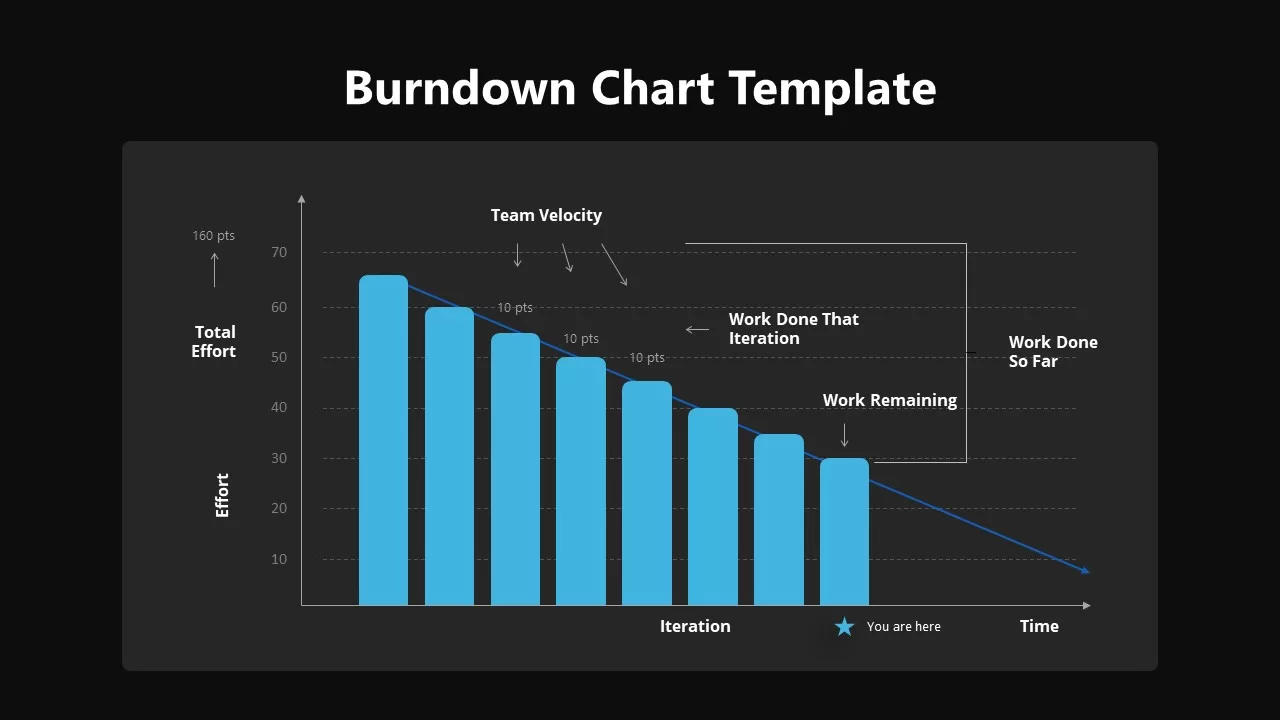
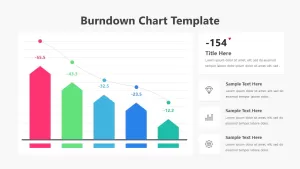
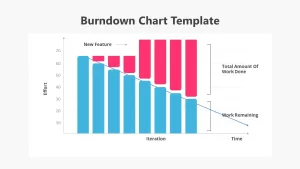
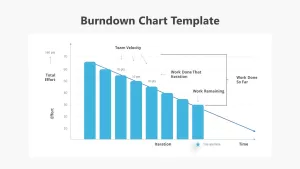
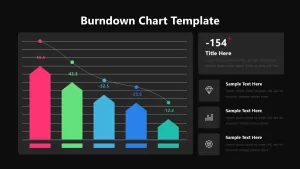
Burndown chart Template is the best tool in PowerPoint to show your project details before clients or higher officials. A burndown chart is a graphical tool used by project managers to track the status of a project and estimate the completion date. The graph shows the total number of tasks remaining at any given time and how that number decreases over time as work is completed. This allows project managers to predict when a project will be finished accurately. Burndown charts can be created in software programs or on paper. They are an essential tool for every project manager.
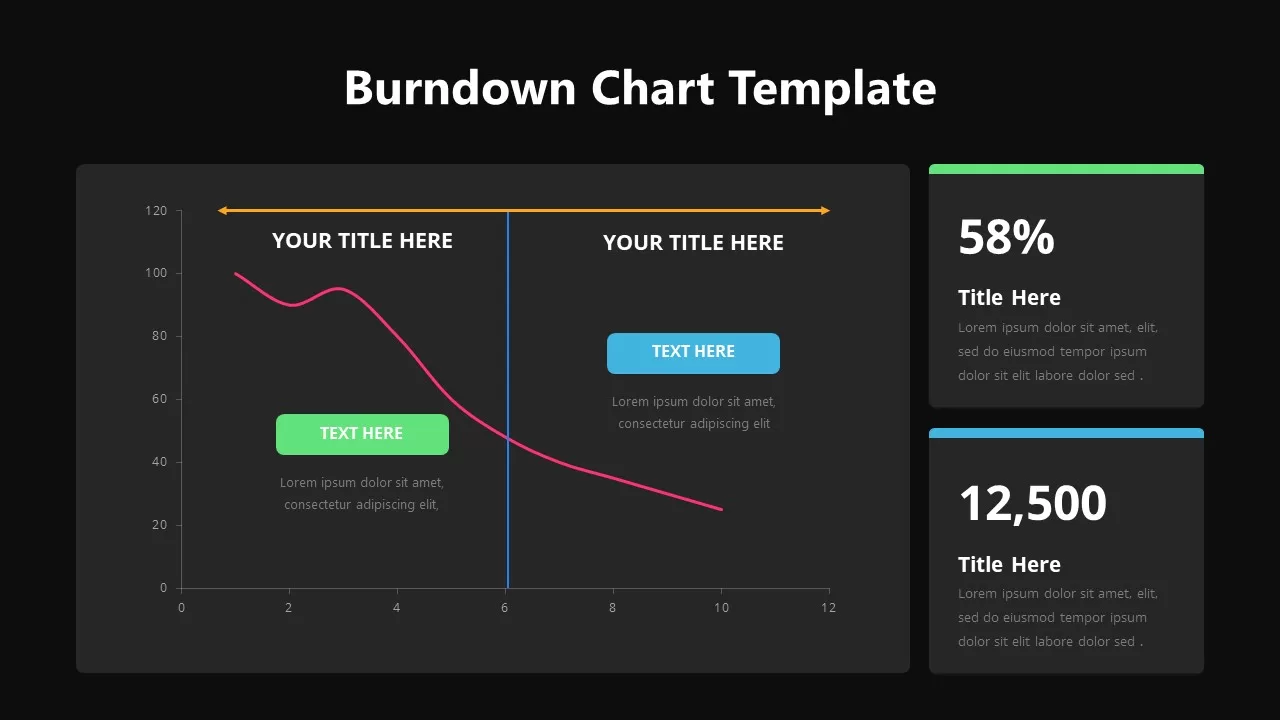
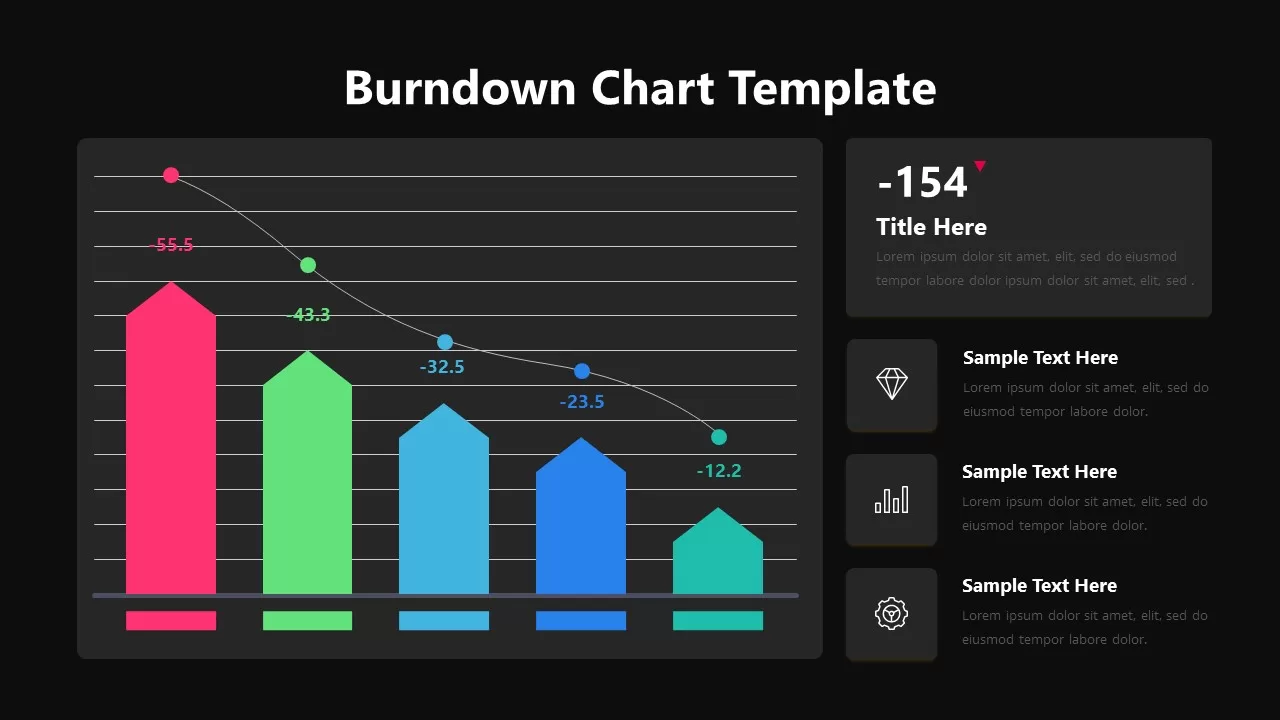
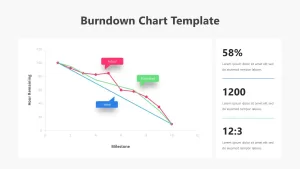
This ten slide Burndown Chart PowerPoint template allows you to create statistical data using powerpoint graphs, bar charts, line diagrams etc. With Slidebazaar’s Burndown Chart ppt template, you can quickly and easily create professional-quality burndown charts for your projects. In addition, the template is fully customizable so that you can fill in your project details with customizable options.
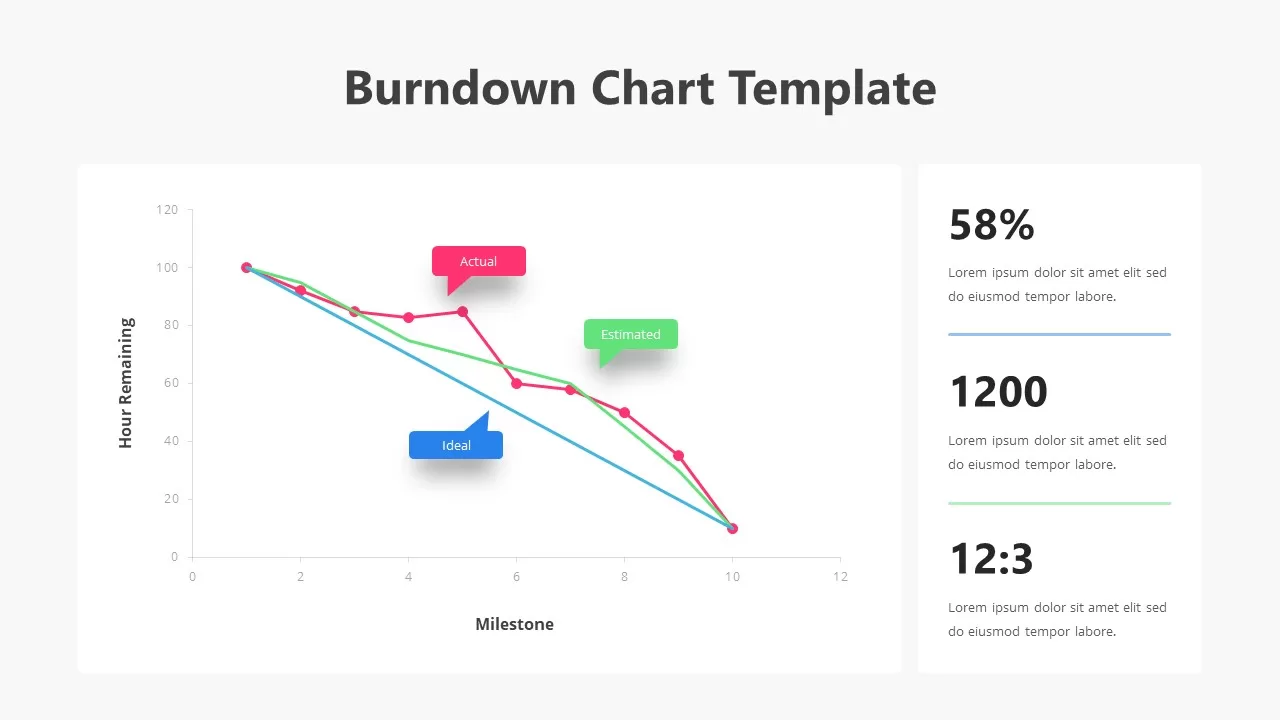
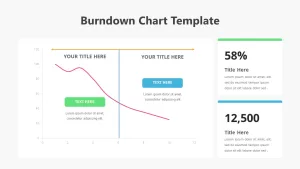
The burndown chart template can be downloaded in two different colour backgrounds- black and white. It is an editable chart with all the necessary fields for tracking your project milestones, progress, and overall status. This is a great tool for keeping your team organized and updated on the project’s progress.
Login to download this file
No. of Slides
10Item ID
SB02163Rating
0.0
(0 reviews)
Tags
Related Templates

Gantt Chart Template Showing Weekly Tasks Template for PowerPoint & Google Slides
Gantt Chart

Free 3D Pie Chart PowerPoint Template & Google Slides
Pie/Donut
Free

Bar Chart Sample template for PowerPoint & Google Slides
Bar/Column

Mobile Data Analysis Chart template for PowerPoint & Google Slides
Charts

3D Puzzle Chart template for PowerPoint & Google Slides
Infographics

Creative Data Analysis Bar Chart template for PowerPoint & Google Slides
Bar/Column

Business Four Square Chart template for PowerPoint & Google Slides
Business

Four Keys Hierarchy Chart template for PowerPoint & Google Slides
Process

Flow Chart template for PowerPoint & Google Slides
Flow Charts

Profit Performance Trend Chart Template for PowerPoint & Google Slides
Finance

Donut Chart Split Template for PowerPoint & Google Slides
Charts

Five-Branch Hierarchy Structure Chart template for PowerPoint & Google Slides
Org Chart

Combination Chart template for PowerPoint & Google Slides
Charts

Comparison Bar Chart template for PowerPoint & Google Slides
Comparison Chart

3D Cylinder Bar Chart Template for PowerPoint & Google Slides
Bar/Column

Isometric Organization Chart Diagram Template for PowerPoint & Google Slides
Org Chart

Success Key Diagram with Donut Chart Template for PowerPoint & Google Slides
Pie/Donut

Horizontal Org Chart template for PowerPoint & Google Slides
Org Chart

3D Cone Chart Data Visualization template for PowerPoint & Google Slides
Bar/Column

Product Roadmap Gantt Chart Timeline template for PowerPoint & Google Slides
Gantt Chart

Eight Section Donut Chart Infographic Template for PowerPoint & Google Slides
Pie/Donut

Line Chart Analysis template for PowerPoint & Google Slides
Charts

Pyramid Chart Area template for PowerPoint & Google Slides
Pyramid

Comparison Chart Overview template for PowerPoint & Google Slides
Comparison Chart

3D Cylinder Bar Chart Visualization Template for PowerPoint
Bar/Column

Project Team Structure Org Chart PowerPoint Template
Org Chart

3D Organization Hierarchy Chart Template for PowerPoint & Google Slides
Org Chart

Isometric Business Organization Chart Template for PowerPoint & Google Slides
Org Chart

Isometric Organizational Structure Chart Template for PowerPoint & Google Slides
Org Chart

Radar Chart Product Comparison Template for PowerPoint & Google Slides
Comparison Chart

Four-Step Onion Chart Process Template for PowerPoint & Google Slides
Charts

Five-Stage Diamond Timeline Chart Template for PowerPoint & Google Slides
Timeline

Distracting Factors at Work Bar Chart Template for PowerPoint & Google Slides
Bar/Column

Organizational Structure Hierarchy Chart Template for PowerPoint & Google Slides
Org Chart

Six-Step Audit Implementation Chart Template for PowerPoint & Google Slides
Circular

Flow Chart Template For PowerPoint Presentations
Flow Charts

Vertical Split Flow Chart Diagram Template for PowerPoint & Google Slides
Flow Charts

Modern Organizational Chart Hierarchy Template for PowerPoint & Google Slides
Org Chart

BMI Category Comparison Chart Template for PowerPoint & Google Slides
Comparison

Project Gantt Chart template for PowerPoint & Google Slides
Gantt Chart

Pugh Matrix Decision Comparison Chart Template for PowerPoint & Google Slides
Comparison Chart

Modern Photo-Based Organizational Chart Template for PowerPoint & Google Slides
Org Chart

Use of Funds Donut Chart Infographic Template for PowerPoint & Google Slides
Circular

Organizational Chart Structure template for PowerPoint & Google Slides
Business Plan

Organizational Chart Template for PowerPoint & Google Slides
Our Team

Organizational Chart template for PowerPoint & Google Slides
Org Chart

Flow Chart template for PowerPoint & Google Slides
Flow Charts

Divisional Organizational Chart Diagram Template for PowerPoint & Google Slides
Org Chart

Donut Chart Data Breakdown template for PowerPoint & Google Slides
Pie/Donut

MABA Attractiveness Matrix Chart Template for PowerPoint & Google Slides
Comparison Chart

Comprehensive Hiring Process Flow Chart Template for PowerPoint & Google Slides
Flow Charts

Overlapping Timeline Gantt Chart Diagram Template for PowerPoint & Google Slides
Timeline

Waffle Chart Data Visualization Template for PowerPoint & Google Slides
Comparison Chart

C-Suite Org Chart PowerPoint Template
Org Chart

People Demographic Comparison Chart Template for PowerPoint & Google Slides
Comparison

Population Pyramid Chart Analysis Template for PowerPoint & Google Slides
Bar/Column

Simple Bar Chart Data Visualization Template for PowerPoint & Google Slides
Bar/Column

Minimal Multi-Year Column Chart Template for PowerPoint & Google Slides
Bar/Column

Waterfall Column Chart Analysis Template for PowerPoint & Google Slides
Bar/Column

Professional Clustered Column Chart Template for PowerPoint & Google Slides
Bar/Column

Professional Quad Chart Layout Template for PowerPoint & Google Slides
Pie/Donut

Arrow Line Chart Template for PowerPoint & Google Slides
Comparison Chart

Colorful Four-Segment Wheel Chart Template for PowerPoint & Google Slides
Circular

Forecast Chart with Confidence Bounds Template for PowerPoint & Google Slides
Comparison Chart

Evolution Line Chart with Milestones Template for PowerPoint & Google Slides
Timeline

Four Quadrant Scatter Chart Powerpoint Template
Comparison Chart

Mekko Chart with Segmented Branches & Leaves Template for PowerPoint & Google Slides
Bar/Column

Five-Phase Horizontal Timeline Chart Template for PowerPoint & Google Slides
Timeline

Mirror Bar Chart Comparison Template for PowerPoint & Google Slides
Bar/Column

Dynamic Three-Series Stacked Area Chart Template for PowerPoint & Google Slides
Comparison Chart

Free Learning Retention Pyramid Chart Template for PowerPoint & Google Slides
Pyramid
Free

Multi-Variation Circular Chart Diagram Template for PowerPoint & Google Slides
Circular

Cross Functional Swimlane Flow Chart Template for PowerPoint & Google Slides
Flow Charts

Horizontal Organizational Chart Template for PowerPoint & Google Slides
Org Chart

Inverted Organization Chart Diagram Template for PowerPoint & Google Slides
Org Chart

Modern Multi-Color Polar Chart Diagram Template for PowerPoint & Google Slides
Charts

Multi-Level Colorful Pyramid Chart Template for PowerPoint & Google Slides
Pyramid

Segmented Scatter Chart Data Visualization Template for PowerPoint & Google Slides
Business Strategy

Proportional Area Chart Analysis Template for PowerPoint & Google Slides
Comparison Chart

Sustainability Goals and Targets Chart Template for PowerPoint & Google Slides
Goals

ESG Initiatives Comparison Chart Template for PowerPoint & Google Slides
Business

Business Portfolio Changes Donut Chart Template for PowerPoint & Google Slides
Pie/Donut

Decision Matrix & Prioritization Chart Template for PowerPoint & Google Slides
Comparison Chart

Ultimate Strategy Chart Presentation Template for PowerPoint & Google Slides
Charts

Data Analysis Bar Chart with Insights Template for PowerPoint & Google Slides
Bar/Column
Free

Horizontal Bar Chart Slide with Icons Template for PowerPoint & Google Slides
Bar/Column

Project Tracker Timeline Gantt Chart Template for PowerPoint & Google Slides
Project Status

Baseline vs Actual Gantt Chart Template for PowerPoint & Google Slides
Gantt Chart

Weekly Gantt Chart Project Timeline Template for PowerPoint & Google Slides
Gantt Chart

Event Planning Gantt Chart template for PowerPoint & Google Slides
Business

Research Gantt Chart template for PowerPoint & Google Slides
Project

Project Gantt Chart Template for PowerPoint & Google Slides
Gantt Chart

Circular Sample Org Chart Template for PowerPoint & Google Slides
Org Chart

Project Timeline Gantt Chart Template for PowerPoint & Google Slides
Gantt Chart

Horizontal Organizational Chart Template for PowerPoint & Google Slides
Org Chart

Quarterly Gantt Chart with Today Marker Template for PowerPoint & Google Slides
Gantt Chart

Colorful Annual Gantt Chart Timeline Template for PowerPoint & Google Slides
Gantt Chart

Corporate Hierarchy Org Chart Template for PowerPoint & Google Slides
Org Chart

Stakeholder Mapping Organizational Chart Template for PowerPoint & Google Slides
Org Chart

Butterfly Chart Template for PowerPoint & Google Slides Presentations
Comparison Chart


