Banking Service & Finance Infographics Template for PowerPoint & Google Slides


Description
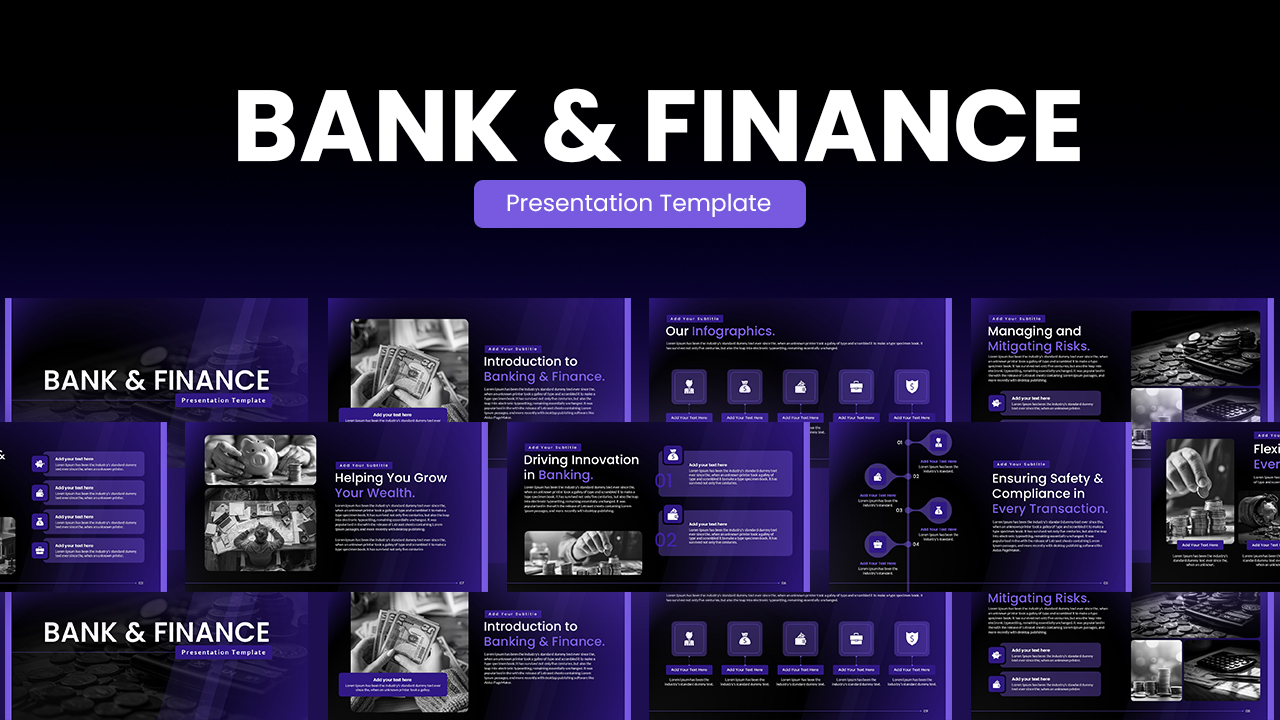
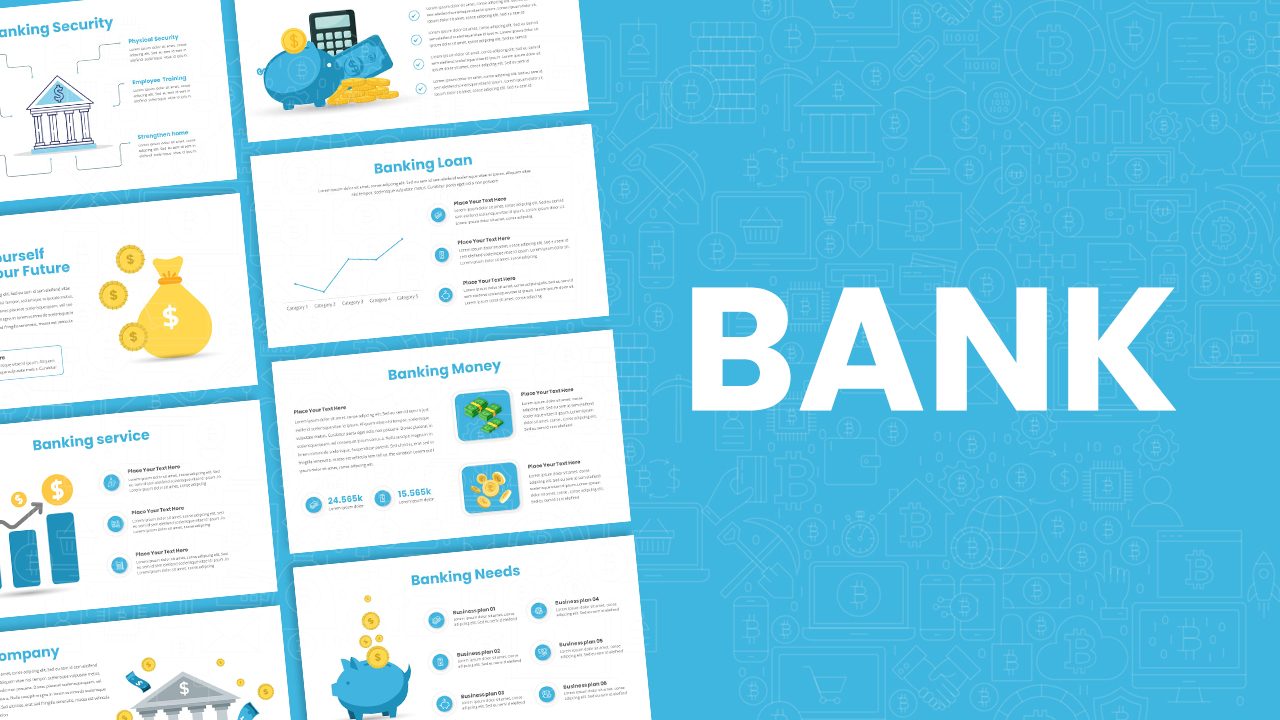
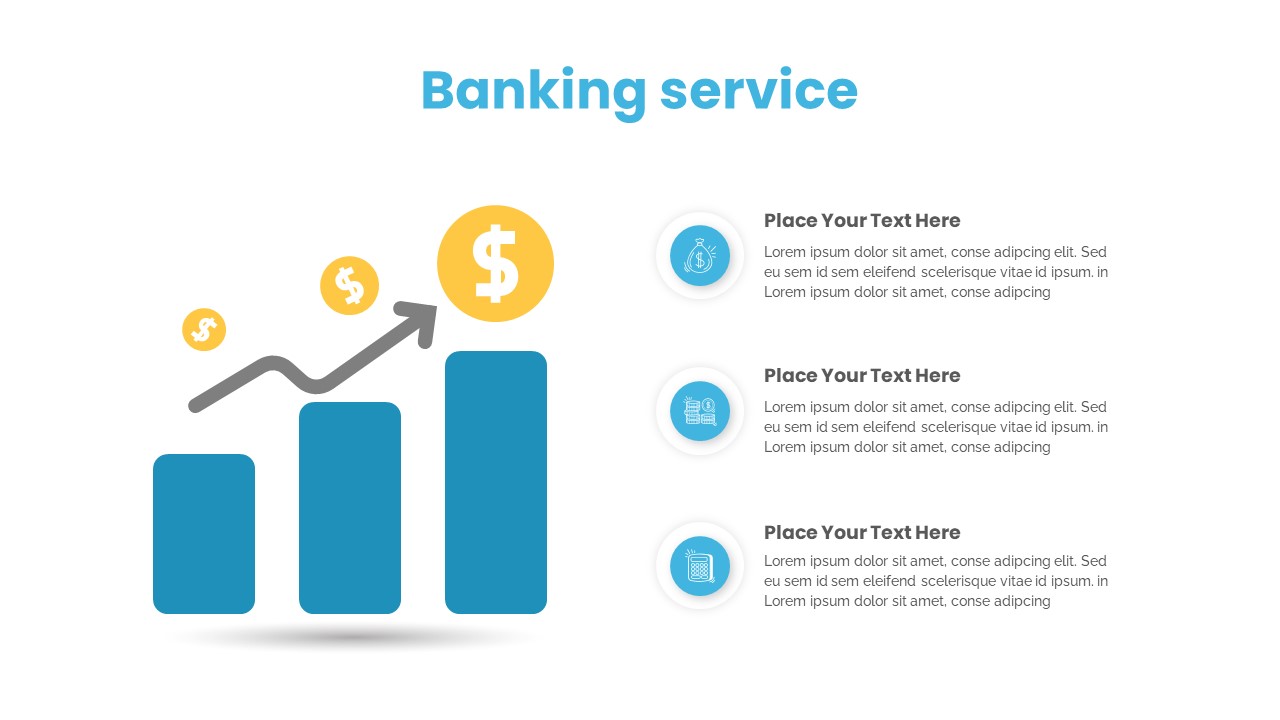
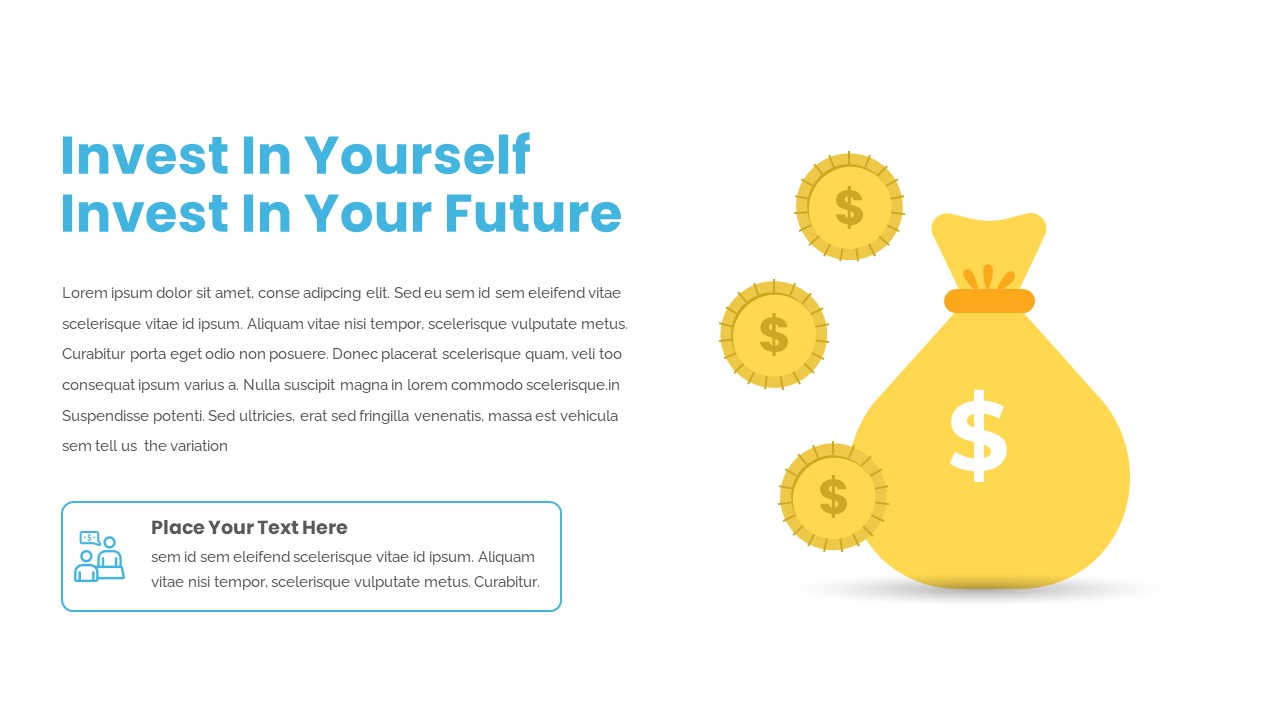
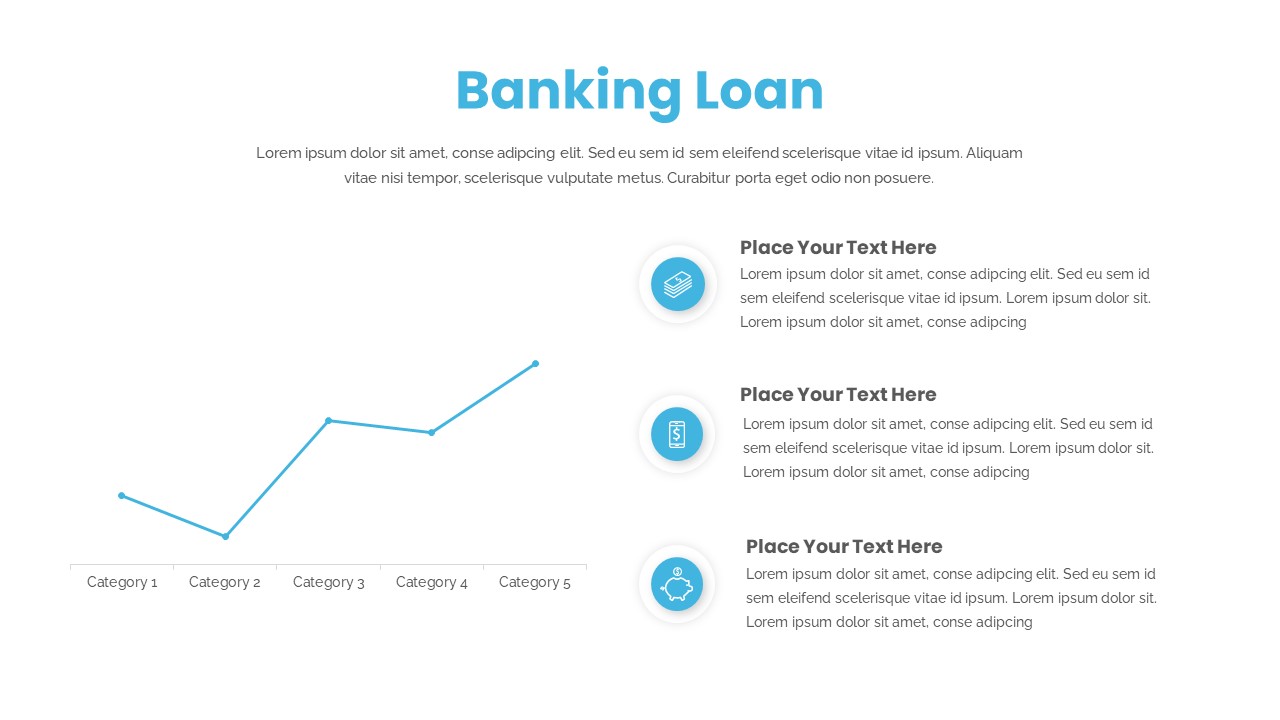
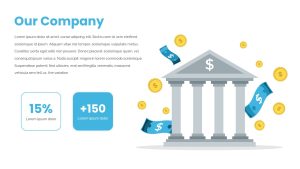
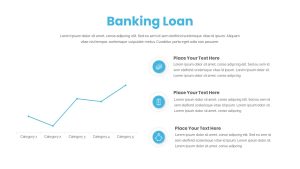
Featuring a vibrant blue backdrop patterned with subtle finance icons, the cover slide sets a professional tone with the bold “BANK” headline and seamless line-art symbols. The “Our Company” layout pairs left-aligned descriptive copy with a detailed bank and coin graphic on the right, accompanied by dual callout shapes for highlighted metrics. A dedicated “Banking Service” slide showcases a four-step bar chart with rising columns, coin markers, and icon-labeled bullet points, perfect for illustrating service offerings or performance KPIs. The “Invest In Yourself” layout combines strong headlines, supporting text, and a prominent money-bag illustration alongside a bordered callout box for key insights.
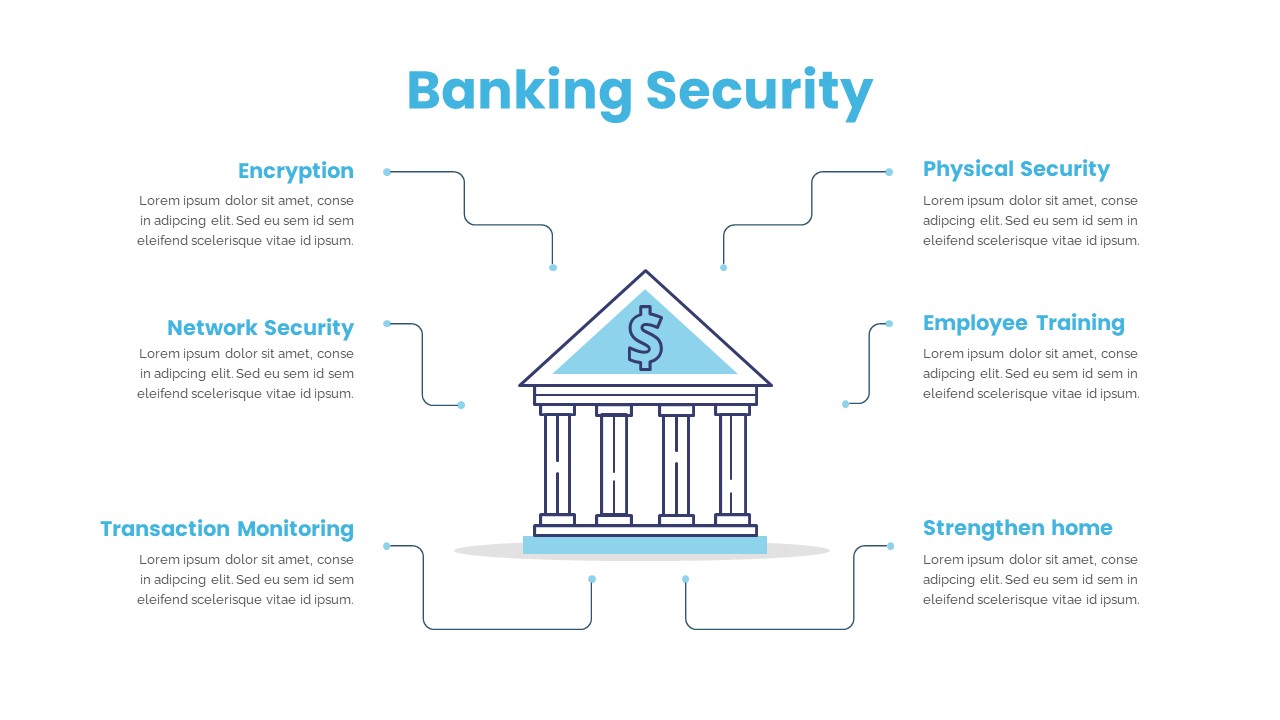
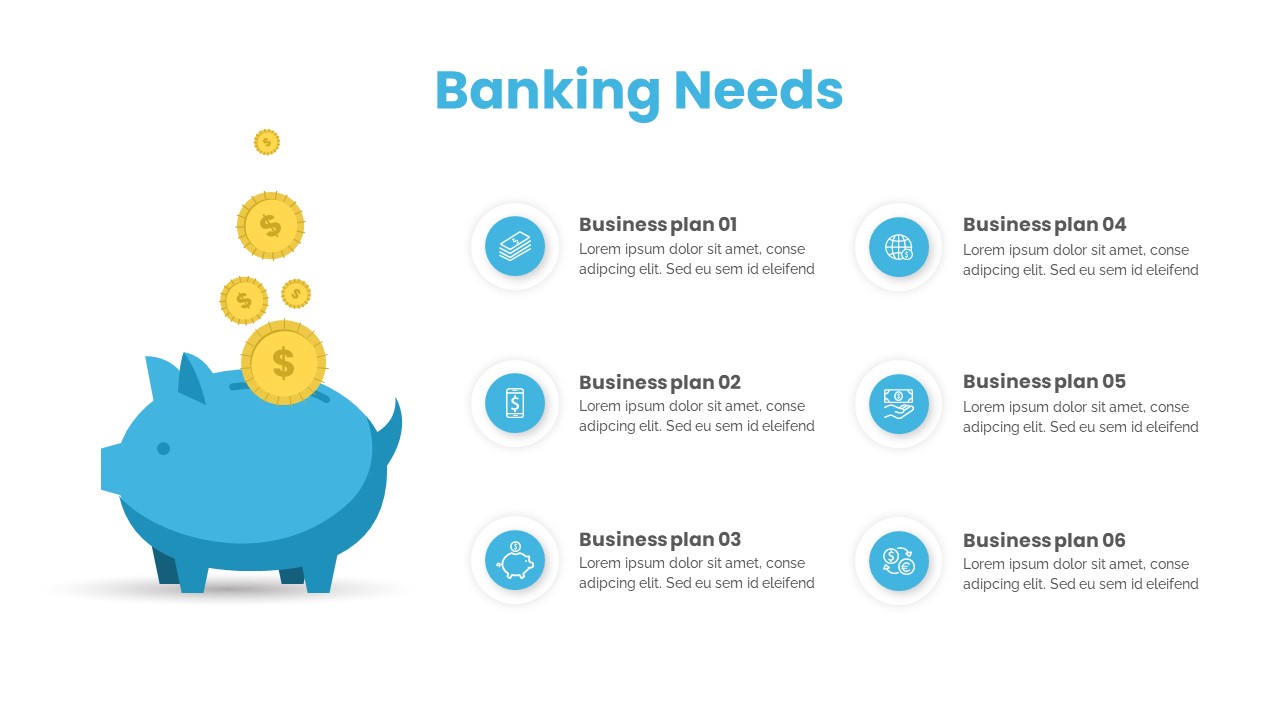
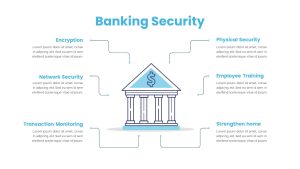
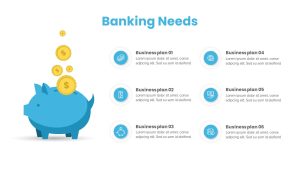
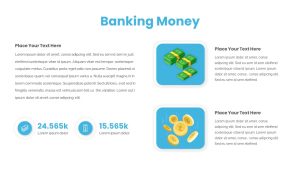
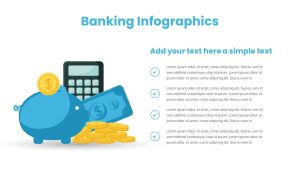
The template’s infographic slides include a “Banking Security” layout centered on a classic bank icon with six directional callouts to detail encryption, network security, transaction monitoring, physical safeguards, employee training, and home-based protection measures. A “Banking Needs” slide presents a piggy-bank graphic pouring coins next to a 3×2 grid of iconized business plan items, while the “Banking Money” slide balances two illustrative panels with text descriptions and headline figures for side-by-side data comparisons. The “Banking Infographics” master merges a stacked money motif and calculator graphic with a four-point bulleted list, providing a flexible layout for analysis or feature listings.
All elements are fully editable in PowerPoint and Google Slides—swap icons, update chart data, change colors, or adjust typography to match brand guidelines. Built on master slides with consistent spacing and auto-aligned placeholders, this deck eliminates formatting headaches across devices. Ideal for financial reports, investor presentations, product roadmaps, or budget forecasts, it streamlines storytelling with a cohesive, modern aesthetic. Duplicate slide layouts for quarterly updates, repurpose infographics for risk assessments, or customize graphics for loan, insurance, or investment portfolios—empowering presenters to deliver polished, data-driven narratives with maximum impact.
Who is it for
Financial analysts, banking executives, and consulting teams will leverage this deck to present service offerings, security protocols, and investment plans. Investor relations, product managers, and budget officers can use its infographics to communicate KPIs, risk assessments, and strategic roadmaps with clarity.
Other Uses
Repurpose slides for insurance product overviews, fintech startup pitches, loan portfolio analyses, or audit findings. Adapt the security infographic for IT risk workshops, reuse the banking needs layout for savings plans or investment portfolios, and apply the bar chart slide to illustrate revenue growth or market share data.
Login to download this file

Item ID
SB04262
Related Templates

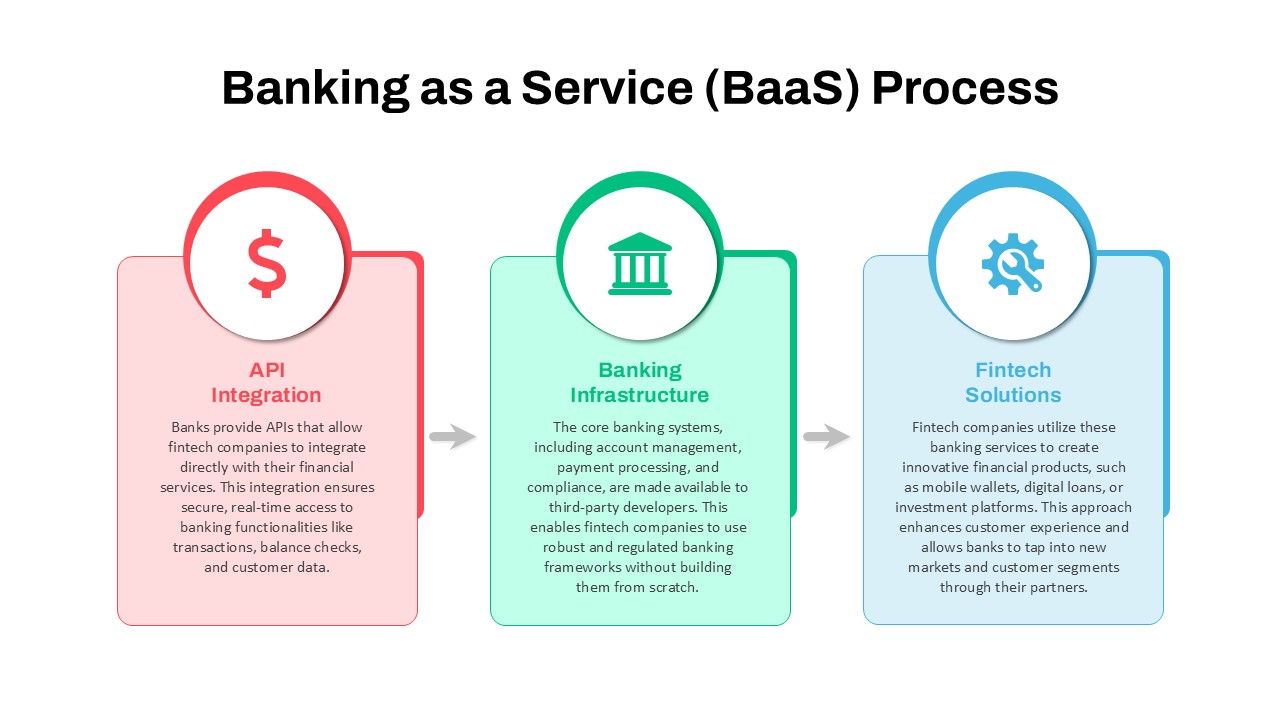
Banking as a Service (BaaS) Process Flow Template for PowerPoint & Google Slides
Process
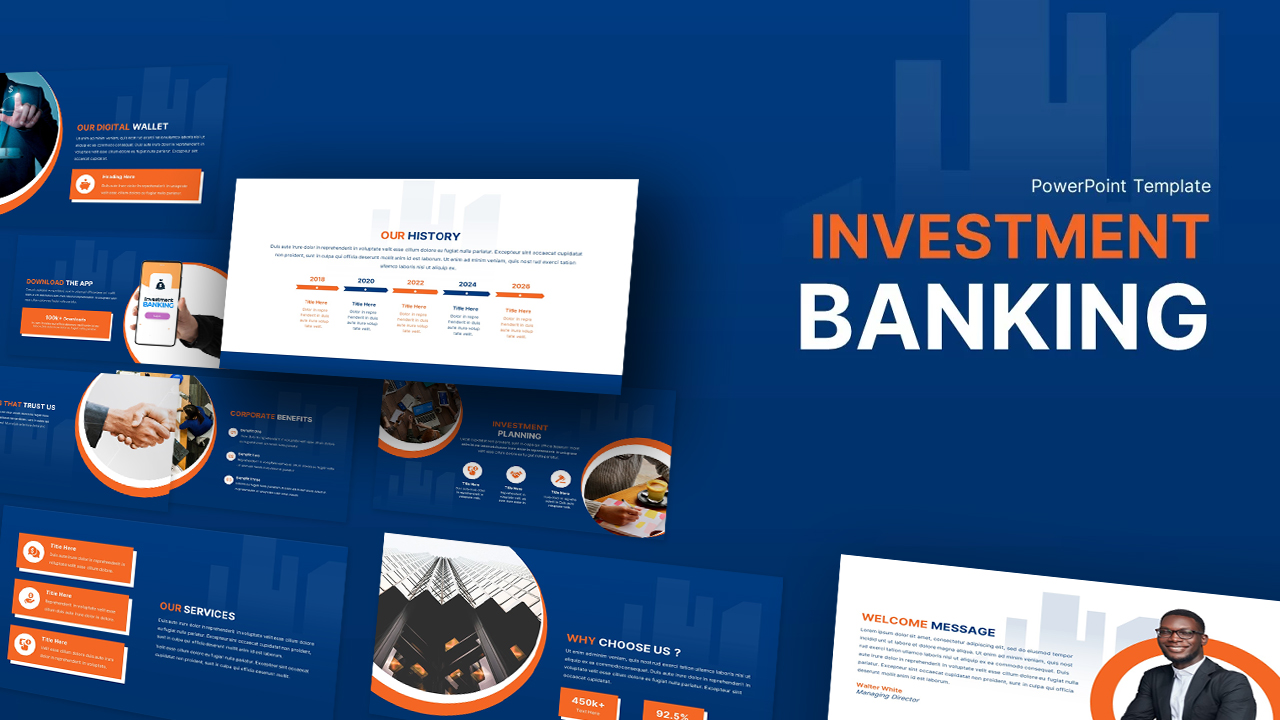
Investment Banking template for PowerPoint & Google Slides
Finance
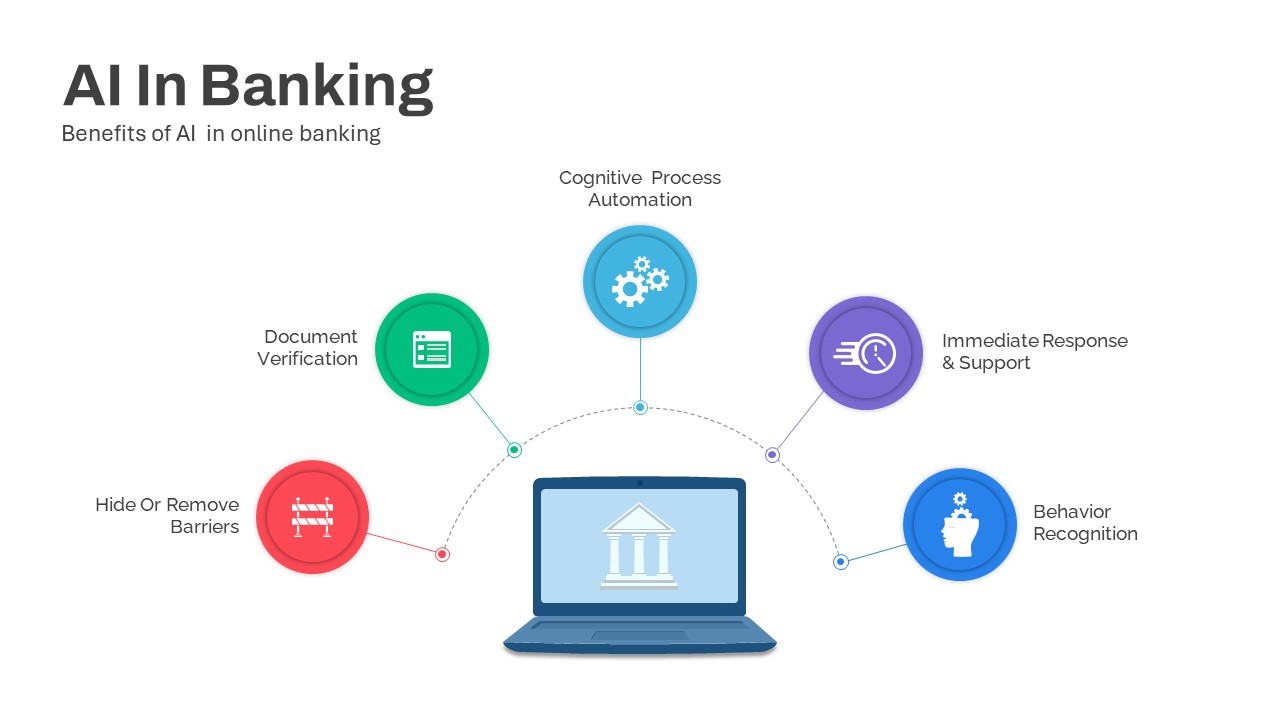
AI Banking Benefits Template for PowerPoint & Google Slides
Circular
Banking Financial Overview Dashboard Template for PowerPoint & Google Slides
Finance
Neo Banking Overview template for PowerPoint & Google Slides
Technology

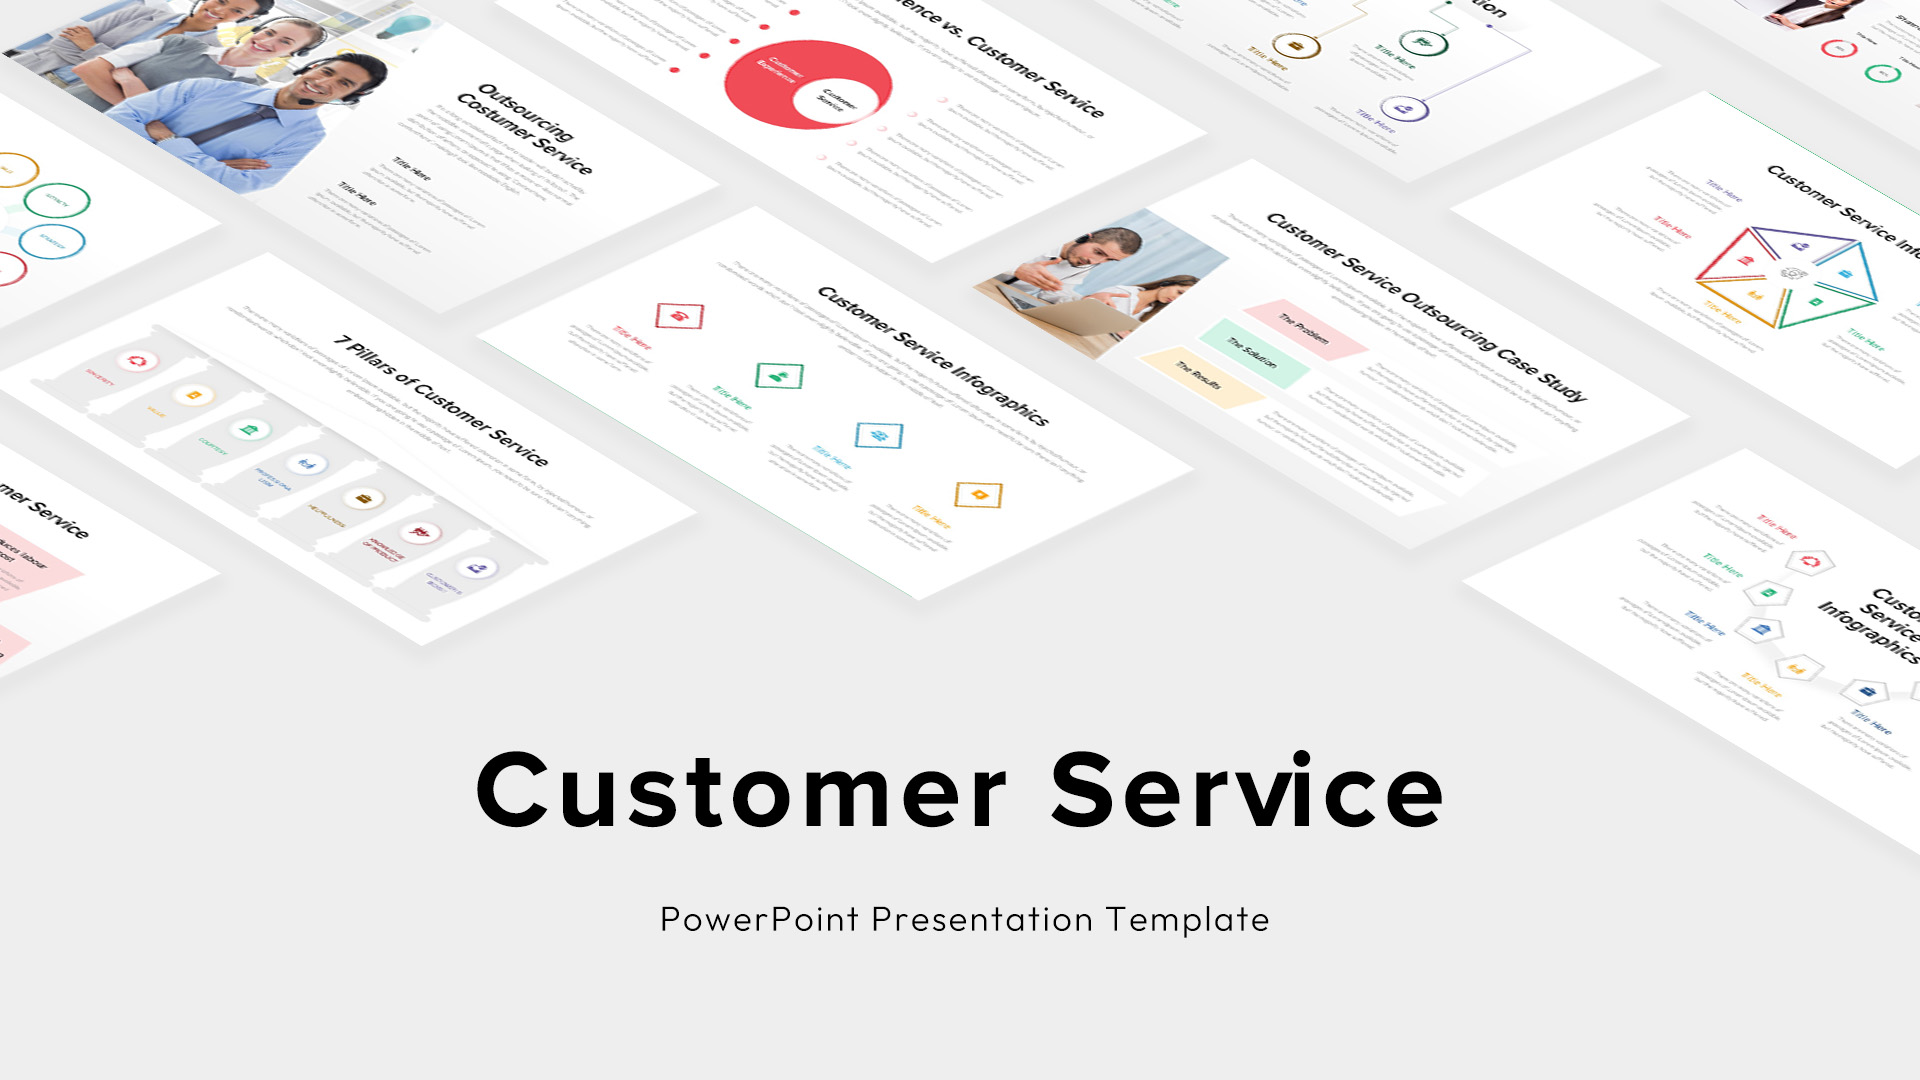
Custom Customer Service Infographics Template for PowerPoint & Google Slides
Process
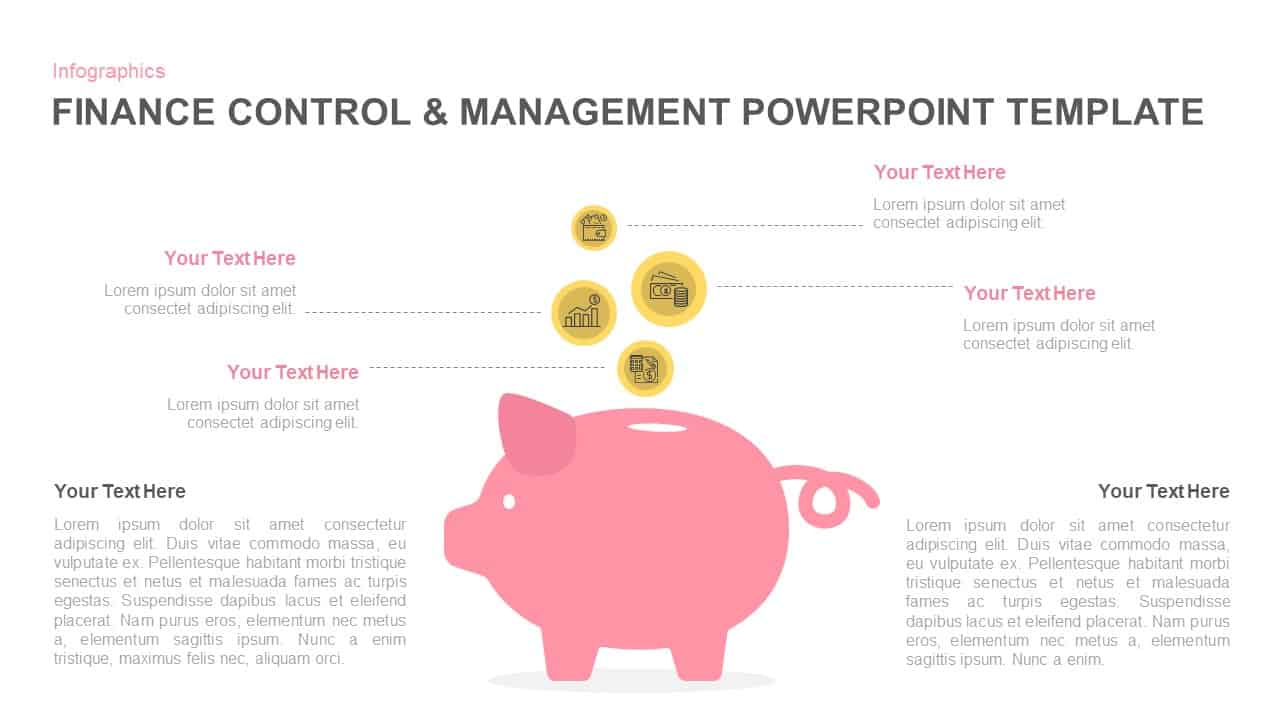
Finance Control & Management Piggy Bank Template for PowerPoint & Google Slides
Finance
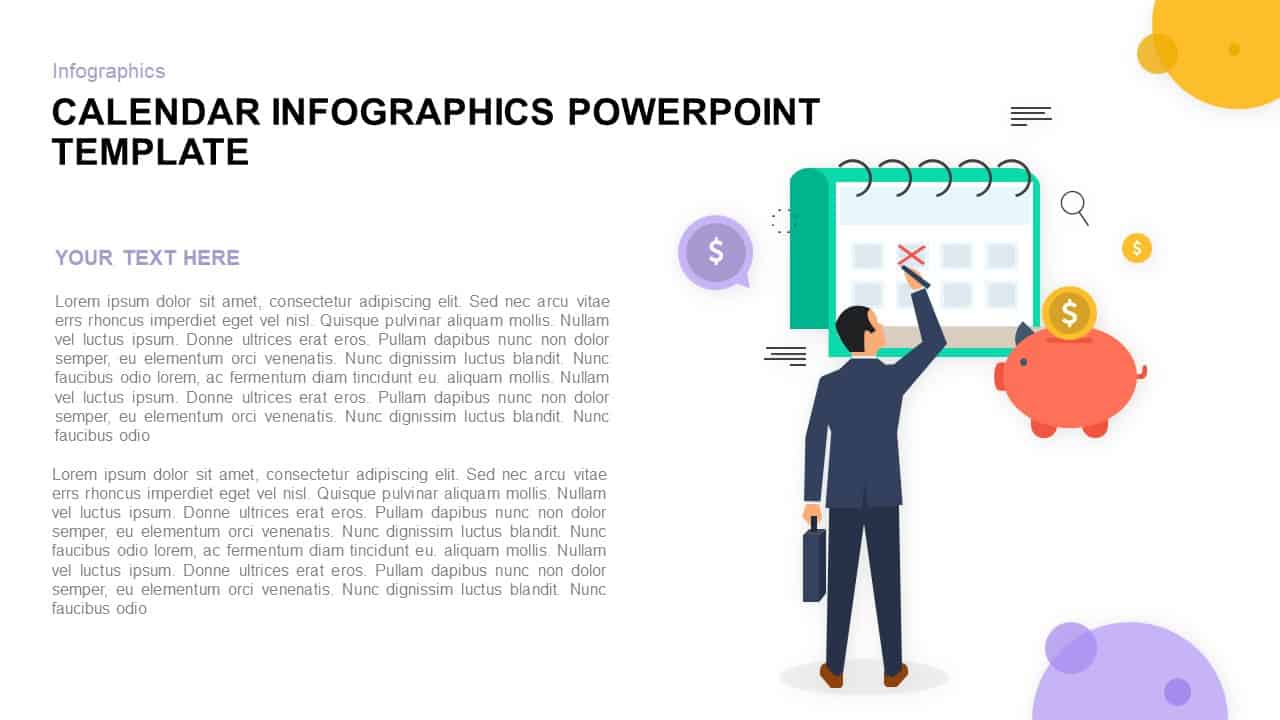
Business Finance Calendar Infographic Template for PowerPoint & Google Slides
Finance
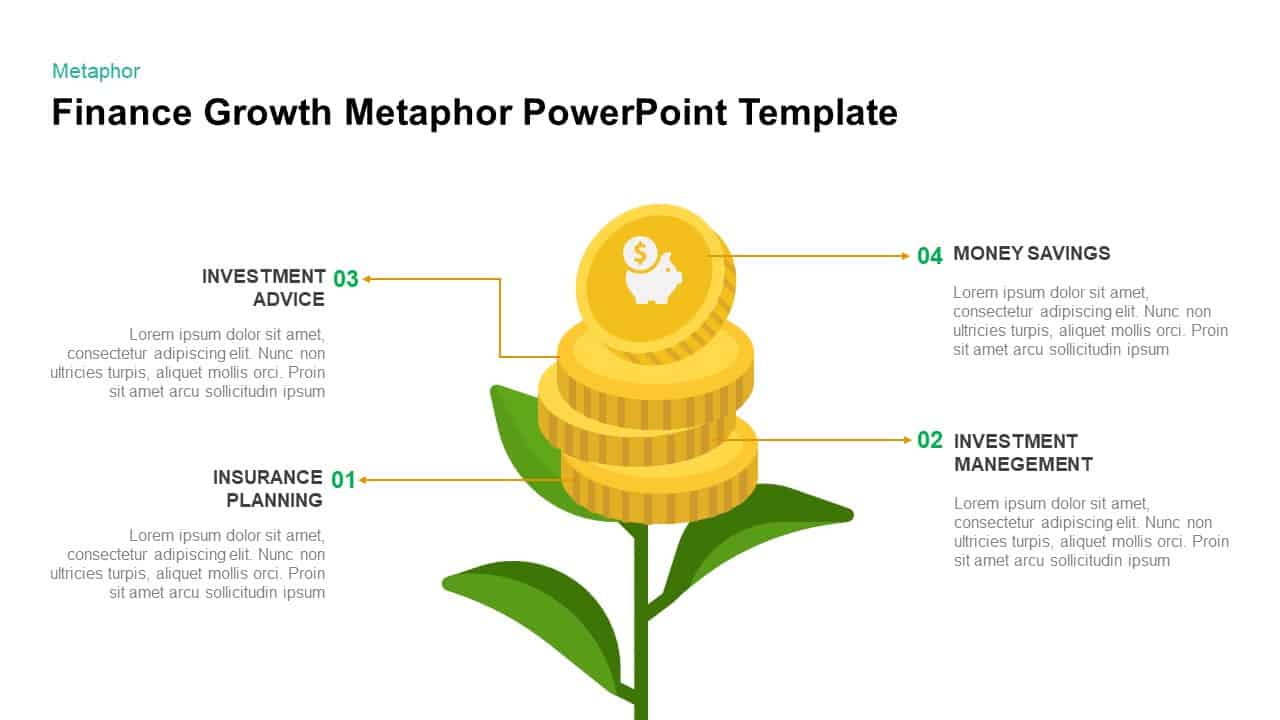
Finance Growth Plant Metaphor Slide Template for PowerPoint & Google Slides
Finance
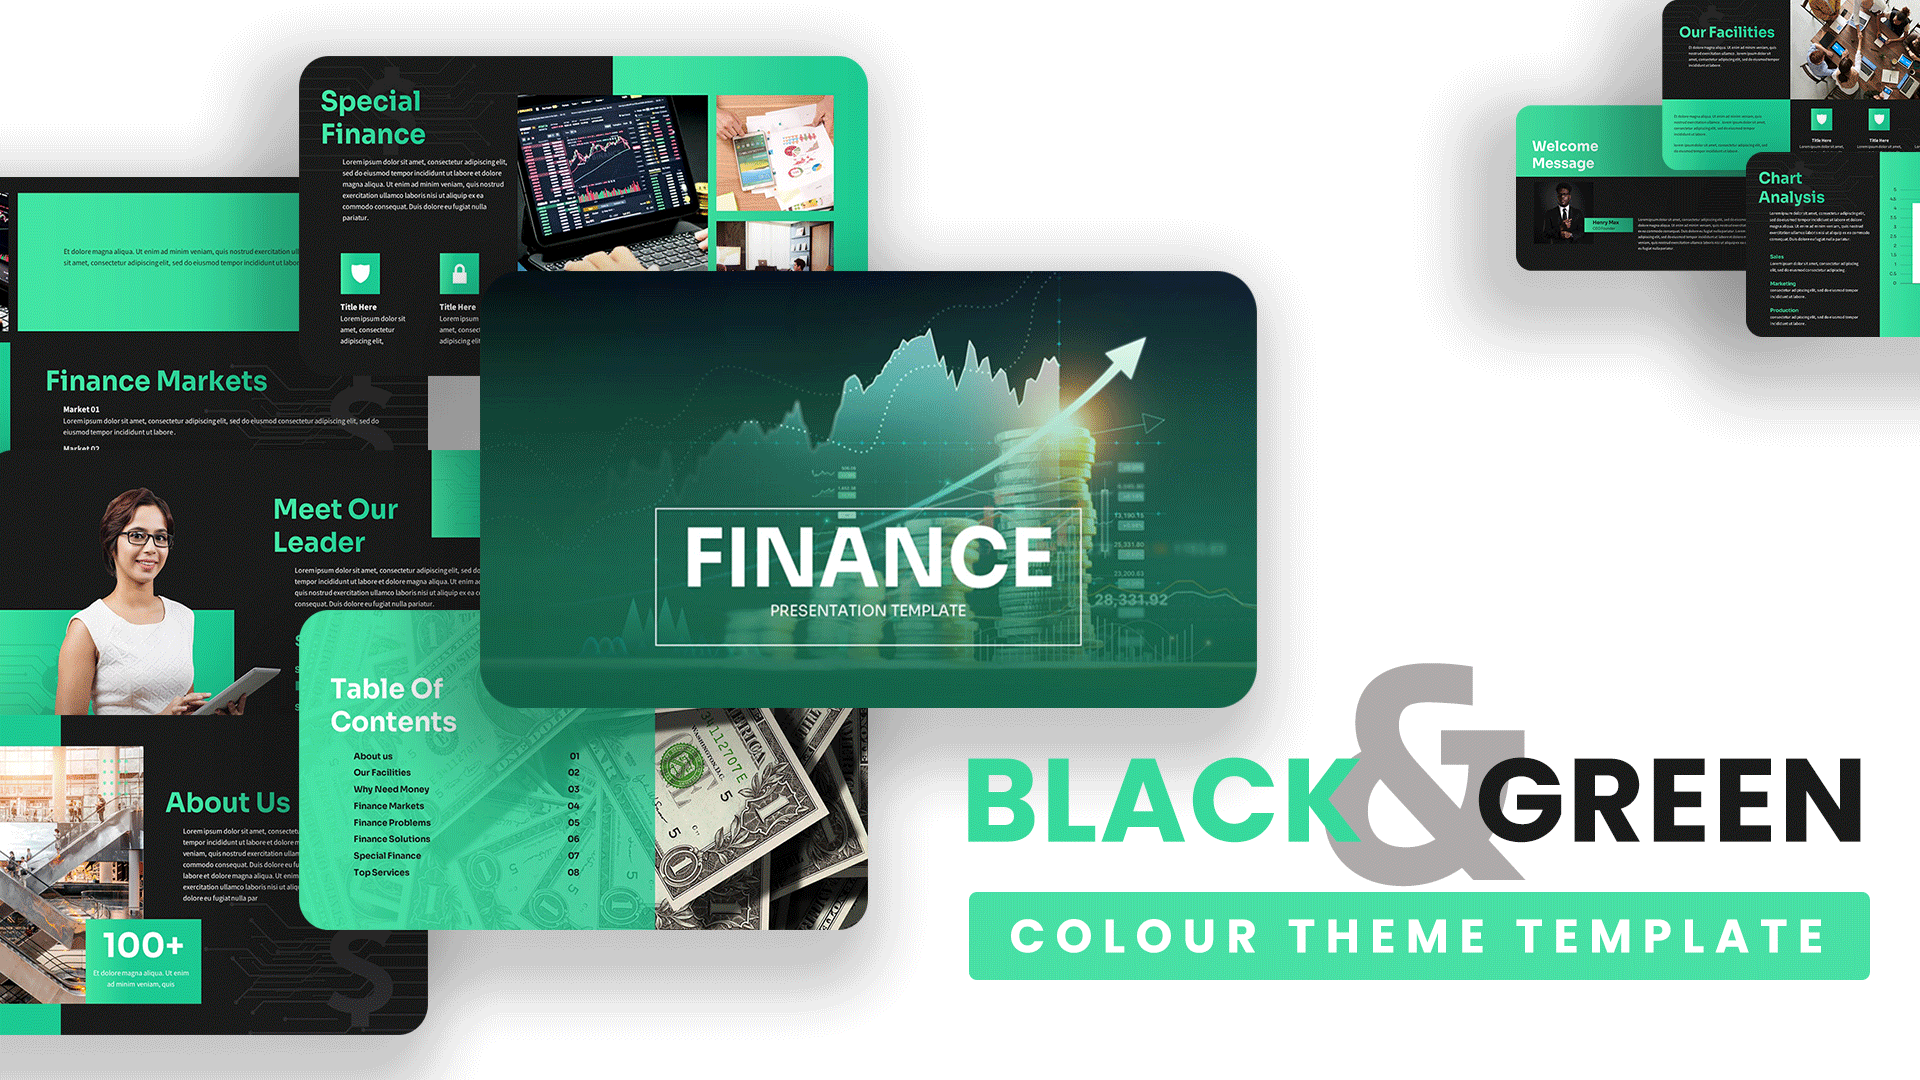
Black and Green Finance PowerPoint & Google Slides Template
Marketing
Finance Pitch Deck Template with Green Gradient for PowerPoint & Google Slides
Pitch Deck
Free Modern Green Finance Slide Deck Template for PowerPoint & Google Slides
Finance
Free
Dynamic Investment & Finance Growth Template for PowerPoint & Google Slides
Finance
Finance AI Strategy & Insights Template for PowerPoint & Google Slides
AI
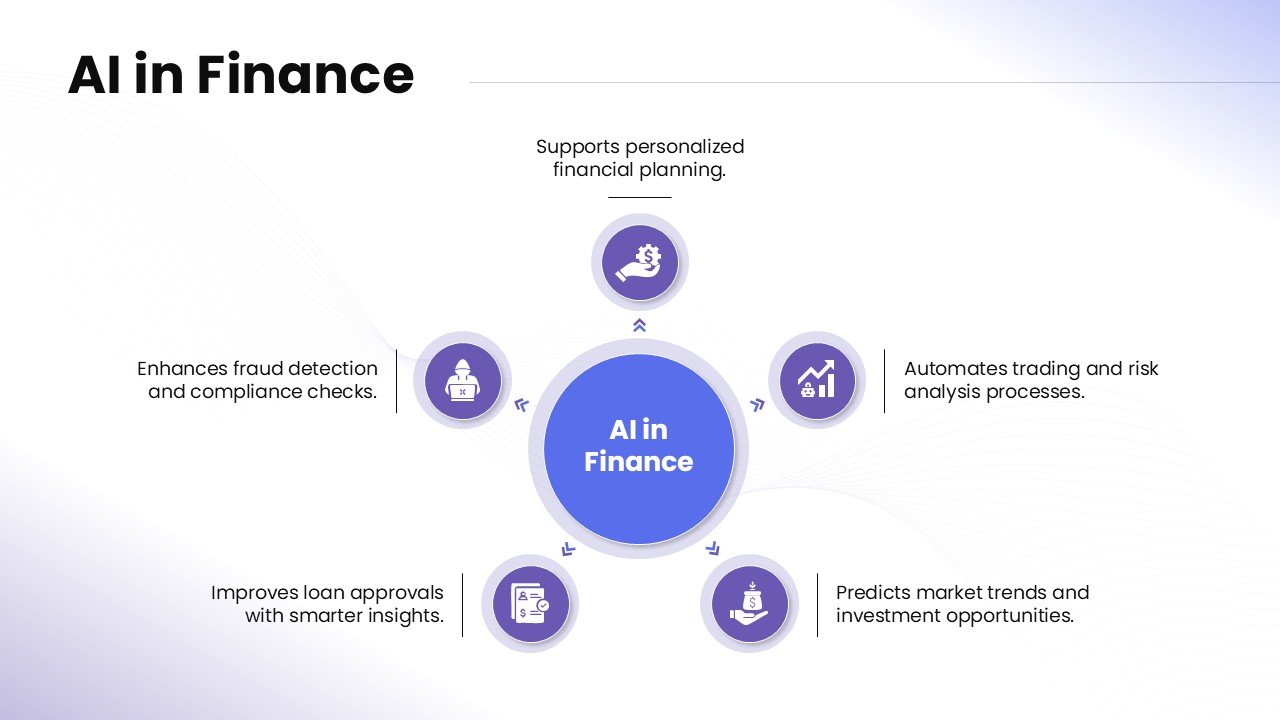
AI in Finance Overview template for PowerPoint & Google Slides
AI
Bank and Finance Template for PowerPoint & Google Slides
Finance
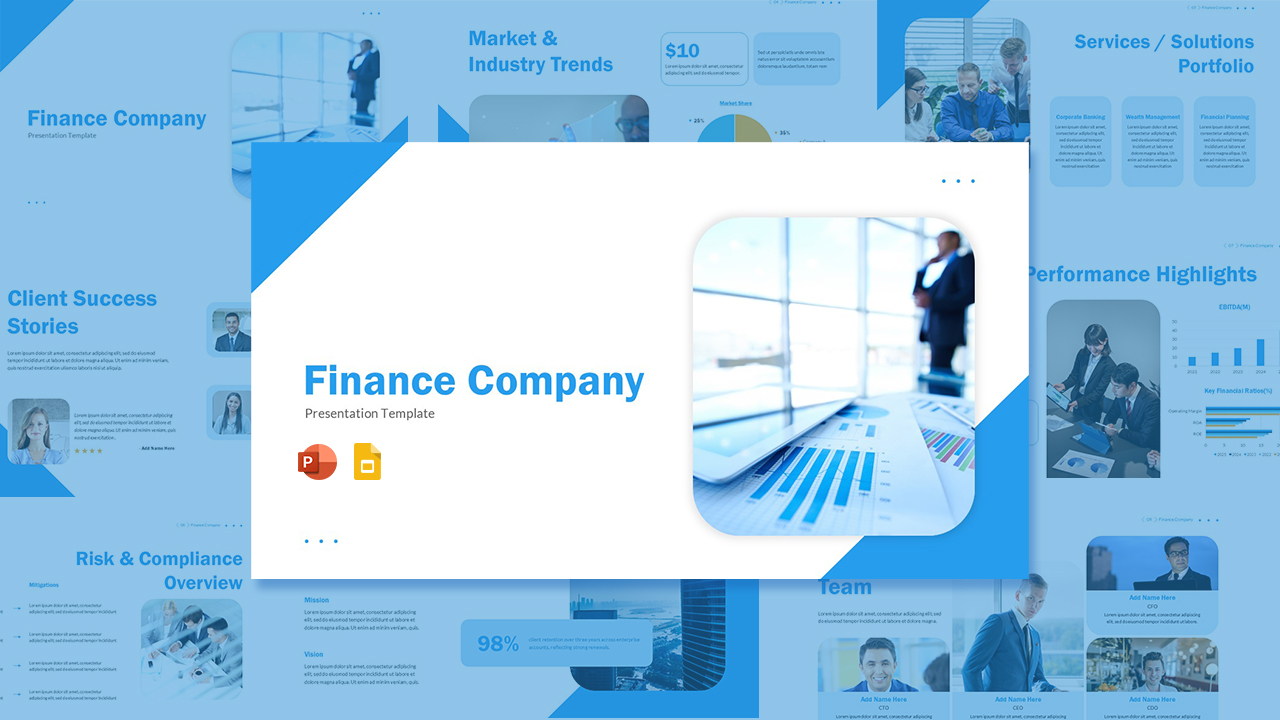
Finance Company Template for PowerPoint & Google Slides
Finance
Service Zoom Feature Slides Comparison template for PowerPoint & Google Slides
Process
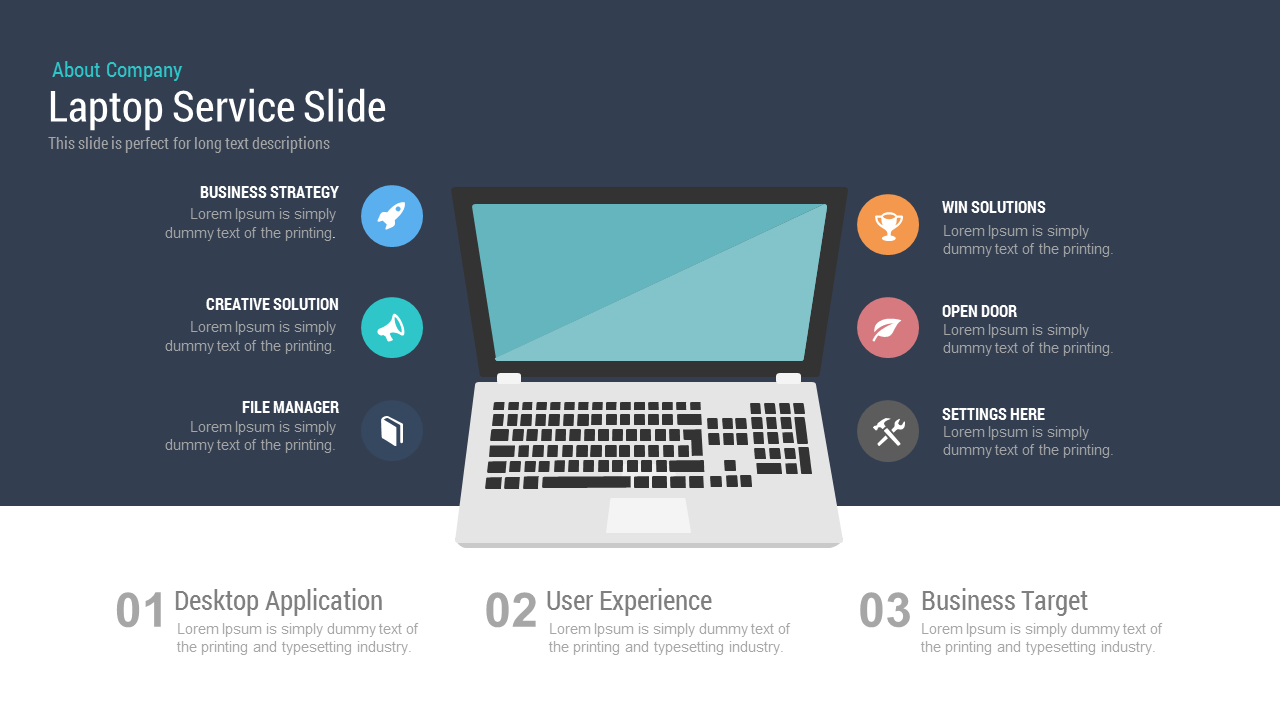
Free Laptop Service Slide template for PowerPoint & Google Slides
Business
Free
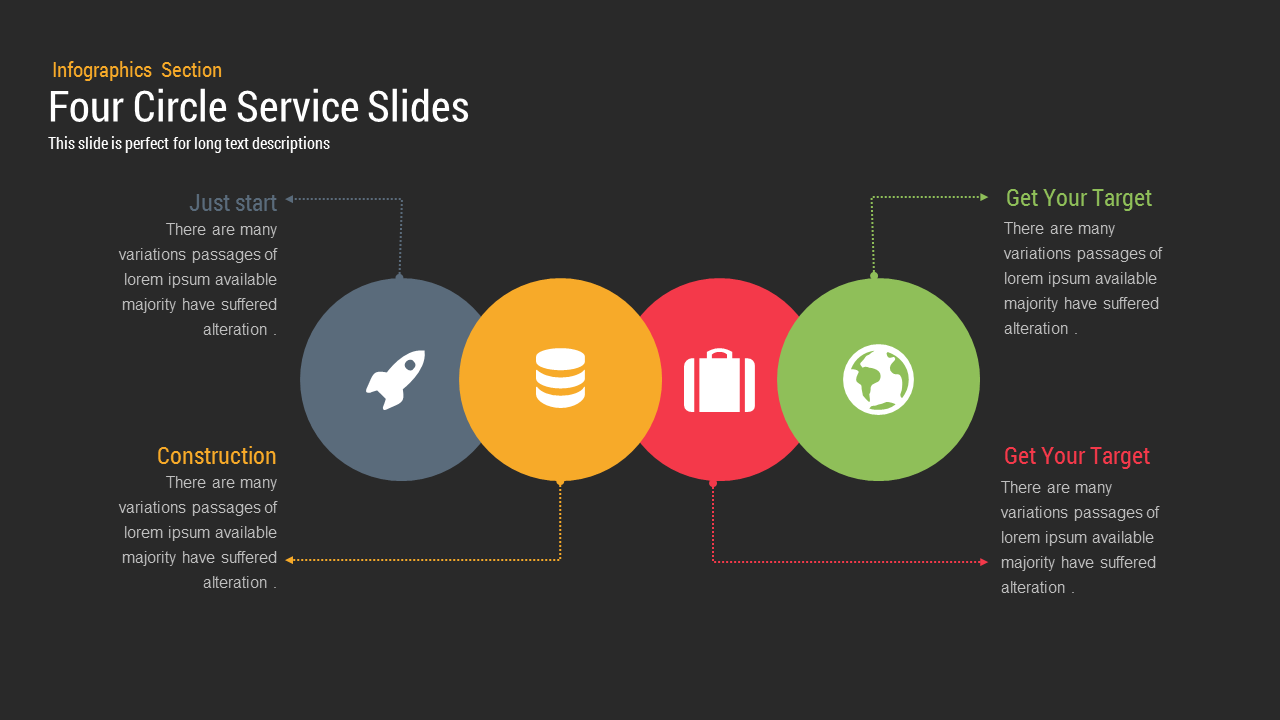
Four Circle Service template for PowerPoint & Google Slides
Process

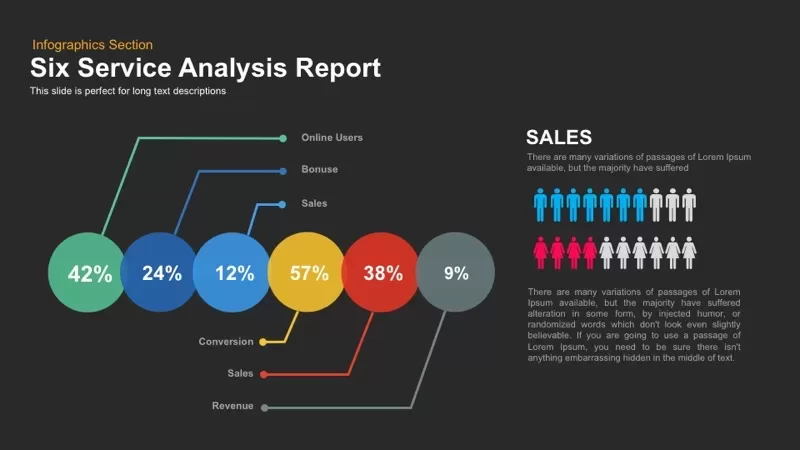
Six Service Analysis Report template for PowerPoint & Google Slides
Infographics
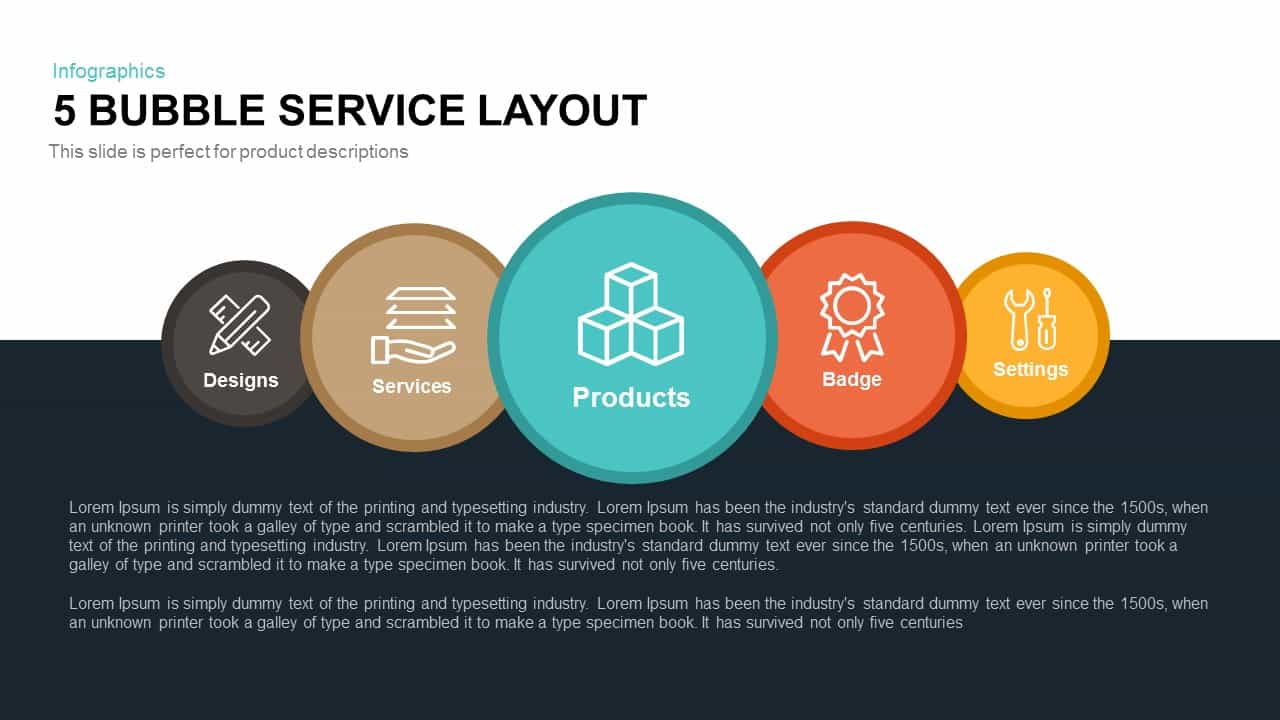
5 Bubble Service Layout Diagram Template for PowerPoint & Google Slides
Process
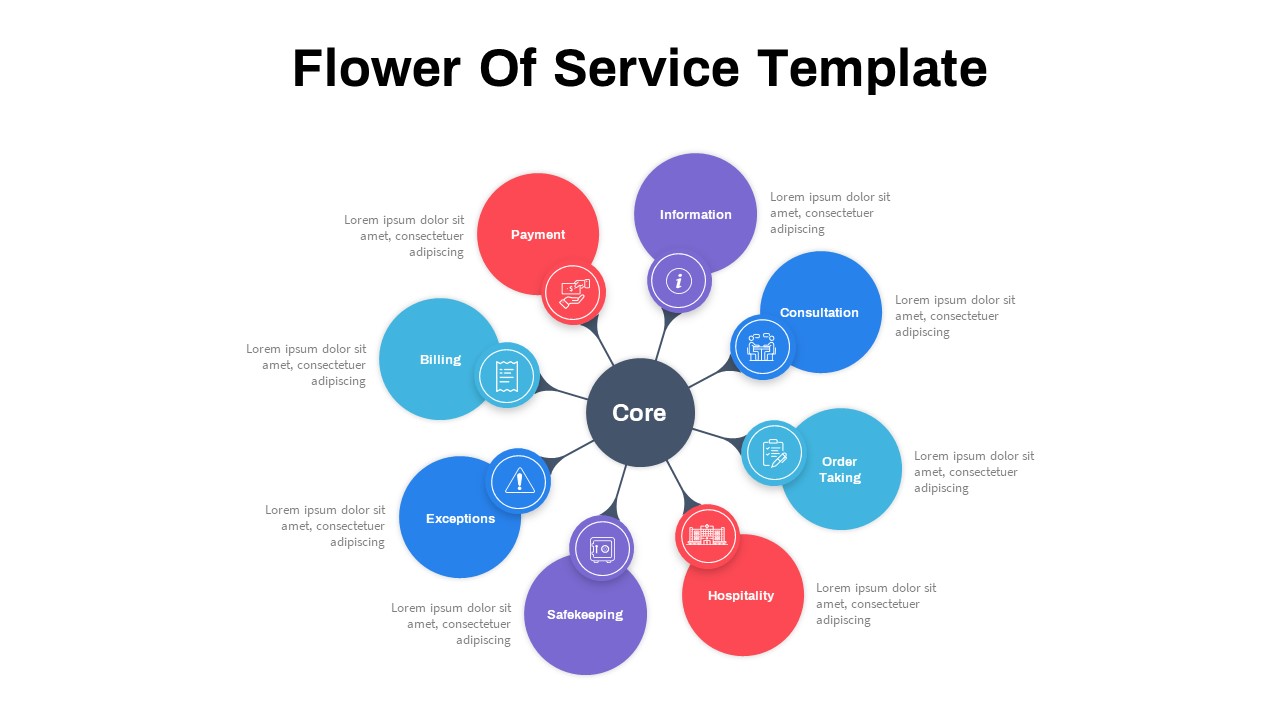
Flower of Service template for PowerPoint & Google Slides
Process

Creative Zigzag Circle Service Steps Template for PowerPoint & Google Slides
Process
Clean Mobile Service Comparison Slide Template for PowerPoint & Google Slides
Comparison
Mobile Service Features Infographic Template for PowerPoint & Google Slides
Process
Service Content Timeline Diagram Template for PowerPoint & Google Slides
Timeline
Professional Box Service Diagram Template for PowerPoint & Google Slides
Comparison

Service Features Presentation template for PowerPoint & Google Slides
Business Proposal
Customer Service Strategy template for PowerPoint & Google Slides
Business Strategy

Service Design Process Journey template for PowerPoint & Google Slides
Process
Trends Shaping Customer Service Strategy template for PowerPoint & Google Slides
Marketing
Six-Stage Service Process Workflow Template for PowerPoint & Google Slides
Process
Service Design Process Journey Template for PowerPoint & Google Slides
Process
Customer Service Metaphor Infographic Template for PowerPoint & Google Slides
Customer Experience
6 Stage Service Process Infographic Template for PowerPoint & Google Slides
Process
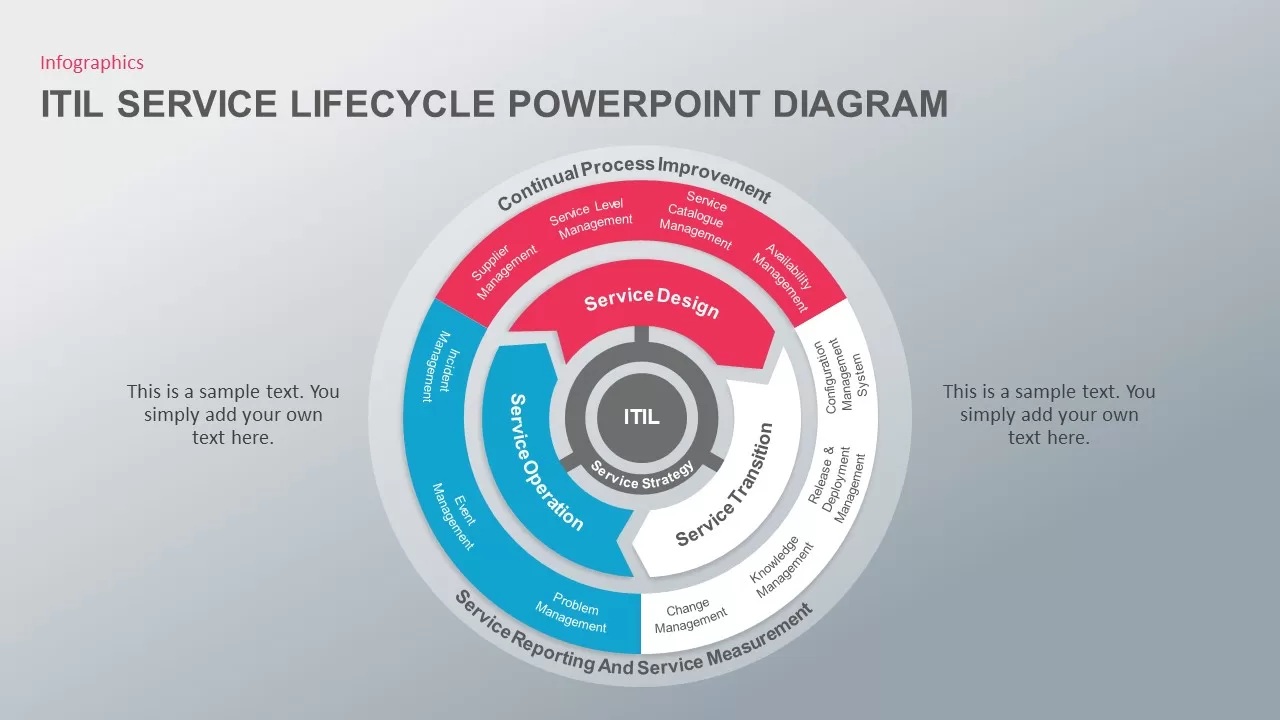
ITIL Service Lifecycle Circular Diagram Template for PowerPoint & Google Slides
Circular
Streaming Service Overview template for PowerPoint & Google Slides
Business Proposal
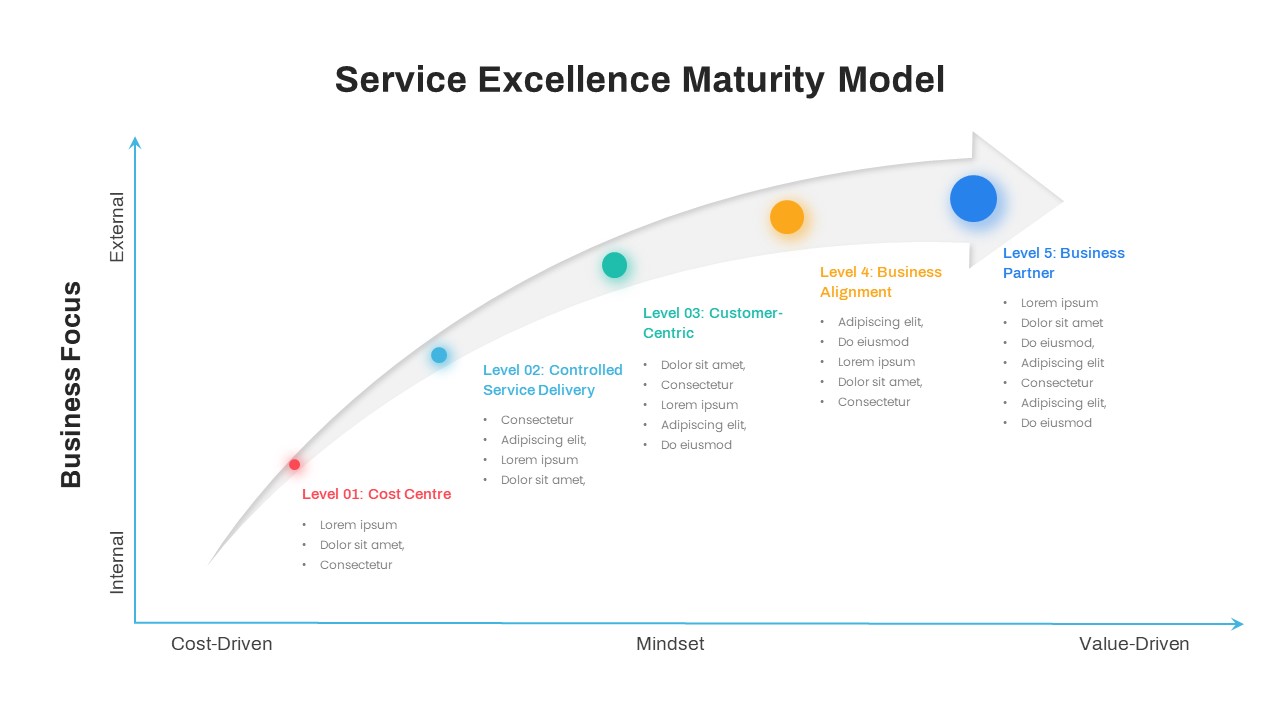
Service Excellence Maturity 5-Stage Template for PowerPoint & Google Slides
Process
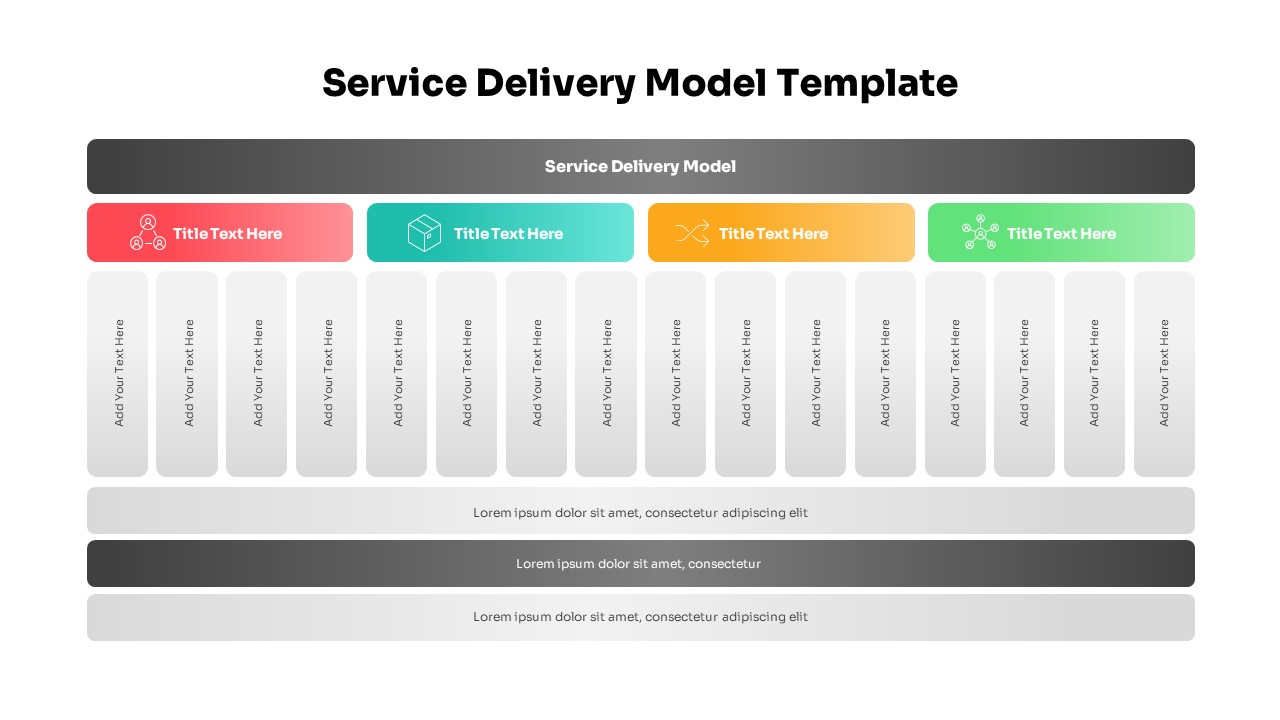
Comprehensive Service Delivery Model Template for PowerPoint & Google Slides
Project
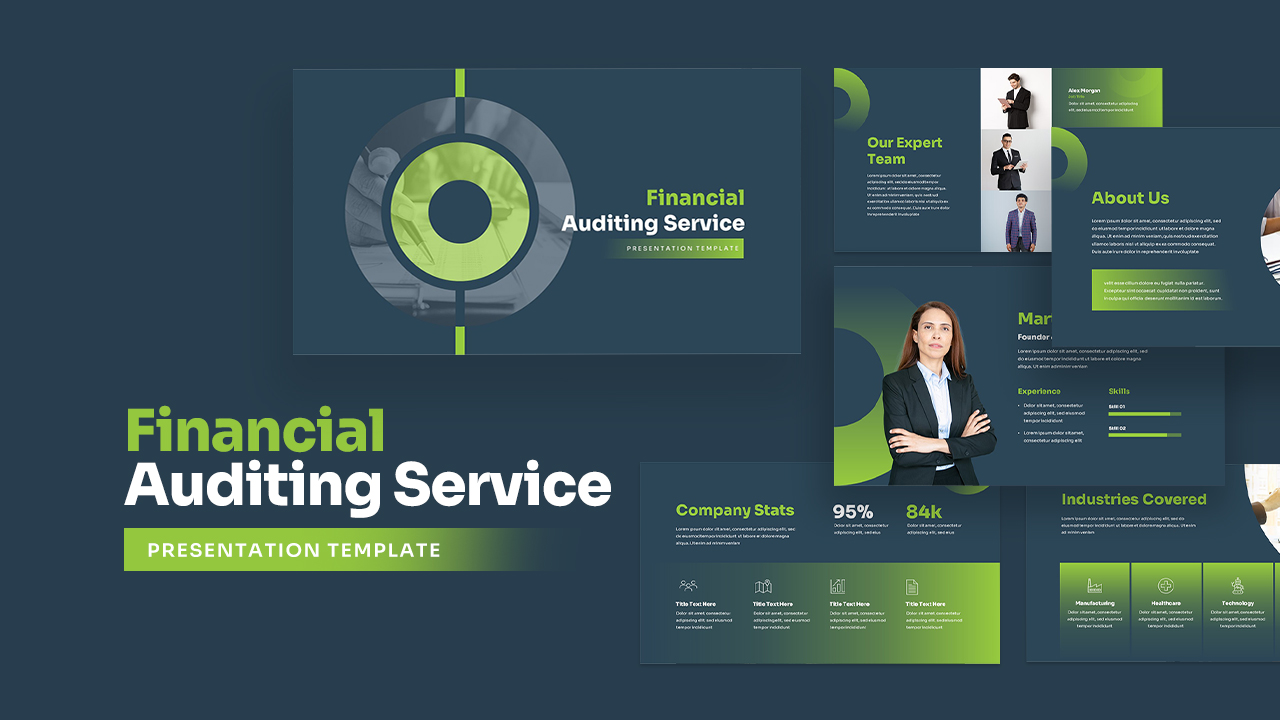
Corporate Financial Auditing Service Template for PowerPoint & Google Slides
Finance

Financial Advisory Service Pitch Deck Template for PowerPoint & Google Slides
Finance
Free Community Service Presentation Deck Template for PowerPoint & Google Slides
Company Profile
Free
Cleaning Service Blue Theme Slide Deck Template for PowerPoint & Google Slides
Pitch Deck
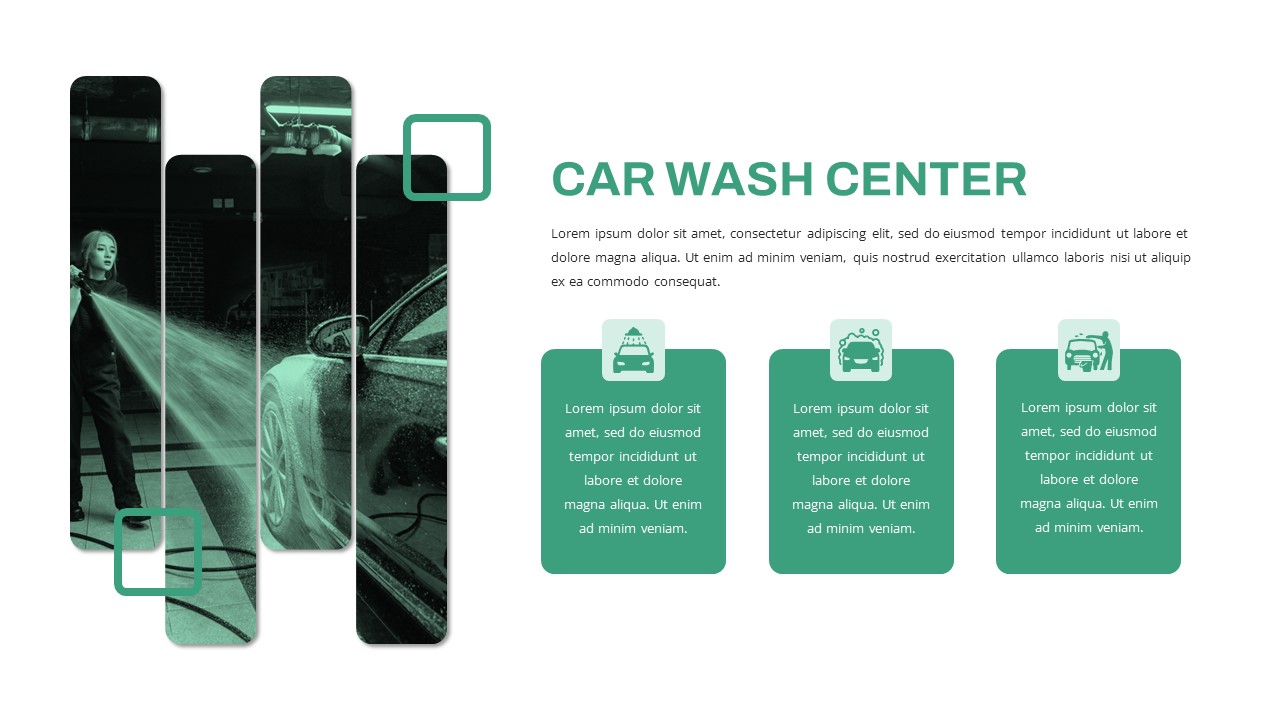
Free Car Wash Center Service Features Slide Template for PowerPoint & Google Slides
Business Proposal
Free
Modern Professional Medical Service Template for PowerPoint & Google Slides
Health
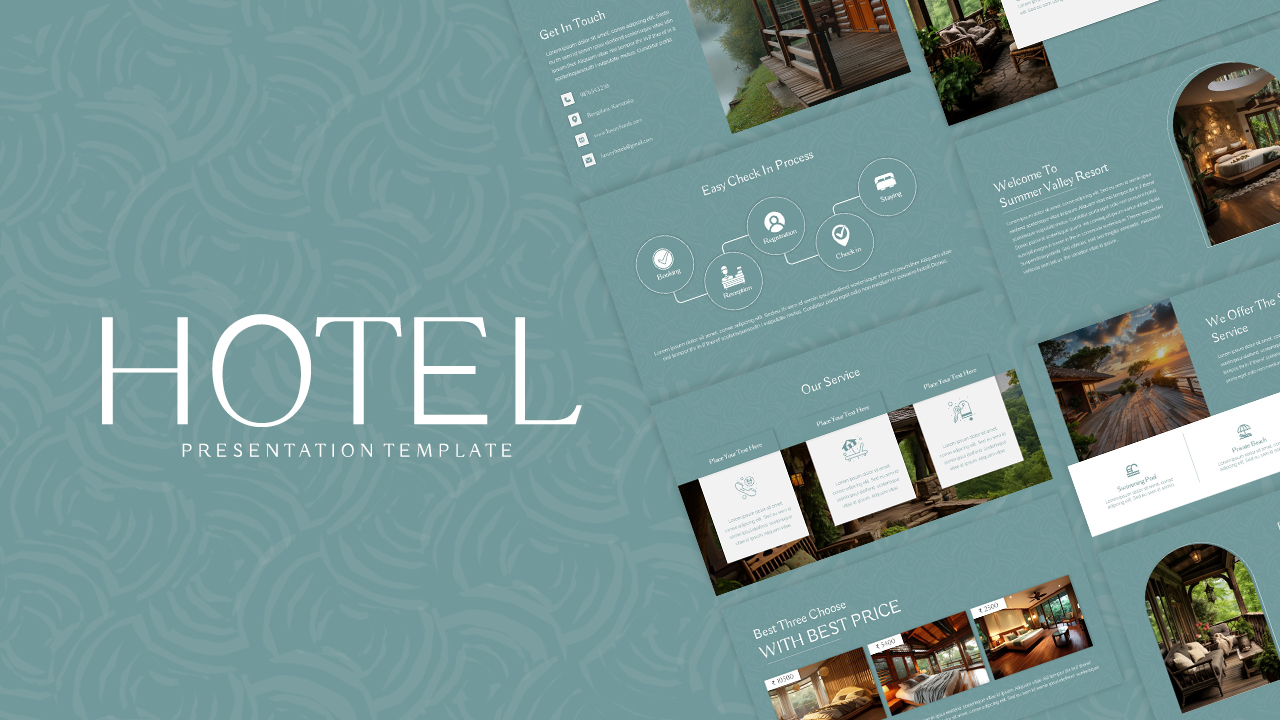
Free Nature-Inspired Hotel Service Showcase Template for PowerPoint & Google Slides
Company Profile
Free
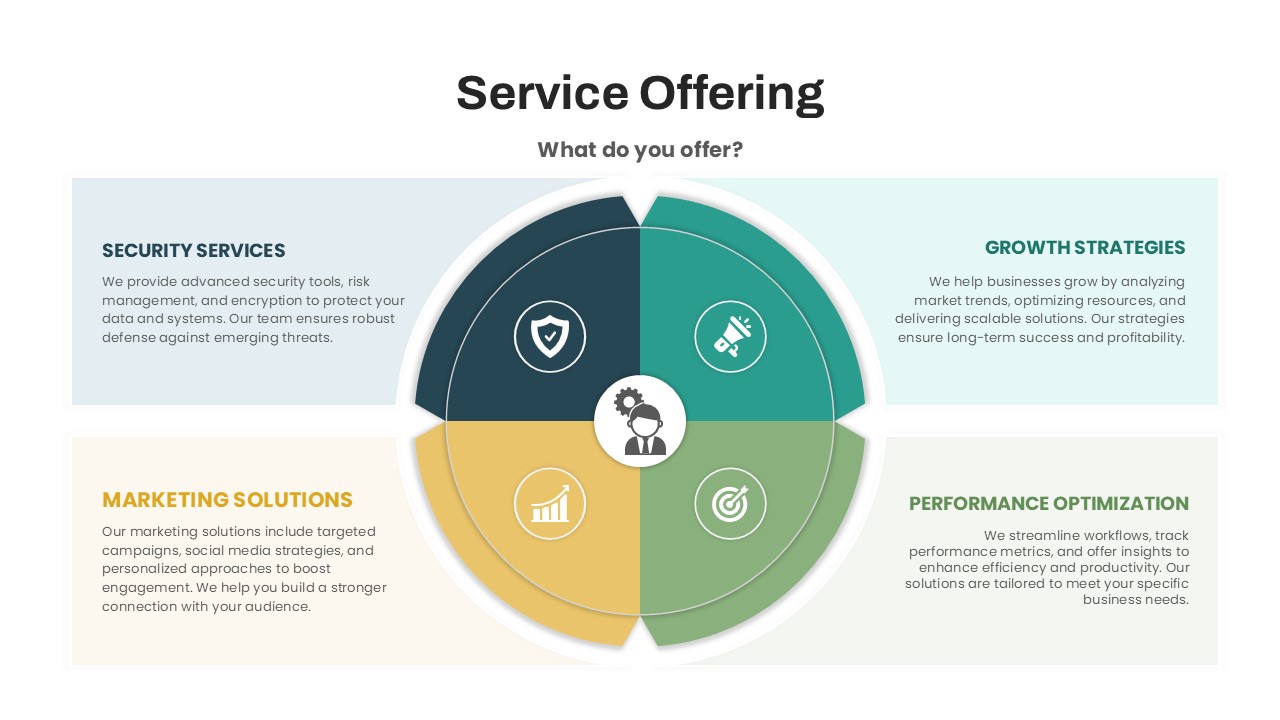
Circular Service Offering Diagram Template for PowerPoint & Google Slides
Circular
Service Catalog Circular Infographic Template for PowerPoint & Google Slides
Circular
Service Blueprint Process Flow Template for PowerPoint & Google Slides
Process
Customer Service Management Process Template for PowerPoint & Google Slides
Process
Platform as a Service Cloud Diagram Template for PowerPoint & Google Slides
Cloud Computing
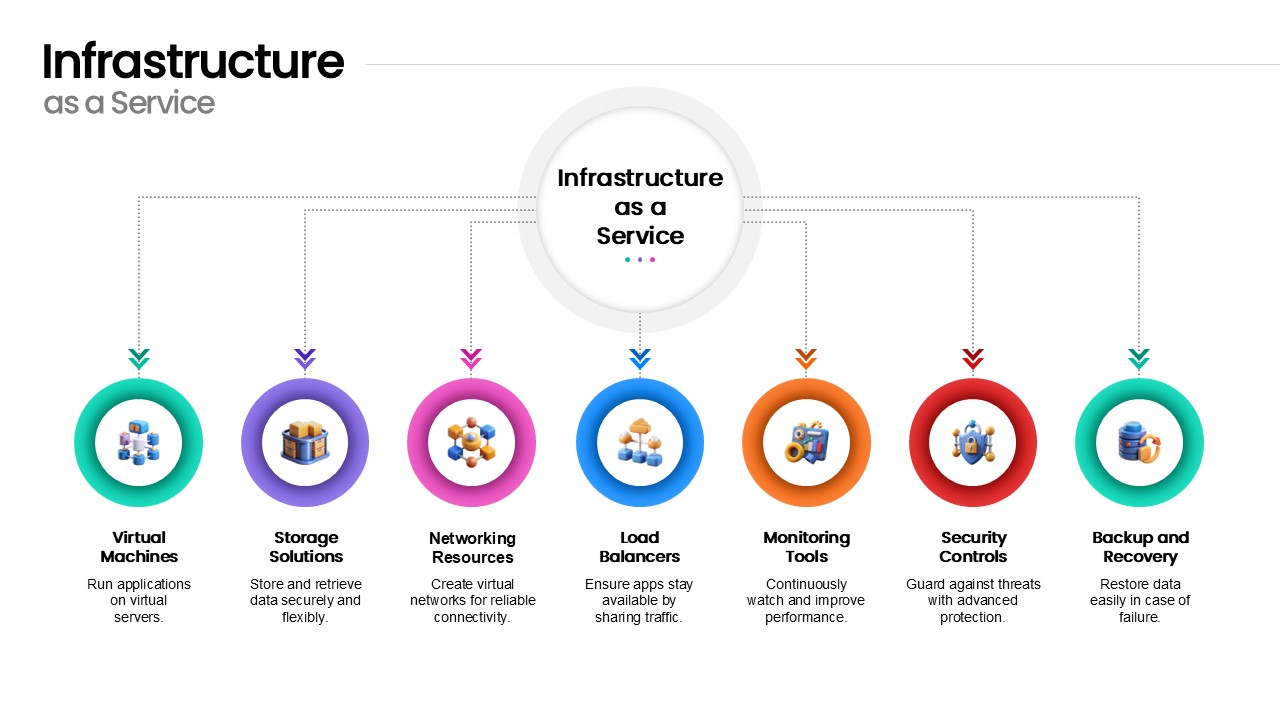
Infrastructure as a Service Diagram Template for PowerPoint & Google Slides
Cloud Computing
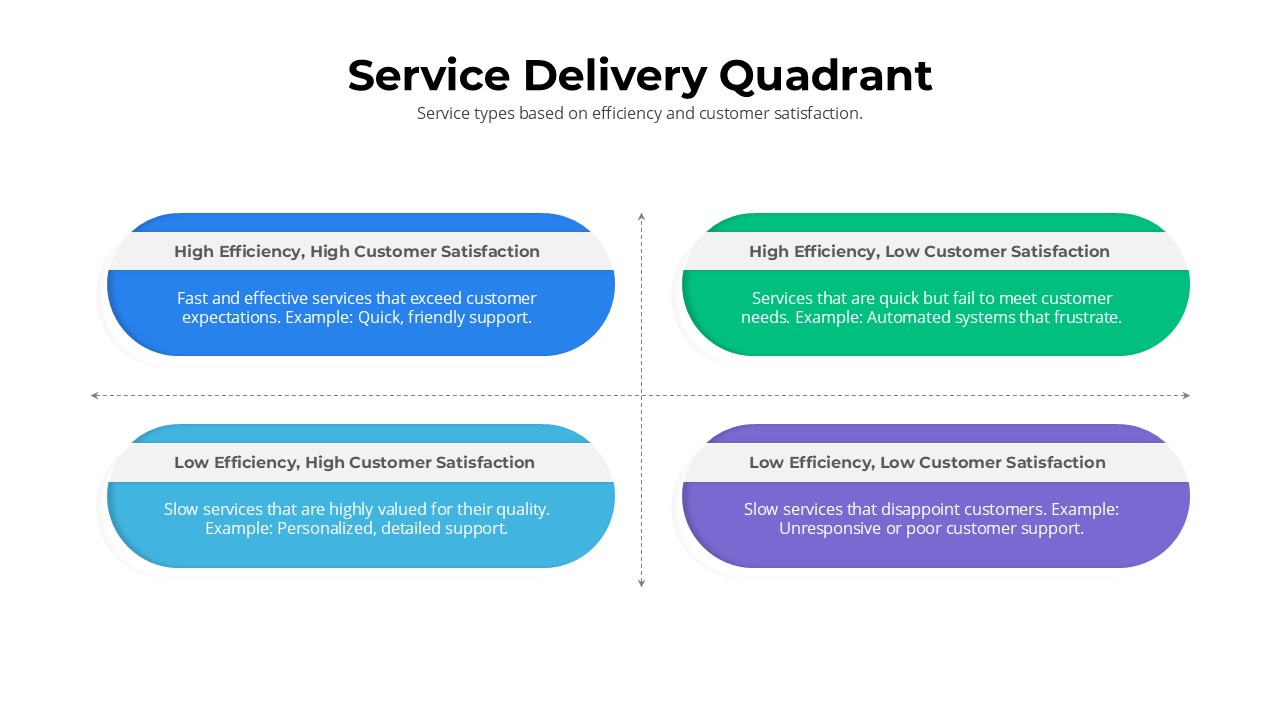
Service Delivery Quadrant Slide Template for PowerPoint & Google Slides
Comparison
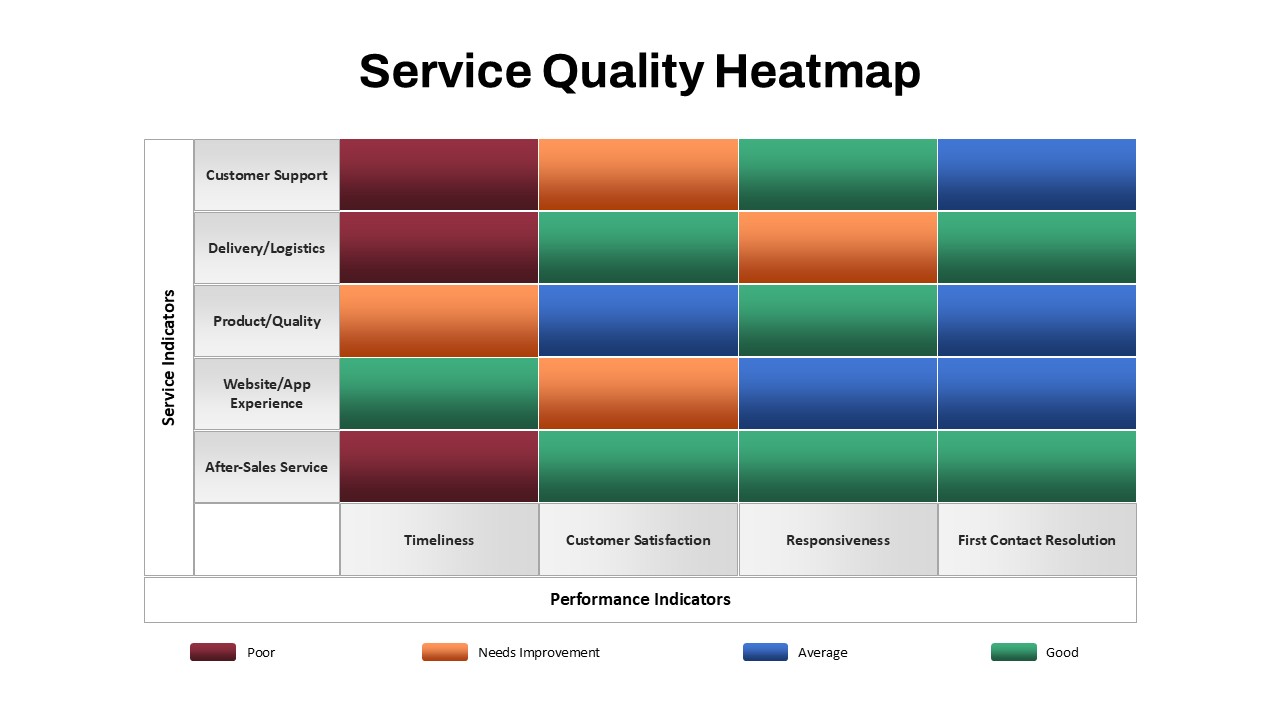
Service Quality Heatmap Template for PowerPoint & Google Slides
Business
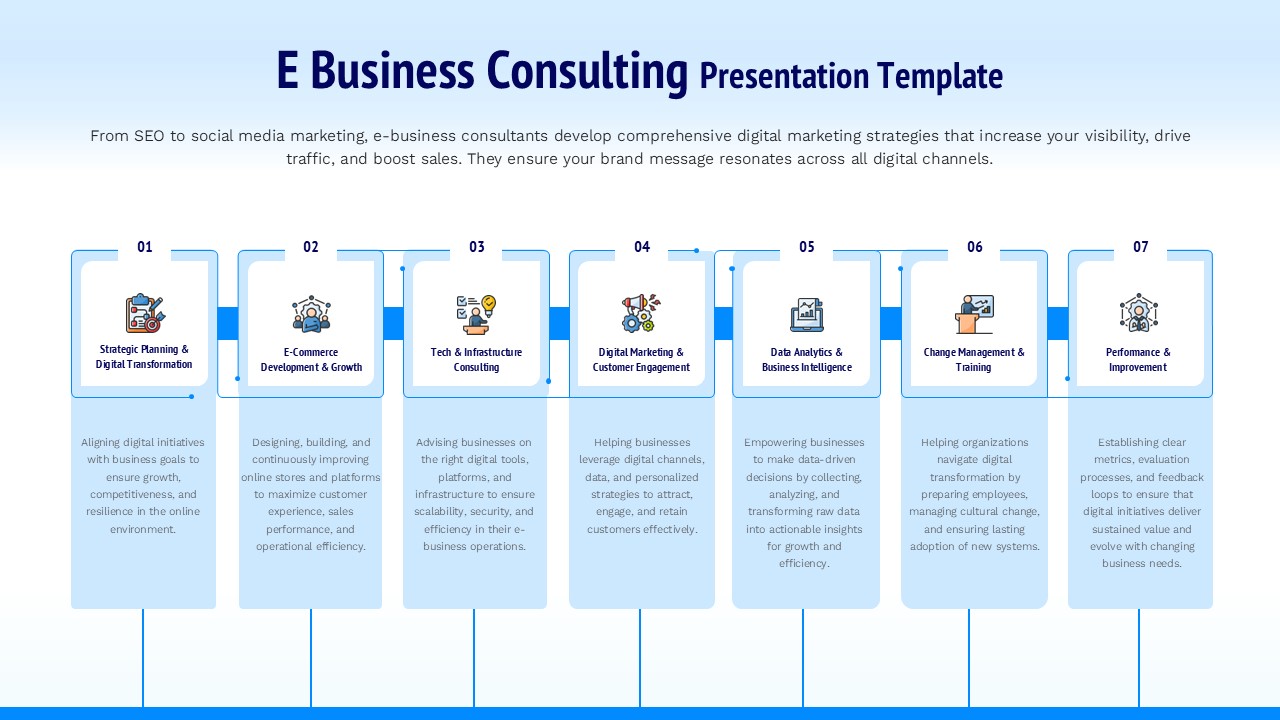
E Business Consulting Service Framework Template for PowerPoint & Google Slides
Business Strategy
Four Ribbon Service Slide for PowerPoint & Google Slides
Infographics
Cab Service Presentation Deck for PowerPoint & Google Slides
Decks
Free Customer Service Breakdown Slide for PowerPoint & Google Slides
Infographics
Free
Free Creative Hemisphere Infographics template for PowerPoint & Google Slides
Infographics
Free
Ring Infographics template for PowerPoint & Google Slides
Circular
Circle Abstract Shape Infographics Template for PowerPoint & Google Slides
Circular
Dynamic Creative Head Infographics Template for PowerPoint & Google Slides
Circular
Four Arrow Square Infographics Template for PowerPoint & Google Slides
Arrow
Tree Infographics template for PowerPoint & Google Slides
Infographics
Overcoming Challenges Infographics template for PowerPoint & Google Slides
Opportunities Challenges
Business Strategy Infographics Diagram Template for PowerPoint & Google Slides
Business Strategy
Four Segment Infographics Element Template for PowerPoint & Google Slides
Comparison
Free Layer Infographics template for PowerPoint & Google Slides
Process
Free

Seven-Stage Timeline Infographics Template for PowerPoint & Google Slides
Timeline
Free Professional Cloud Infographics Template for PowerPoint & Google Slides
Process
Free
Business Innovation Infographics template for PowerPoint & Google Slides
Process
Five-Stage Pyramid Infographics Process Template for PowerPoint & Google Slides
Pyramid
Mobile Infographics Data Visualization Template for PowerPoint & Google Slides
Infographics
Business Growth Infographics Template for PowerPoint & Google Slides
Roadmap
Six-Step Purple Gradient Infographics Template for PowerPoint & Google Slides
Process
Recruitment Process Funnel Infographics Template for PowerPoint & Google Slides
Recruitment
Three-Step Process Infographics Template for PowerPoint & Google Slides
Process
3D Cube Infographics template for PowerPoint & Google Slides
Process
Box Diagram Infographics template for PowerPoint & Google Slides
Business
Modern Circular Infographics Template for PowerPoint & Google Slides
Circular
Five-Step Circular Badge Infographics Template for PowerPoint & Google Slides
Circular
5 Step Sales Planning Infographics Template for PowerPoint & Google Slides
Process
Opposing Ideas Infographics Pack Template for PowerPoint & Google Slides
Comparison
Dental Infographics Process template for PowerPoint & Google Slides
Health
Theory of Change Infographics Pack Template for PowerPoint & Google Slides
Process
Agenda Infographics Structure template for PowerPoint & Google Slides
Business Plan
Agenda Infographics List template for PowerPoint & Google Slides
Business Plan
Colorful Process Flow Infographics Template for PowerPoint & Google Slides
Process
Turtle Diagram Infographics Template for PowerPoint & Google Slides
Process
Table of Contents Infographics template for PowerPoint & Google Slides
Company Profile
Supply Chain Circular Process Infographics Template for PowerPoint & Google Slides
Business Strategy
Agriculture Infographics Slide with Progress Rings & Metrics Template for PowerPoint & Google Slides
Pie/Donut
5 Layer Concentric Circles Infographics Template for PowerPoint & Google Slides
Circular
Flywheel Infographics Pack Template for PowerPoint & Google Slides
Circular
Flywheel Infographics template for PowerPoint & Google Slides
Business Strategy
Conflict Infographics Comparison Template for PowerPoint & Google Slides
Infographics
Pharmacology Infographics Slide Template for PowerPoint & Google Slides
Health
Free Law Infographics Slide Pack Collection Template for PowerPoint & Google Slides
Infographics
Free
Cash Flow Infographics template for PowerPoint & Google Slides
Business