Action Research Feedback Process Model Template for PowerPoint & Google Slides
Description
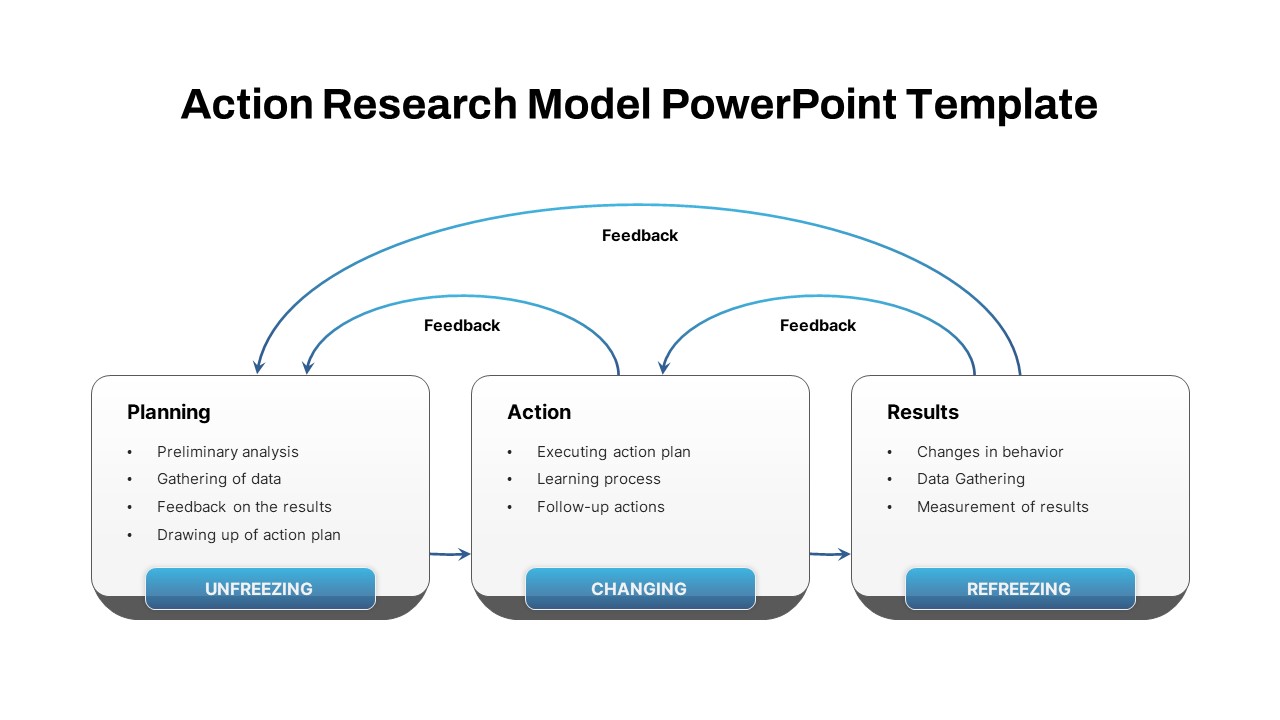
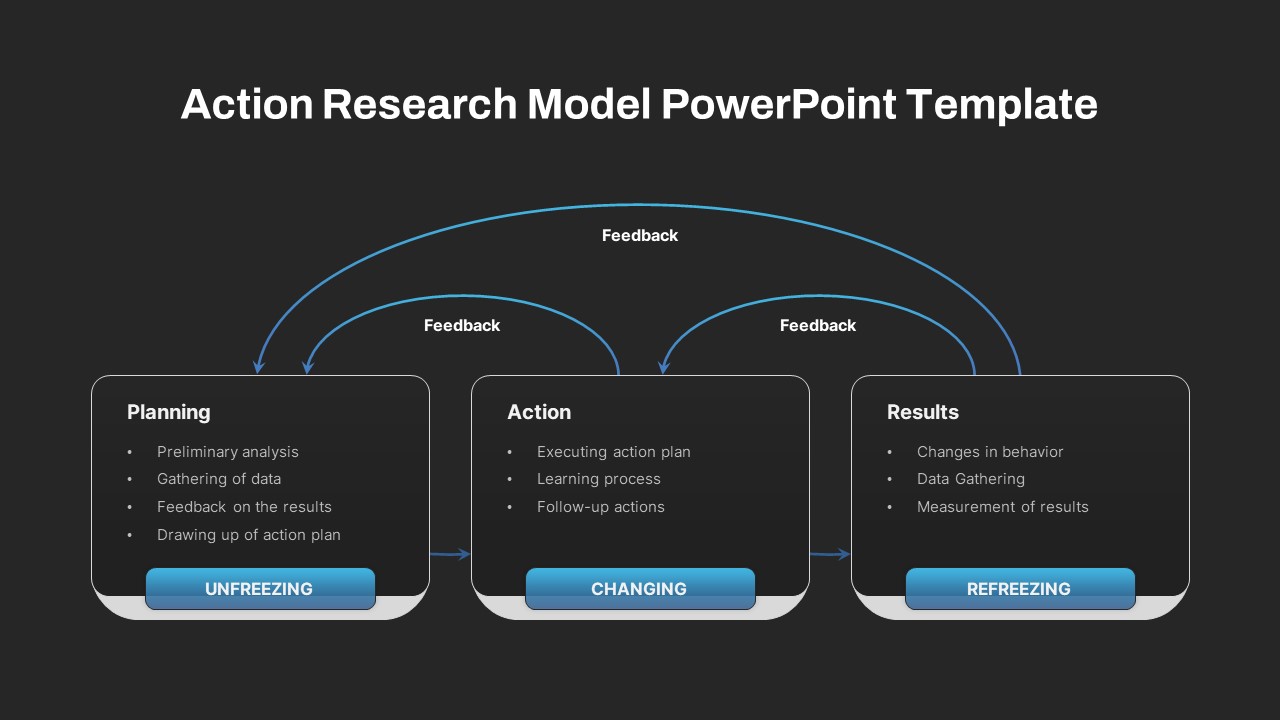
This slide presents a clear, three-stage Action Research Model diagram that guides audiences through the unfreeze-change-refreeze cycle. Three horizontally aligned rounded rectangles labeled Planning, Action, and Results each contain concise bullet lists—such as preliminary analysis, executing the action plan, and measurement of results—to illustrate core tasks within every phase. Crisp sky-blue arrows connect stages in a linear flow, while two layered feedback arcs arc above the layout, demonstrating how insights from the Results phase loop back into Planning and Action. Gradient blue call-out buttons at the base of each rectangle reinforce the Lewin-inspired stages (Unfreezing, Changing, Refreezing), and a subtle gray drop shadow beneath each shape adds depth against the clean white background.
Engineered for customization, the slide leverages editable text placeholders, adjustable connectors, and modifiable color schemes. Users can tailor the bullet copy, reposition arrows, or swap out the default blue accents to align with corporate branding. The master-slide setup ensures consistent typography and seamless resizing on PowerPoint and Google Slides, while the structured arrangement reduces editing time. Whether presenting in virtual workshops, boardroom meetings, or classroom lectures, the uncluttered design and intuitive visual cues keep stakeholder focus on methodological rigor and continuous improvement principles.
This versatile asset supports a variety of methodological presentations—from organizational change initiatives and quality improvement programs to academic research proposals and agile retrospectives. By combining clear phase definitions with dynamic feedback mechanics, this slide empowers speakers to communicate iterative processes with maximum clarity and minimal effort.
All elements are fully resizable vector shapes, ensuring crystal-clear output at any resolution and effortless adaptation to custom layouts
Who is it for
Organizational development consultants, change managers, HR leaders, process improvement specialists, and academic researchers can leverage this visually intuitive diagram to illustrate iterative action research cycles
Other Uses
Repurpose this slide for quality improvement workshops, agile sprint retrospectives, employee training modules, project status reviews, or behavioral intervention planning. It also adapts well to continuous improvement and PDCA cycle presentations
Login to download this file

Item ID
SB04372
Related Templates

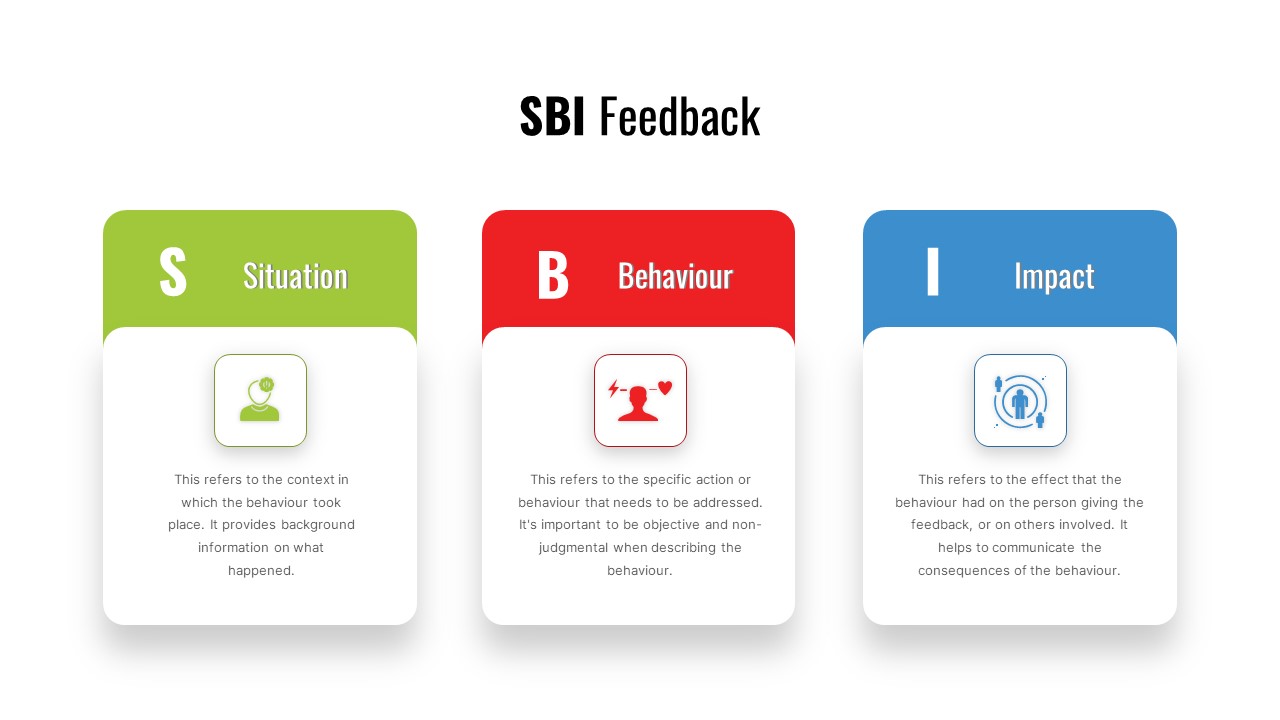
SBI Feedback Model Process Diagram Template for PowerPoint & Google Slides
Process
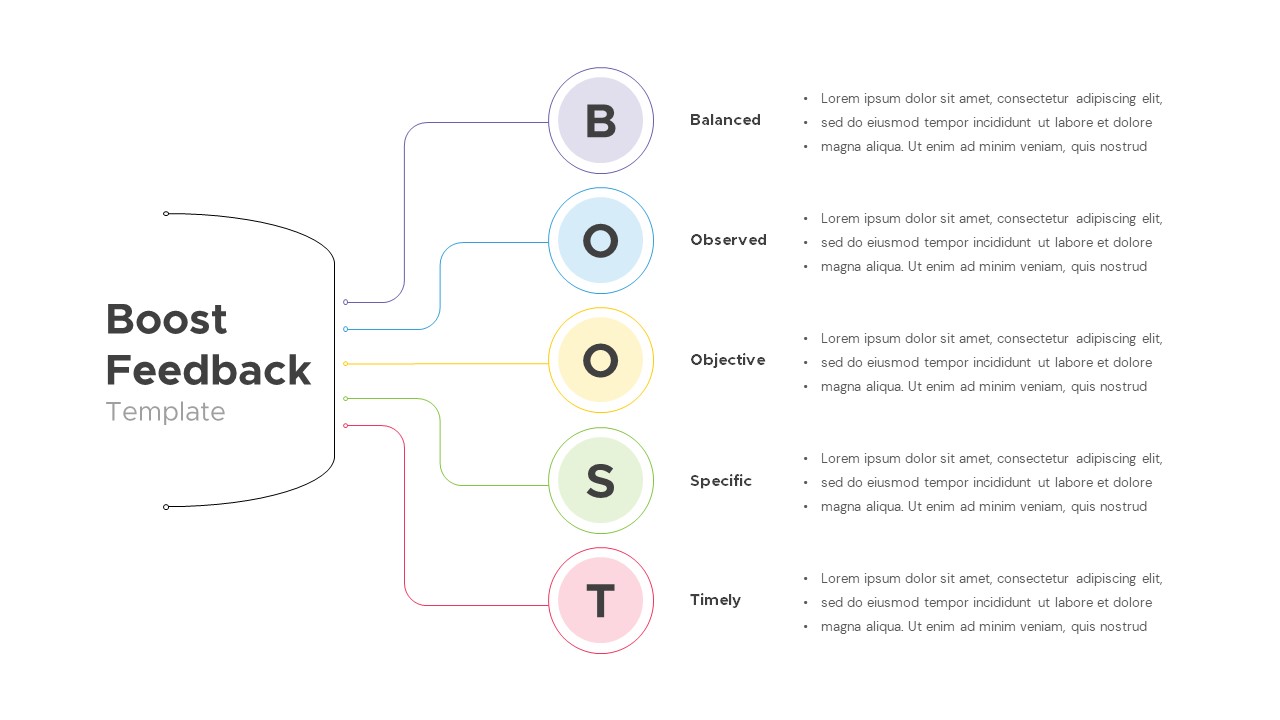
Interactive Boost Feedback Model Diagram Template for PowerPoint & Google Slides
Process
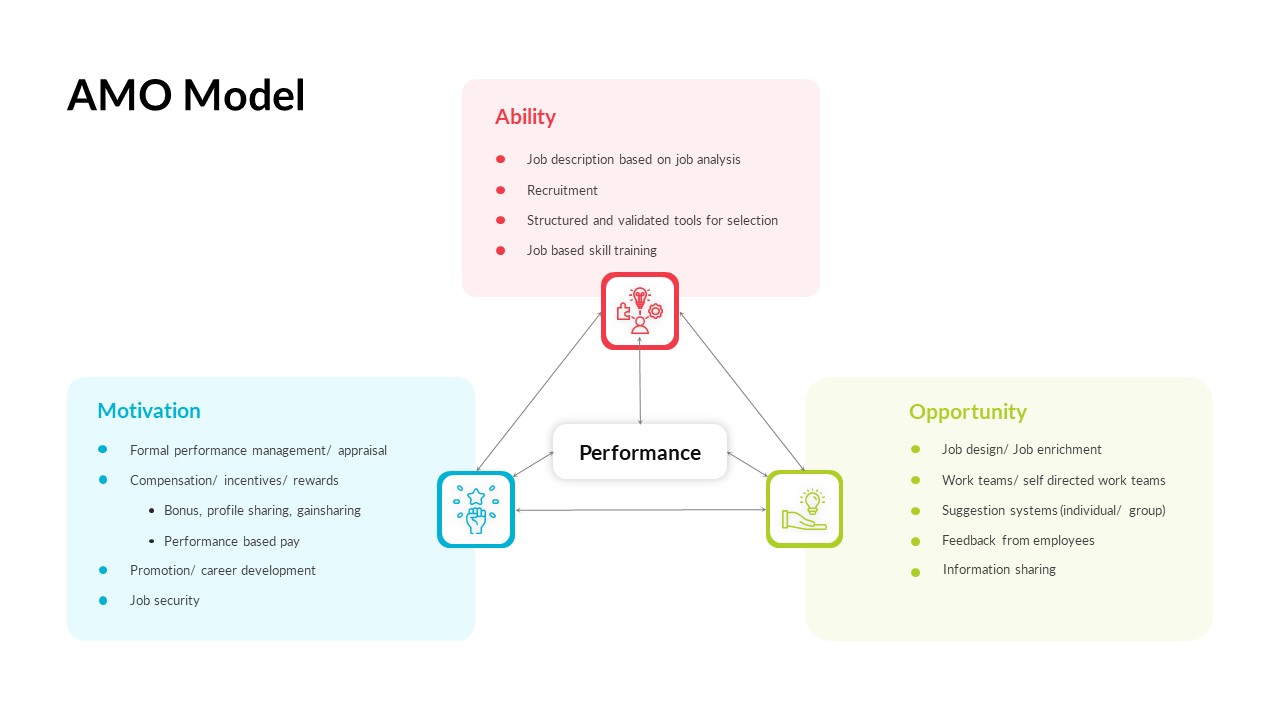
AMO Performance Model Feedback Diagram Template for PowerPoint & Google Slides
Employee Performance
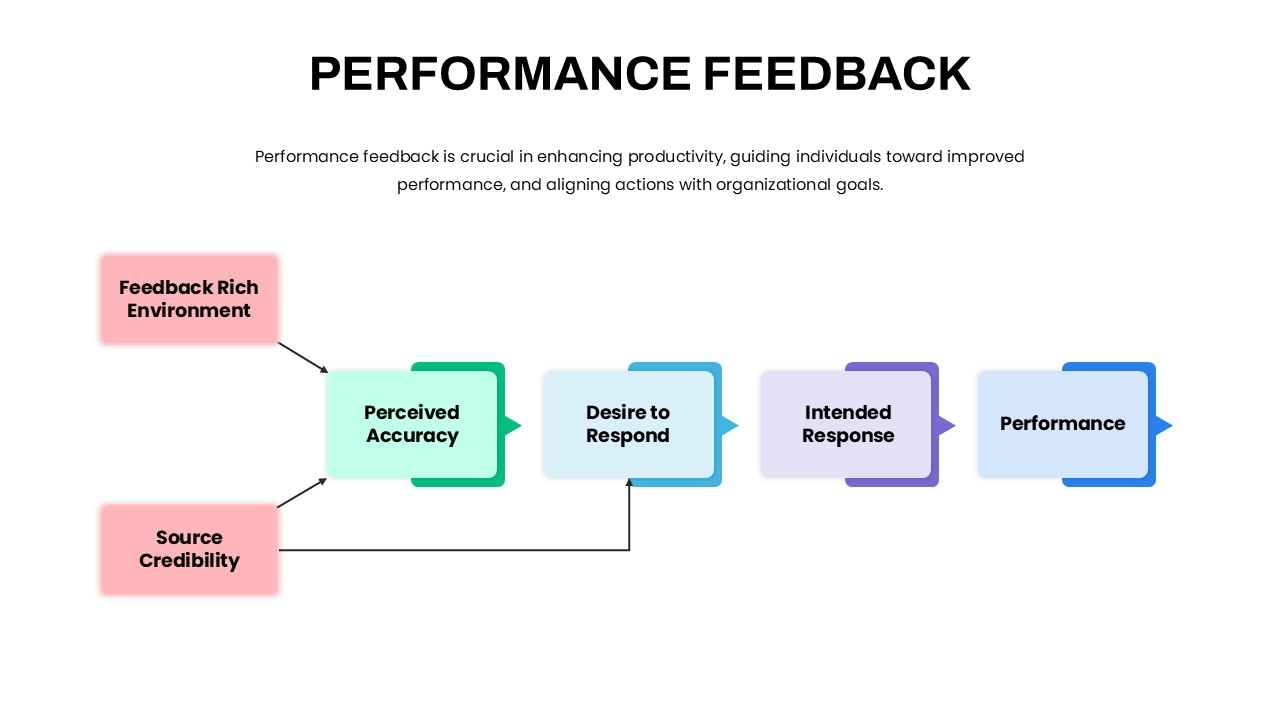
Performance Feedback Model for PowerPoint & Google Slides
Employee Performance
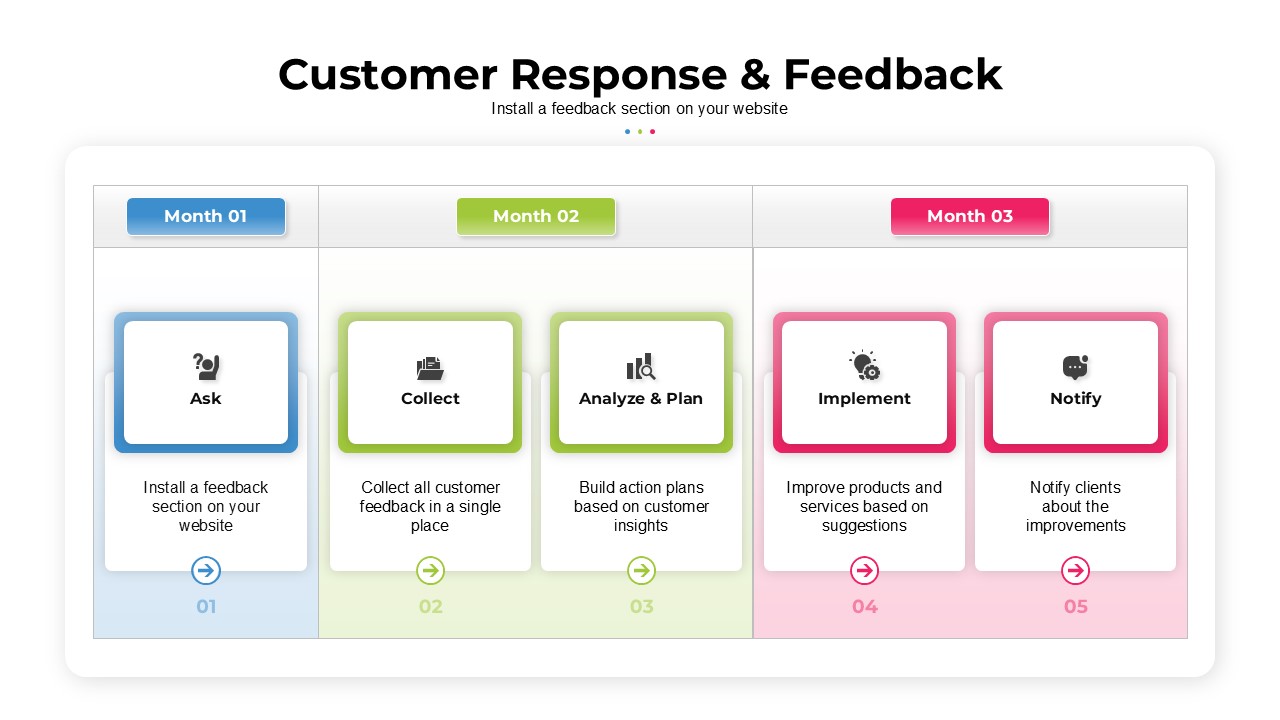
Customer Response & Feedback Process template for PowerPoint & Google Slides
Business Proposal
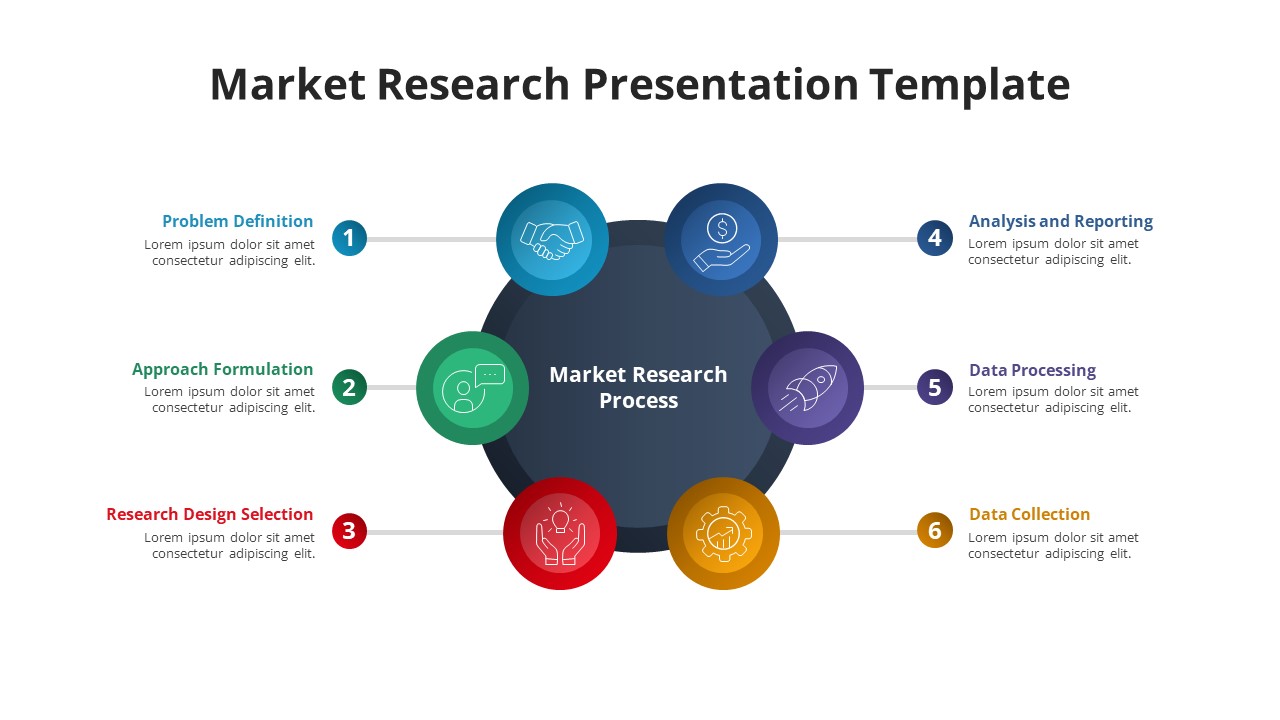
Free Six-Phase Market Research Process Template for PowerPoint & Google Slides
Process
Free
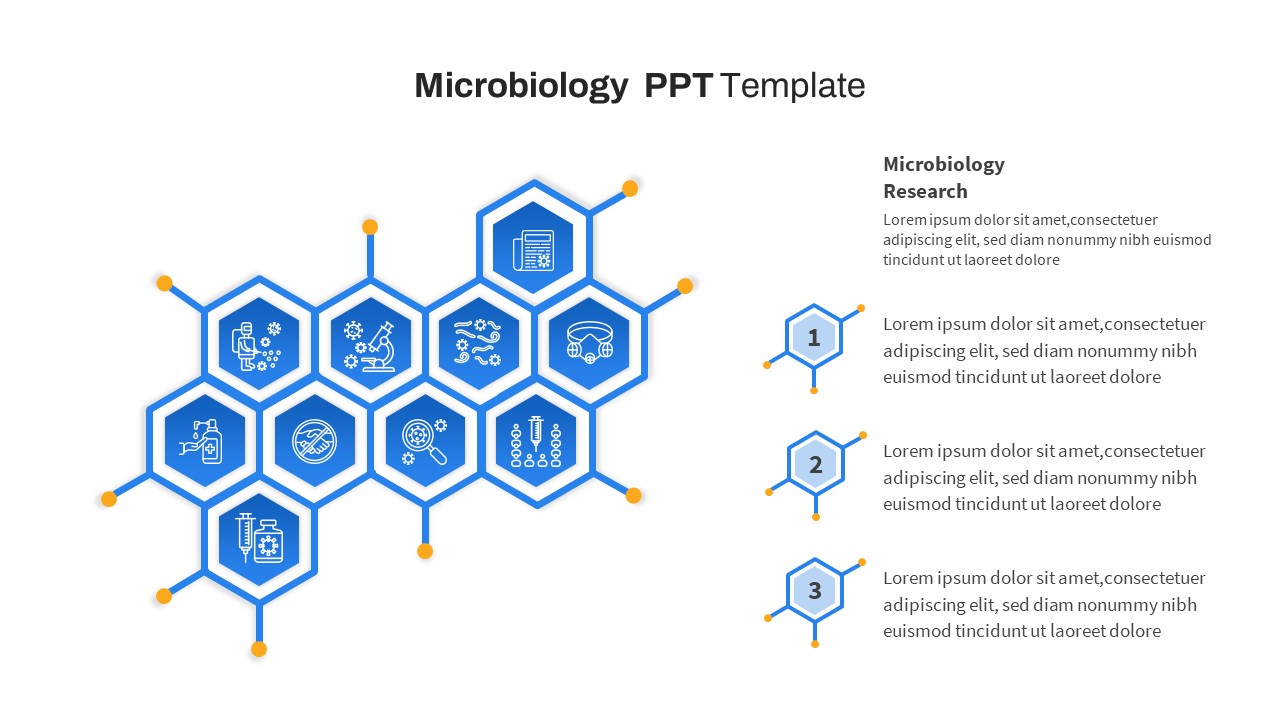
Free Hexagonal Microbiology Research Process Template for PowerPoint & Google Slides
Process
Free

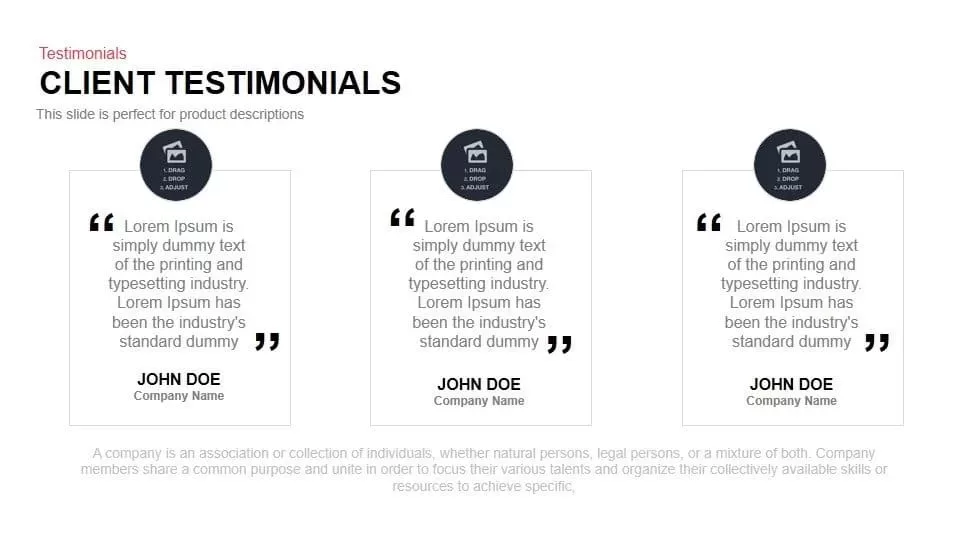
Client Testimonials Feedback Layout Template for PowerPoint & Google Slides
Infographics
Customer Feedback Infographic Slide Template for PowerPoint & Google Slides
Customer Experience
People Feedback and Testimonial Template for PowerPoint & Google Slides
Our Team
360 Degree Feedback Template for PowerPoint & Google Slides
Employee Performance
Concise SBI Feedback Framework Template for PowerPoint & Google Slides
Process
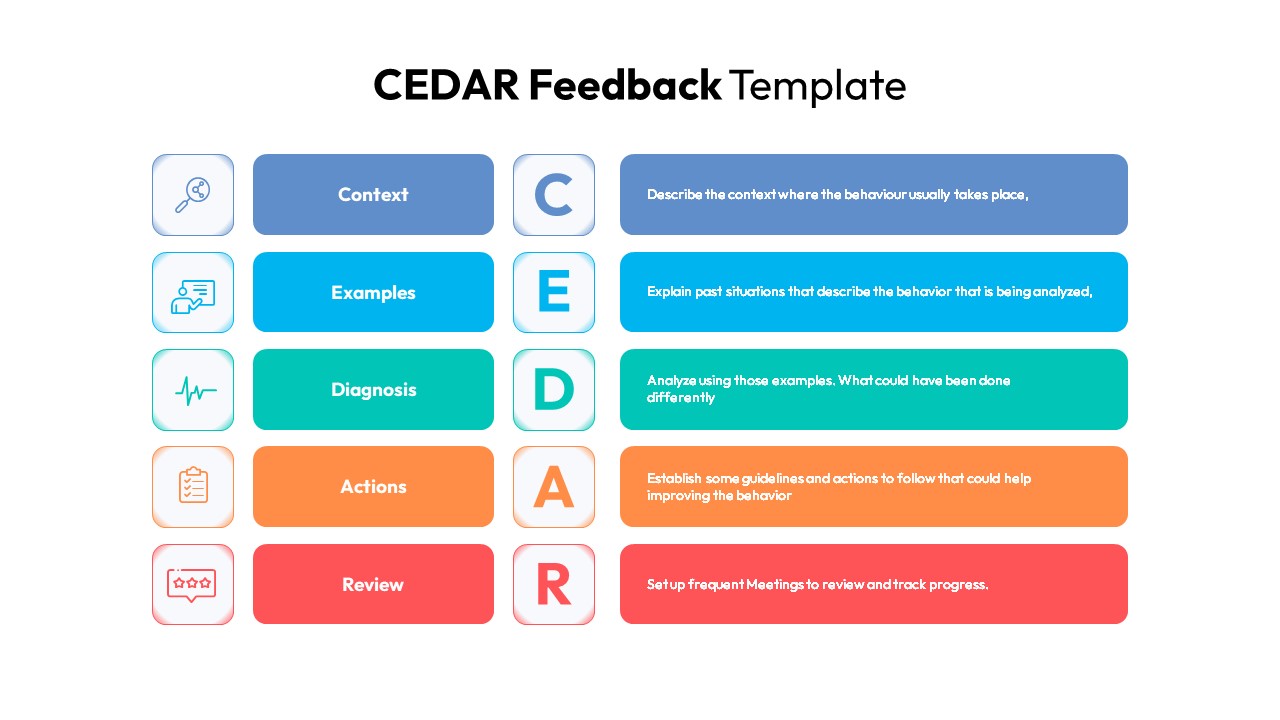
CEDAR Feedback Framework Diagram Template for PowerPoint & Google Slides
Employee Performance
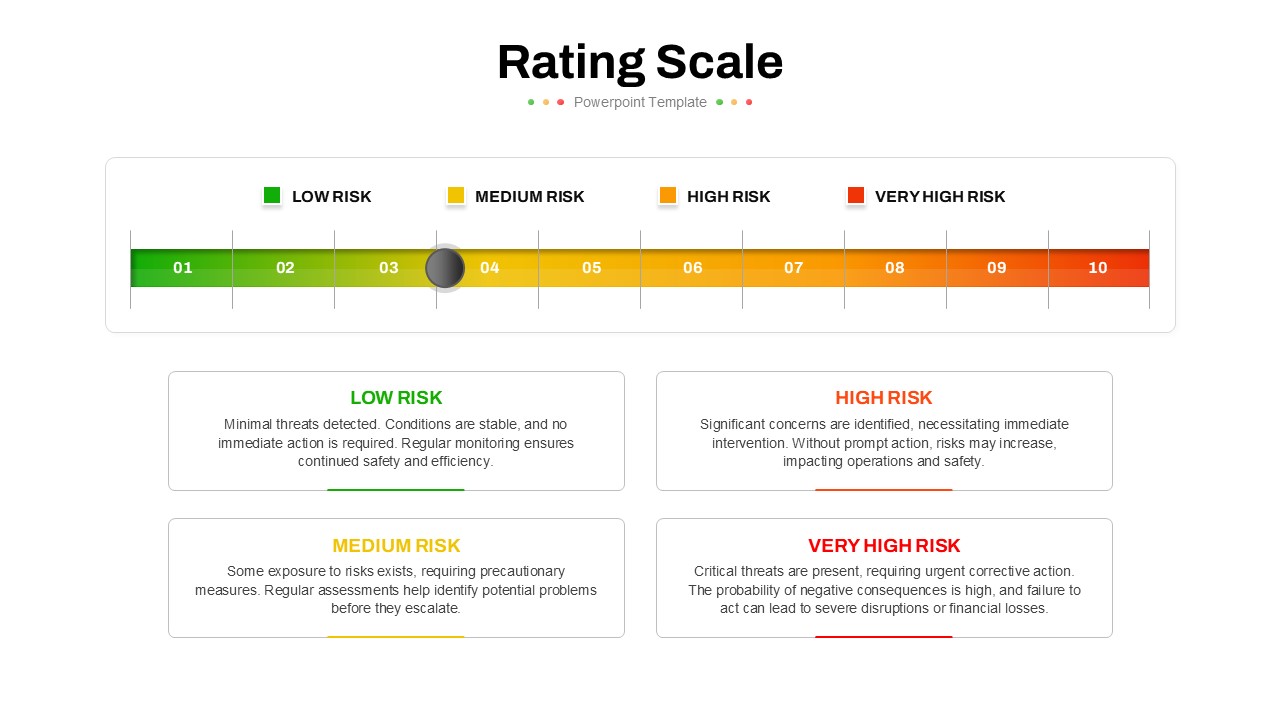
Five-Point Rating Scale Feedback Template for PowerPoint & Google Slides
Employee Performance
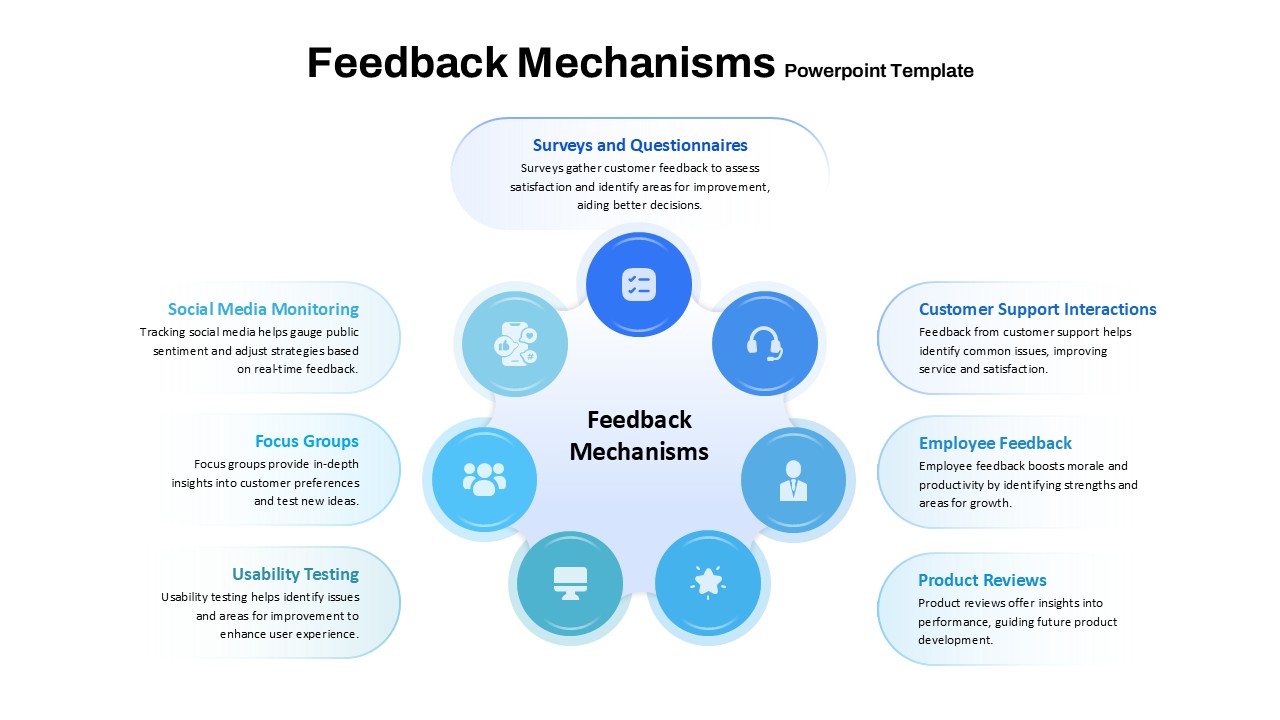
Feedback Mechanisms Circular Diagram Template for PowerPoint & Google Slides
Circular
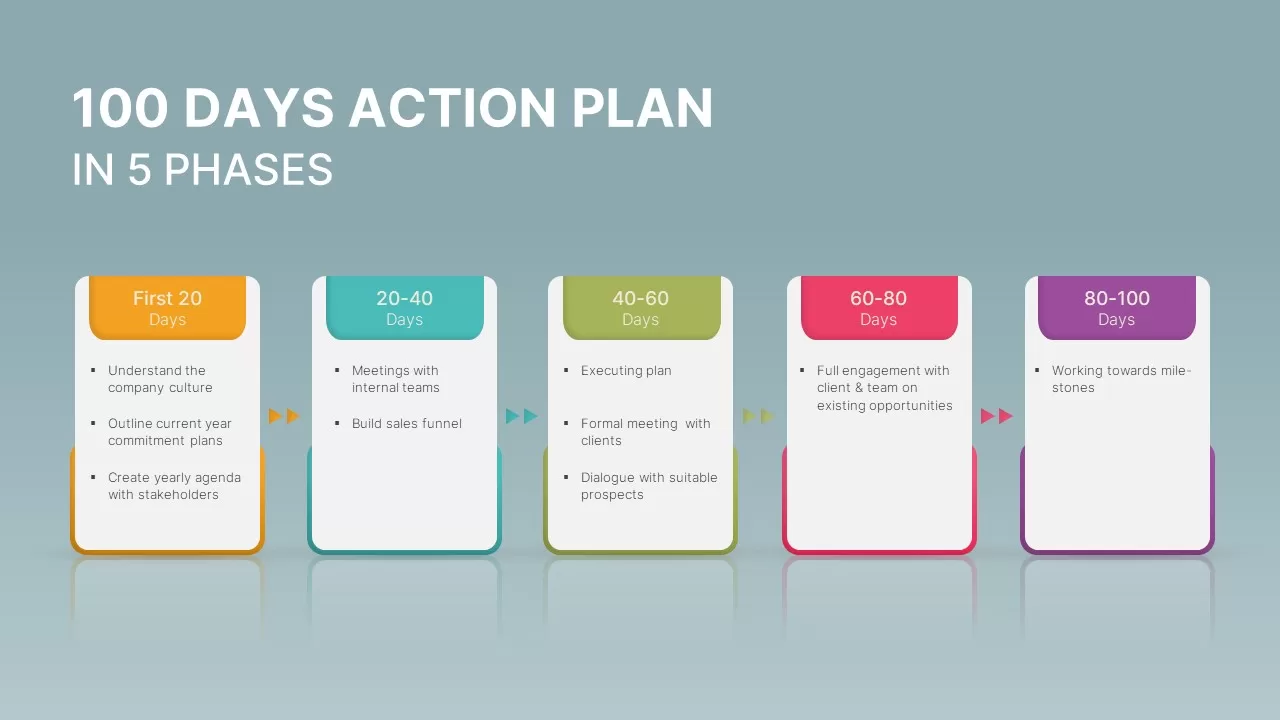
100 Days Action Plan in 5 Phases Template for PowerPoint & Google Slides
Business Plan
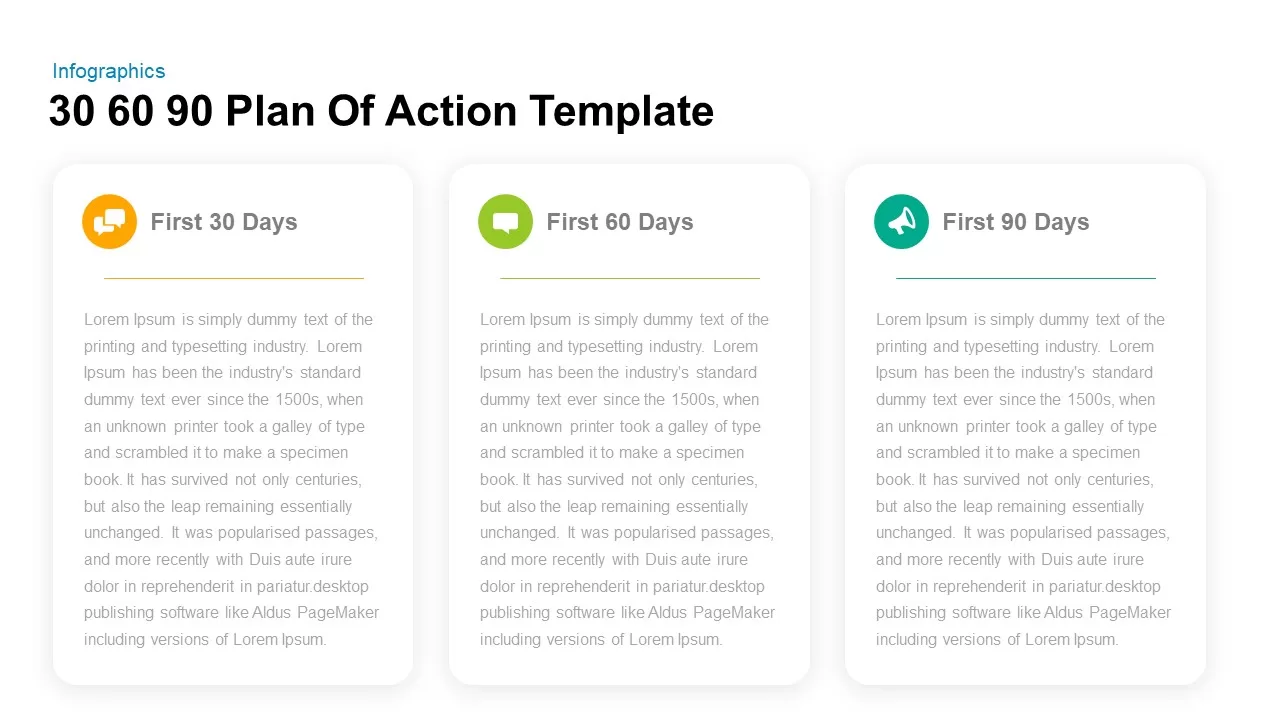
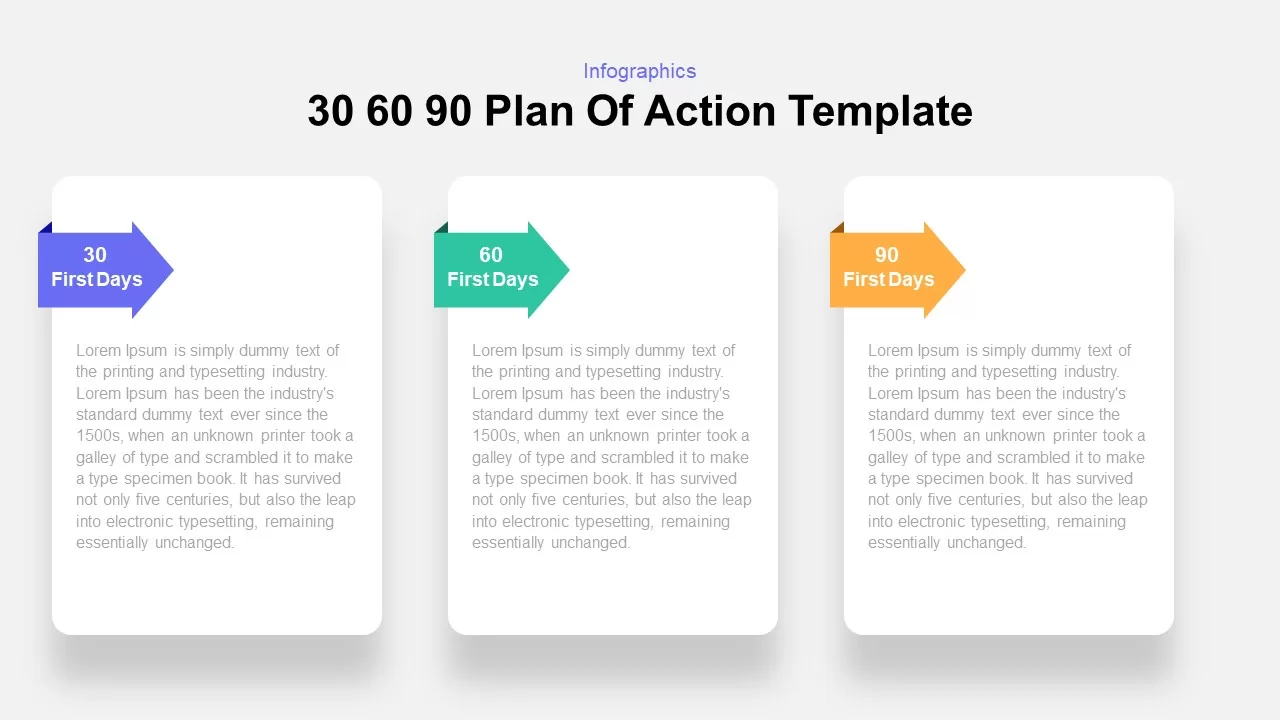
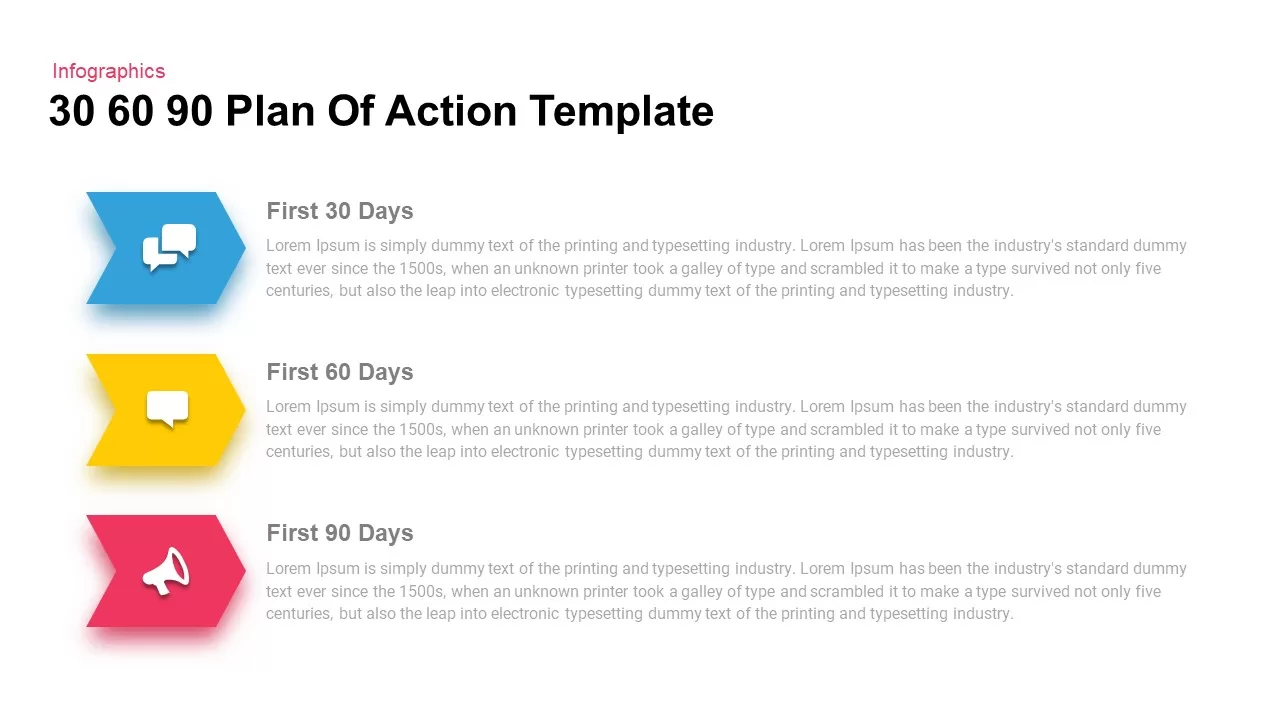
30 60 90 Plan of Action Template for PowerPoint & Google Slides
Infographics
30 60 90 Day Plan of Action Infographic Template for PowerPoint & Google Slides
Timeline
30 60 90 Day Action Plan Infographic Template for PowerPoint & Google Slides
Timeline
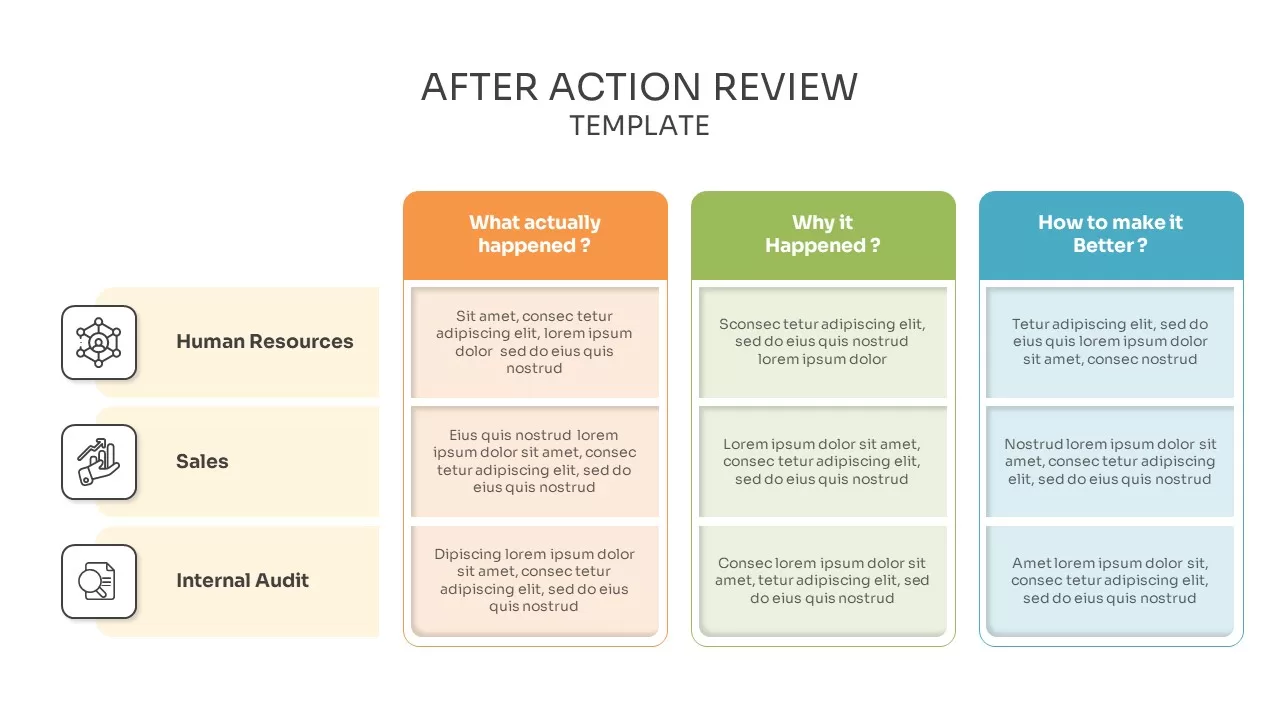
After Action Review Infographic Template for PowerPoint & Google Slides
Process
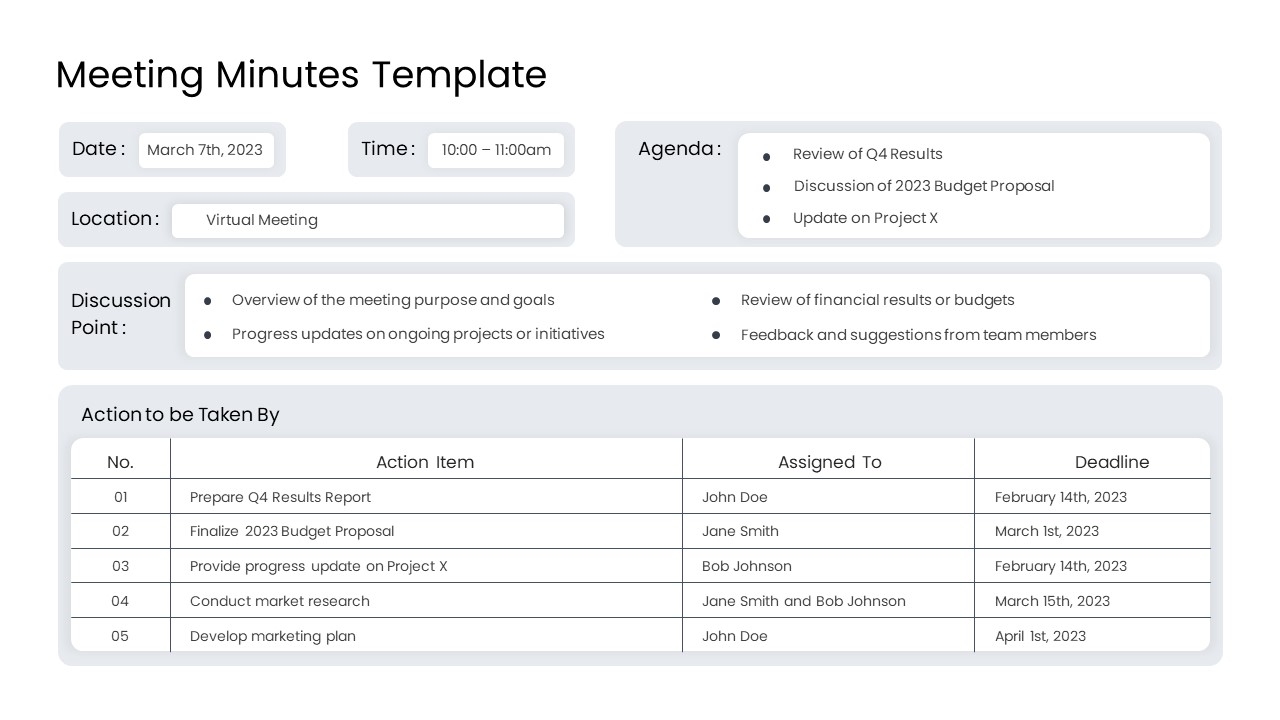
Meeting Minutes & Action Items Agenda Template for PowerPoint & Google Slides
Business Report
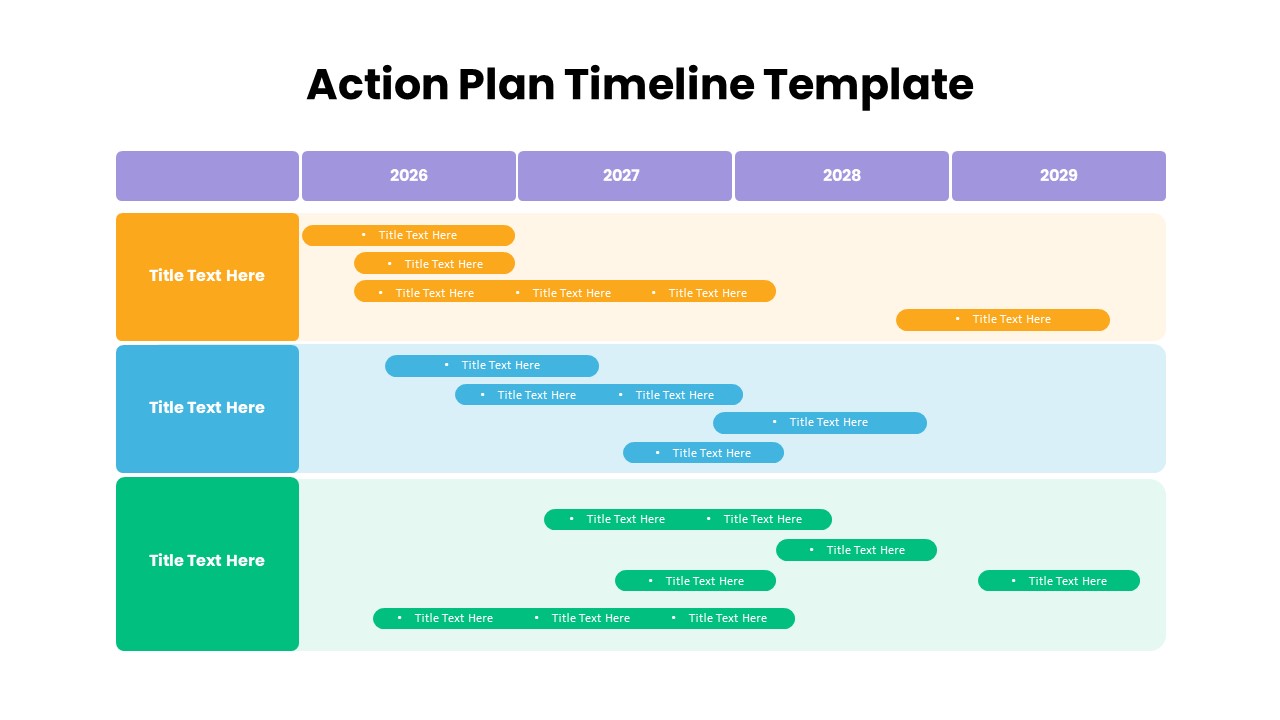
Action Plan Timeline Template for PowerPoint & Google Slides
Timeline
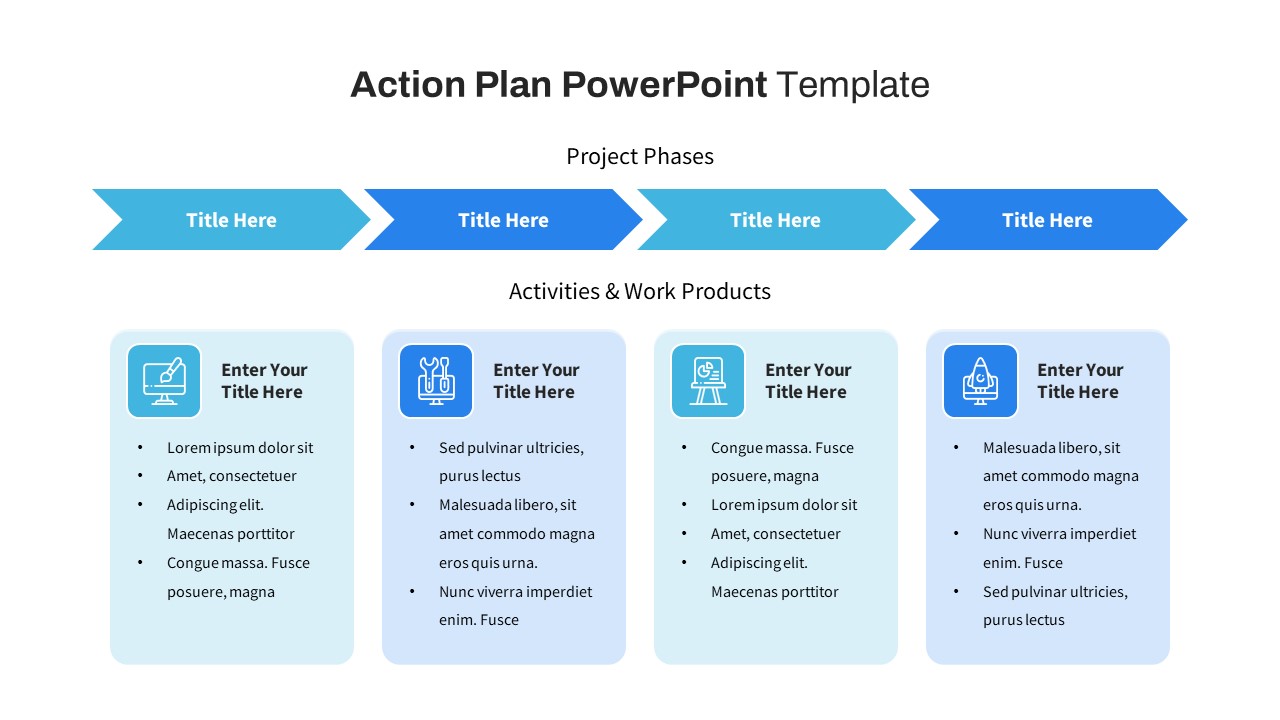
Free Action Plan Template for PowerPoint & Google Slides
Infographics
Free
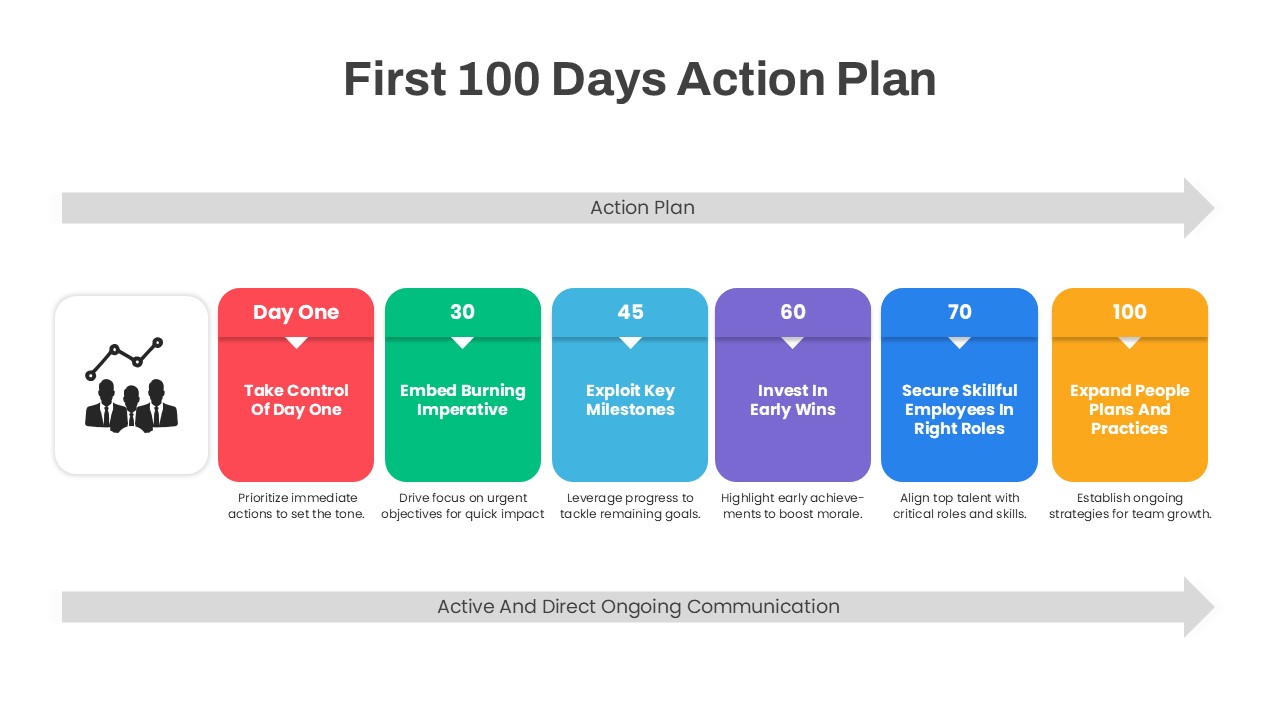
First 100 Days Action Plan Infographic Template for PowerPoint & Google Slides
Timeline
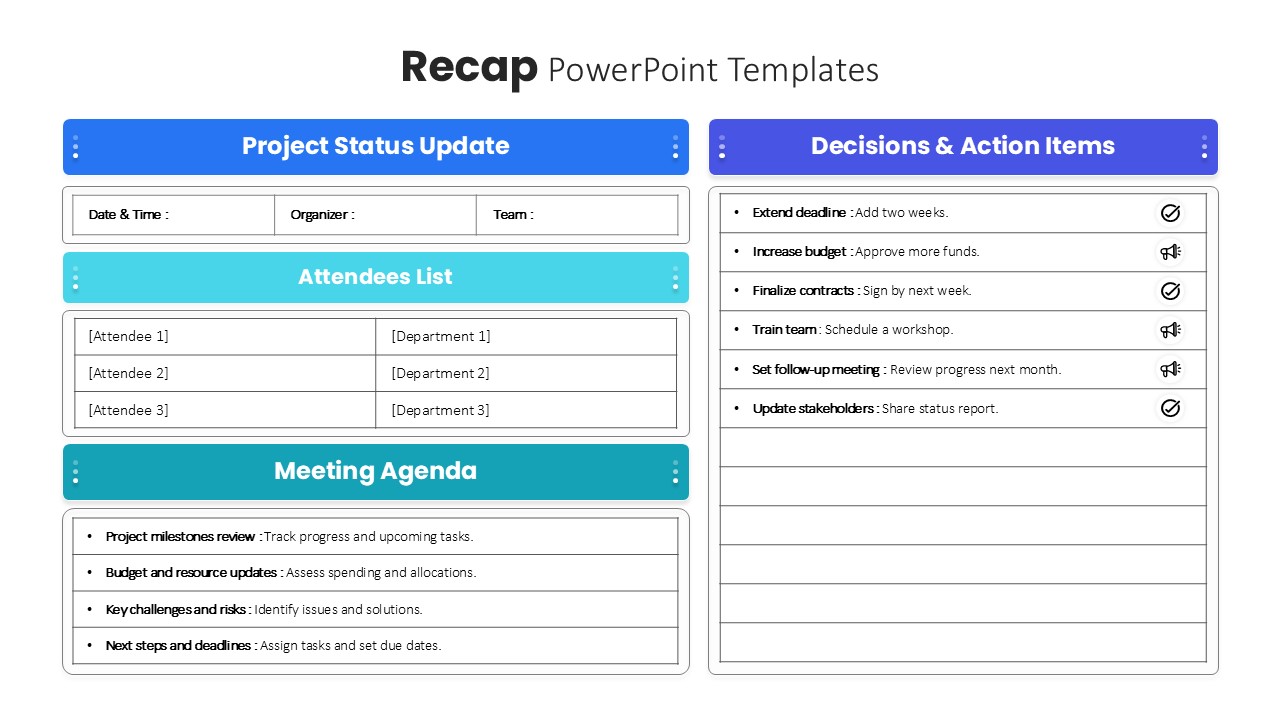
Project Meeting Recap & Action Items Template for PowerPoint & Google Slides
Project Status
Action Items Management Dashboard Table Template for PowerPoint & Google Slides
Project Status
Comprehensive Action Tracker Table Template for PowerPoint & Google Slides
Business
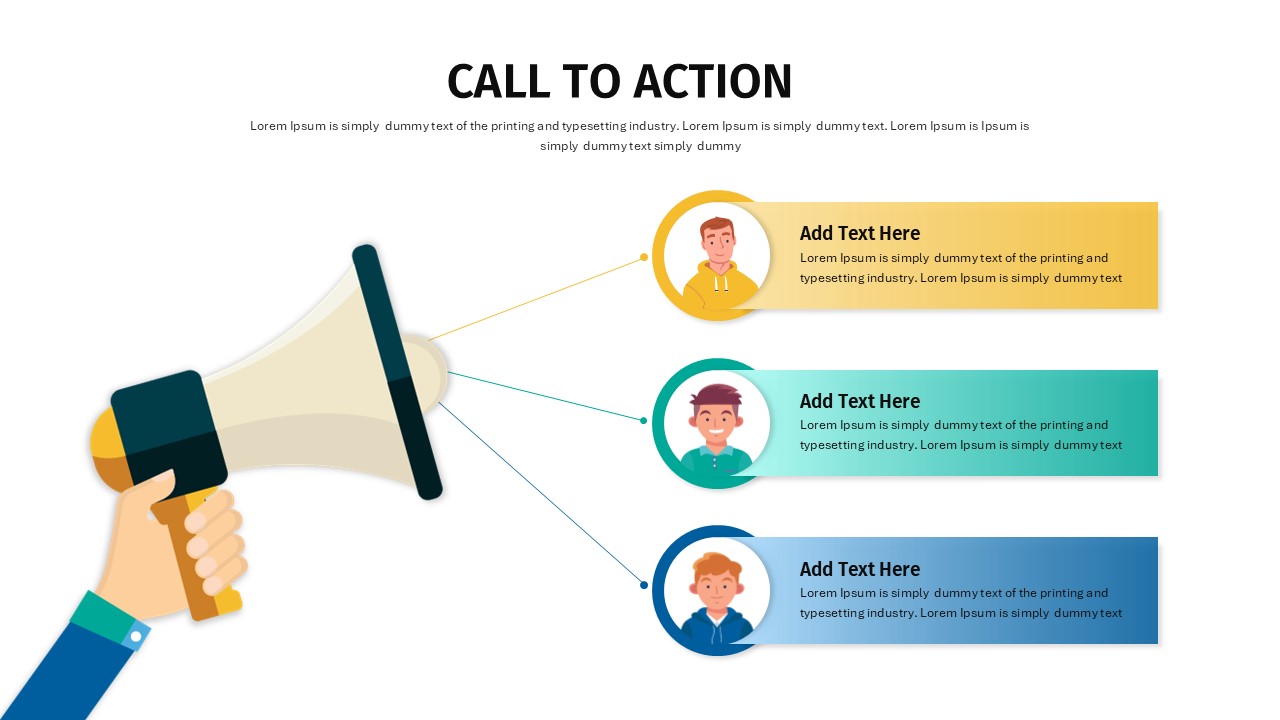
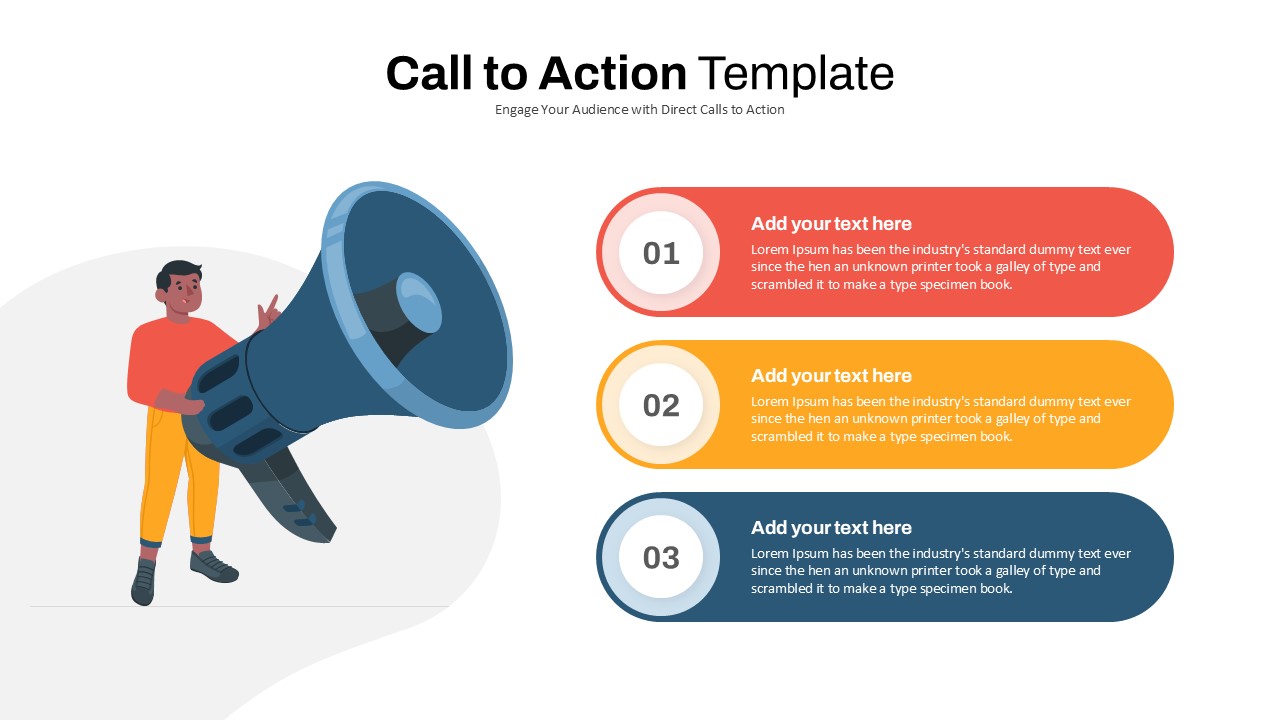
Call to Action Template for PowerPoint & Google Slides
Marketing
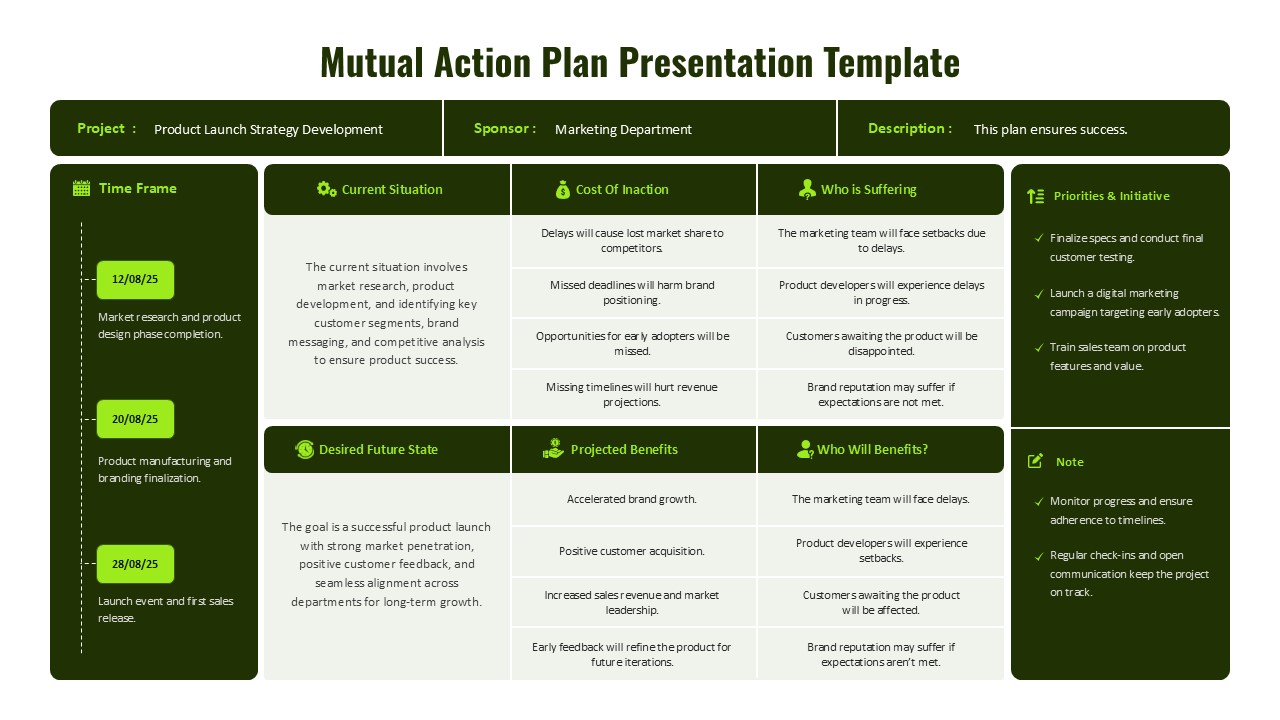
Mutual Action Plan Framework Overview Template for PowerPoint & Google Slides
Project
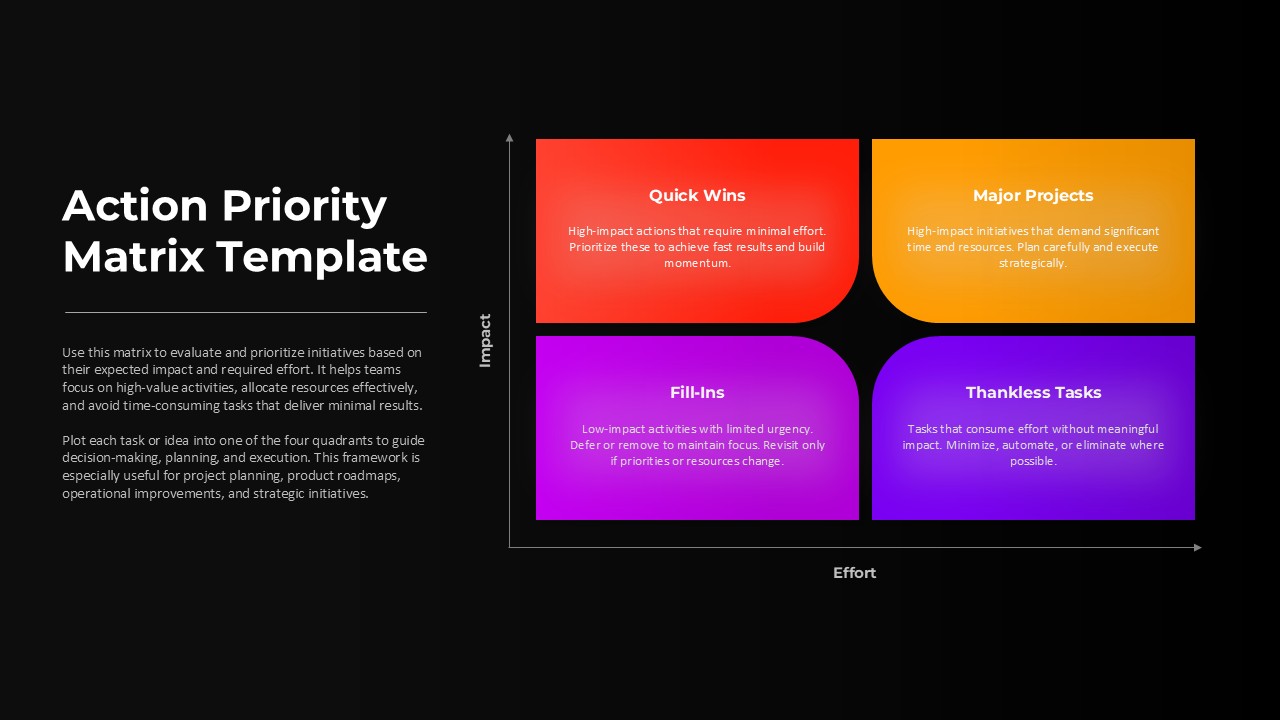
Action Priority Impact Effort Matrix Template for PowerPoint & Google Slides
Business Strategy
Action Plan for PowerPoint & Google Slides
Business
Call to Action Framework for PowerPoint & Google Slides
Customer Journey
Magnifying Glass Research Metaphor Template for PowerPoint & Google Slides
Process
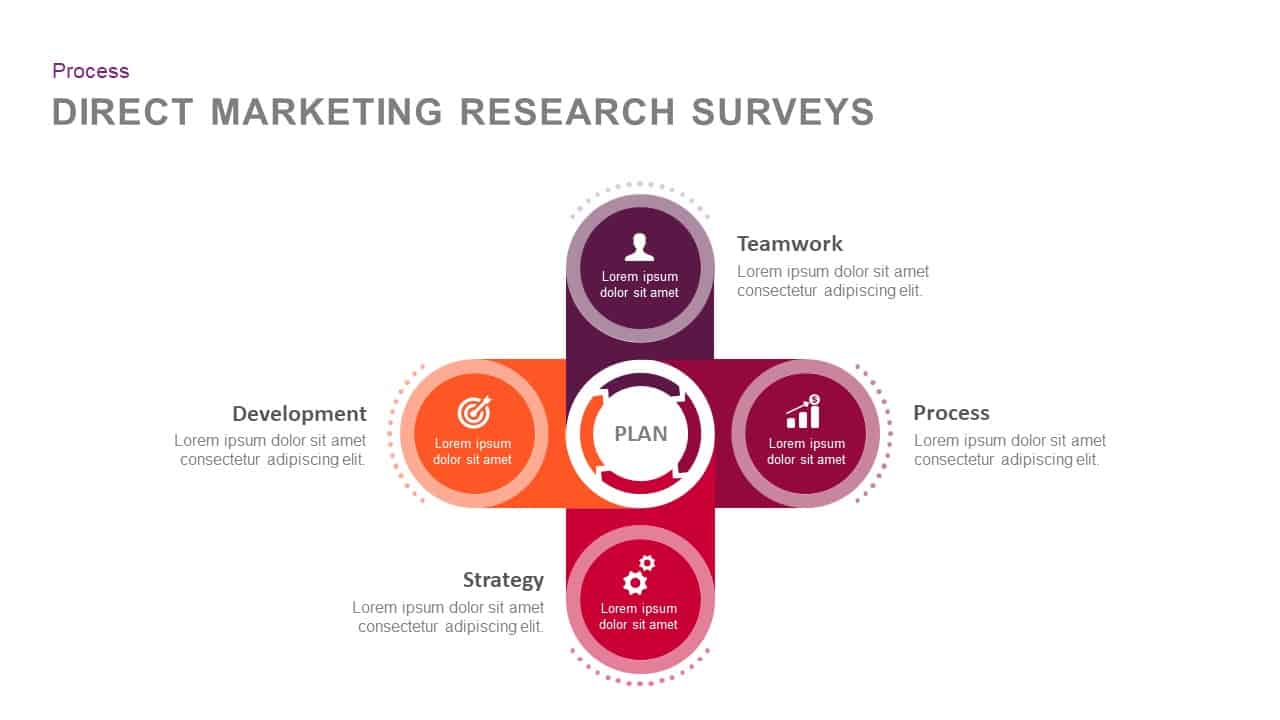
Direct Marketing Research Surveys template for PowerPoint & Google Slides
Marketing

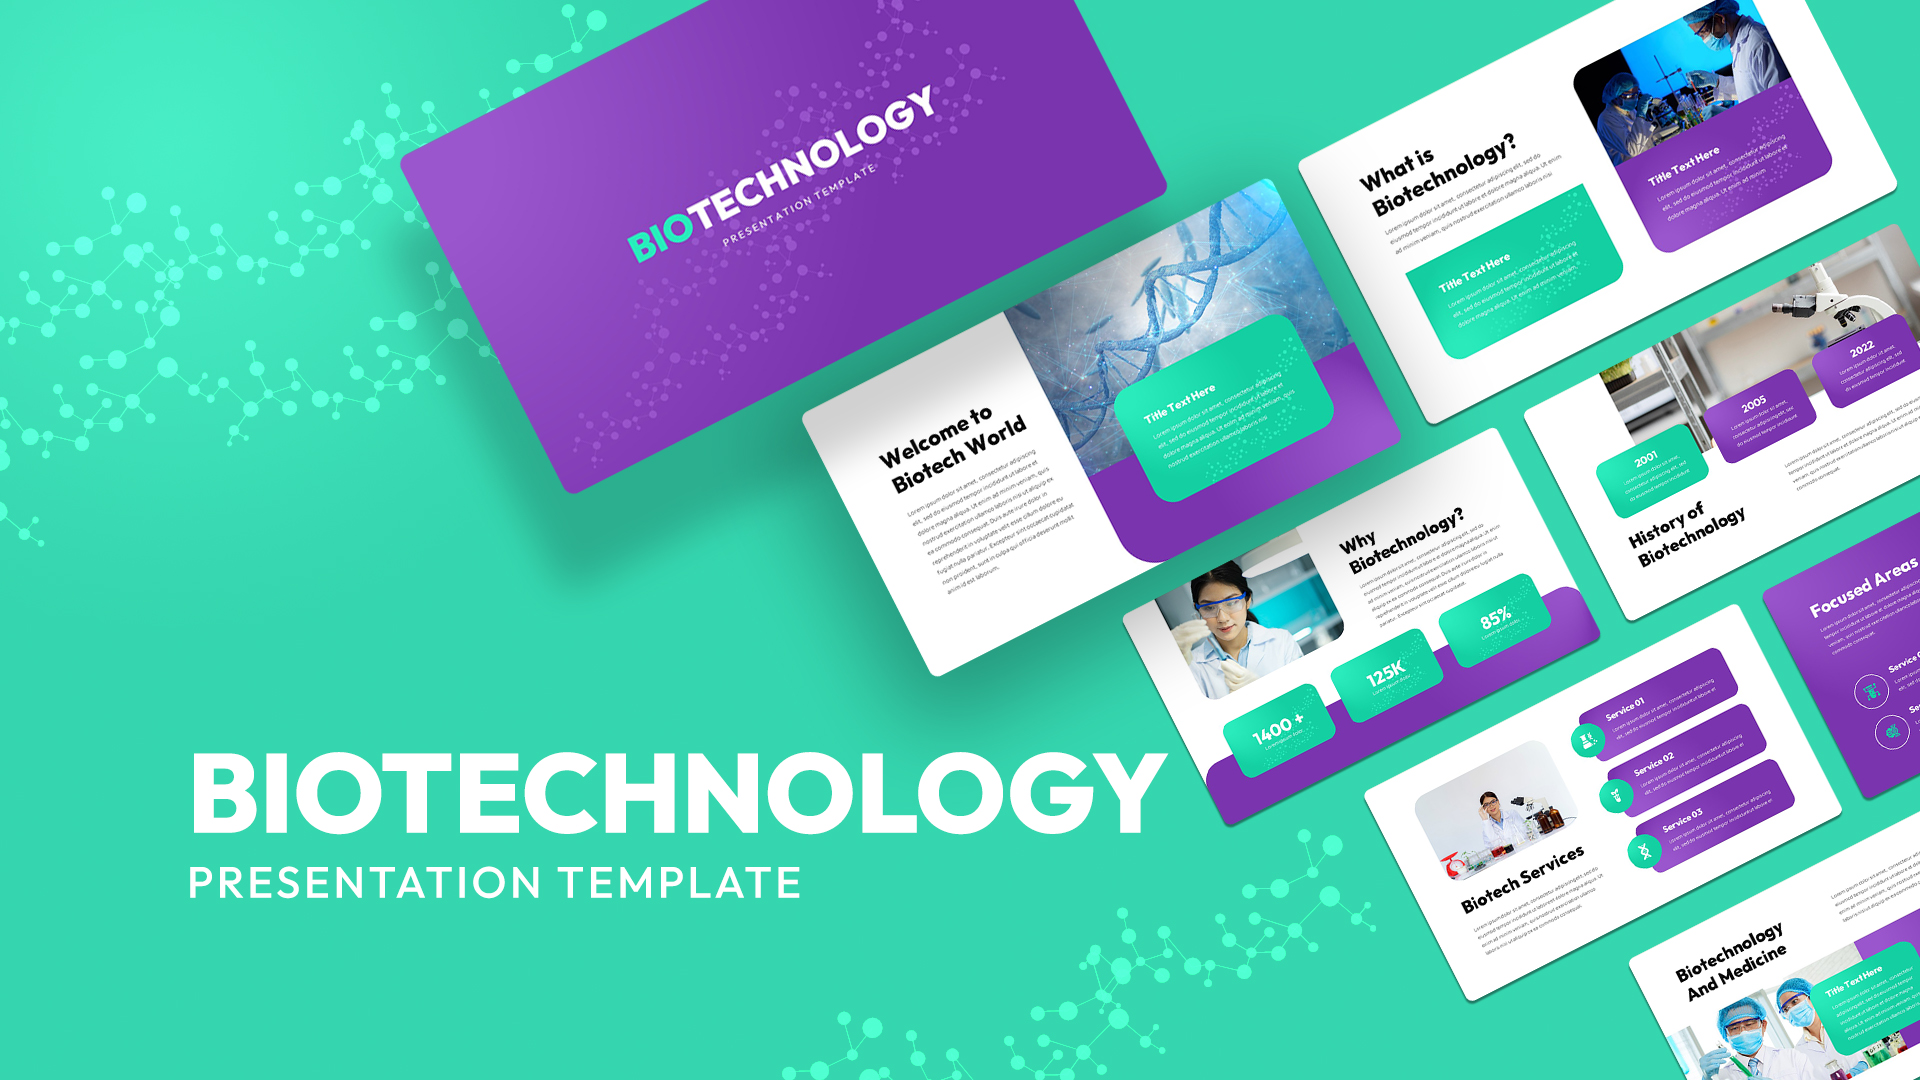
Modern Biotechnology Services & Research Template for PowerPoint & Google Slides
Health
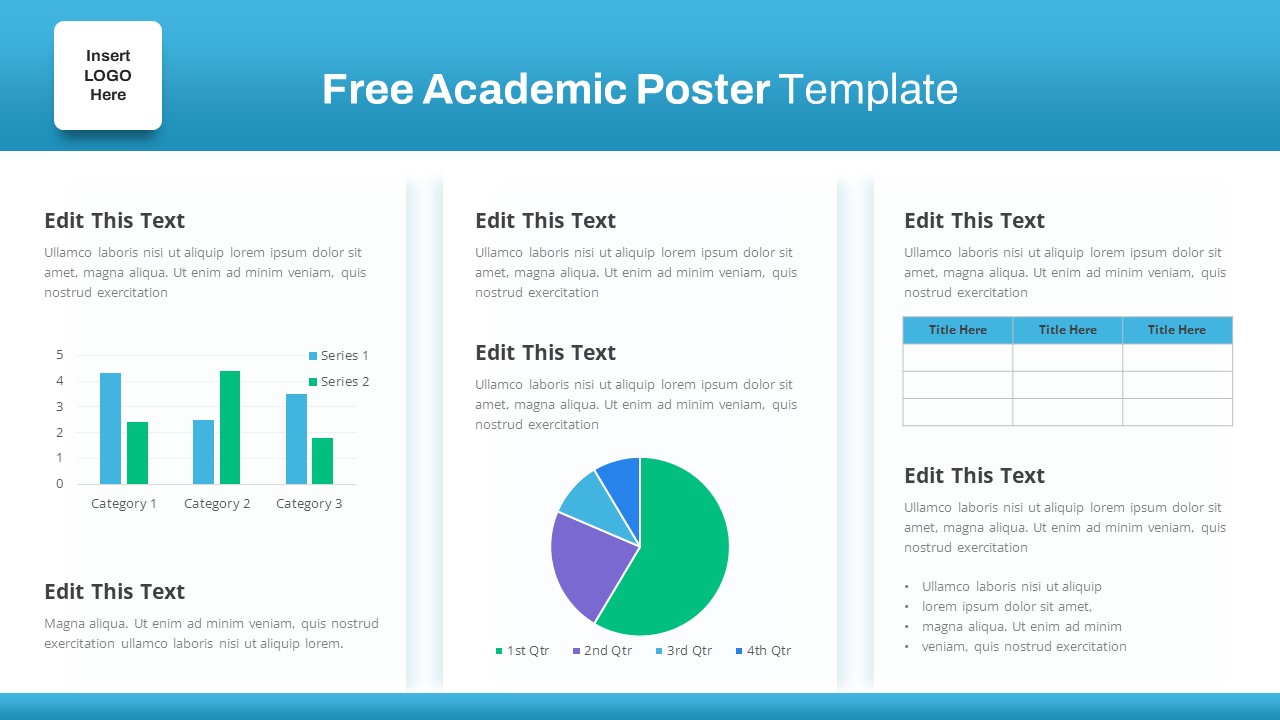
Free Academic Research Poster Design Template for PowerPoint & Google Slides
Bar/Column
Free
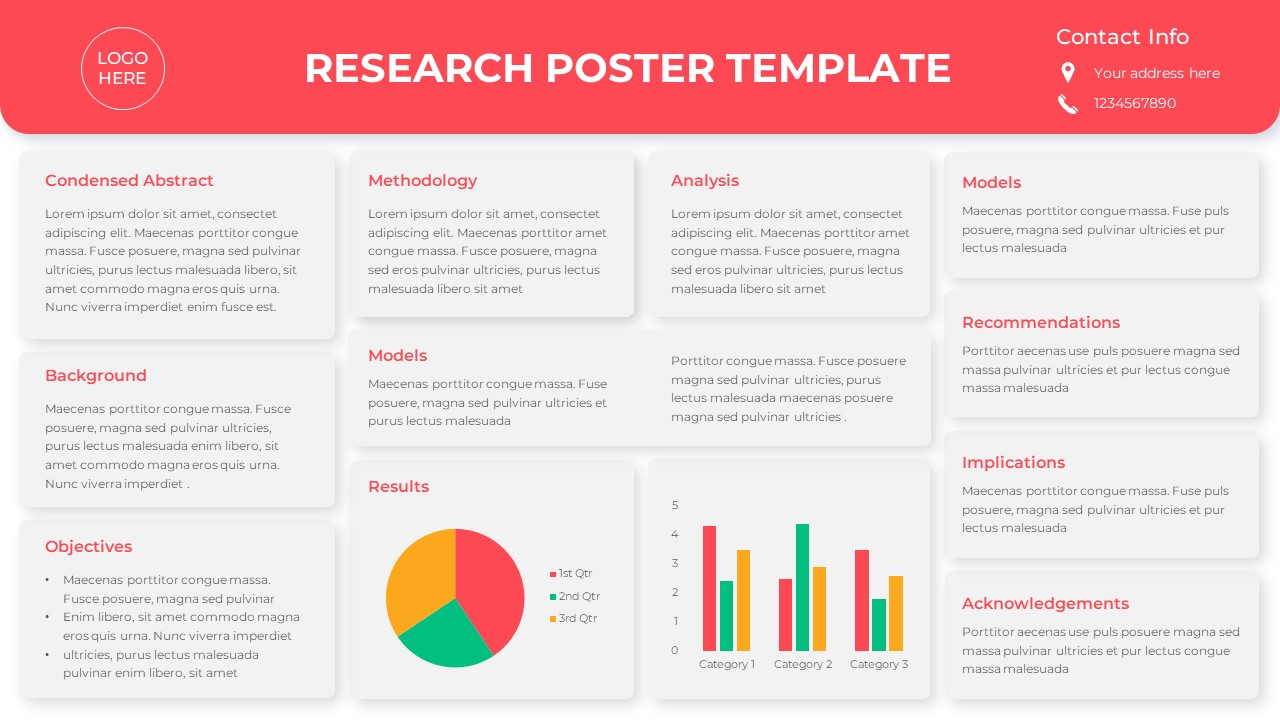
Free Research Poster with Charts Template for PowerPoint & Google Slides
Pie/Donut
Free
Multi-Phase Research Roadmap Infographic Template for PowerPoint & Google Slides
Roadmap
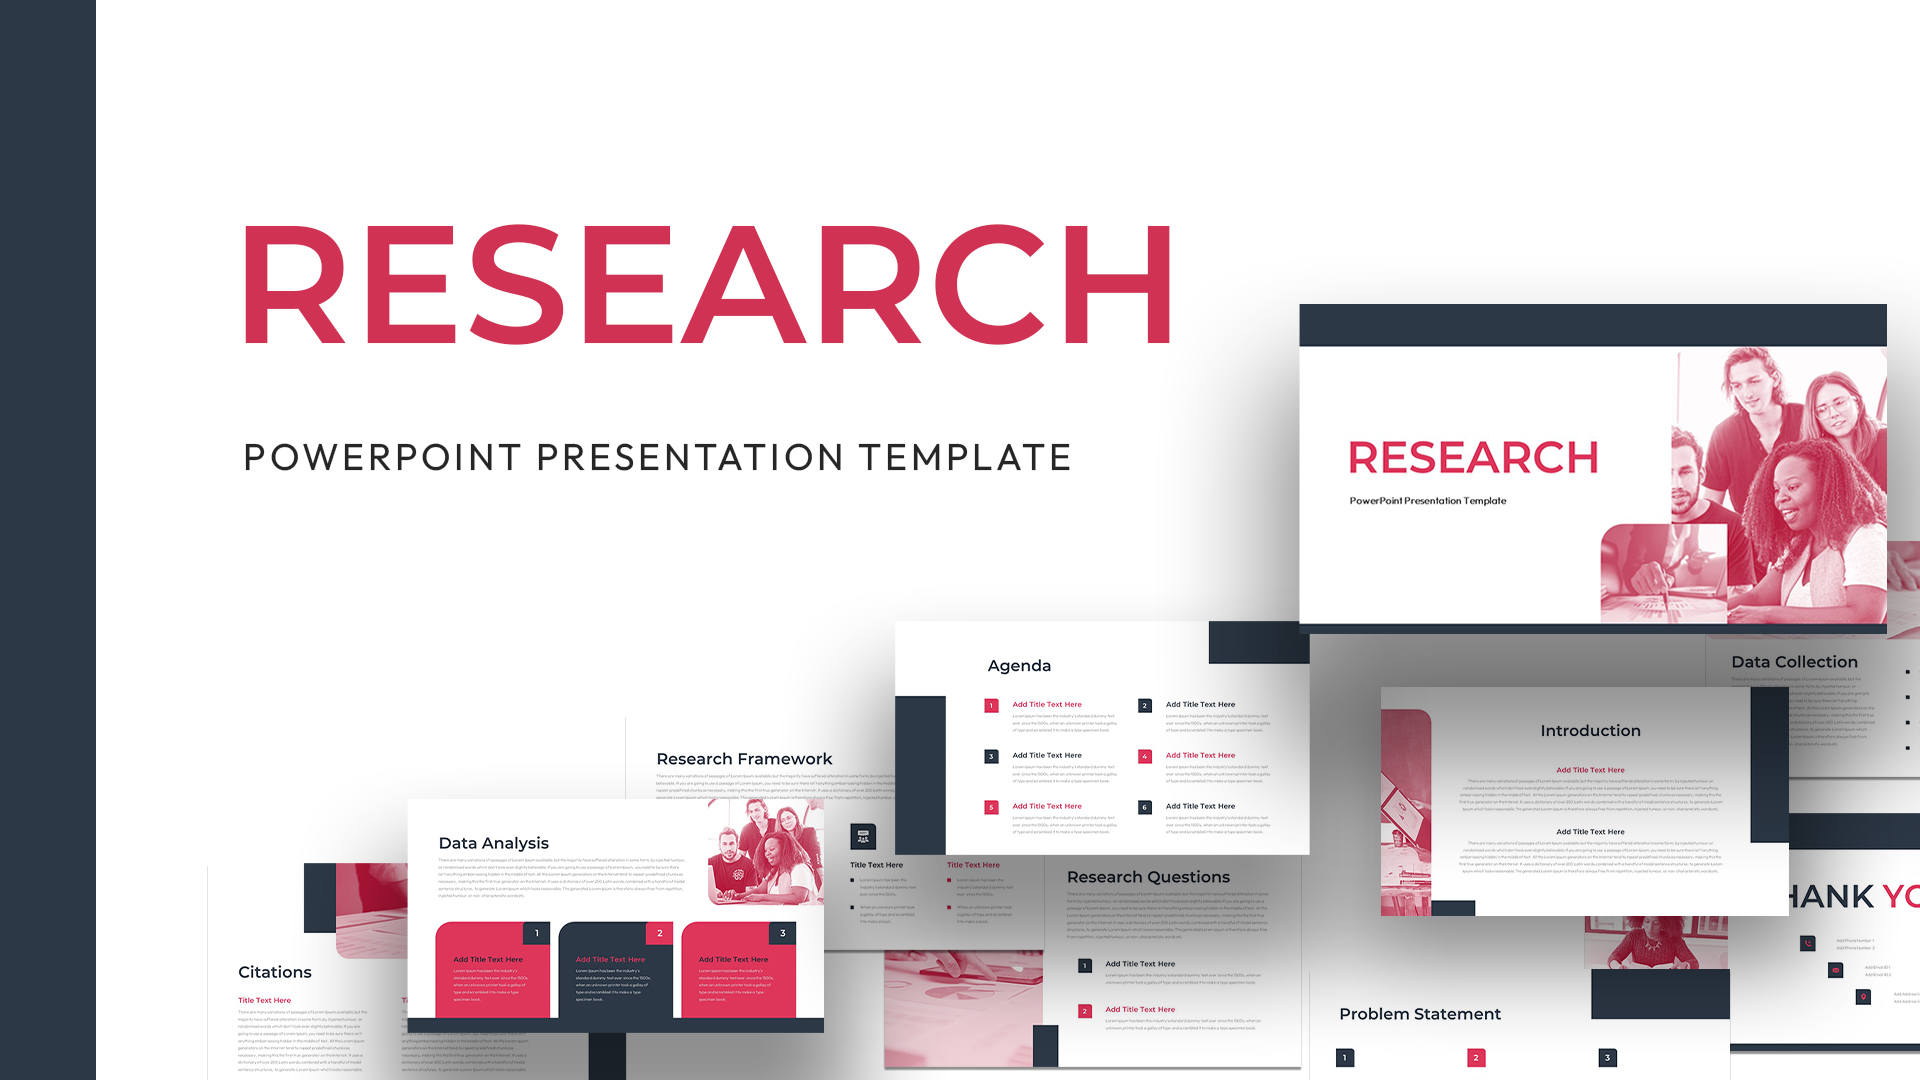
Free Research Presentation Slide Deck Template for PowerPoint & Google Slides
Decks
Free
Free Thesis Research Presentation Template for PowerPoint & Google Slides
Decks
Free
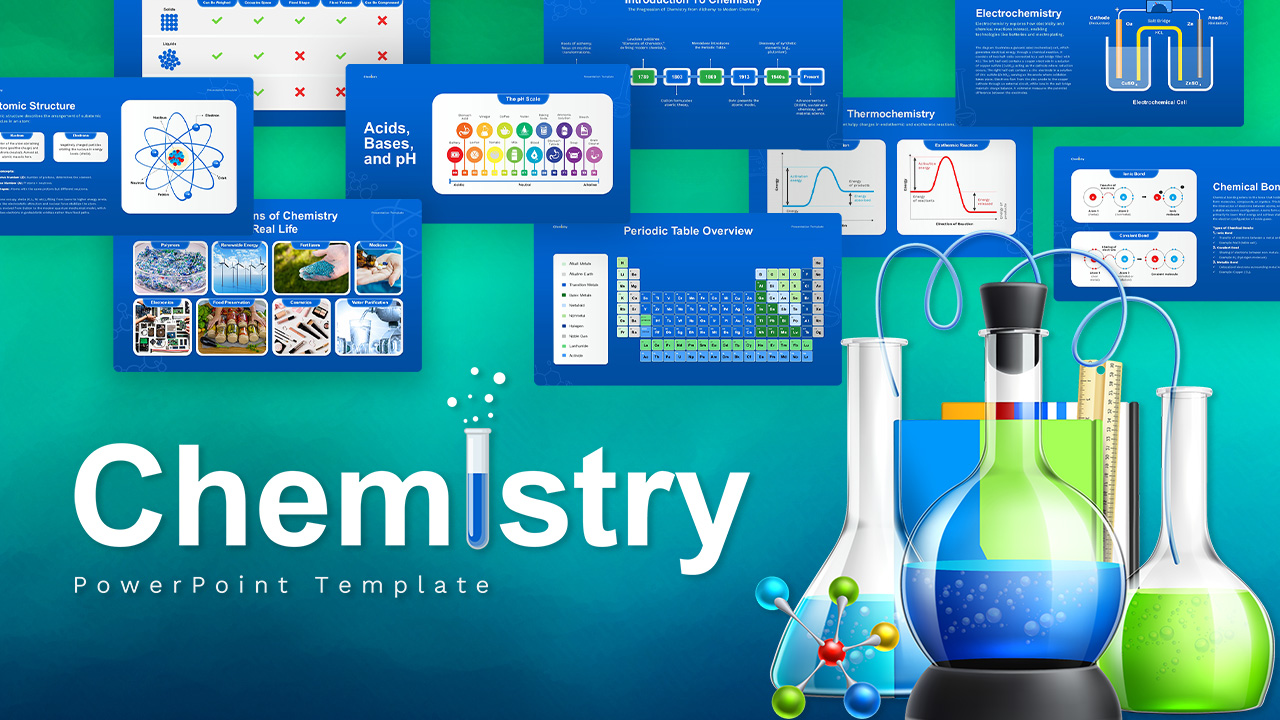
Chemistry Education & Research Template for PowerPoint & Google Slides
Pitch Deck
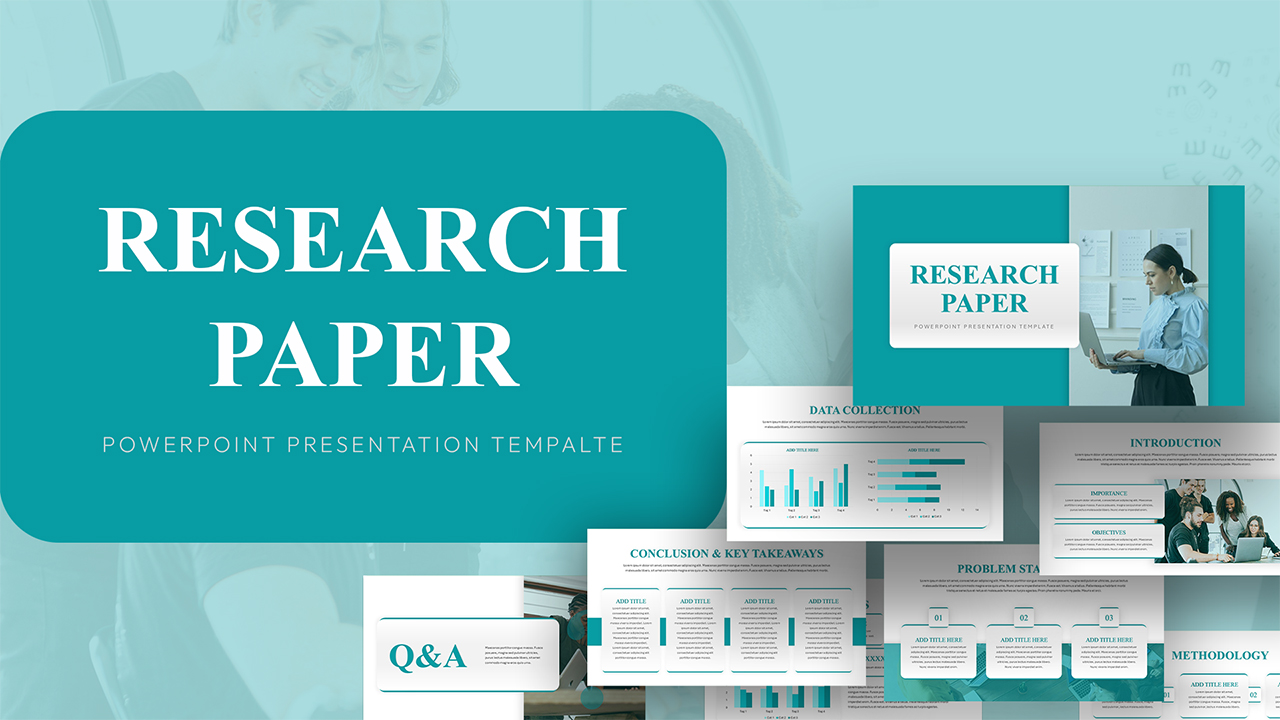
Academic Research Paper Presentation Template for PowerPoint & Google Slides
Pitch Deck
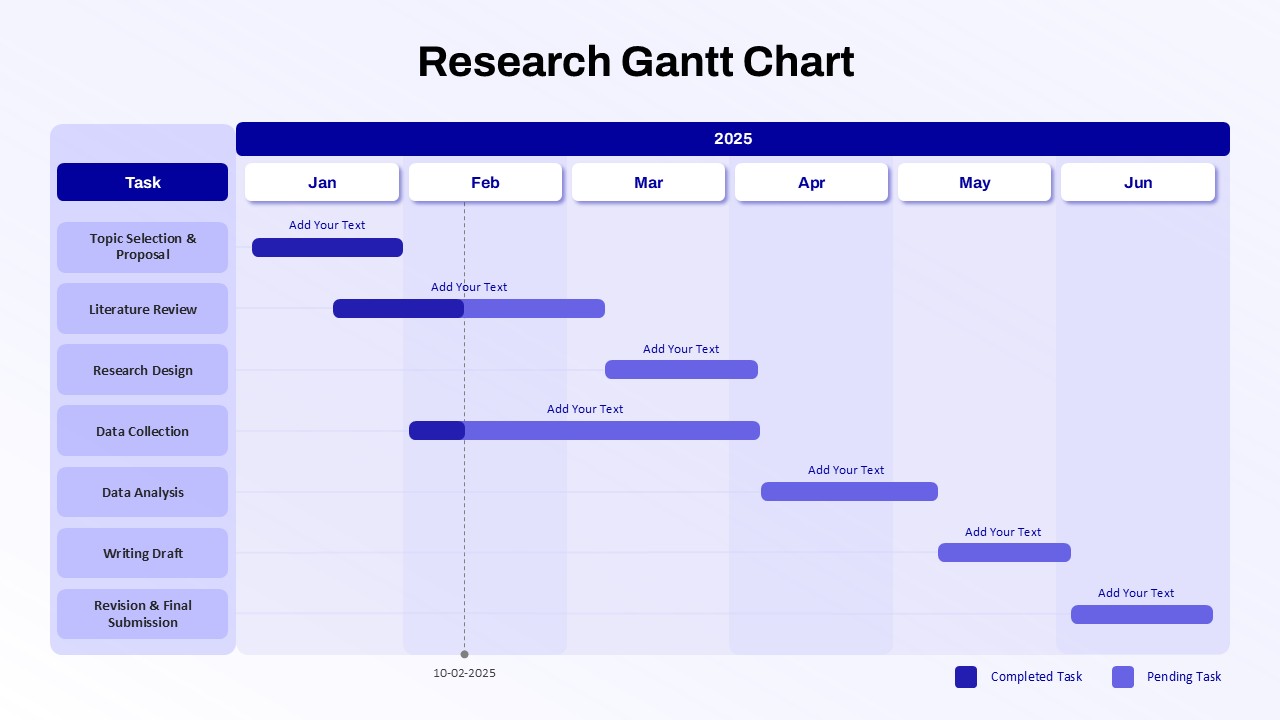
Research Gantt Chart template for PowerPoint & Google Slides
Project
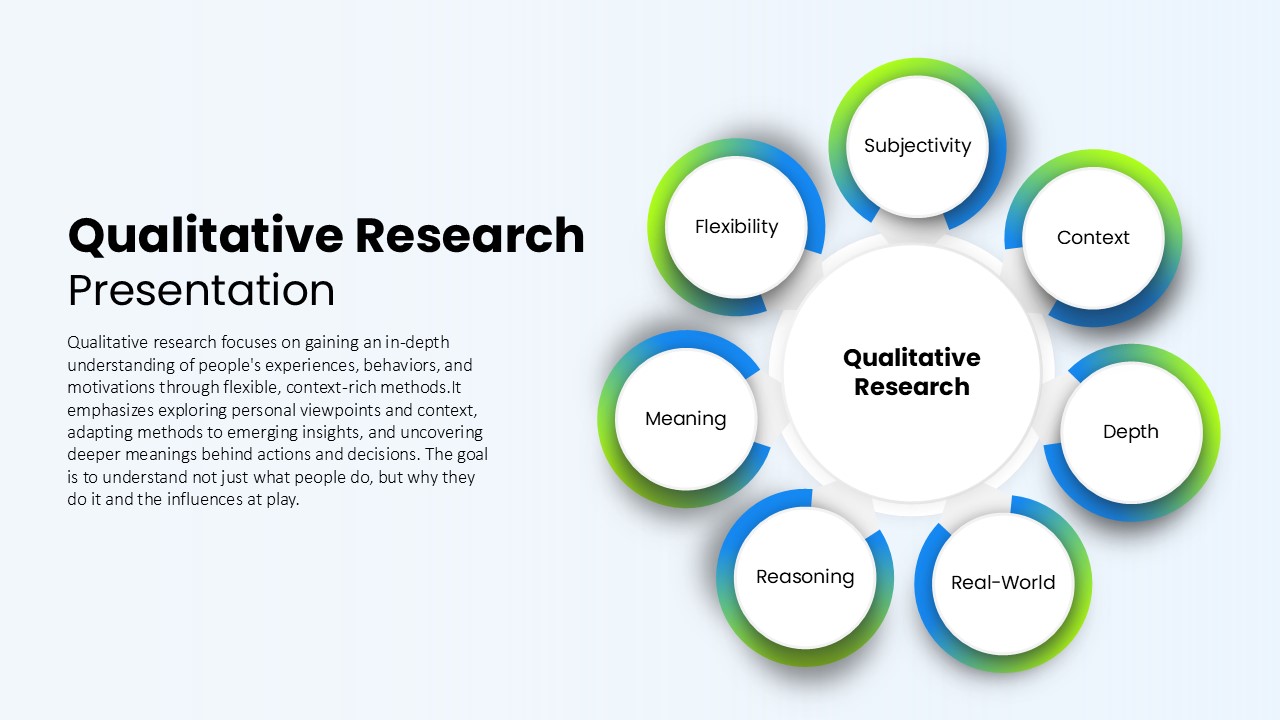
Qualitative Research Hub and Spoke Template for PowerPoint & Google Slides
Circular
Medical Research Concept infographic for PowerPoint & Google Slides
Medical
Research Project Proposal Deck for PowerPoint & Google Slides
Pitch Deck
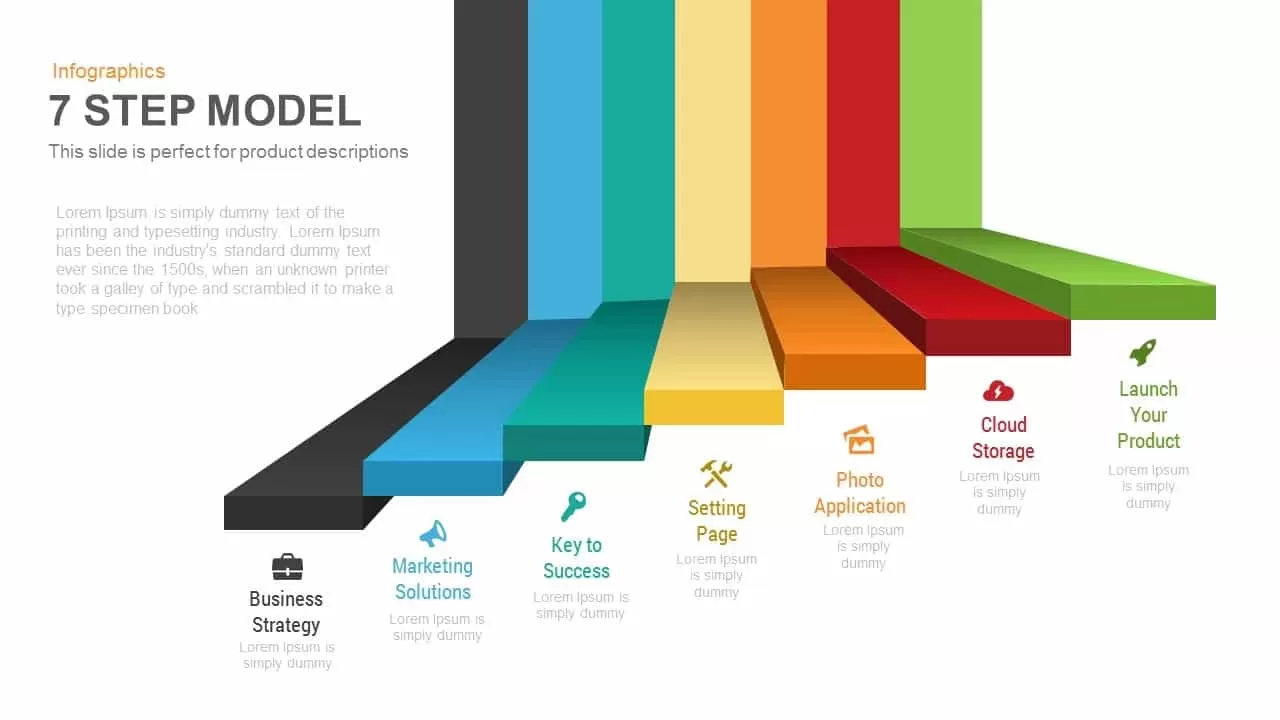
7-Step 3D Process Infographic Model template for PowerPoint & Google Slides
Process
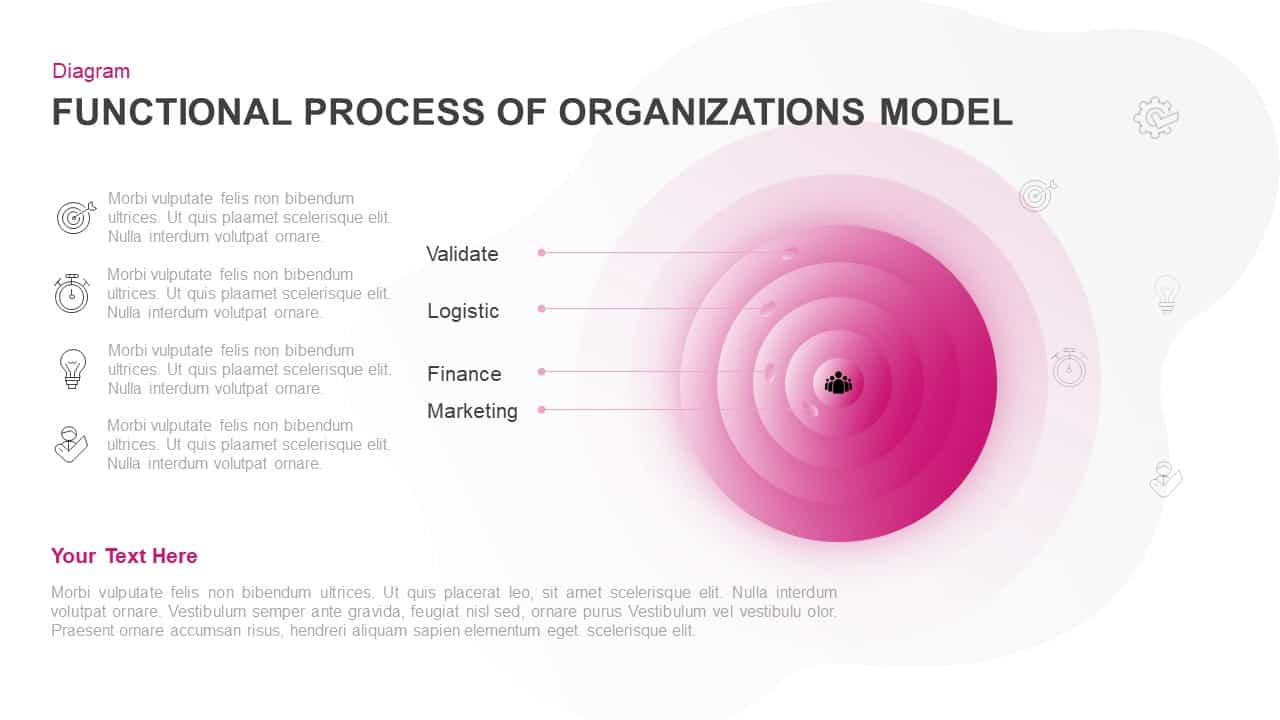
Concentric Functional Process Model Template for PowerPoint & Google Slides
Circular
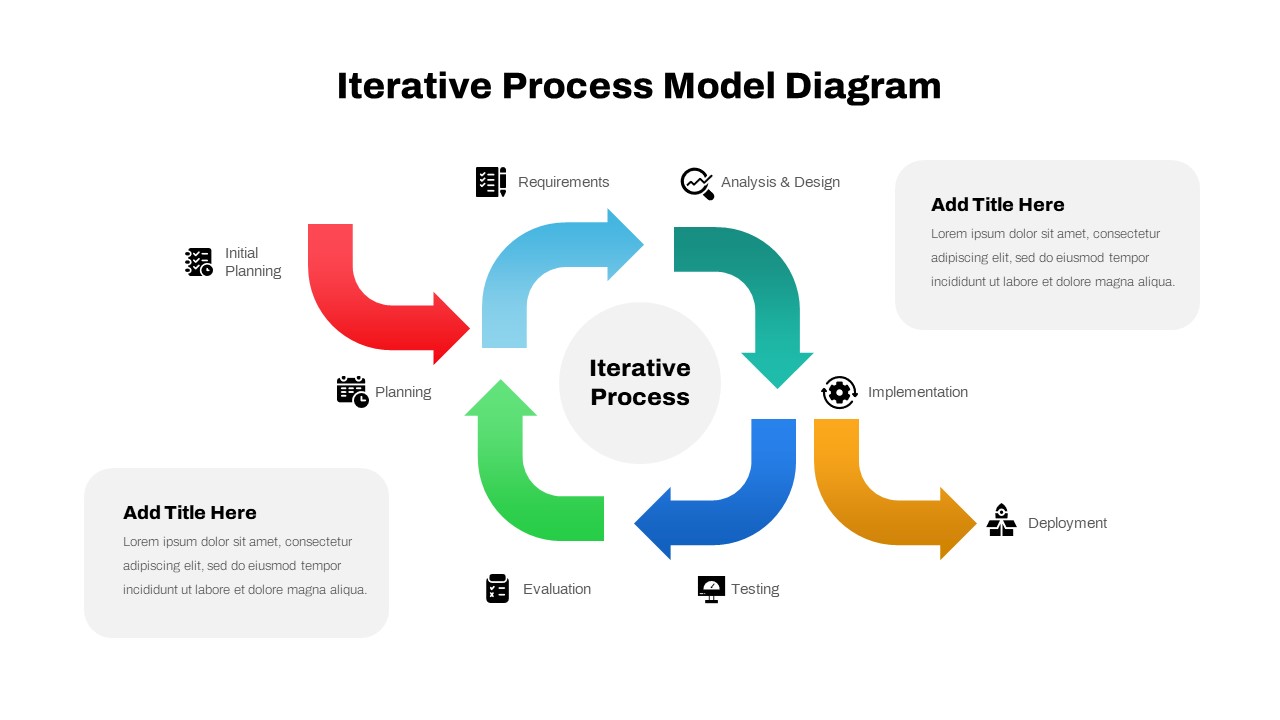
Iterative Process Model Diagram Template for PowerPoint & Google Slides
Process
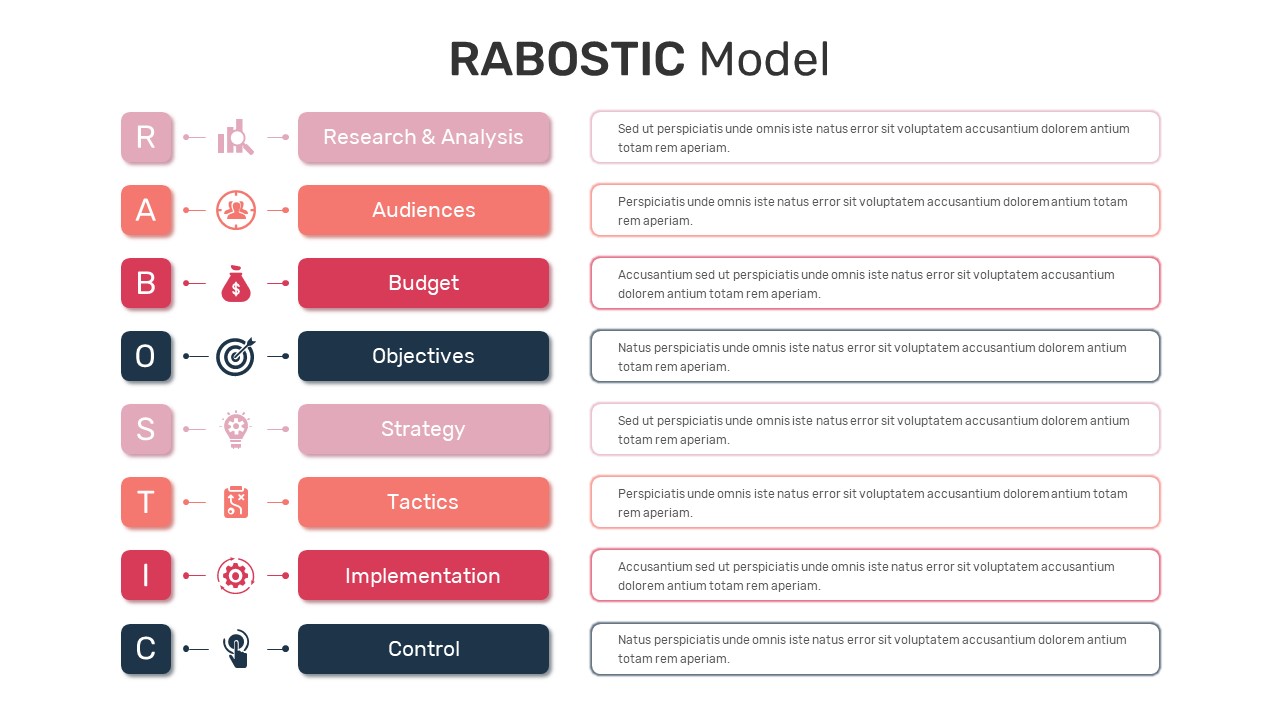
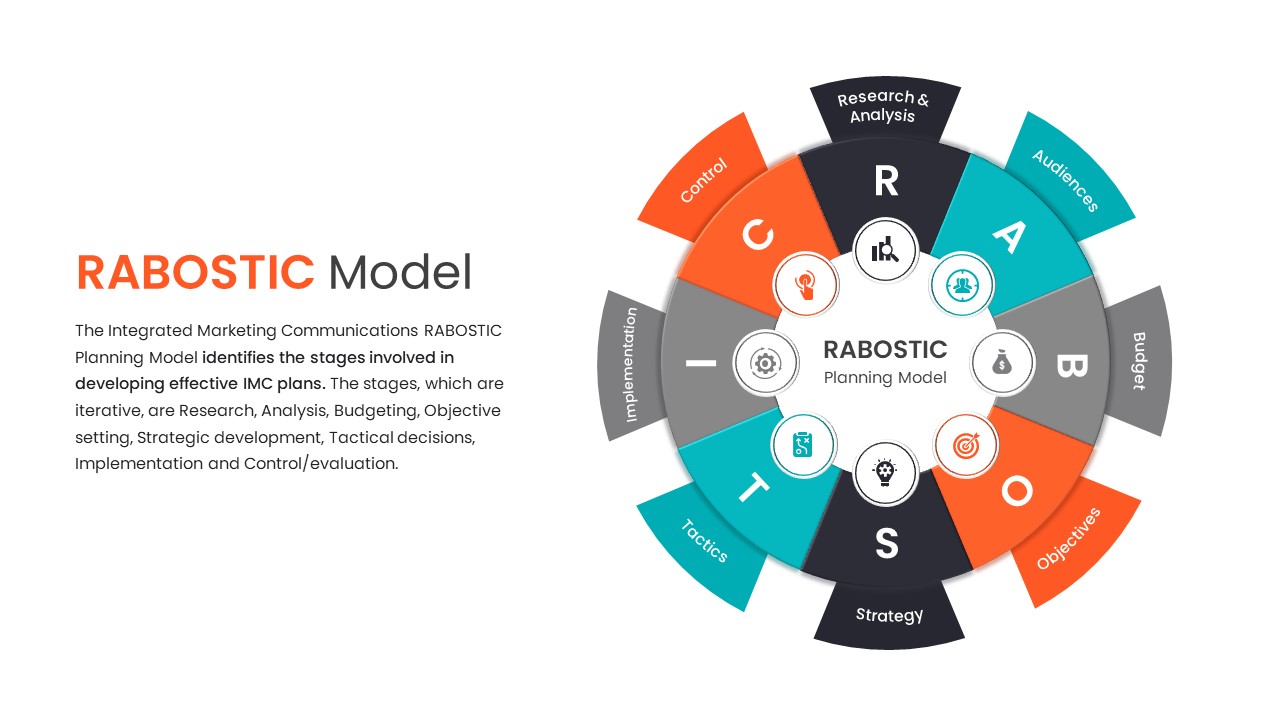
RABOSTIC Marketing Model Process Diagram Template for PowerPoint & Google Slides
Process
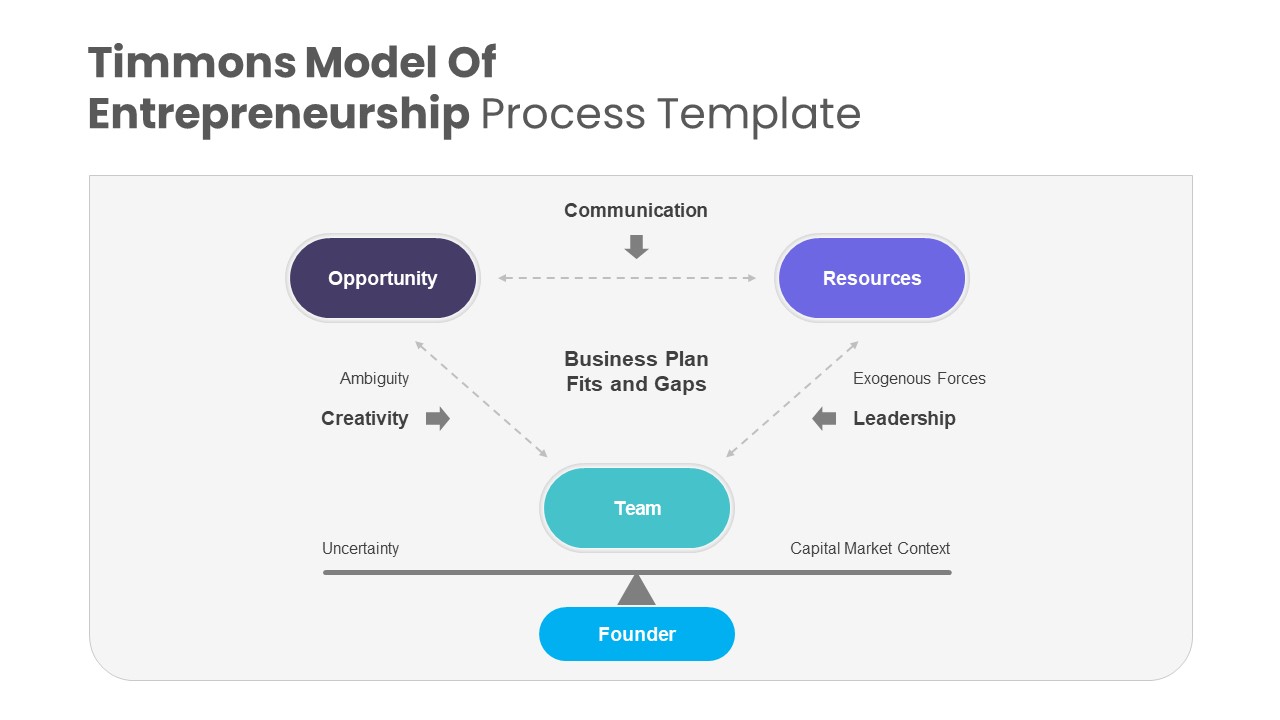
Timmons Model of Entrepreneurship Process Template for PowerPoint & Google Slides
Business Models
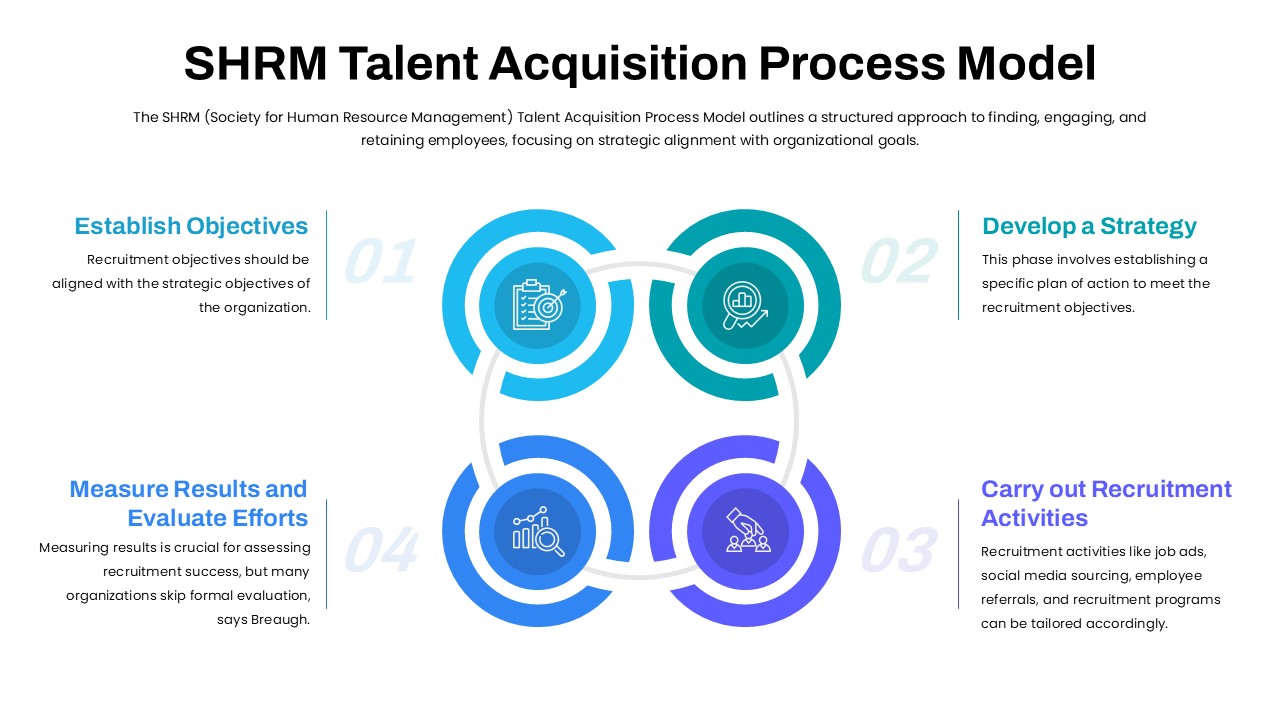
SHRM Talent Acquisition Process Model Template for PowerPoint & Google Slides
Business Models
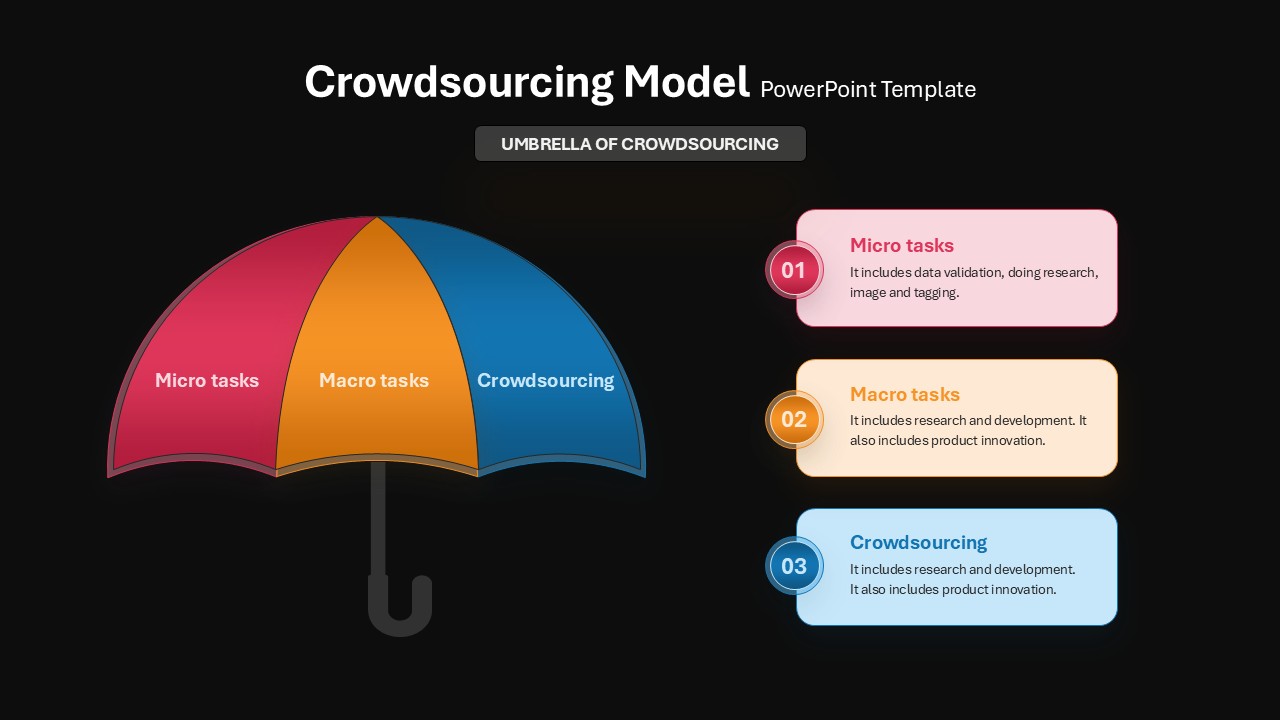
Crowdsourcing Model Umbrella & Process Template for PowerPoint & Google Slides
Infographics
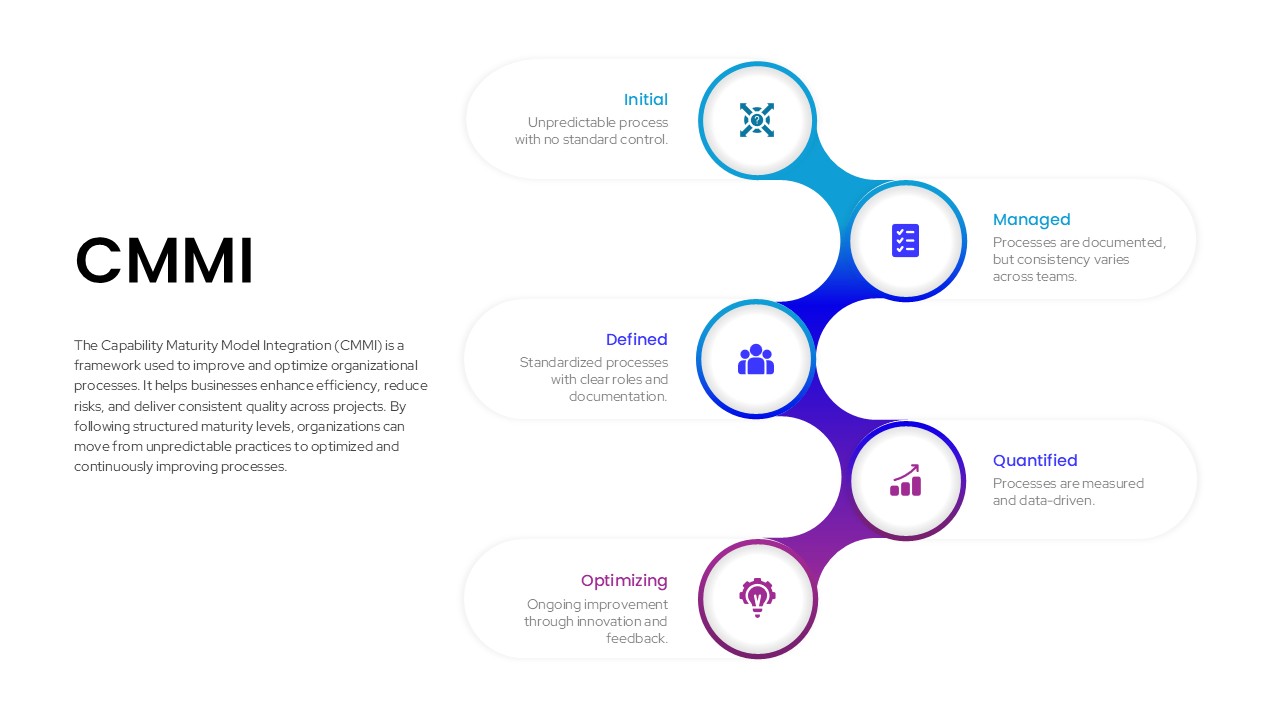
CMMI Process Maturity Model Infographic Template for PowerPoint & Google Slides
Process
4 Step Process PowerPoint & Google Slides Template for PowerPoint & Google Slides
Process
Sales Process Infographic Slides Pack Template for PowerPoint & Google Slides
Process
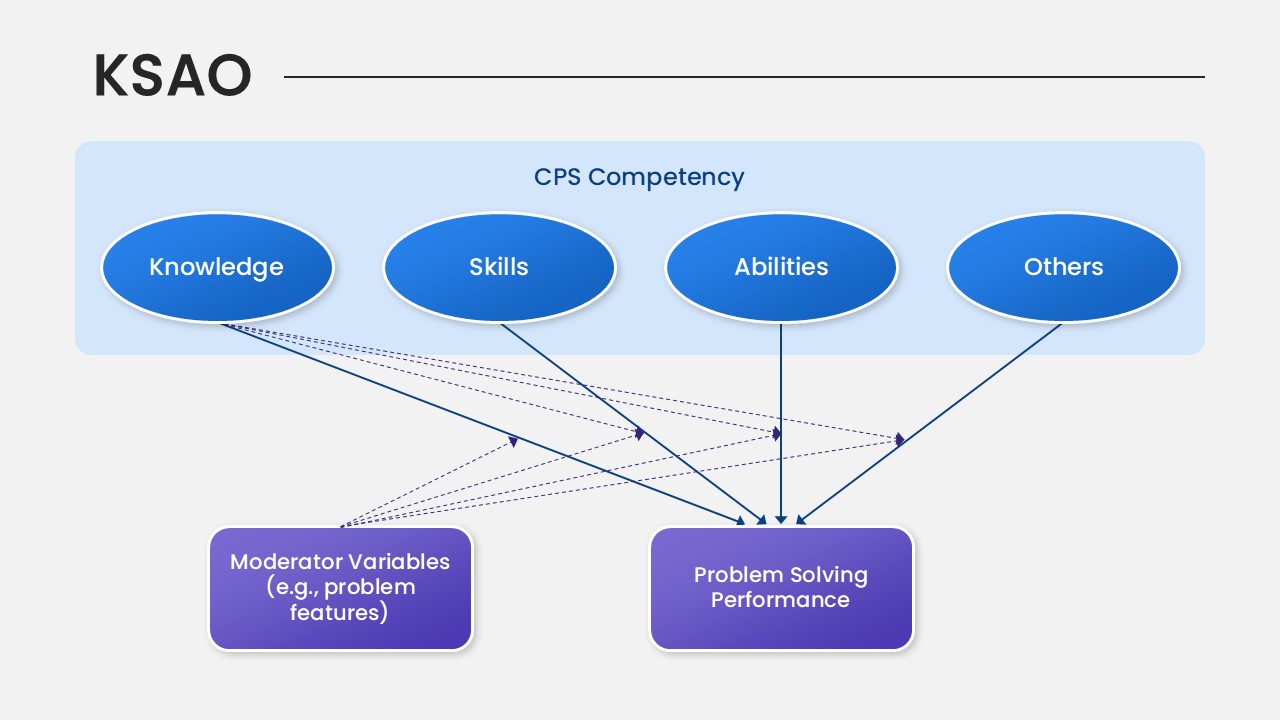
KSAO Model PowerPoint Template for PowerPoint & Google Slides
Business Strategy
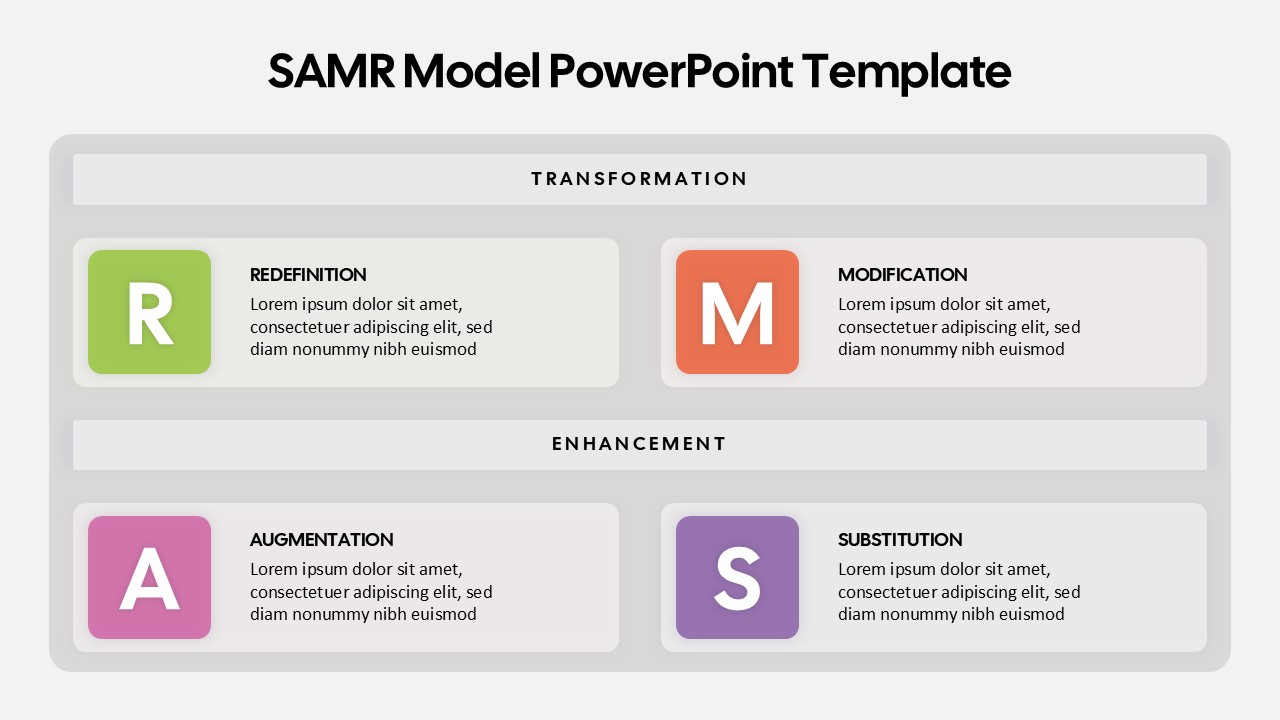
SAMR Model PowerPoint Template for PowerPoint & Google Slides
Business
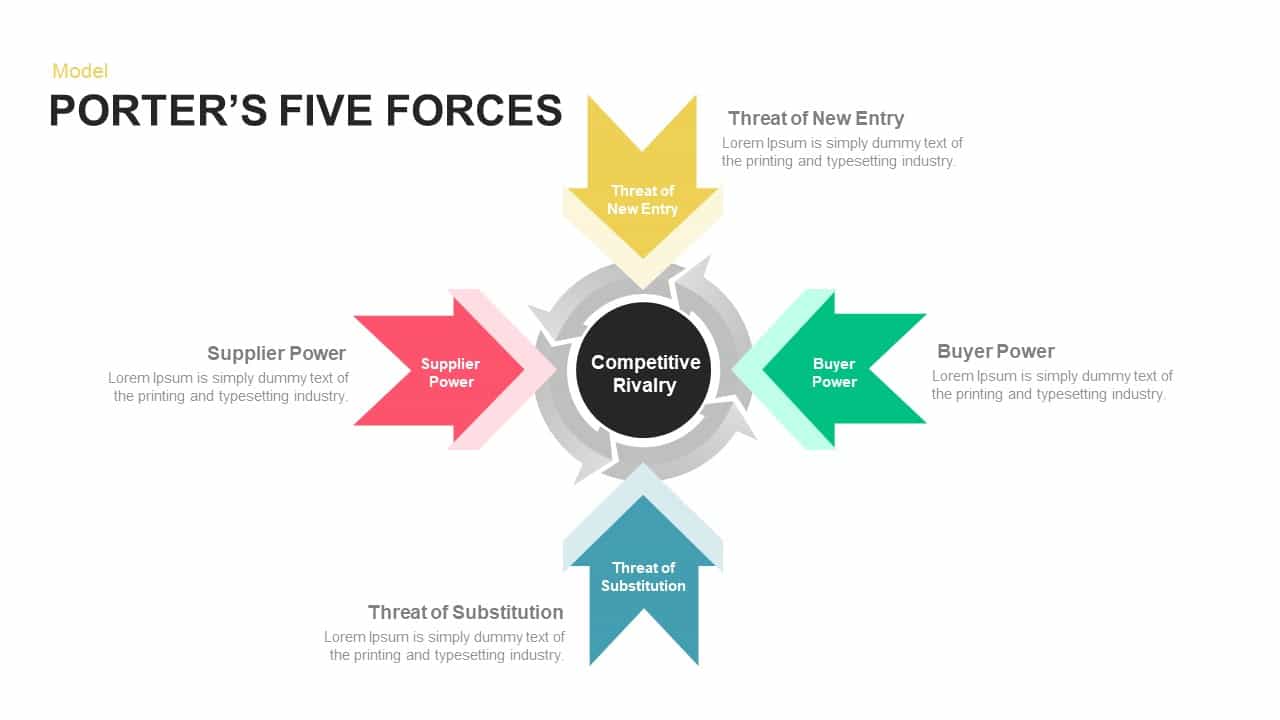
Porter’s Five Forces Model Diagram Template for PowerPoint & Google Slides
Competitor Analysis
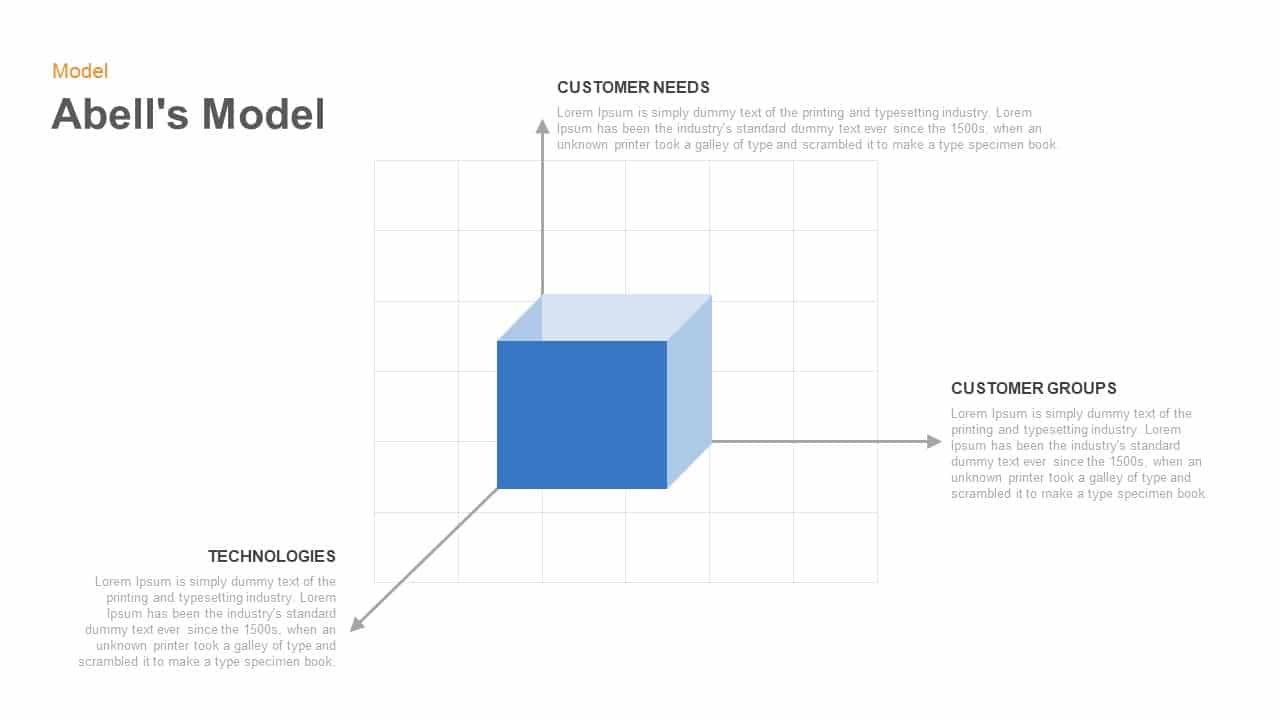
Abell’s 3D Cube Model Diagram Template for PowerPoint & Google Slides
Business Models
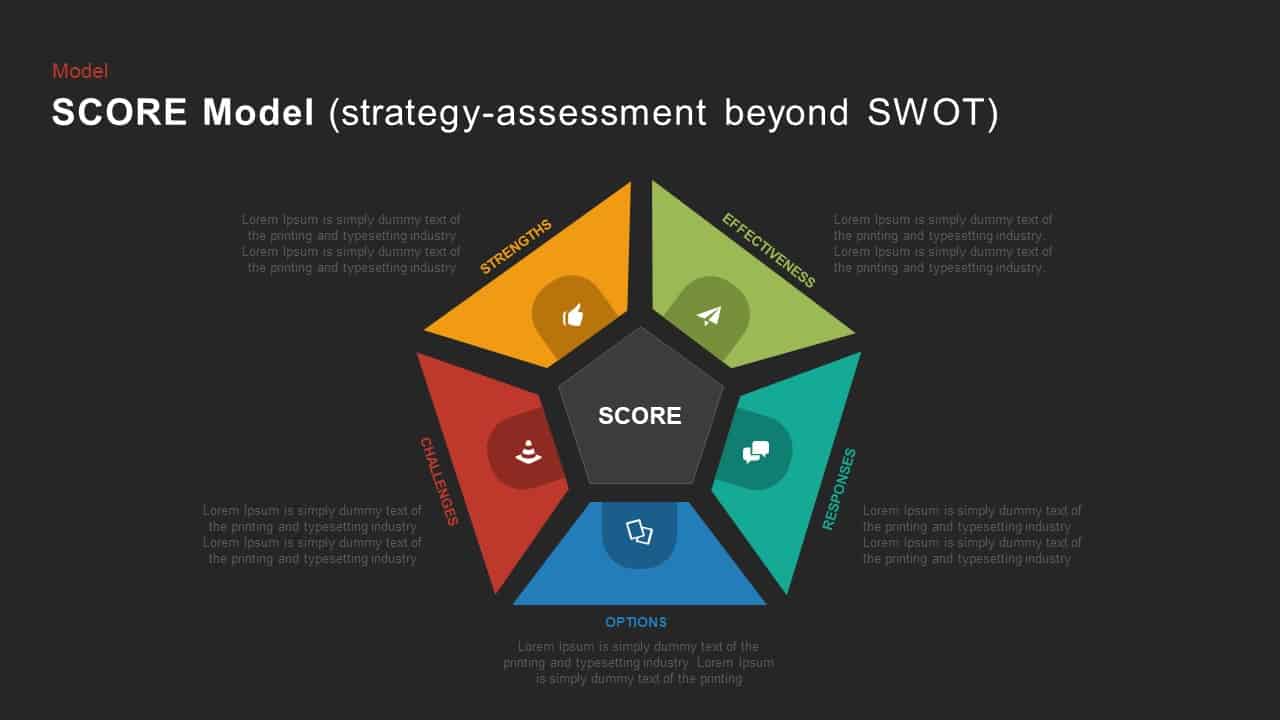
SCORE Model Pentagon Assessment Diagram Template for PowerPoint & Google Slides
Circular
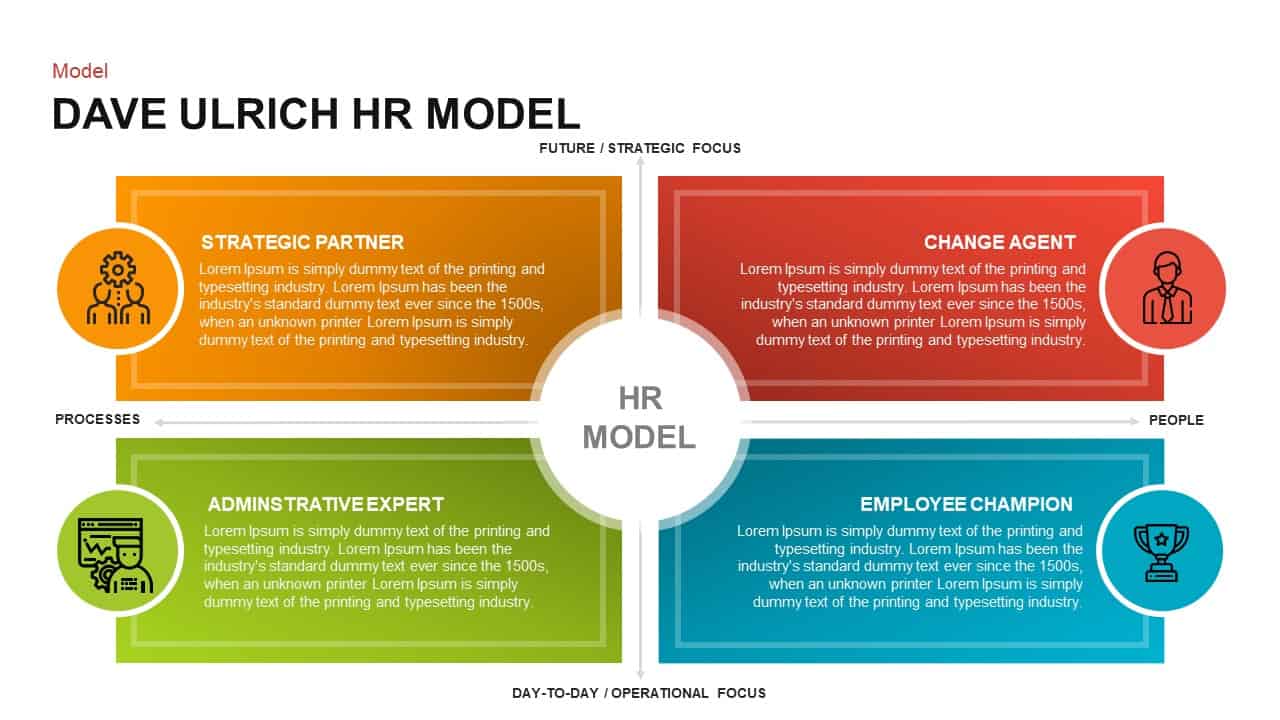
Dave Ulrich Strategic HR Model Quadrant Template for PowerPoint & Google Slides
Employee Performance

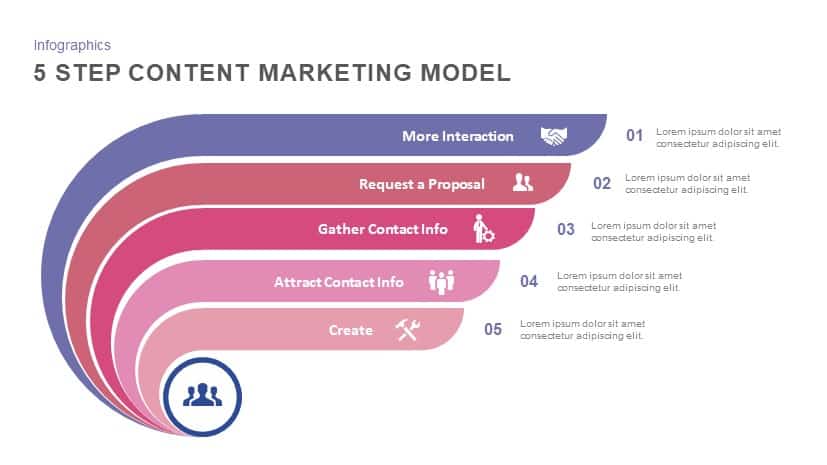
5 Step Content Marketing Model template for PowerPoint & Google Slides
Marketing
Supply Positioning Model Matrix Template for PowerPoint & Google Slides
Comparison Chart
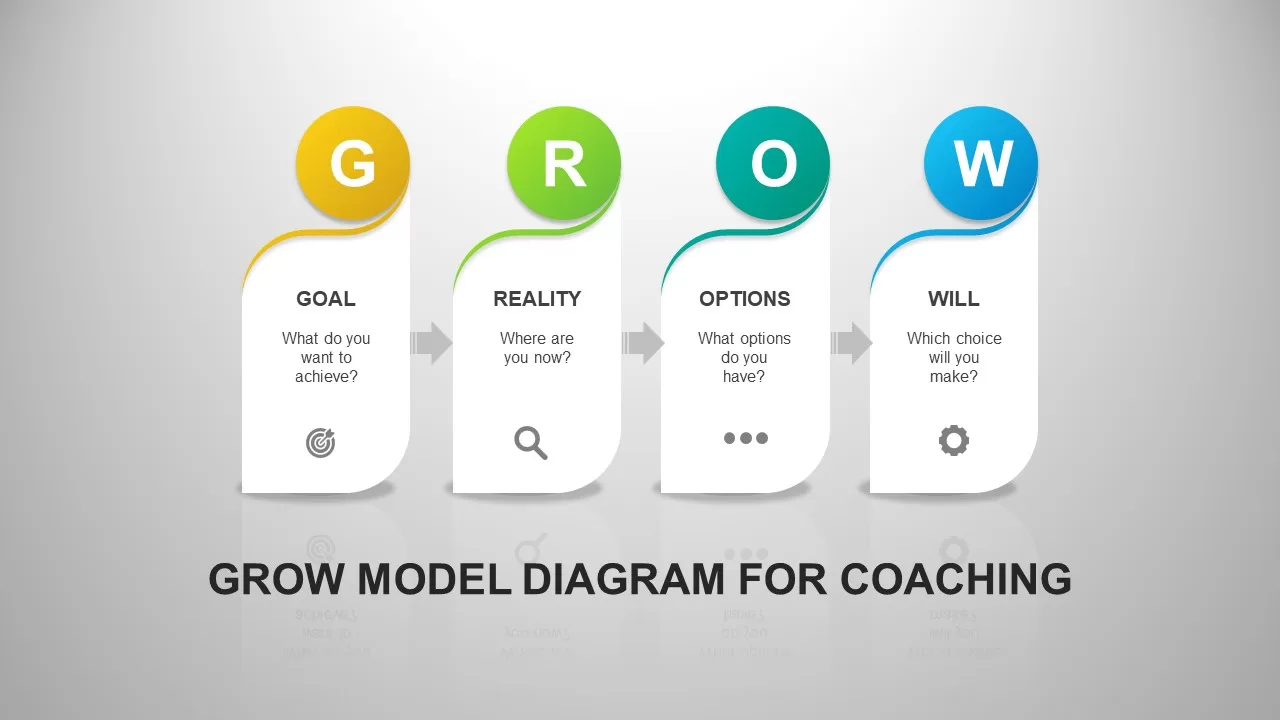
GROW Model Coaching PowerPoint & Google Slides Template for Presentations
Business Strategy
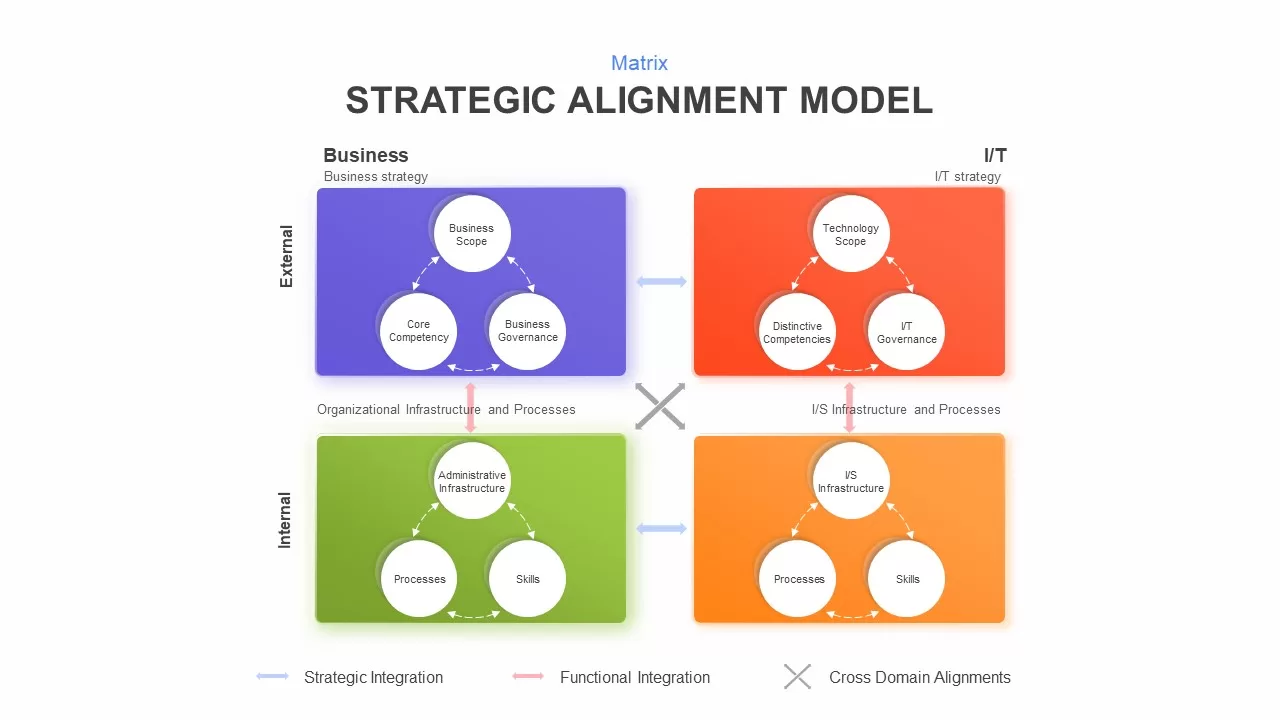
Strategic Alignment Matrix Model Template for PowerPoint & Google Slides
Project
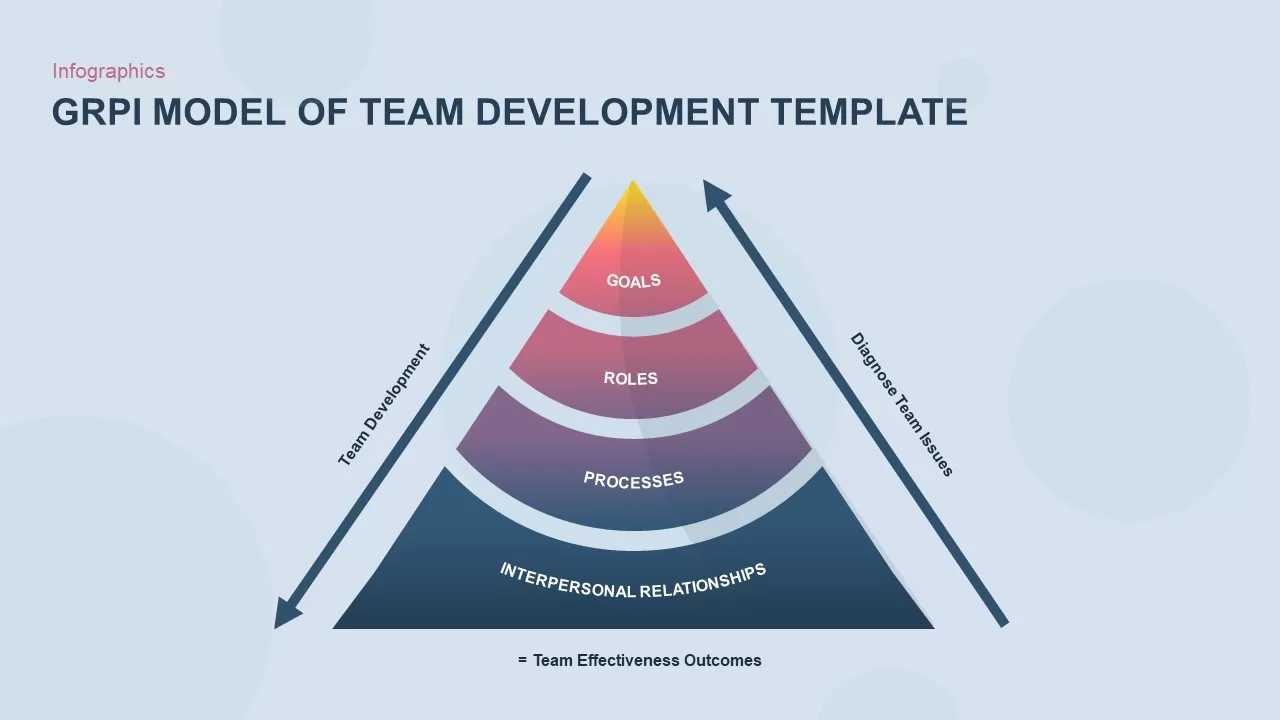
GRPI Model of Team Development Framework Template for PowerPoint & Google Slides
Leadership
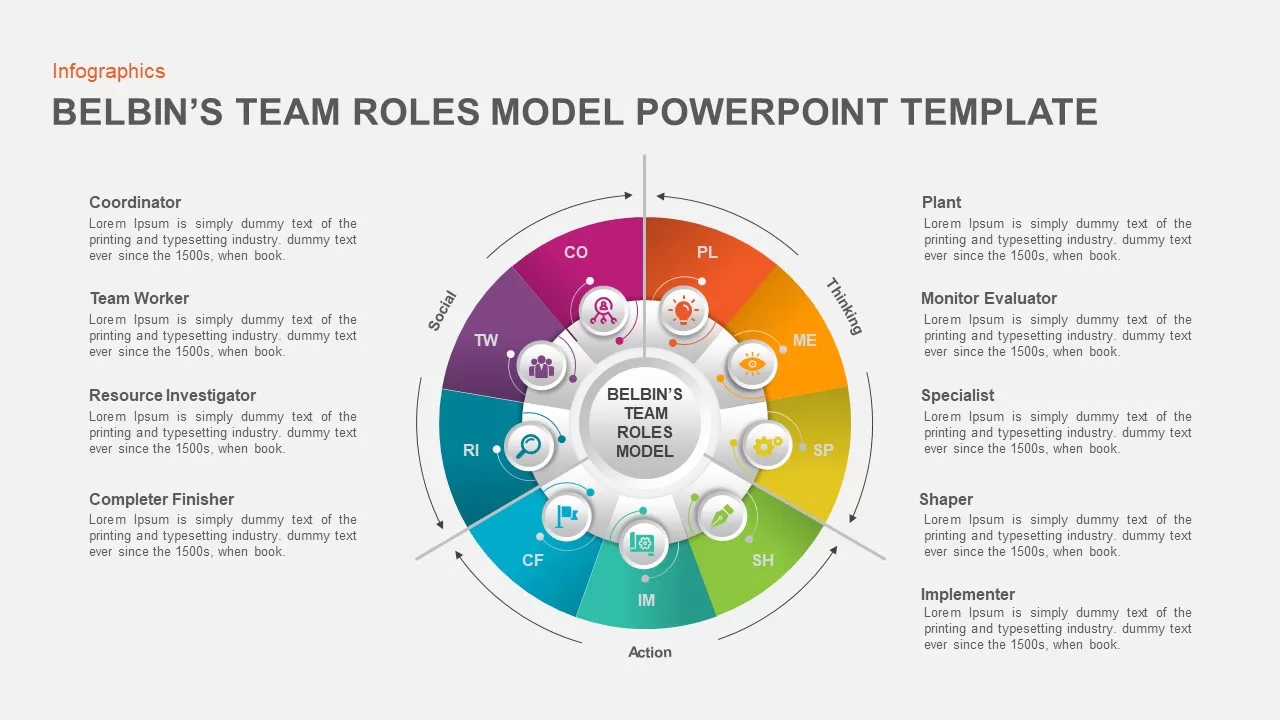
Belbin’s Team Roles Model Diagram Template for PowerPoint & Google Slides
HR
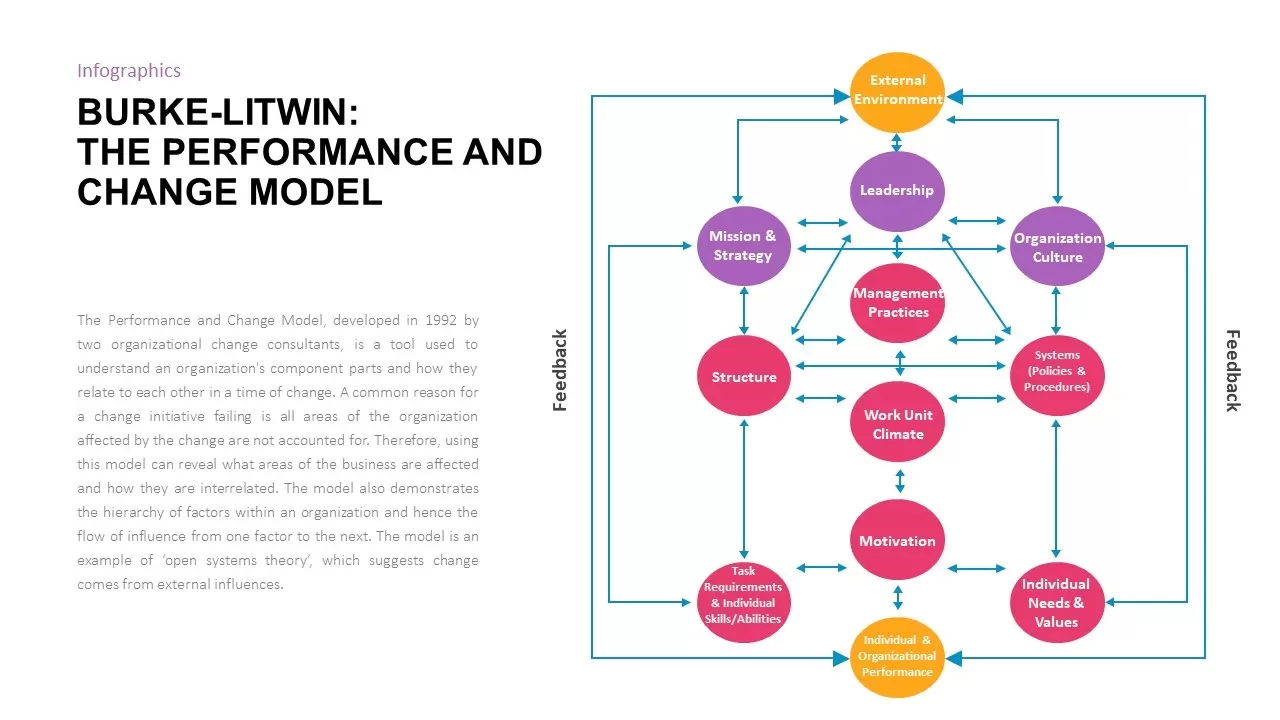
Burke-Litwin Performance and Change Model template for PowerPoint & Google Slides
Infographics
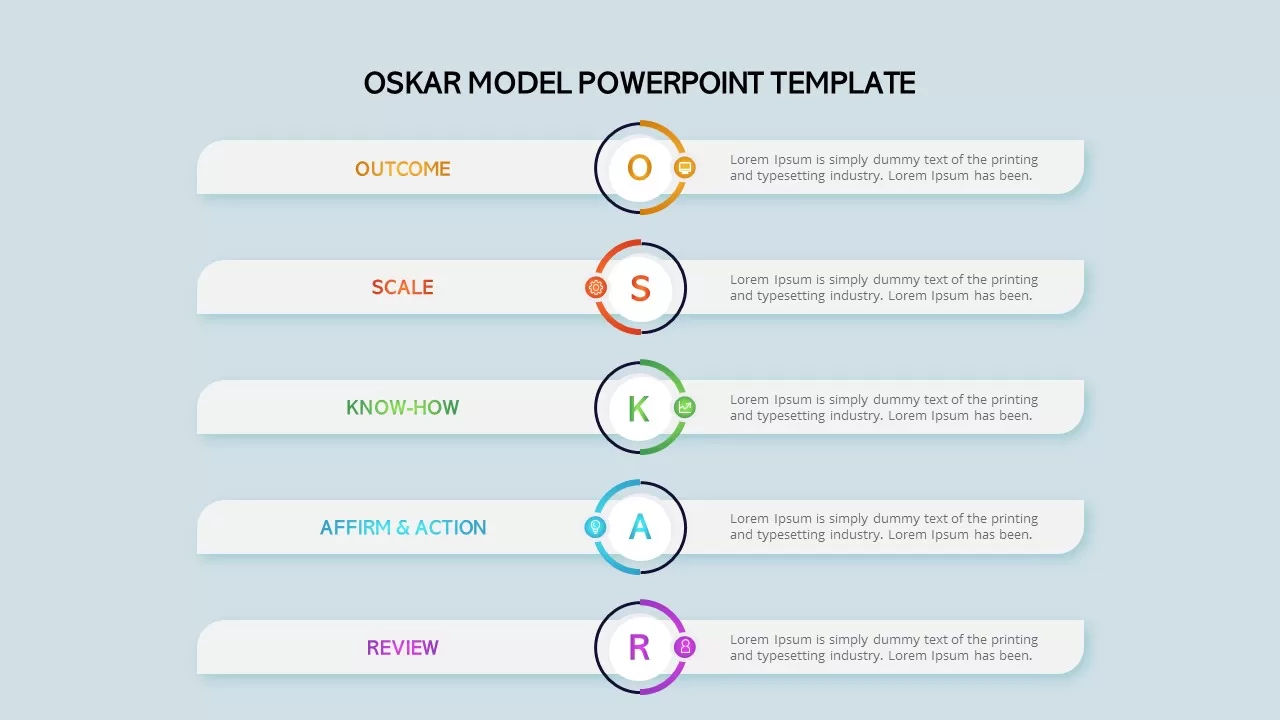
OSKAR Coaching Model Five-Step Framework Template for PowerPoint & Google Slides
Leadership
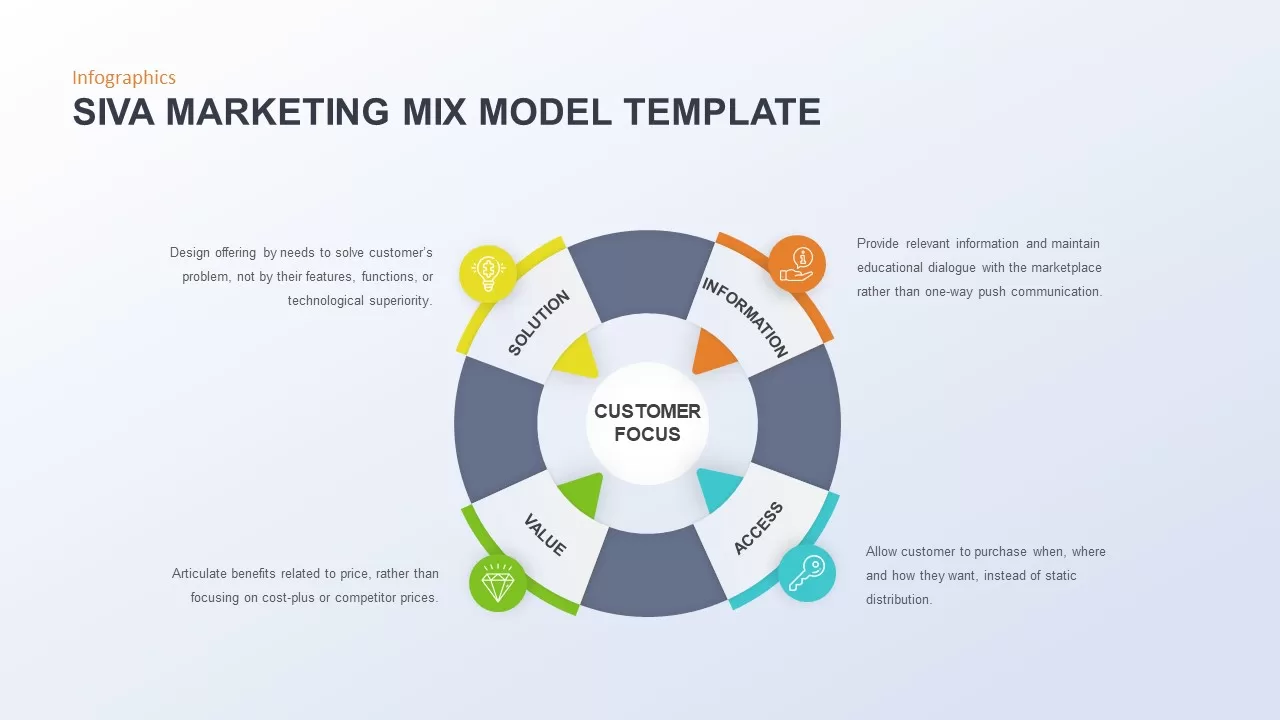
Comprehensive SIVA Marketing Mix Model Template for PowerPoint & Google Slides
Marketing
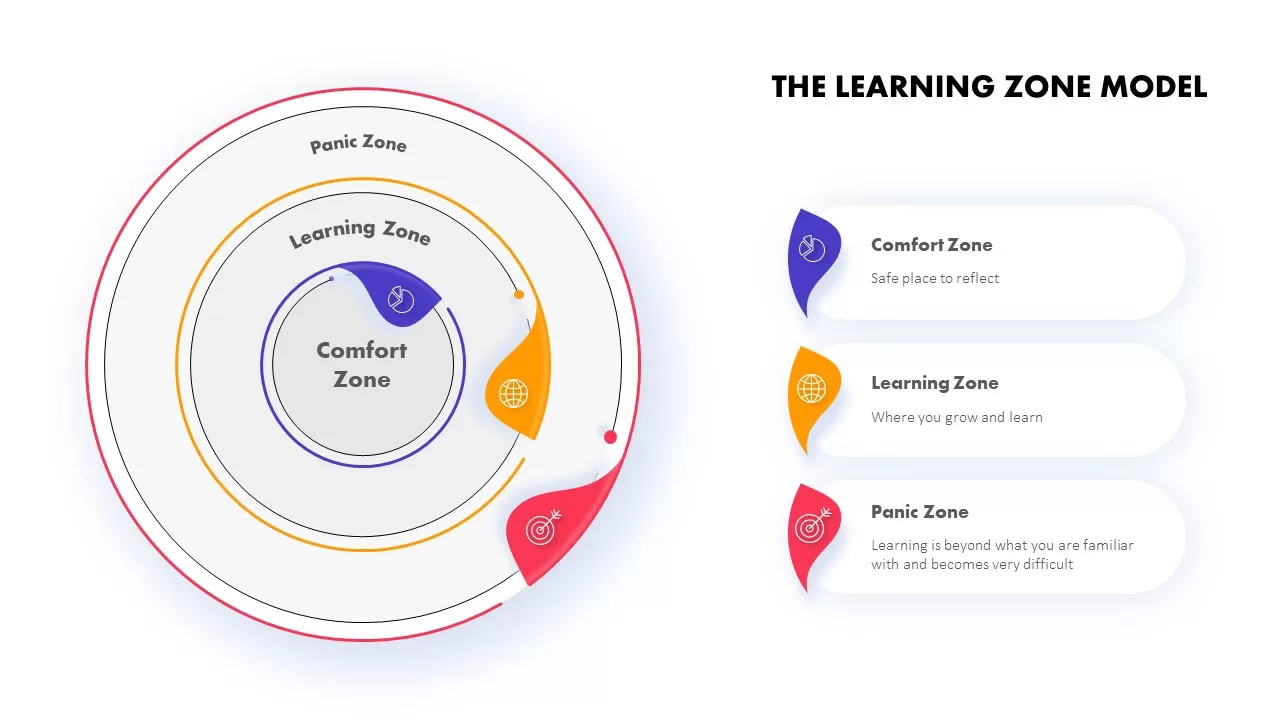
The Learning Zone Model Template for PowerPoint & Google Slides
Process
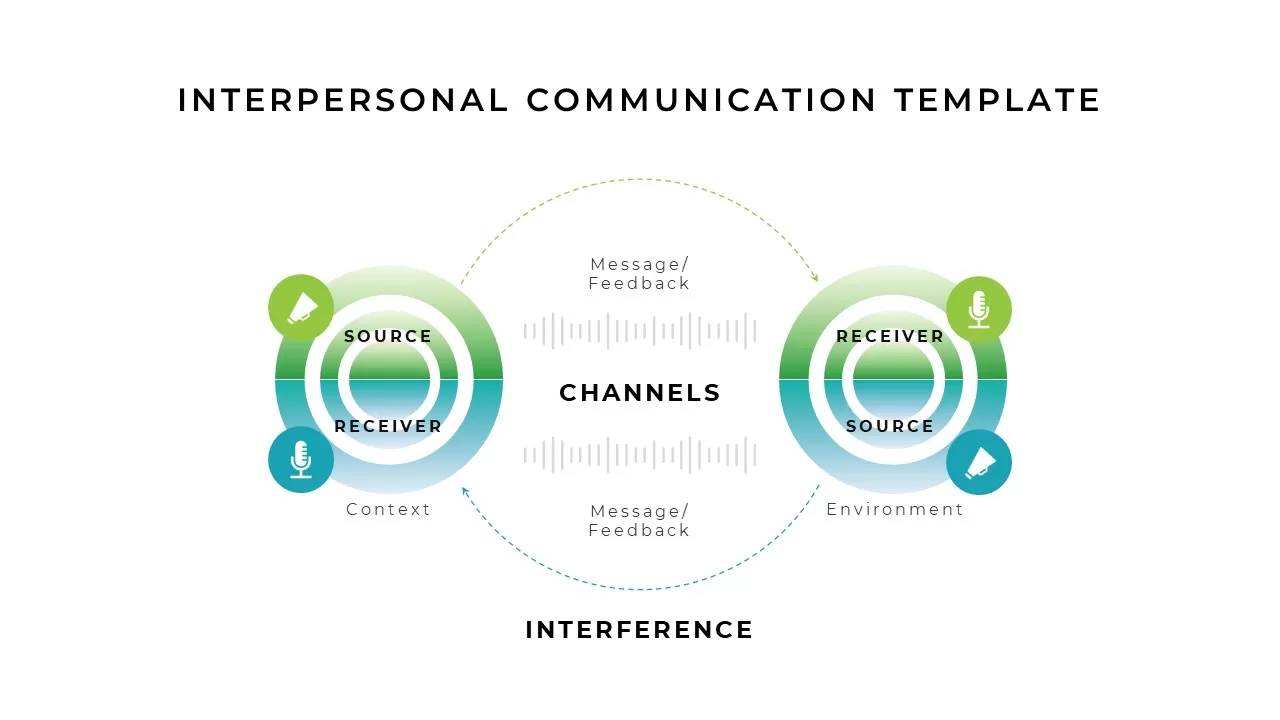
Interpersonal Communication Model Overview template for PowerPoint & Google Slides
Business
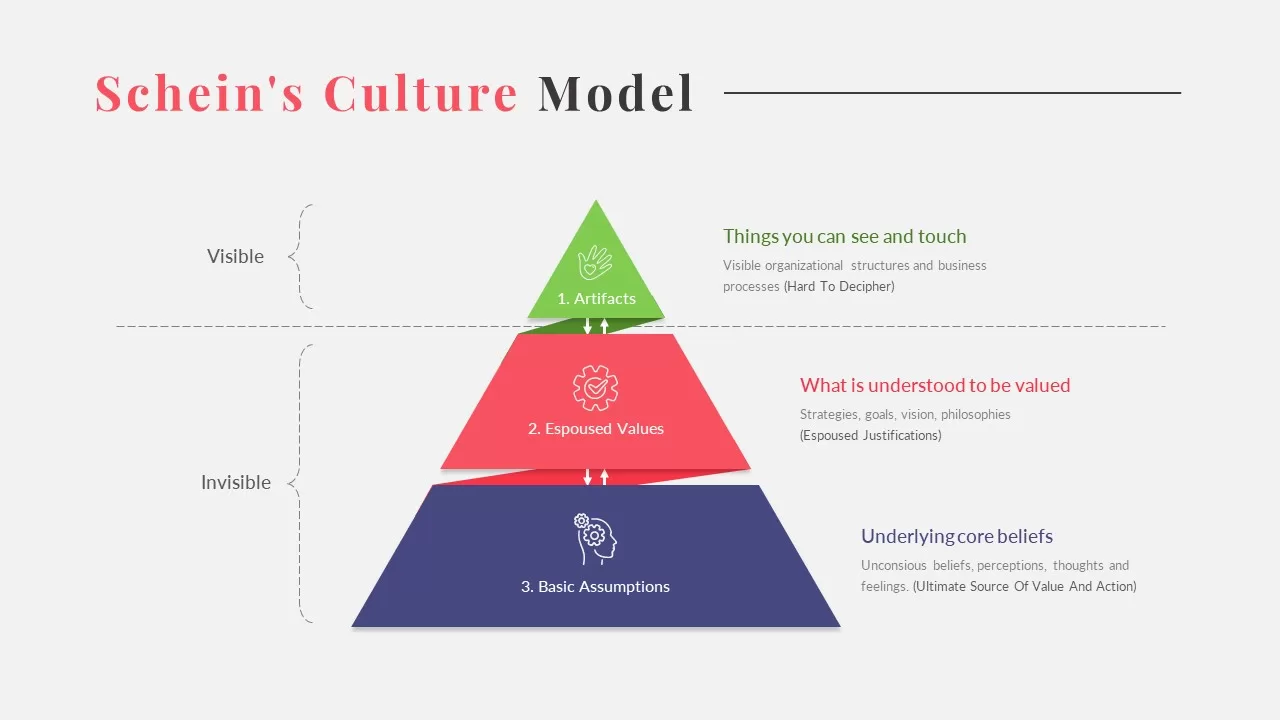
Schein’s Culture Pyramid Model Template for PowerPoint & Google Slides
Pyramid
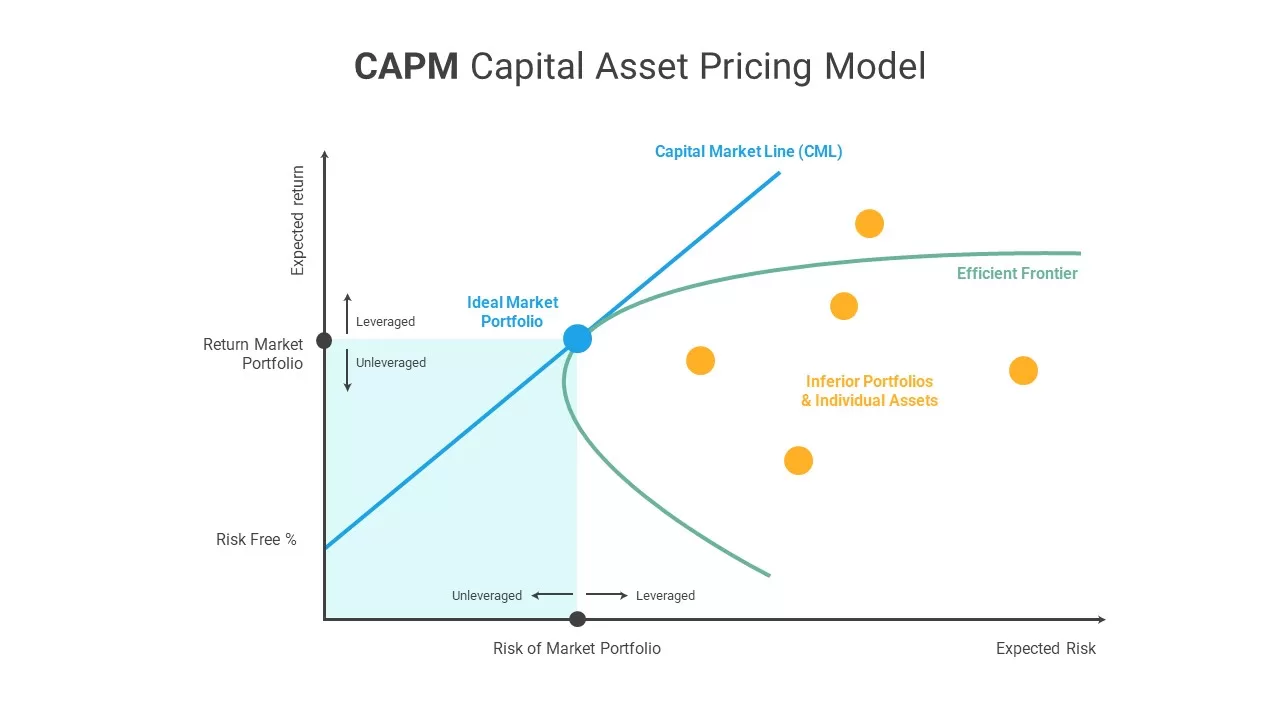
CAPM Capital Asset Pricing Model template for PowerPoint & Google Slides
Finance
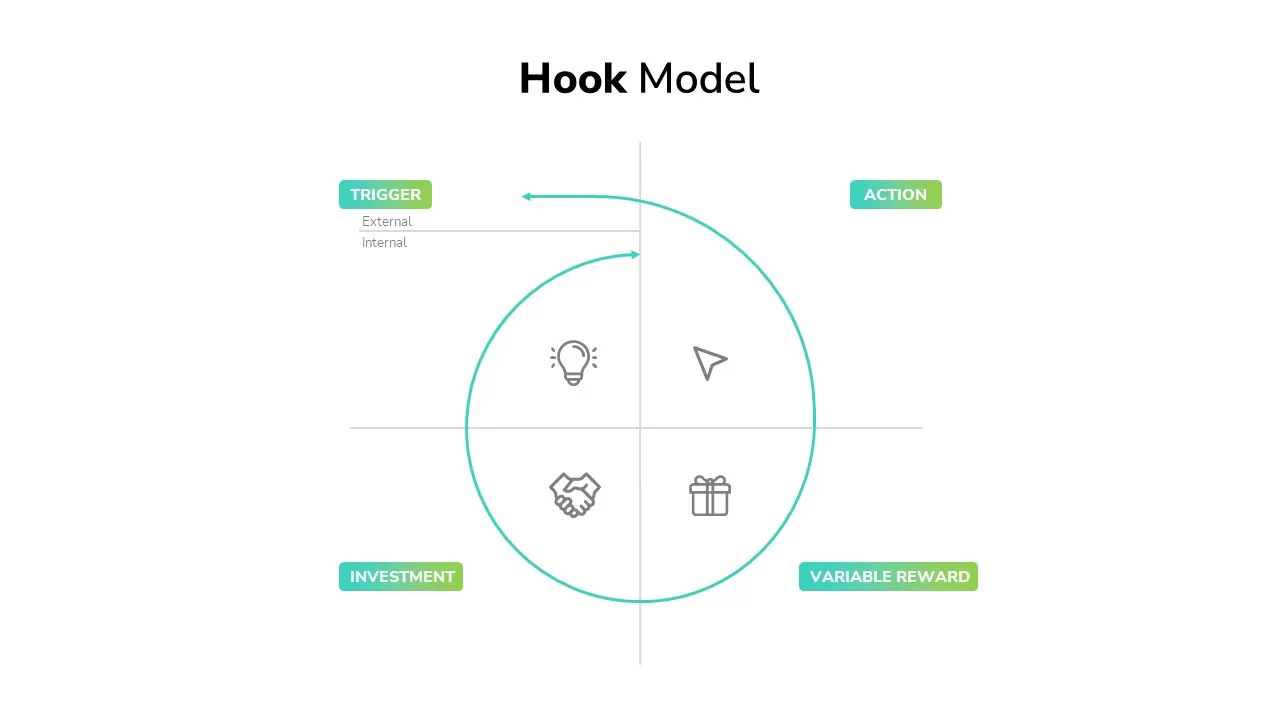
Hook Model Framework Template for PowerPoint & Google Slides
Business Strategy
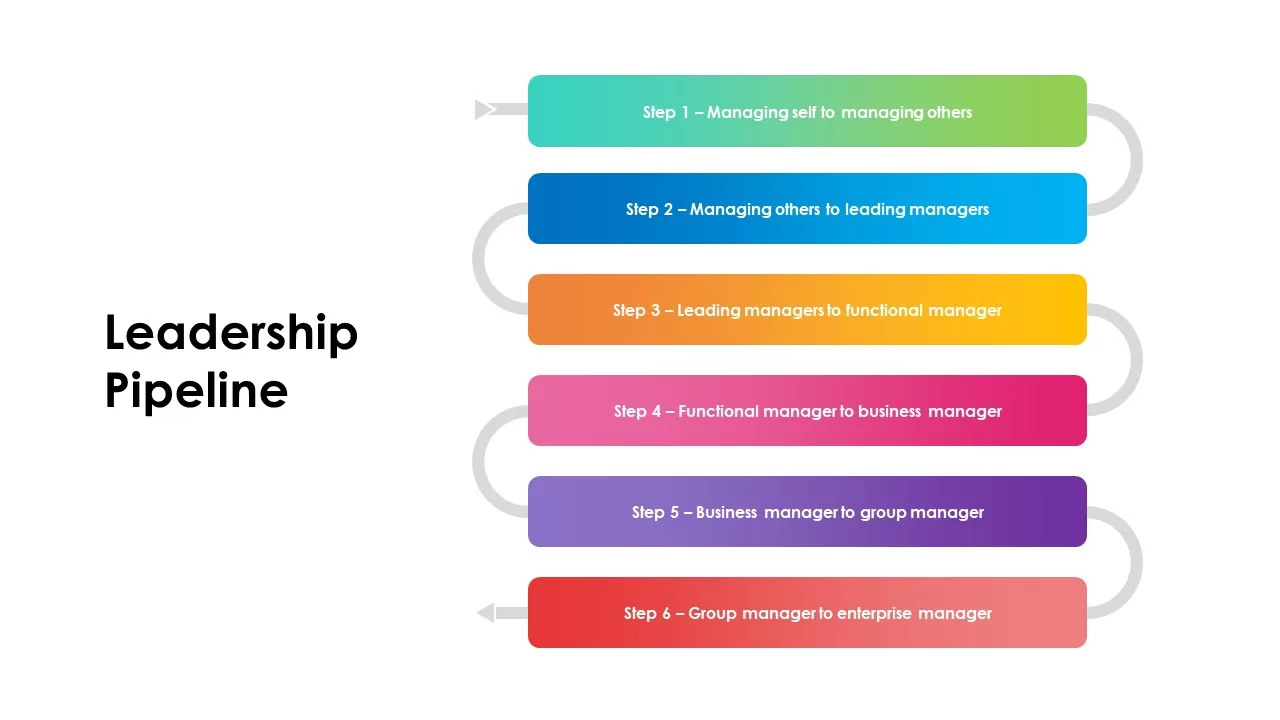
Leadership Pipeline Model Template for PowerPoint & Google Slides
Business Strategy
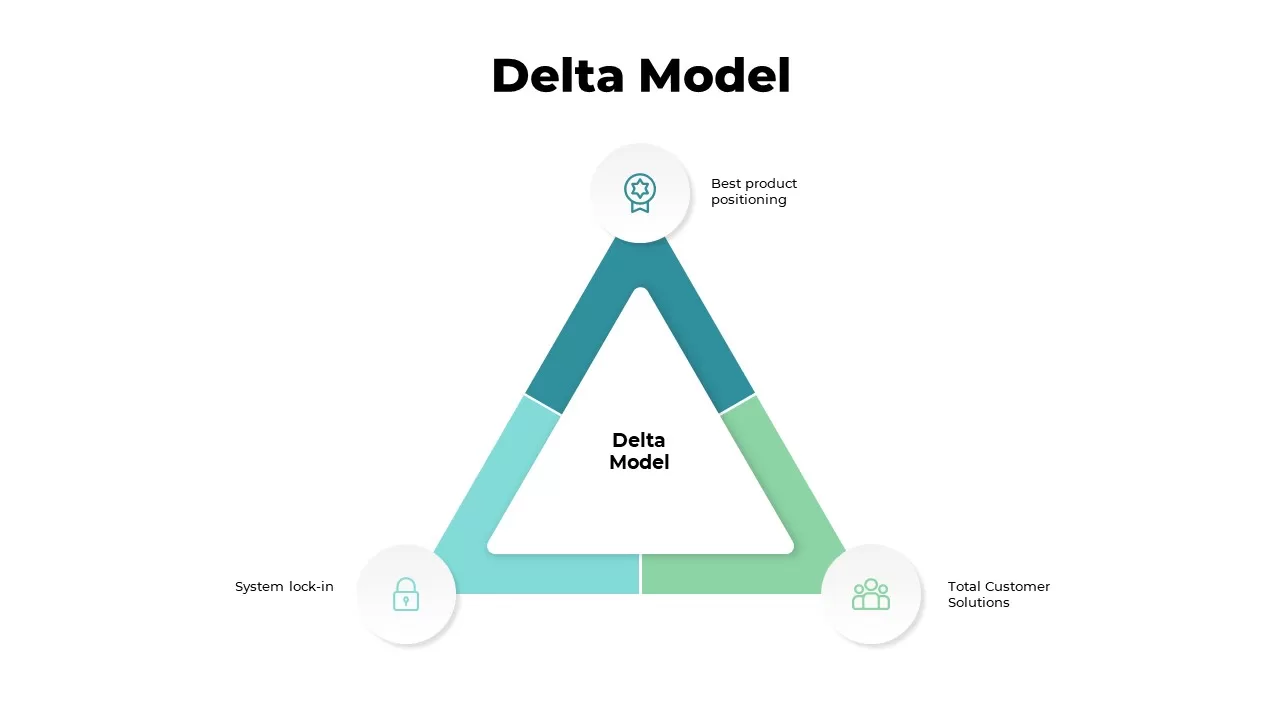
Delta Model Strategic Framework Template for PowerPoint & Google Slides
Business Strategy
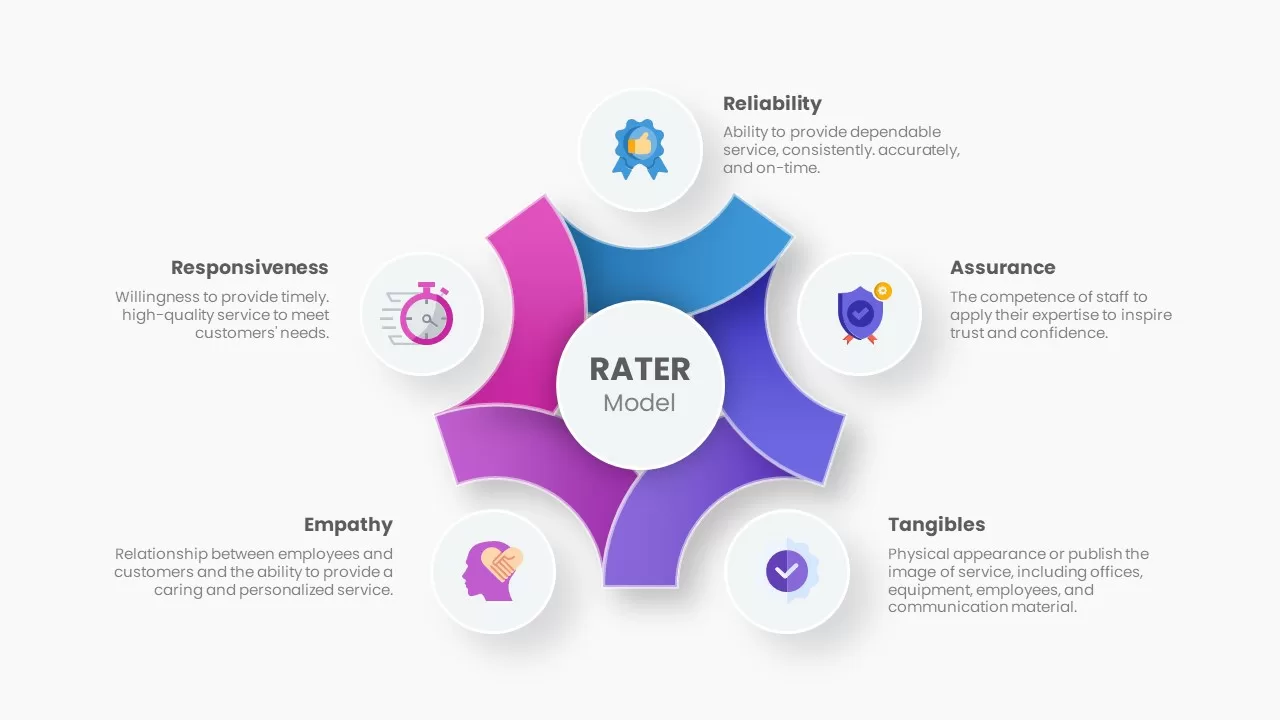
RATER Model template for PowerPoint & Google Slides
Business Strategy
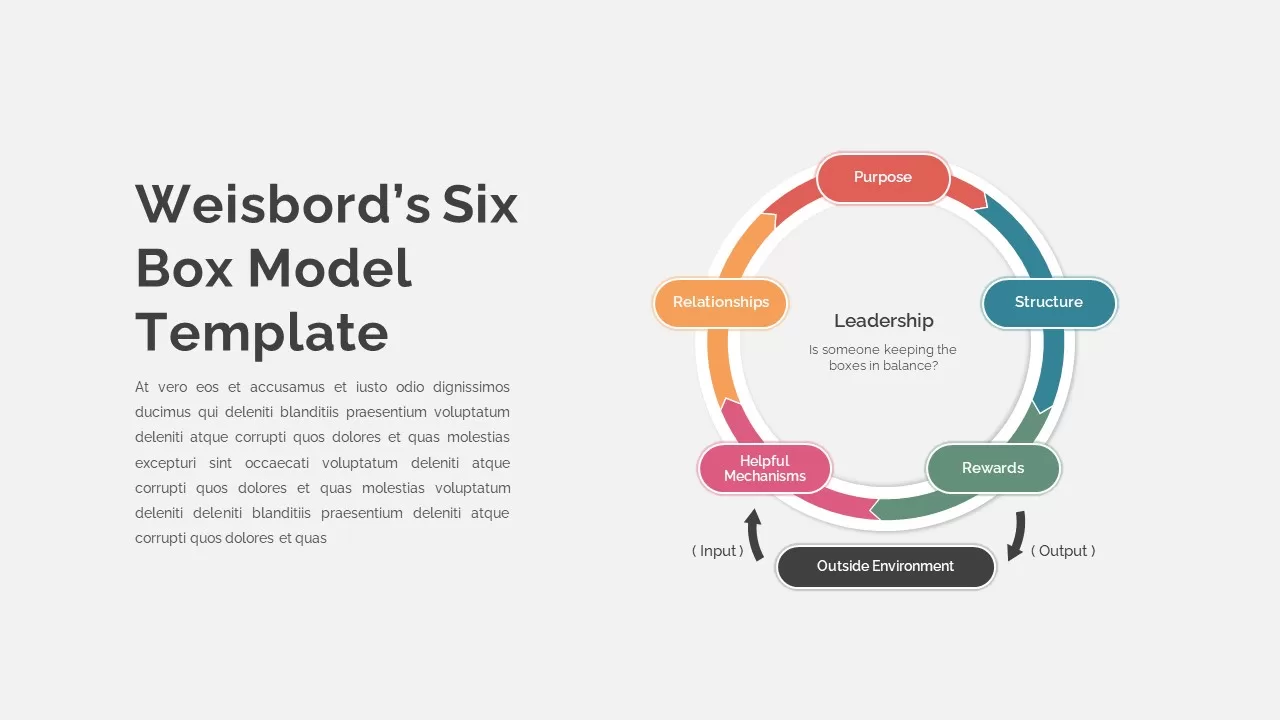
Weisbord’s Six Box Model Infographics Template for PowerPoint & Google Slides
Circular
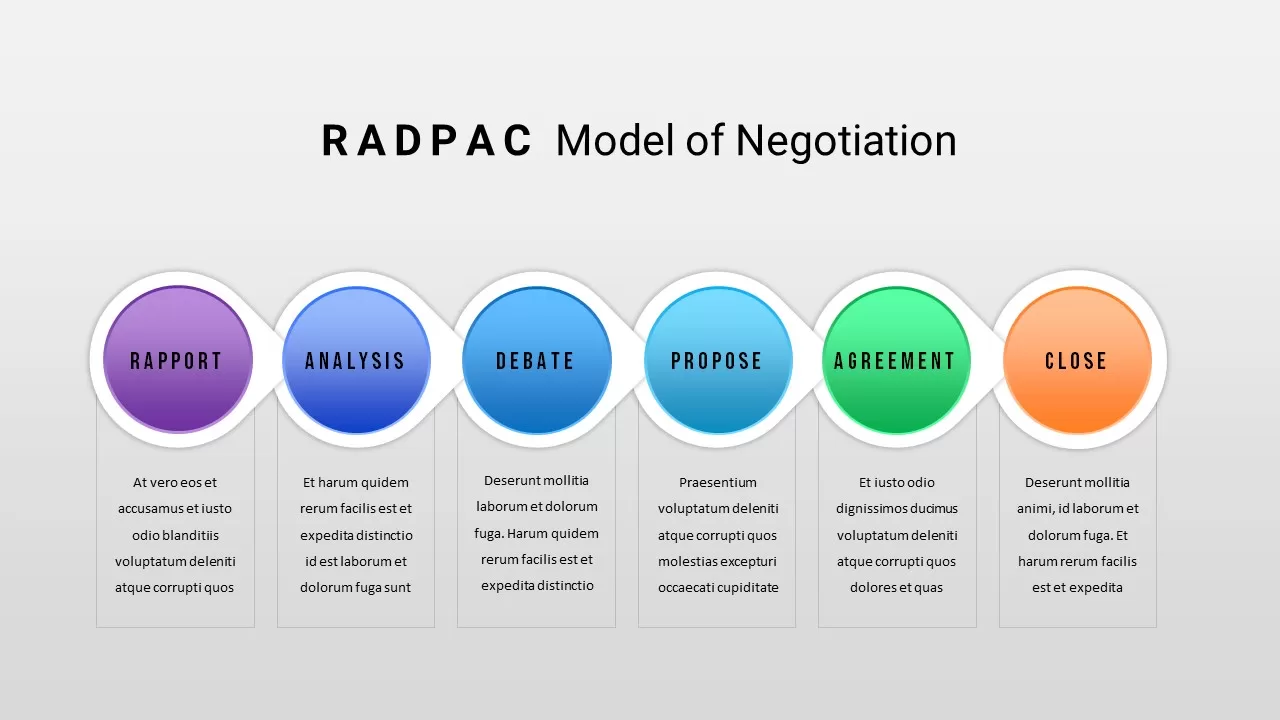
RADPAC Model of Negotiation template for PowerPoint & Google Slides
Competitor Analysis
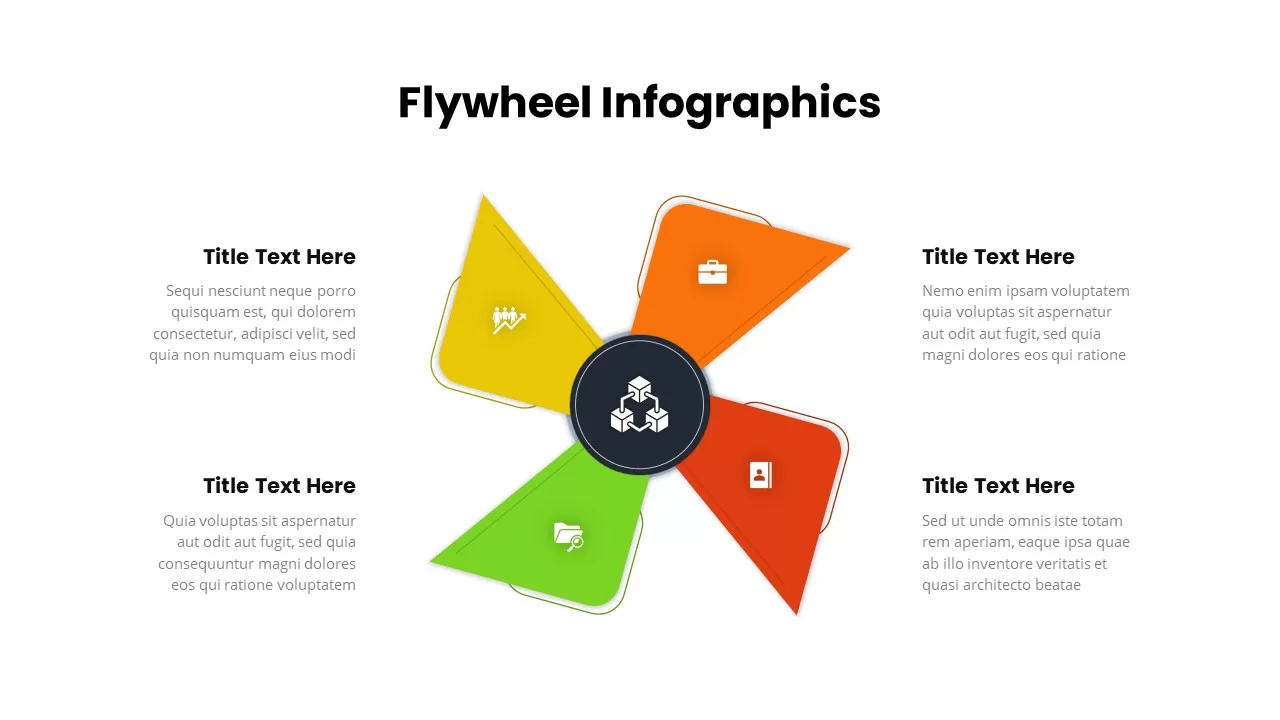
Four-Segment Flywheel Infographic Model Template for PowerPoint & Google Slides
Process
RABOSTIC IMC Planning Model Diagram Template for PowerPoint & Google Slides
Process
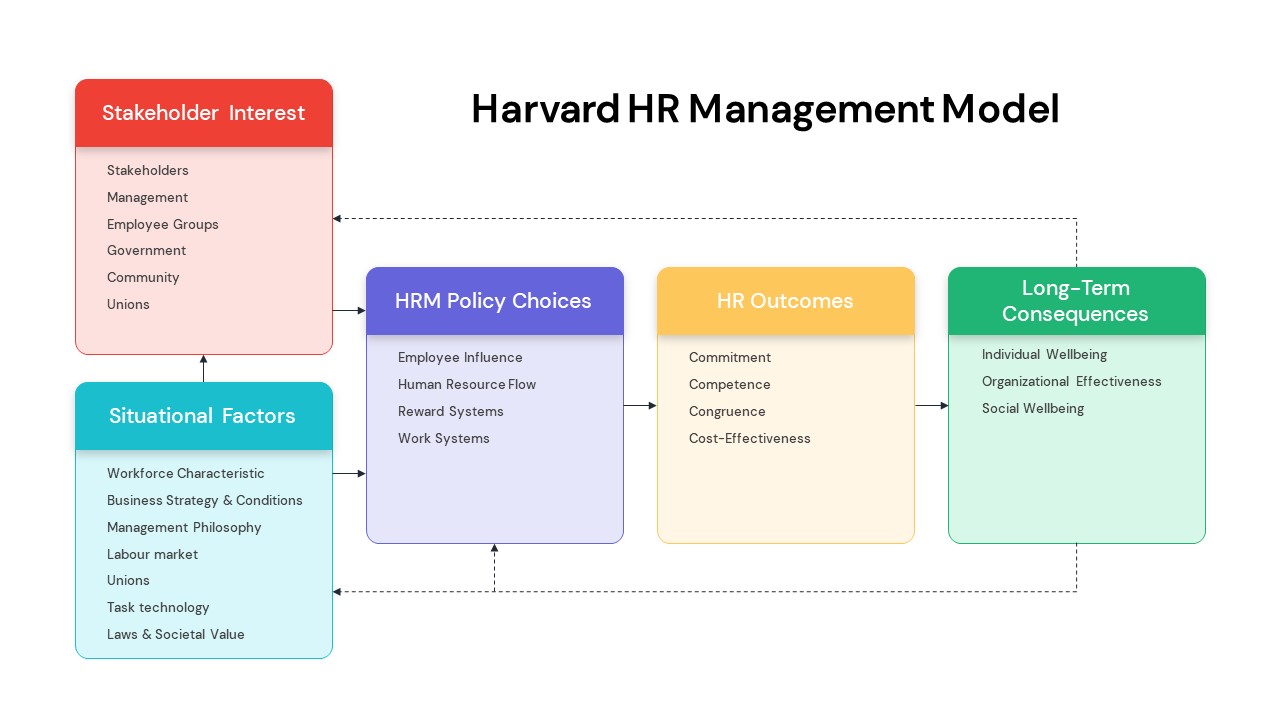
Harvard HR Management Model Diagram Template for PowerPoint & Google Slides
Process
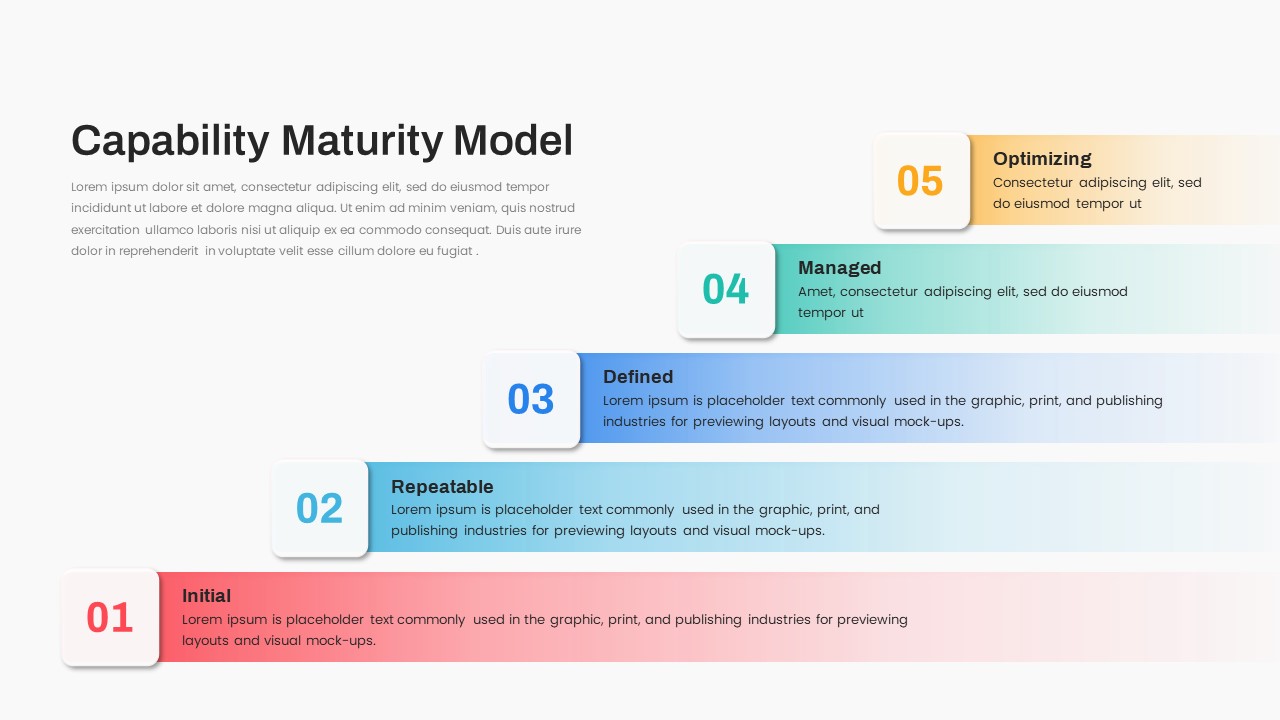
Capability Maturity Model Infographic Template for PowerPoint & Google Slides
Software Development
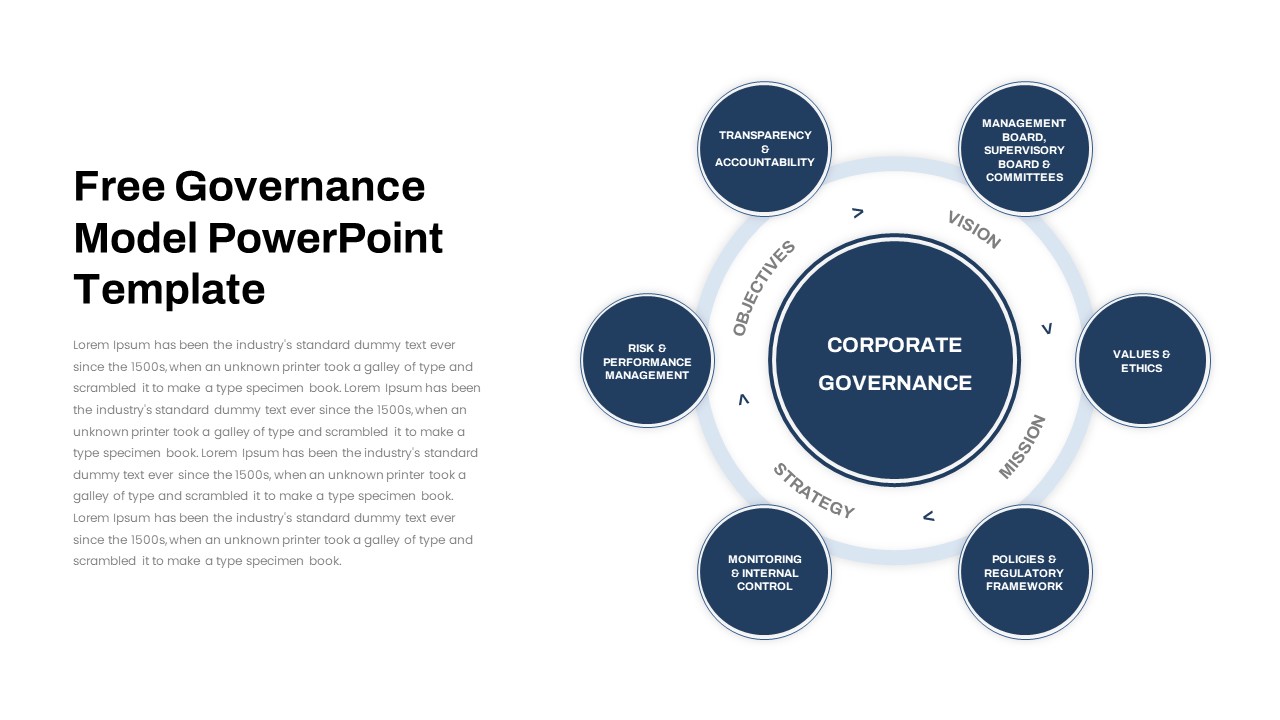
Free Corporate Governance Circular Model Template for PowerPoint & Google Slides
Circular
Free
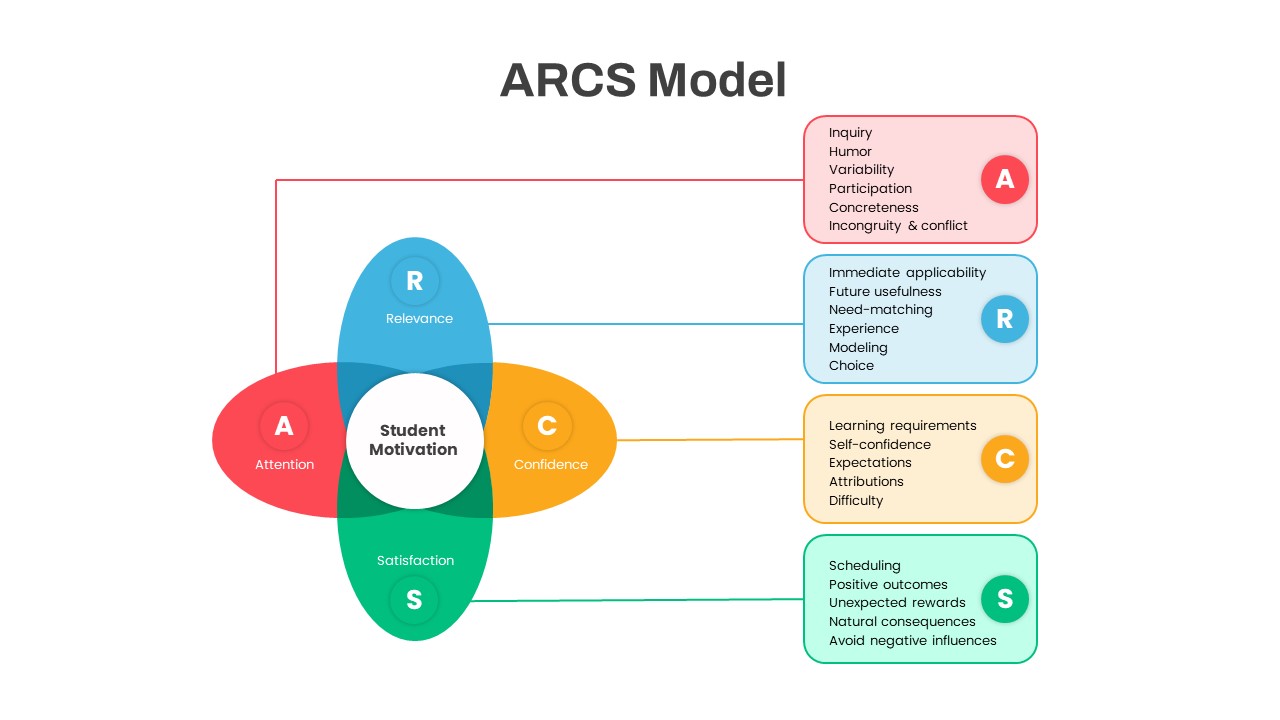
ARCS Student Motivation Model Diagram Template for PowerPoint & Google Slides
Process
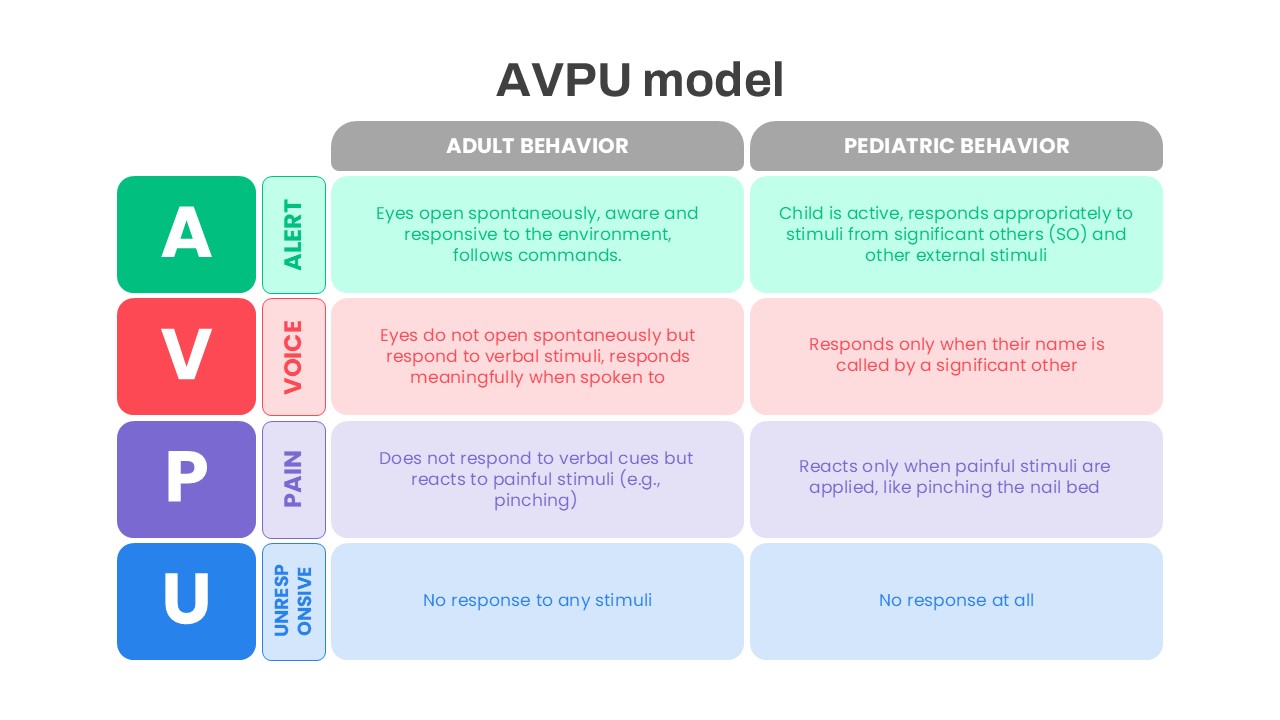
AVPU Model Behavior Assessment Template for PowerPoint & Google Slides
Health
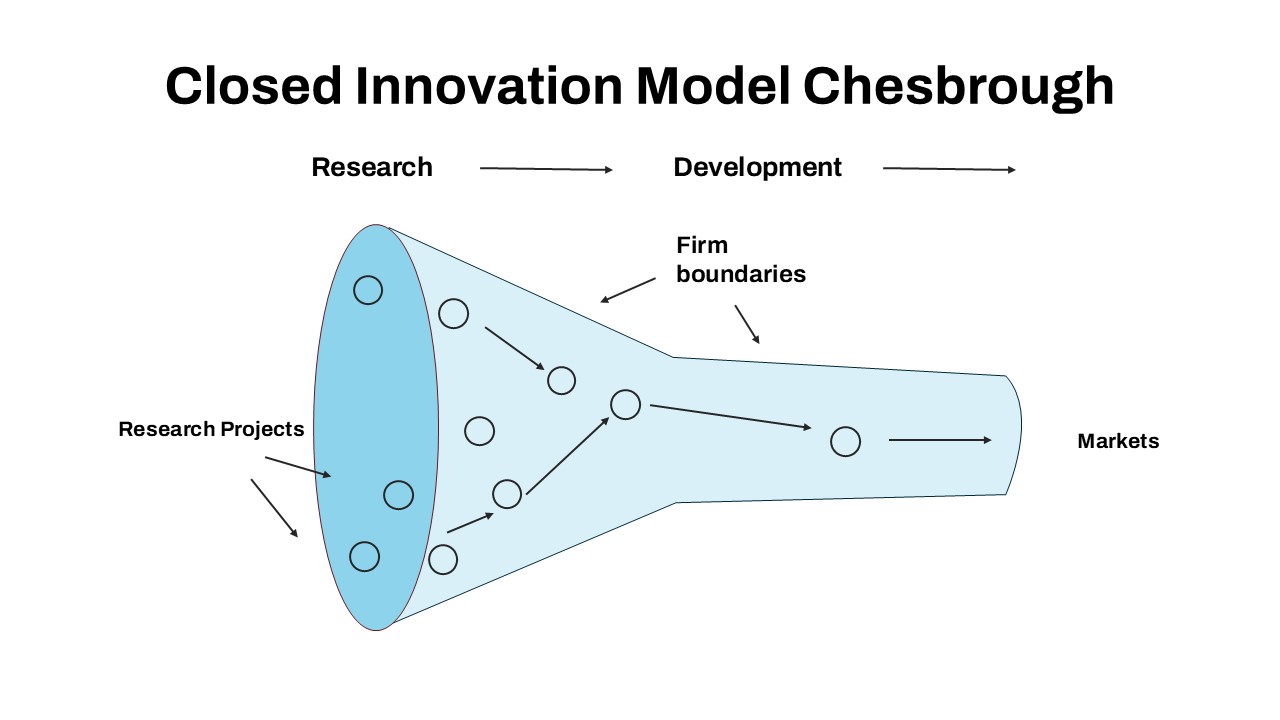
Closed Innovation Model Funnel Diagram Template for PowerPoint & Google Slides
Funnel
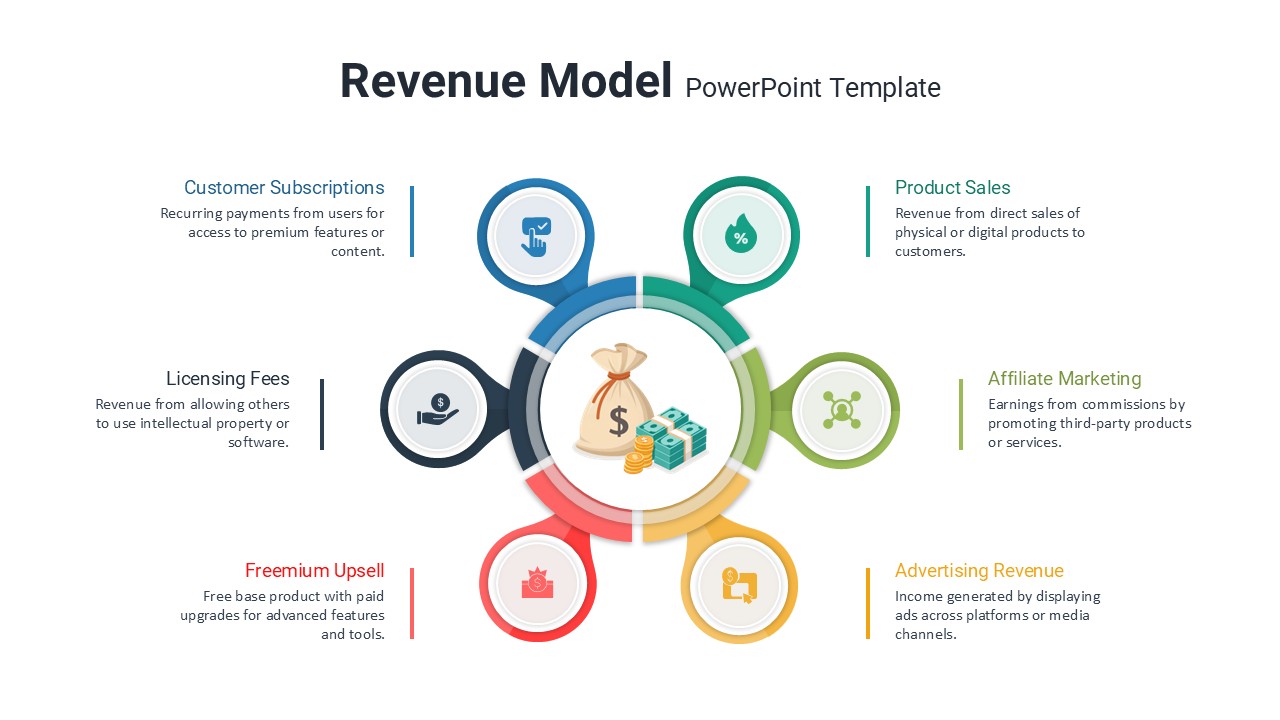
Six Revenue Stream Model Infographic Template for PowerPoint & Google Slides
Circular
Zero Trust Security Model Overview template for PowerPoint & Google Slides
Infographics
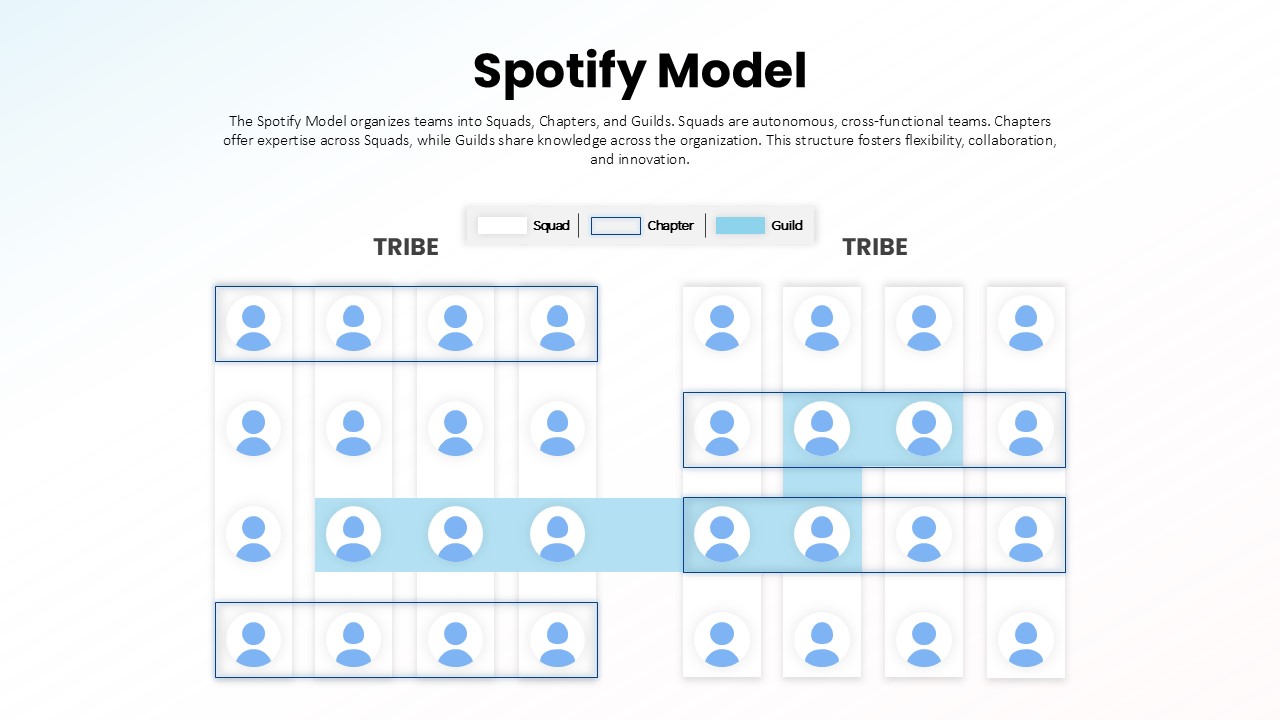
Spotify Model Organizational Structure template for PowerPoint & Google Slides
Business Strategy
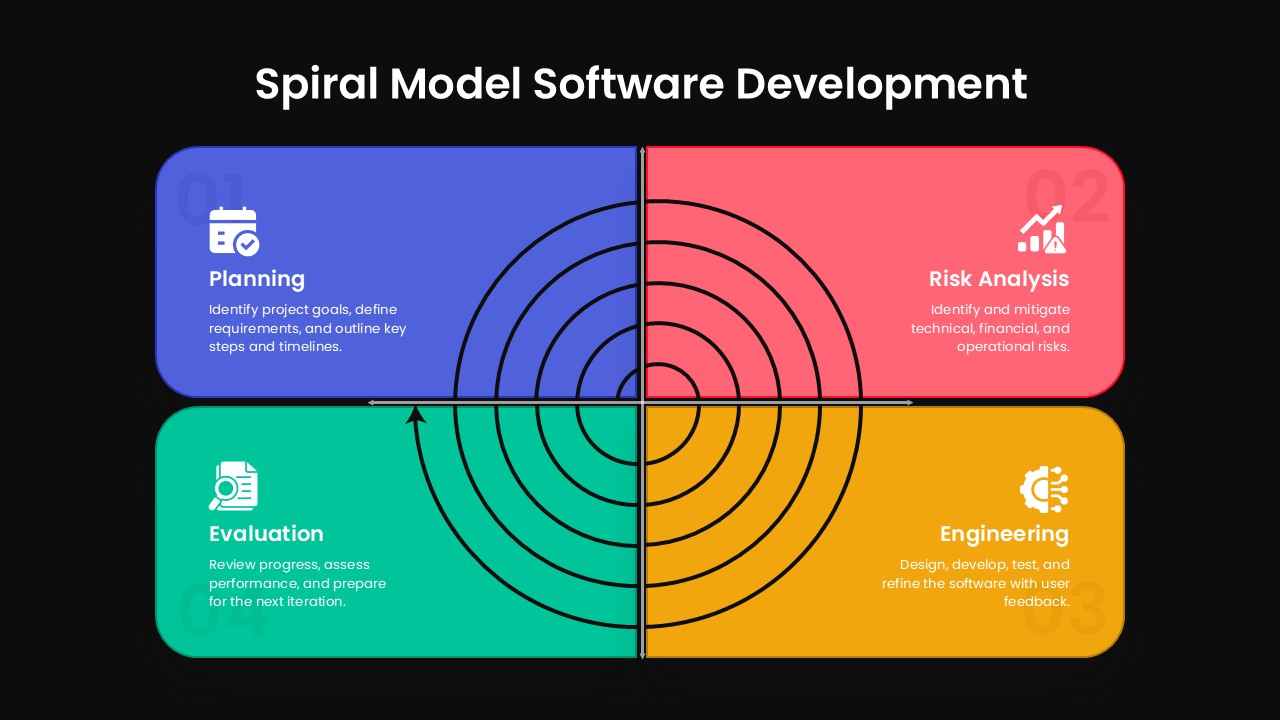
Spiral Model Software Development Template for PowerPoint & Google Slides
Process
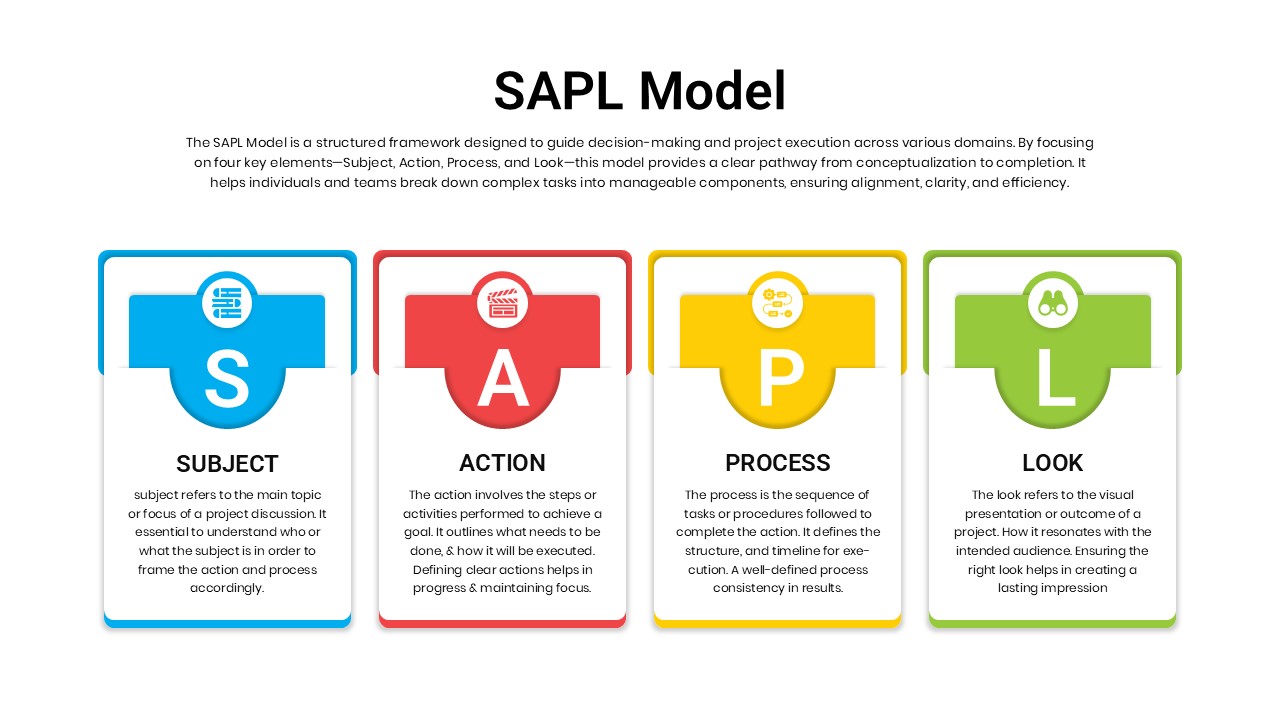
SAPL Model Framework template for PowerPoint & Google Slides
Business
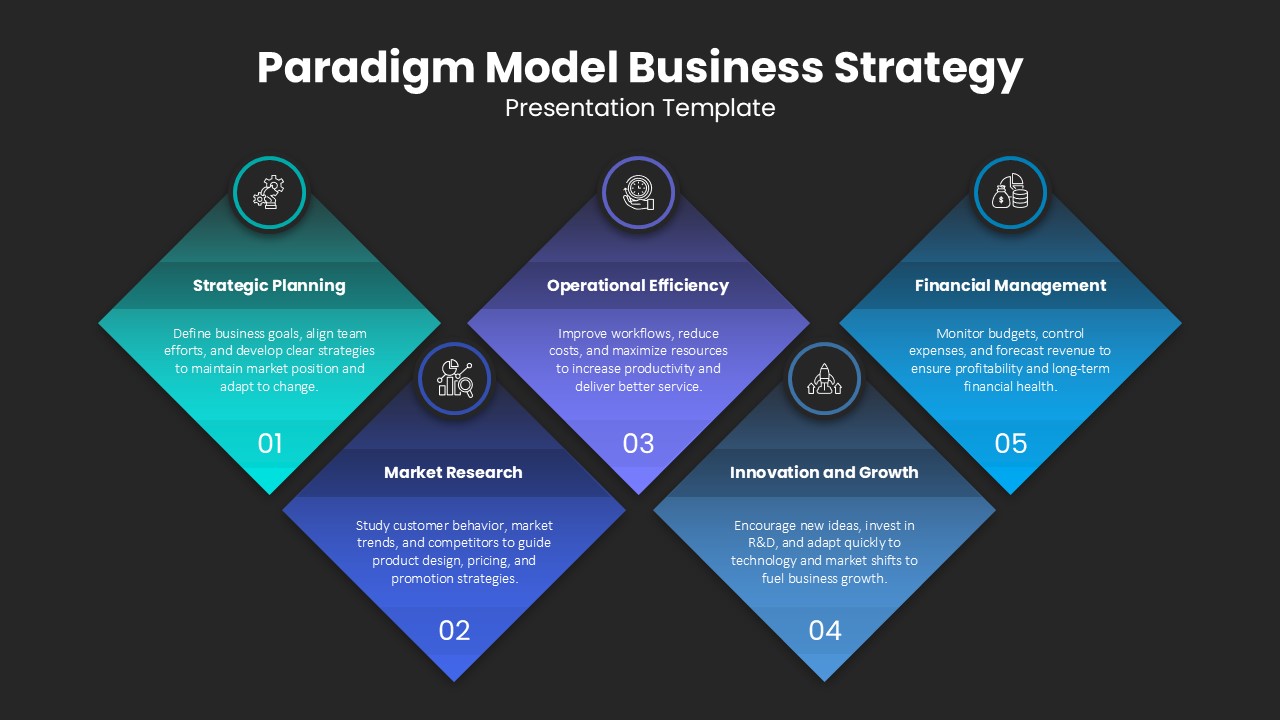
Paradigm Model Business Strategy Template for PowerPoint & Google Slides
Business Strategy
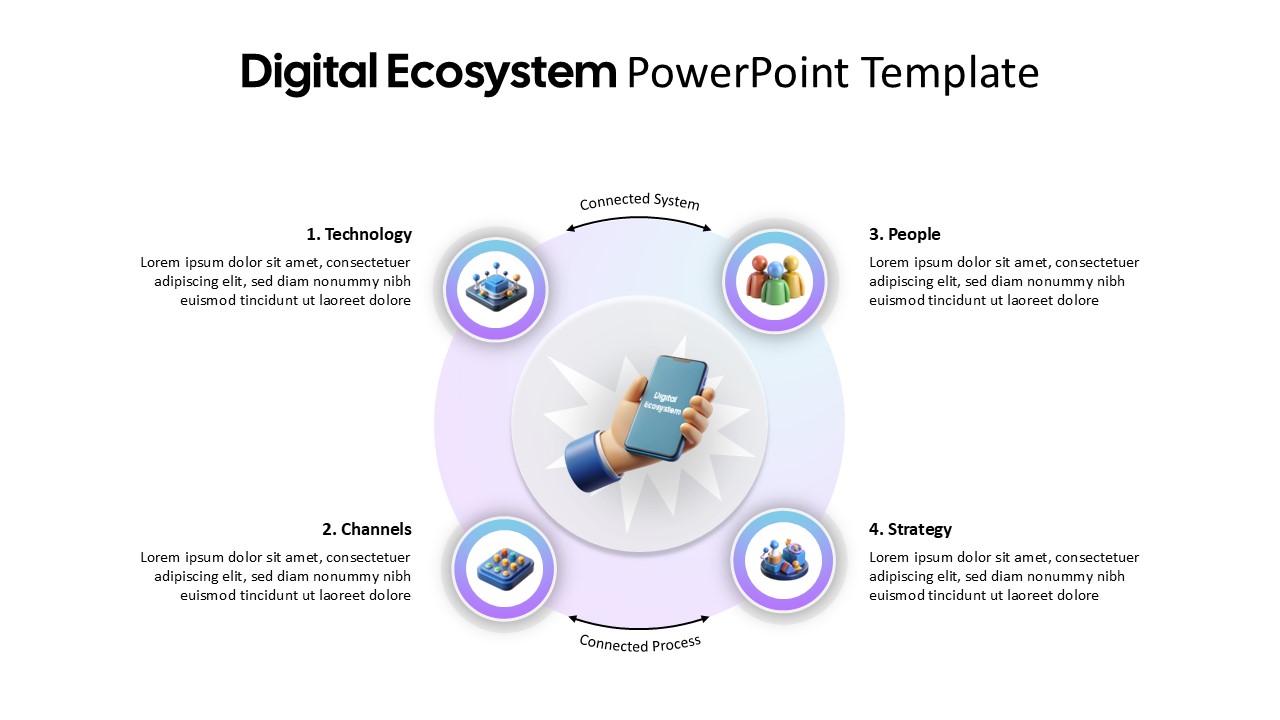
Digital Ecosystem Circular Model Template for PowerPoint & Google Slides
Information Technology
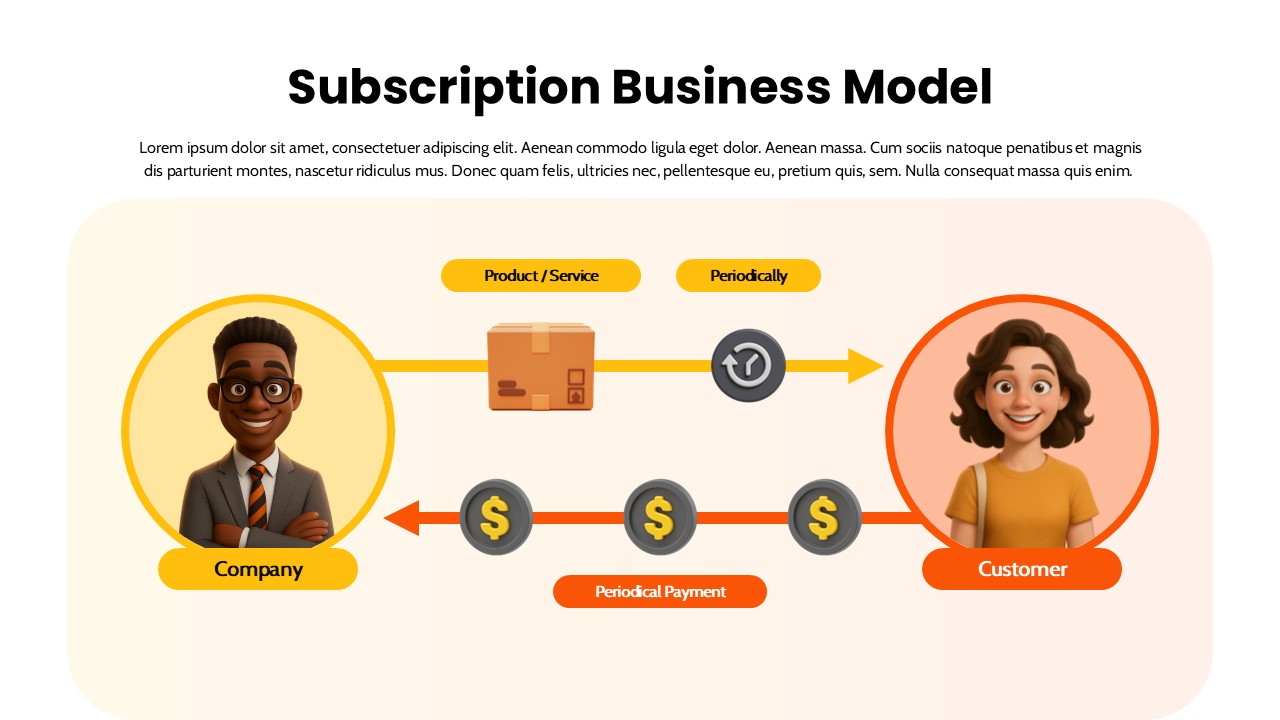
Subscription Business Model Flow Diagram Template for PowerPoint & Google Slides
Business Models
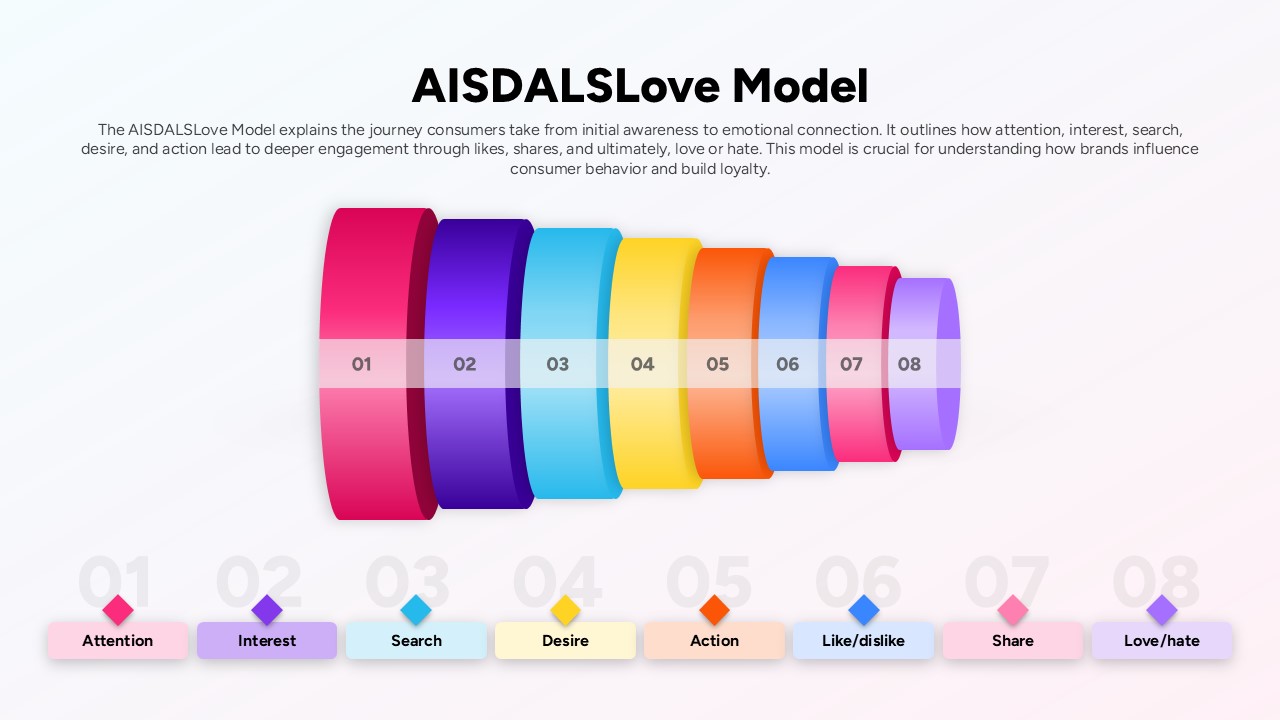
AISDALSLove Consumer Journey Model Slide Template for PowerPoint & Google Slides
Customer Journey
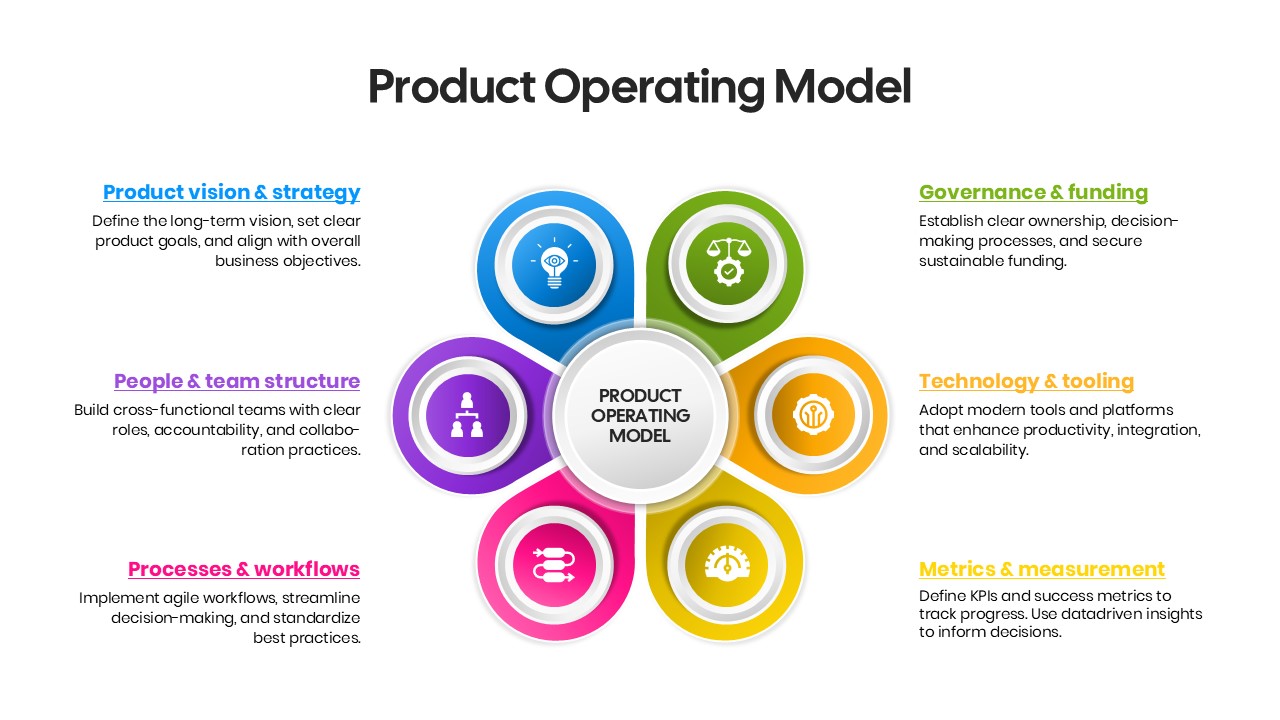
Product Operating Model Framework Template for PowerPoint & Google Slides
Business Strategy
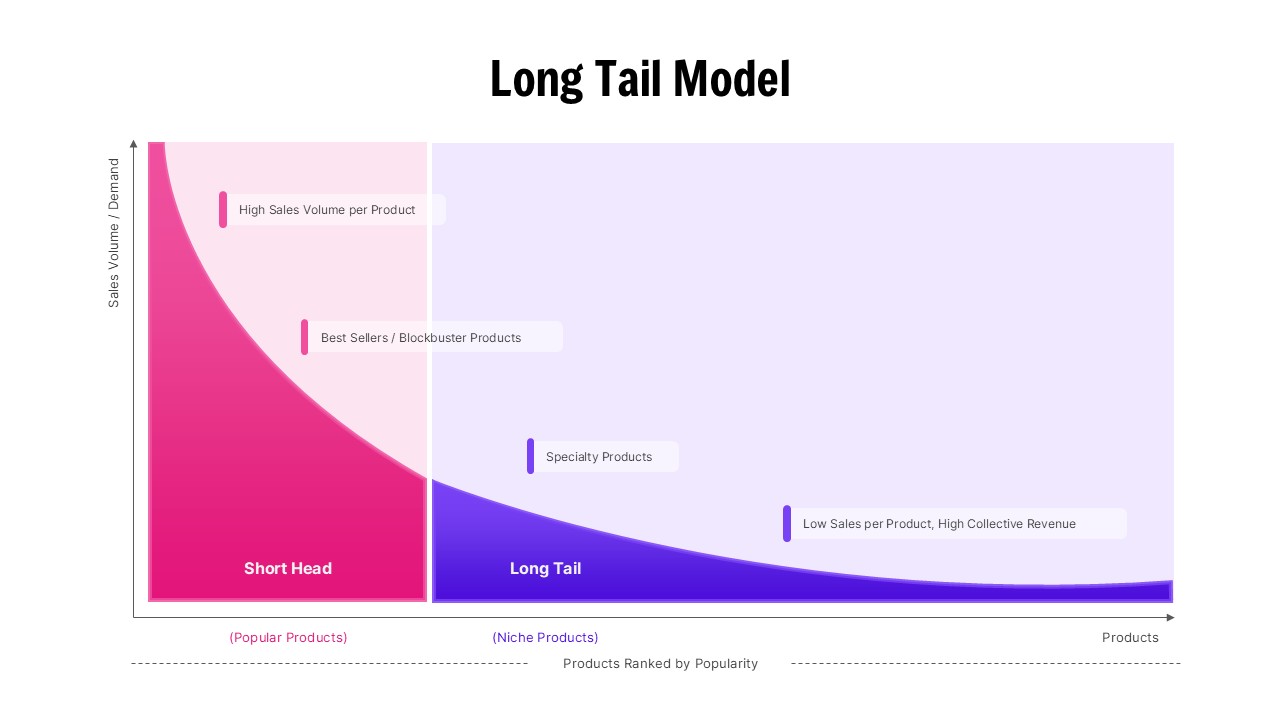
Long Tail Model Business Strategy Diagram Template for PowerPoint & Google Slides
Business