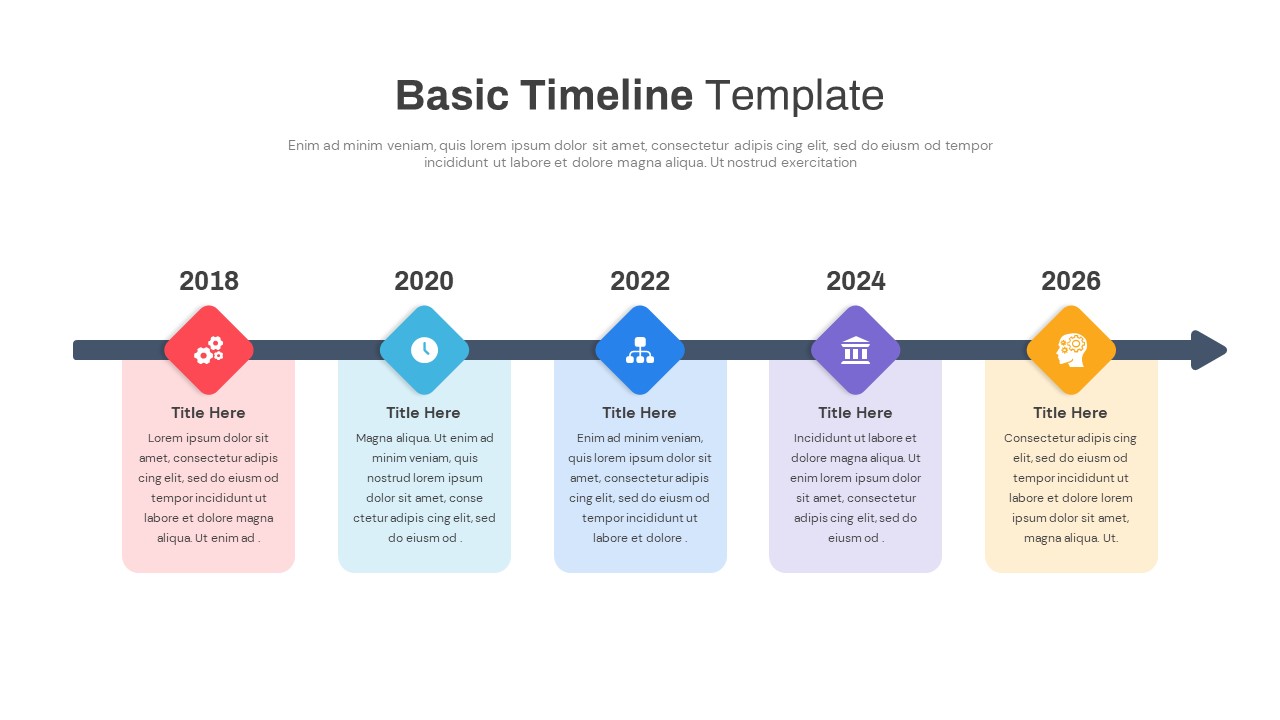
3D Timeline Infographics for PowerPoint & Google Slides
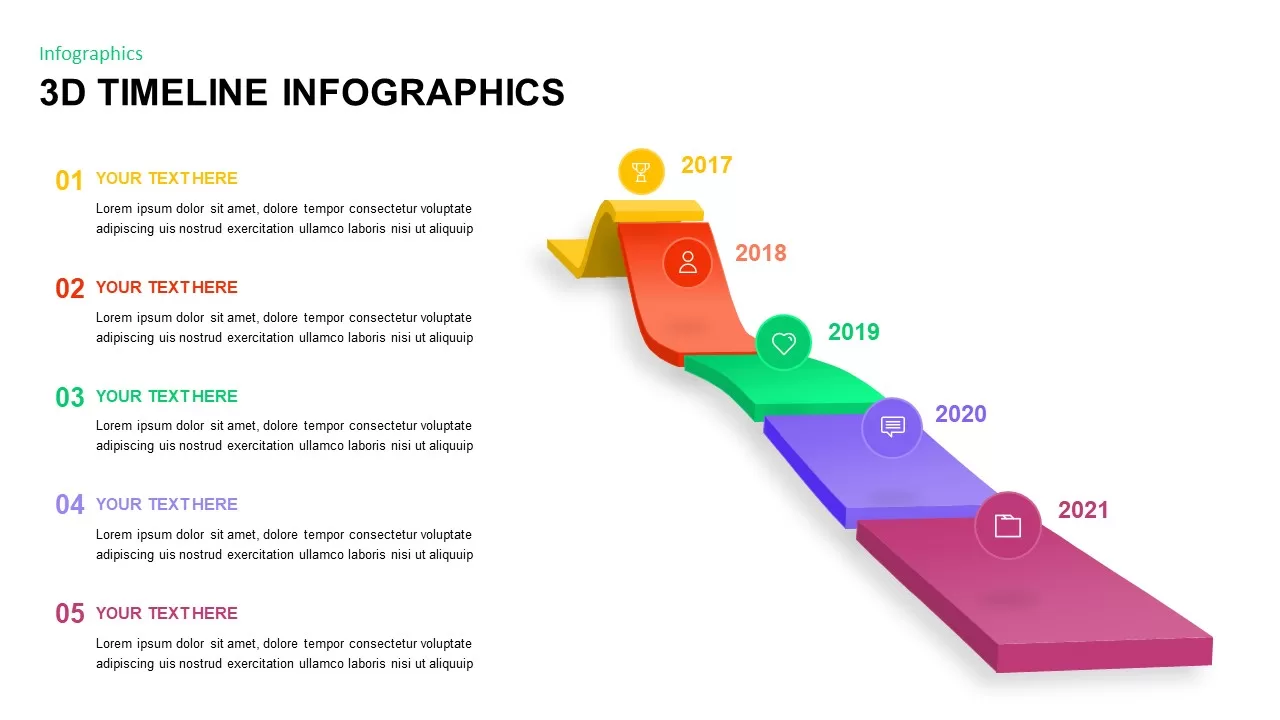
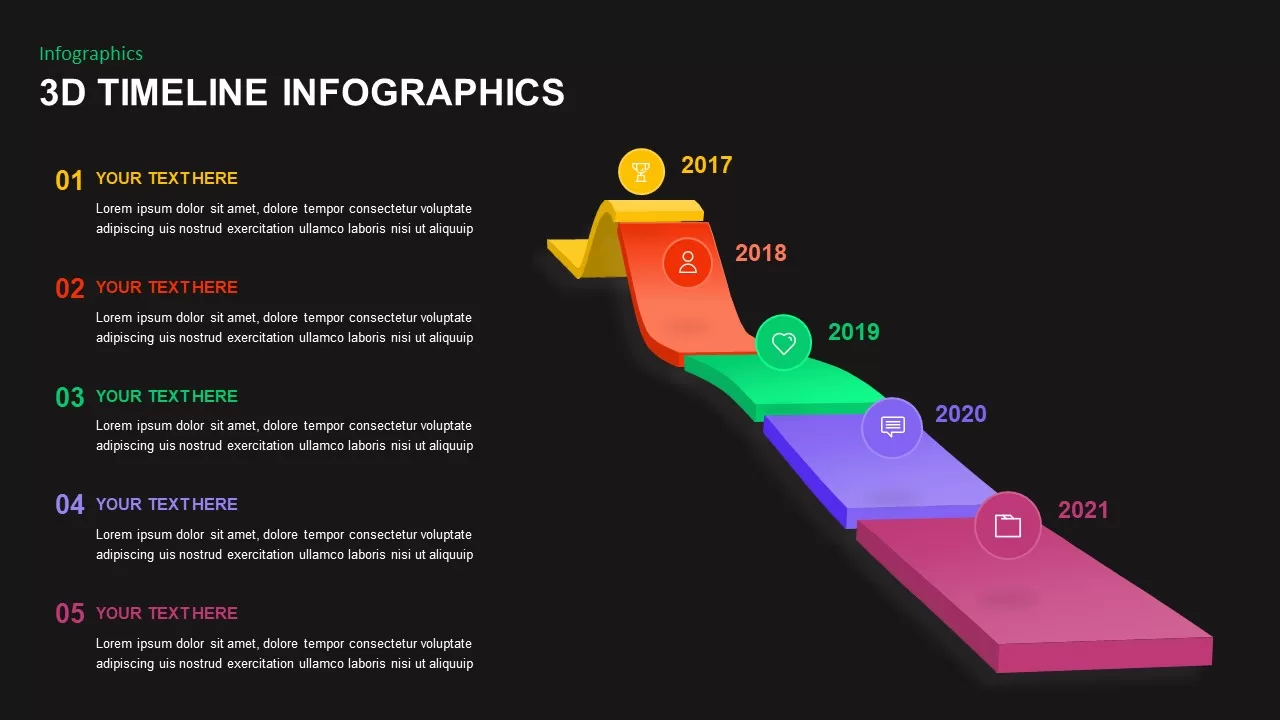
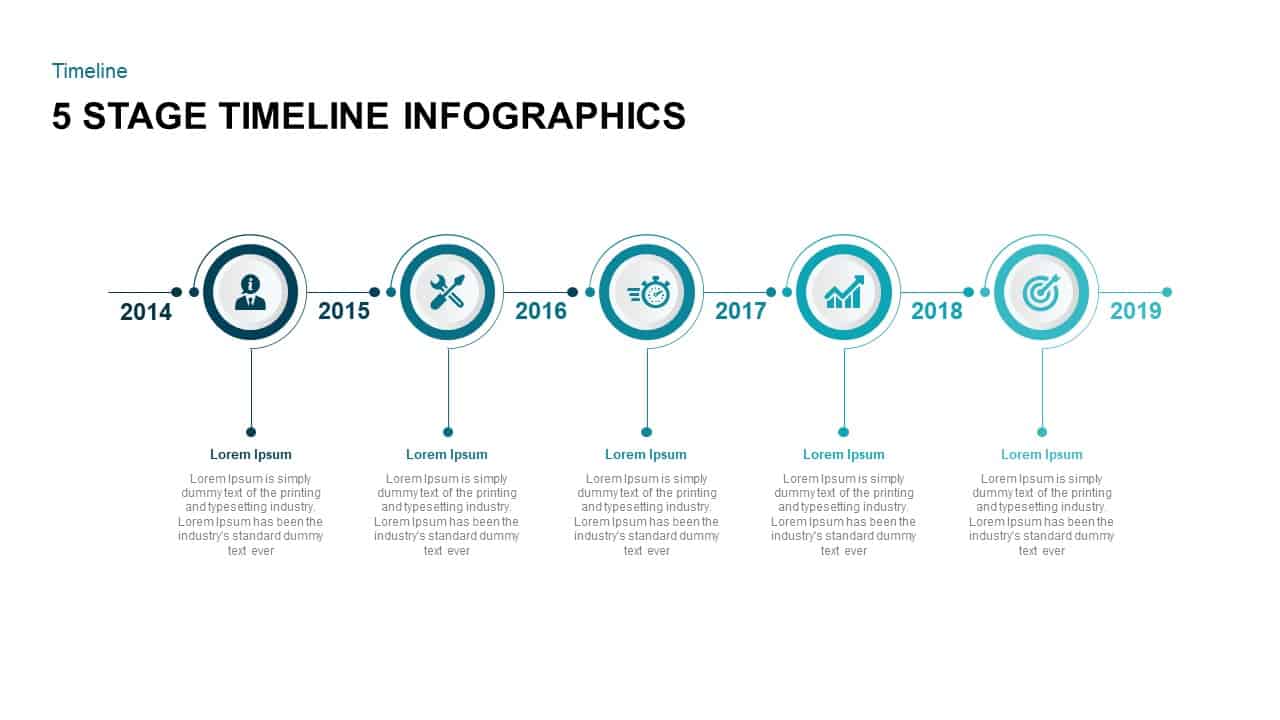
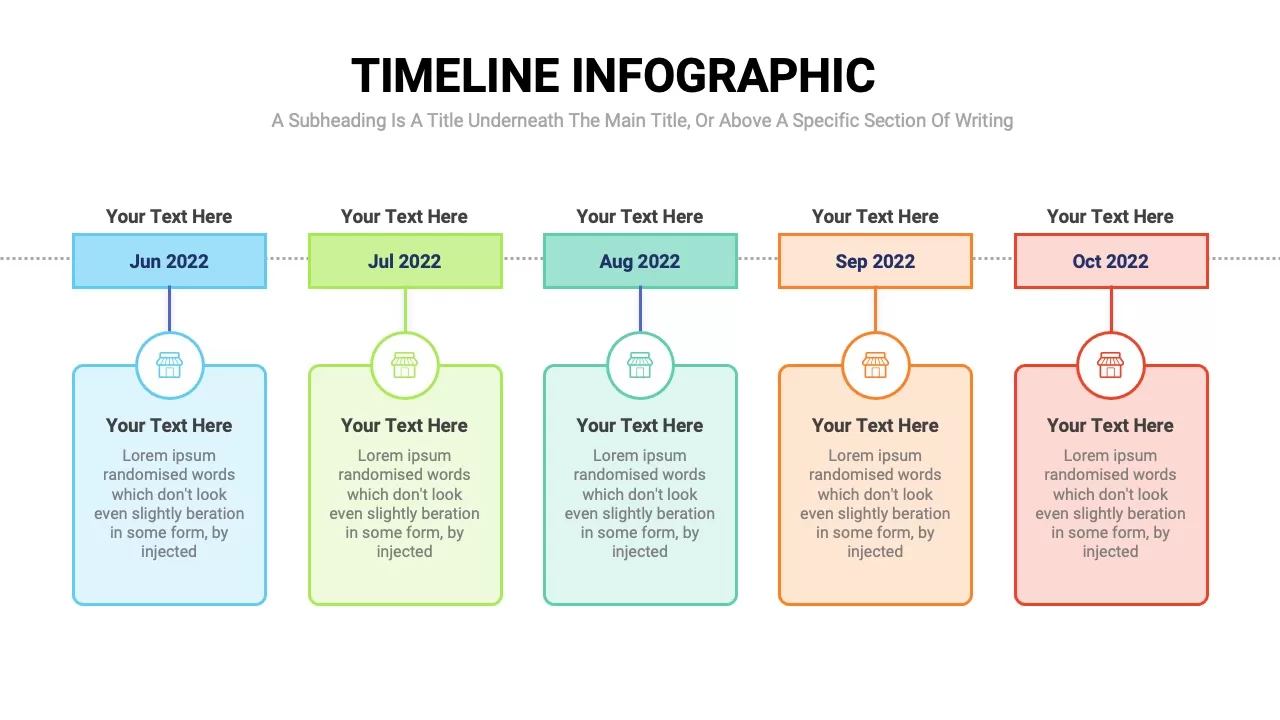
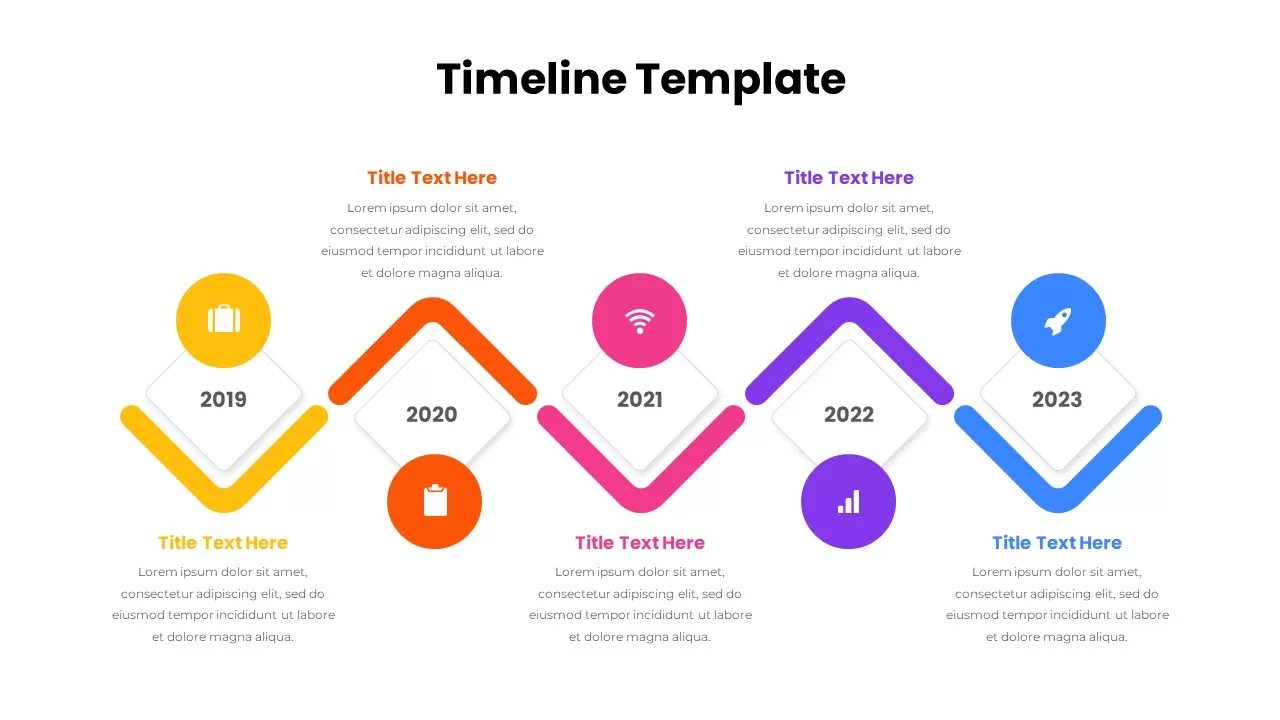
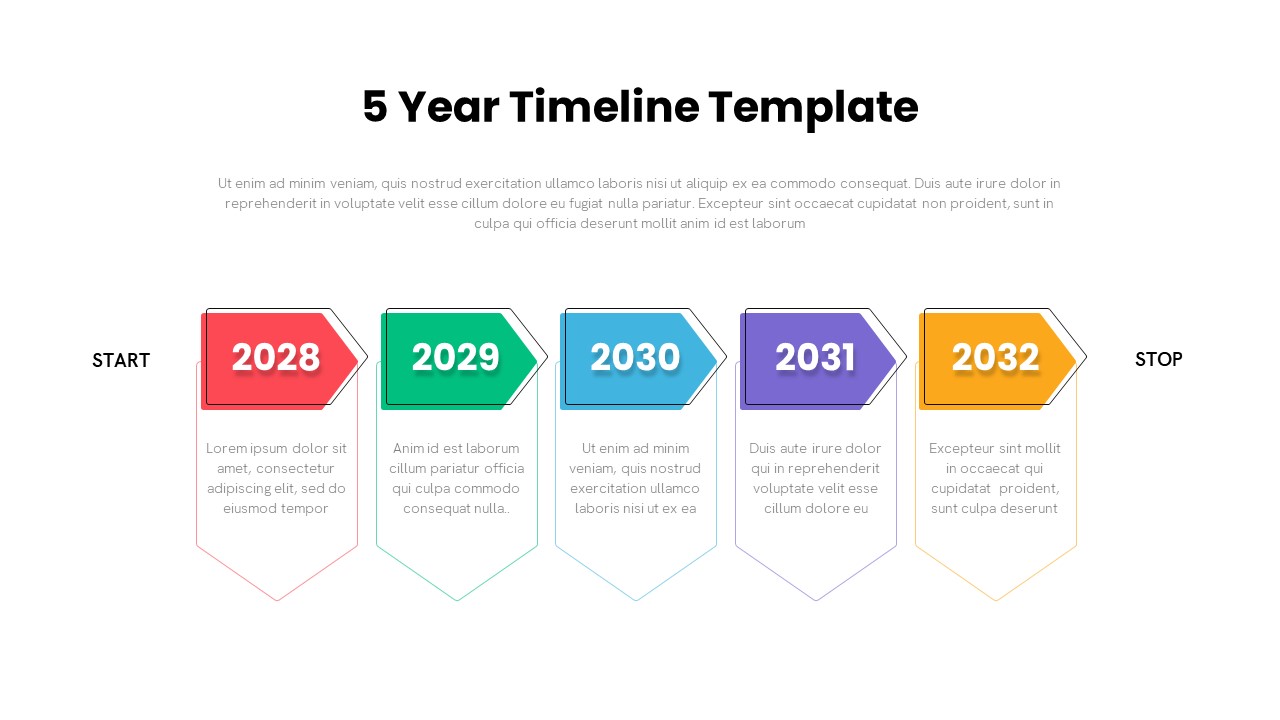
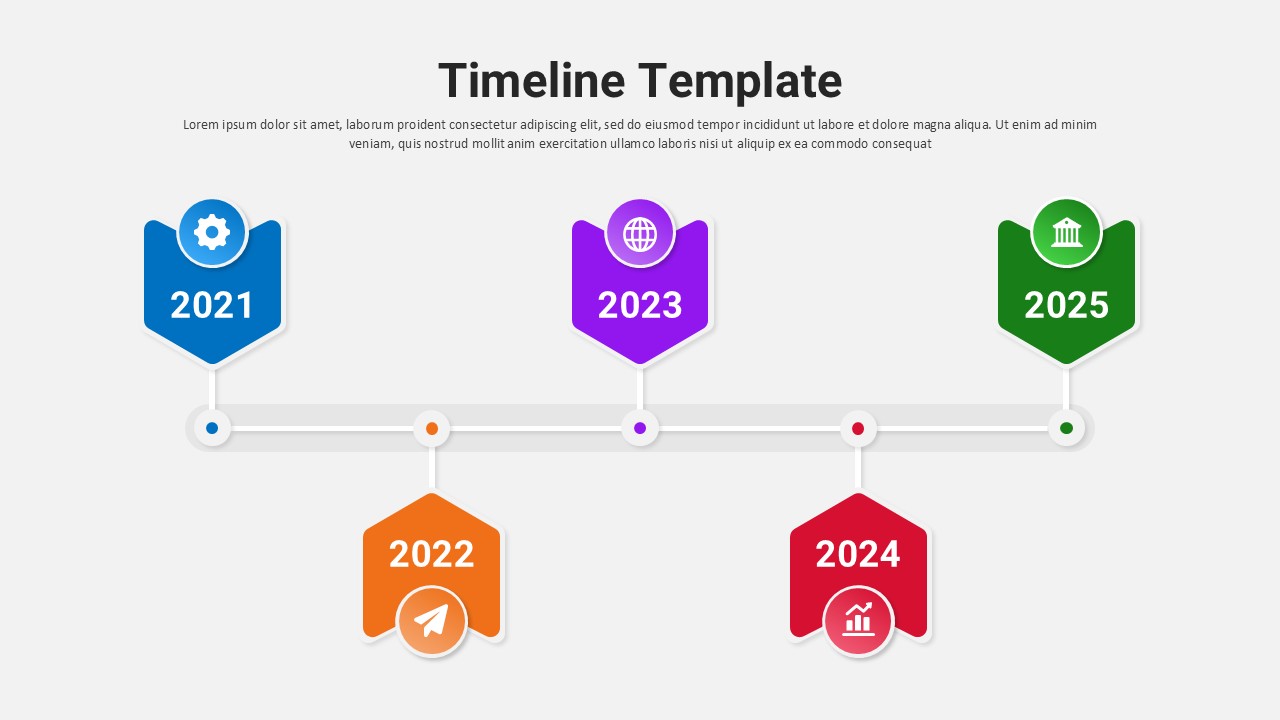
The 3D Timeline Infographics slide presents a visually striking, modern way to showcase sequential events, milestones, or project progress over time. The timeline is segmented into five color-coded steps, each marked with a number and accompanied by a relevant icon to represent the activity or event of that particular year. The colorful gradient, starting with yellow and transitioning through orange, green, purple, and red, creates a dynamic 3D effect that enhances visual appeal while ensuring clarity.
Perfect for illustrating progress, achievements, or historical data, this infographic layout is fully customizable. Add your text and adjust the year markers to fit your presentation needs. Whether you are tracking project milestones, product launches, or key business developments, this slide delivers a professional yet eye-catching design that keeps your audience engaged. Optimized for both PowerPoint and Google Slides, it’s easy to update and adapt for a range of use cases, from team reports to corporate presentations.
Who is it for
This slide is ideal for project managers, business analysts, and marketing teams who need to present a timeline of events, progress updates, or milestones. It is also suitable for educators, consultants, and team leaders looking for a visually compelling way to communicate sequential information.
Other Uses
Besides project and progress tracking, this infographic can be used for illustrating company growth, the history of a product, or showing key events in a timeline format. It’s also applicable for strategic planning, showing customer journeys, or as a road map for future goals.
Login to download this file

Item ID
SB02063
Related Templates

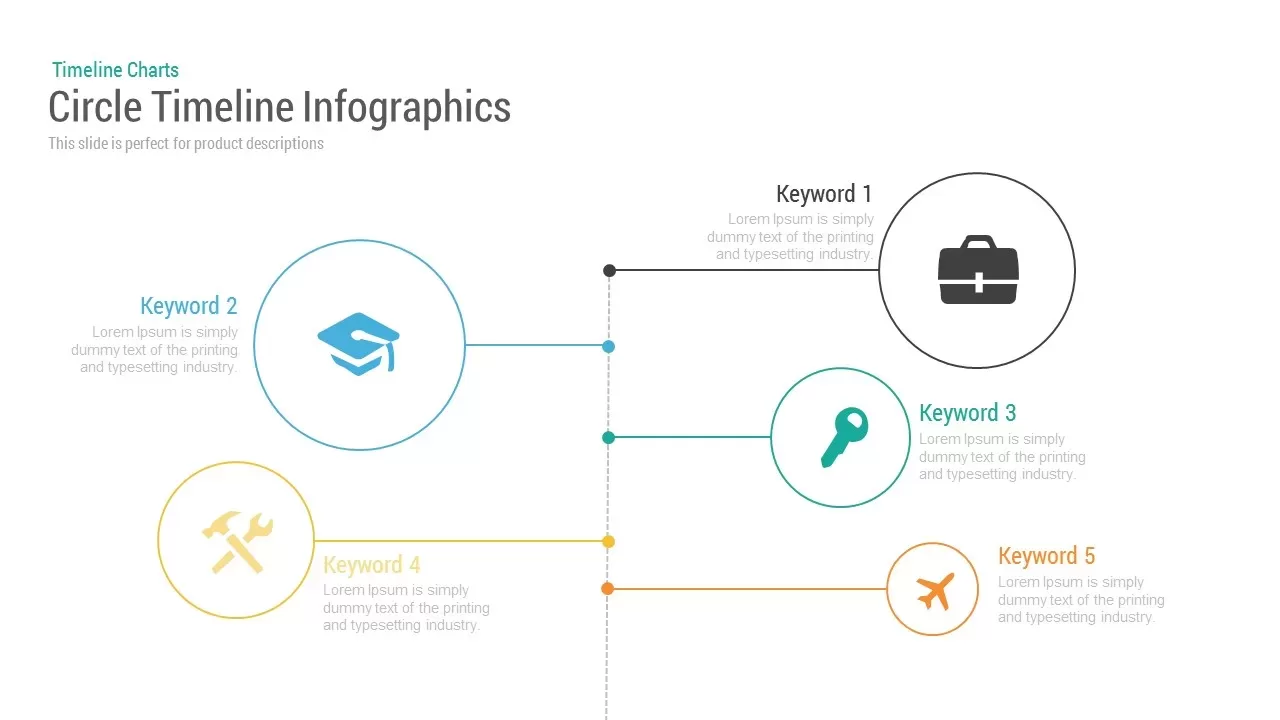
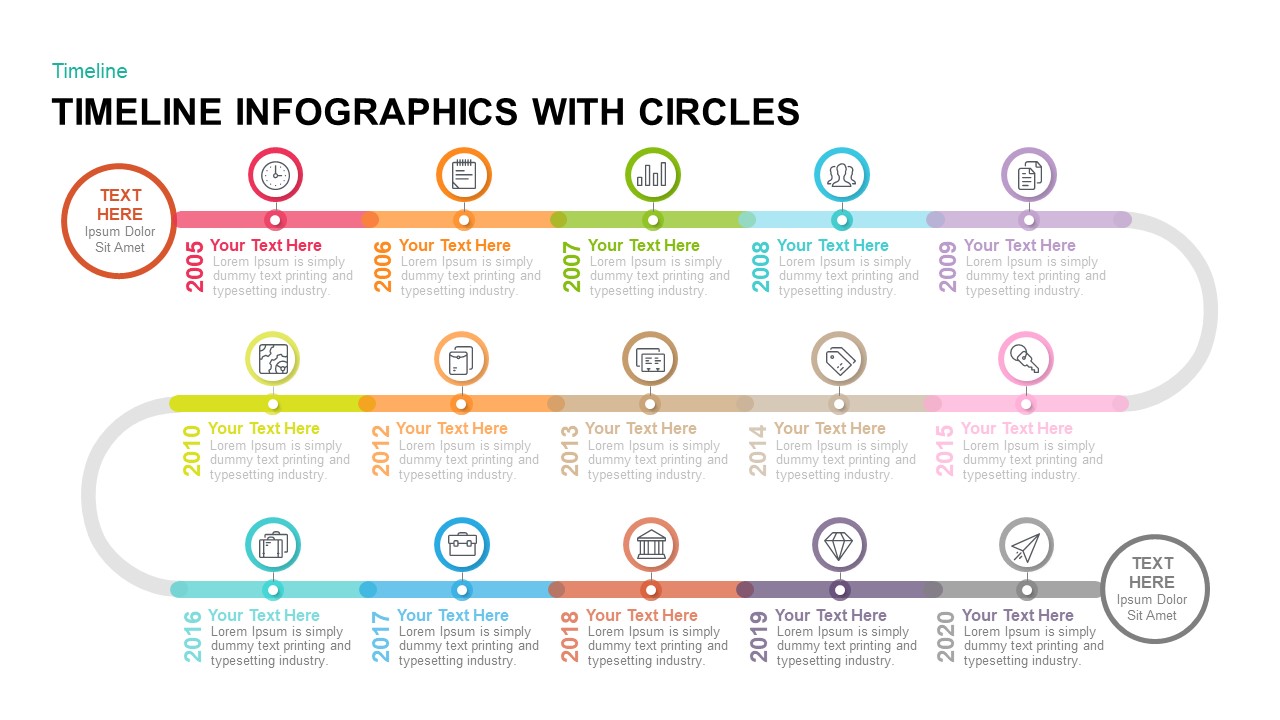
Circle Timeline Infographics template for PowerPoint & Google Slides
Timeline

Dynamic Circle Timeline Infographics template for PowerPoint & Google Slides
Timeline
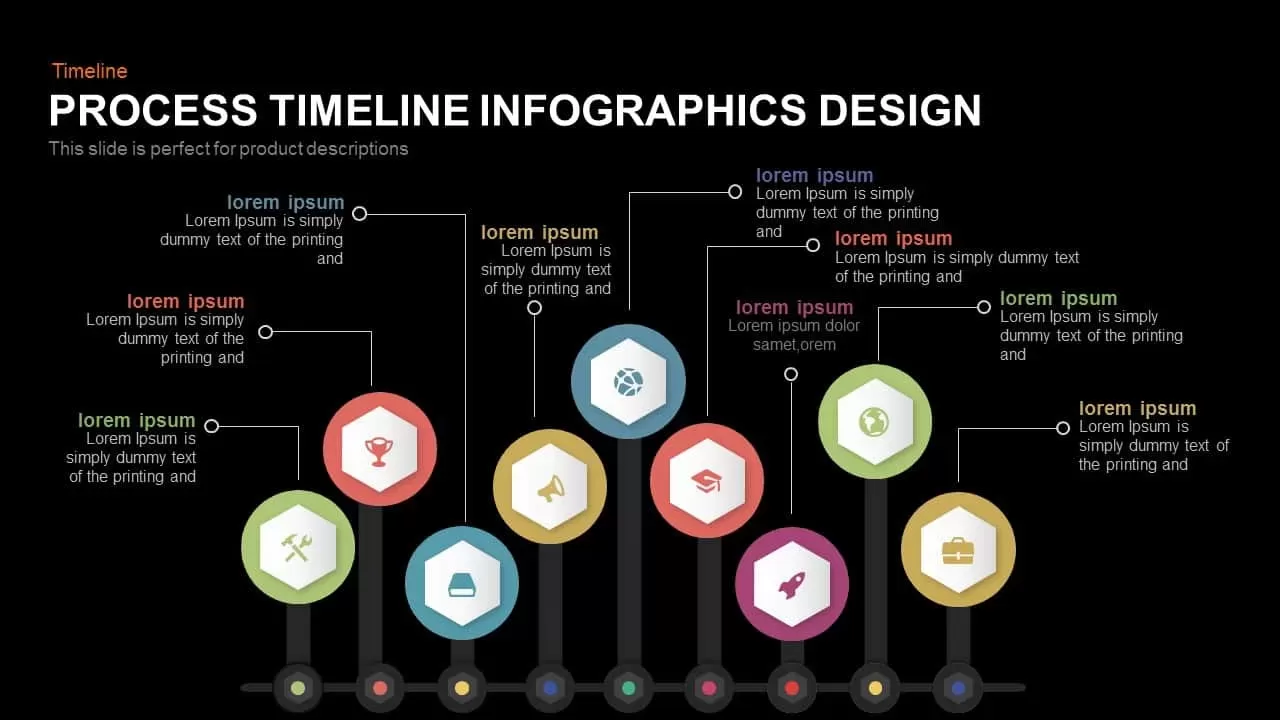
Process Timeline Infographics Design template for PowerPoint & Google Slides
Timeline
Multi-Stage Timeline Infographics Template for PowerPoint & Google Slides
Timeline
Five-Stage Arrow Infographics Timeline Template for PowerPoint & Google Slides
Arrow
Timeline Arrow Infographics Diagram Template for PowerPoint & Google Slides
Timeline
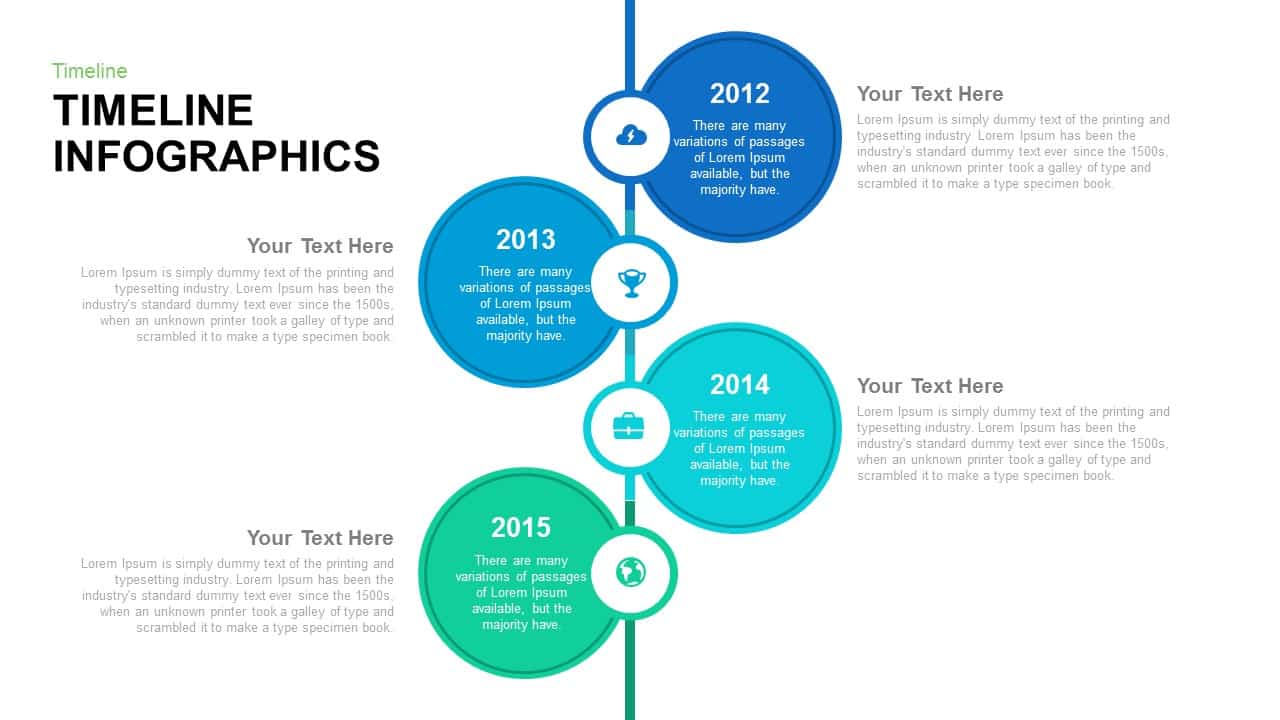
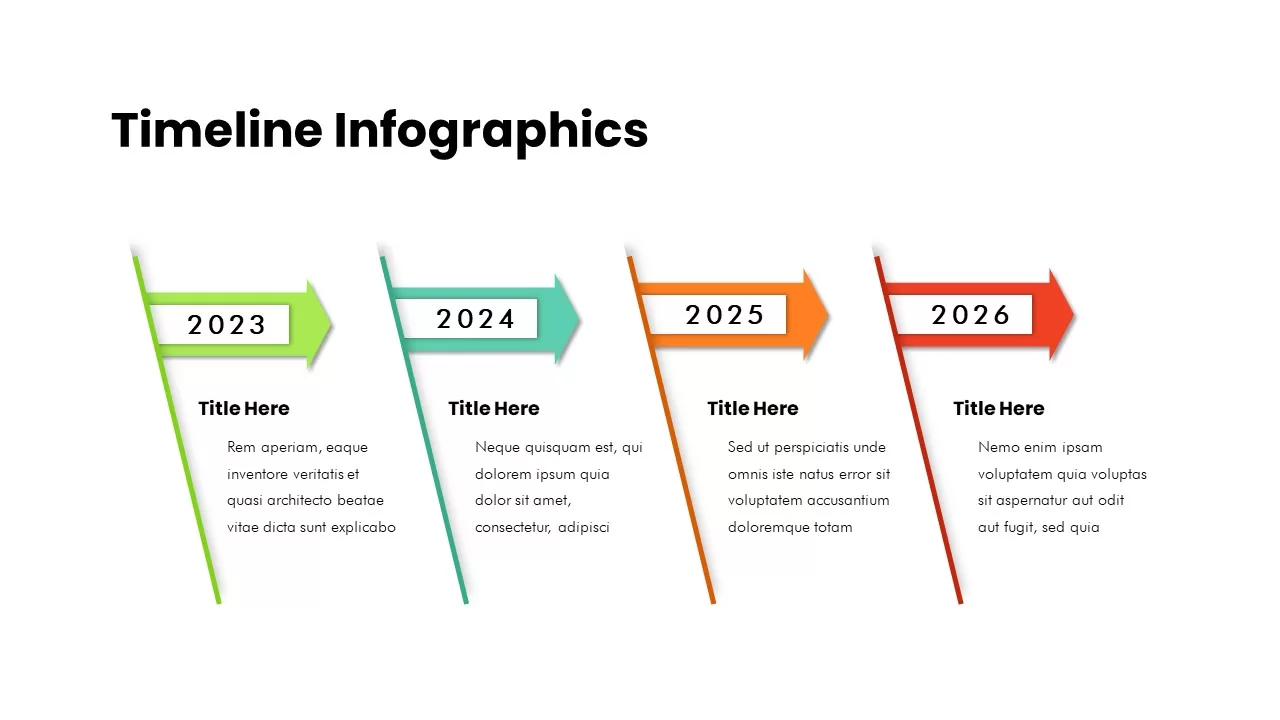
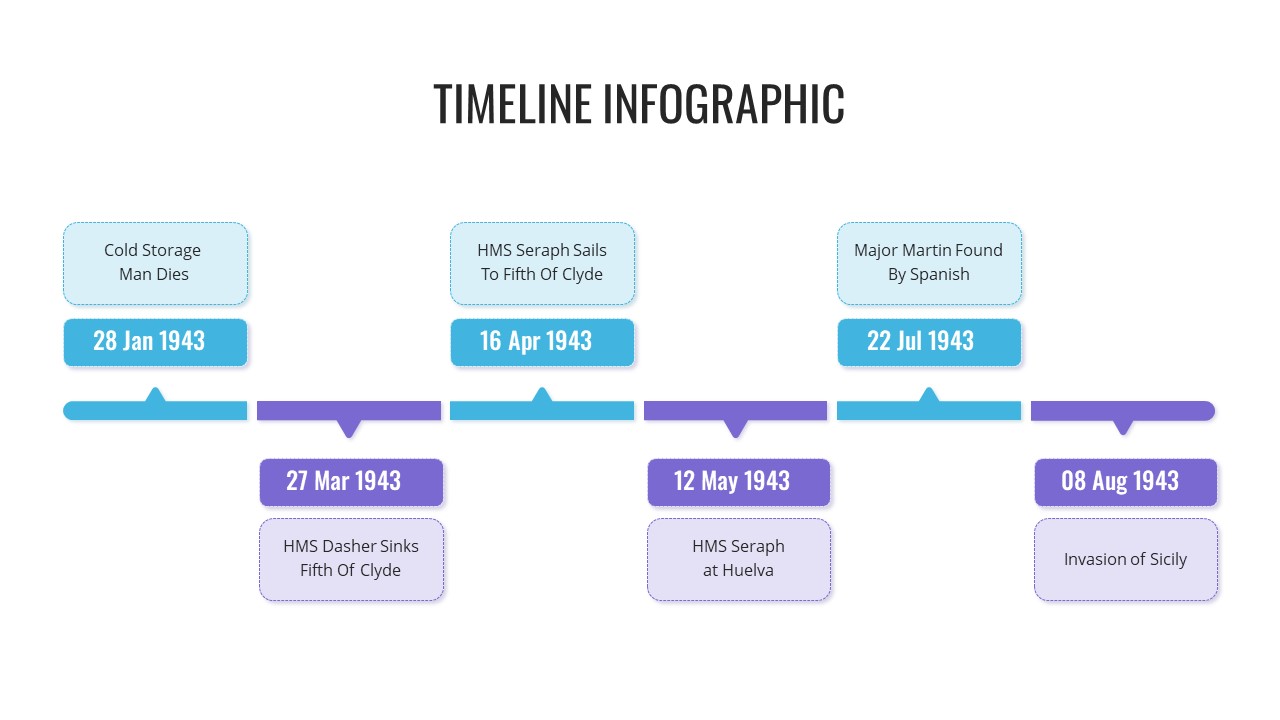
Timeline Infographics for PowerPoint & Google Slides
Timeline
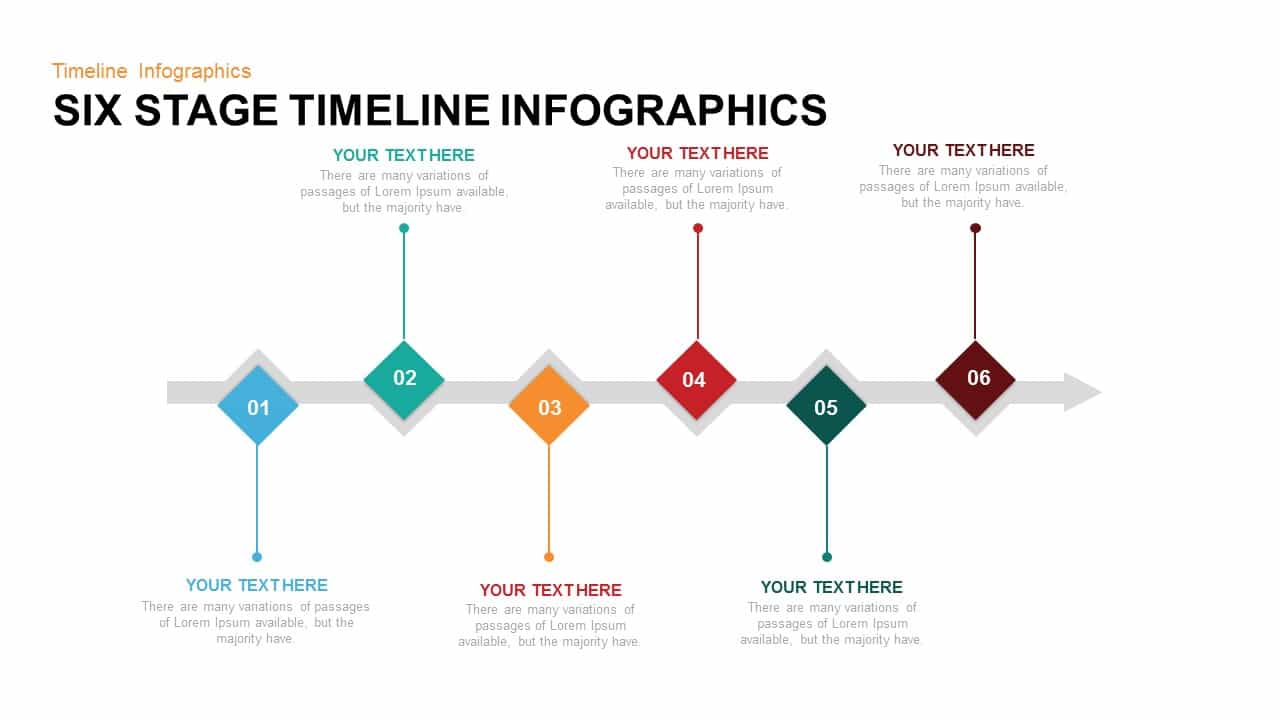
Six Stage Timeline Infographics Template for PowerPoint & Google Slides
Timeline

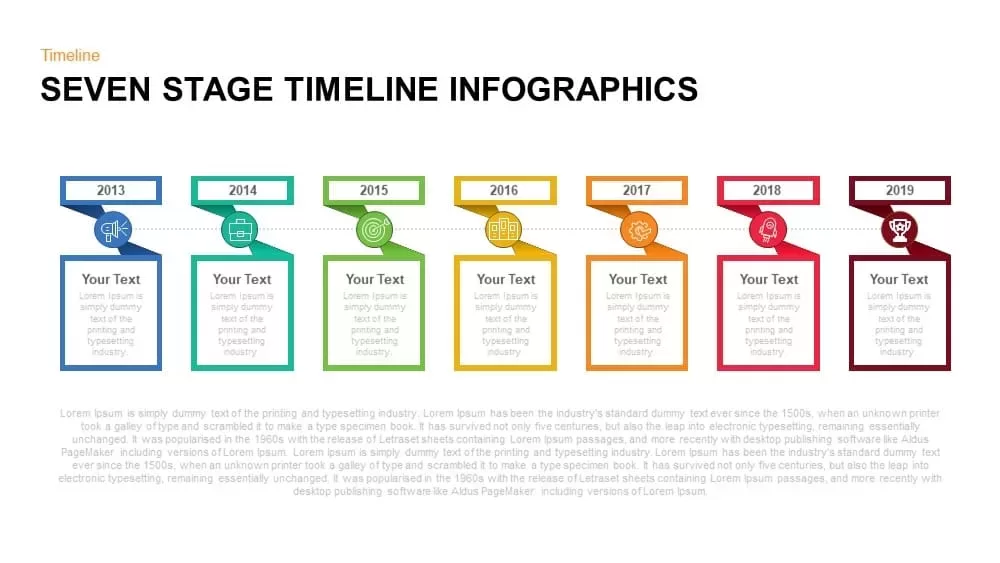
Seven-Stage Timeline Infographics Template for PowerPoint & Google Slides
Timeline
Circular Timeline Infographics Template for PowerPoint & Google Slides
Timeline
Wavy Ribbon Timeline Infographics Template for PowerPoint & Google Slides
Timeline
Six-Stage Timeline Infographics Slide Template for PowerPoint & Google Slides
Timeline
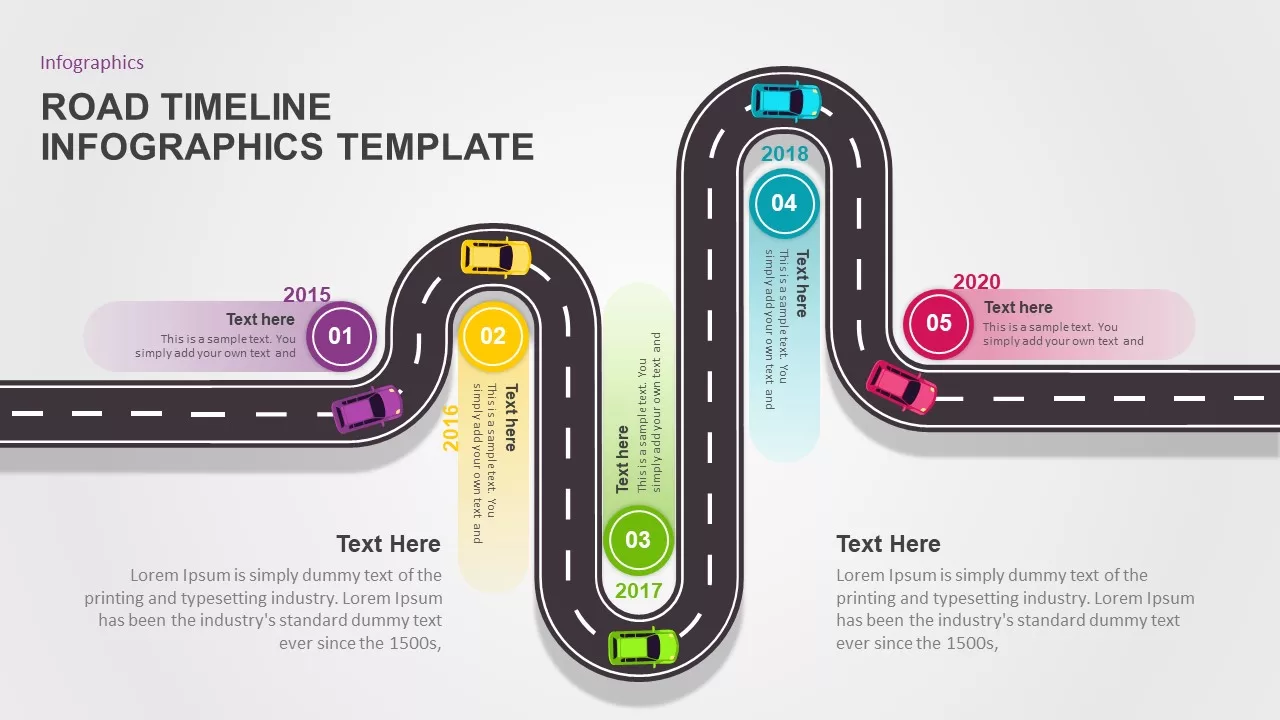
Road Timeline Infographics Template for PowerPoint & Google Slides
Timeline
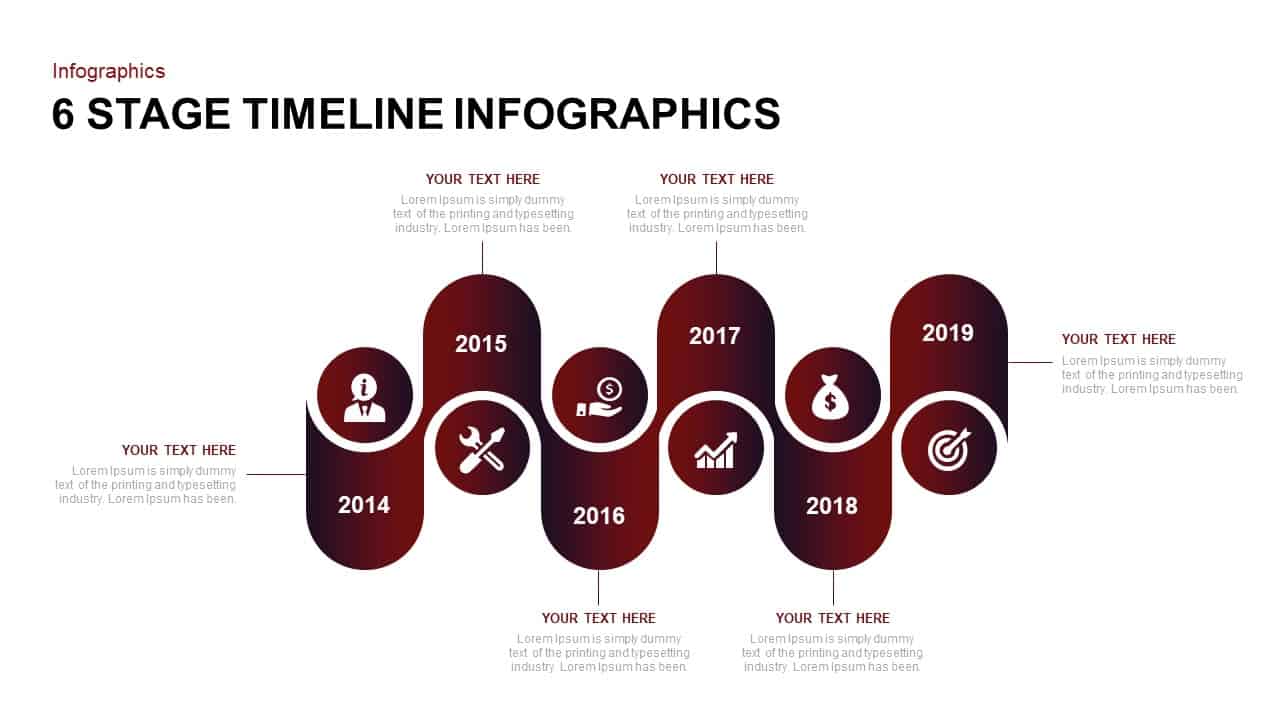
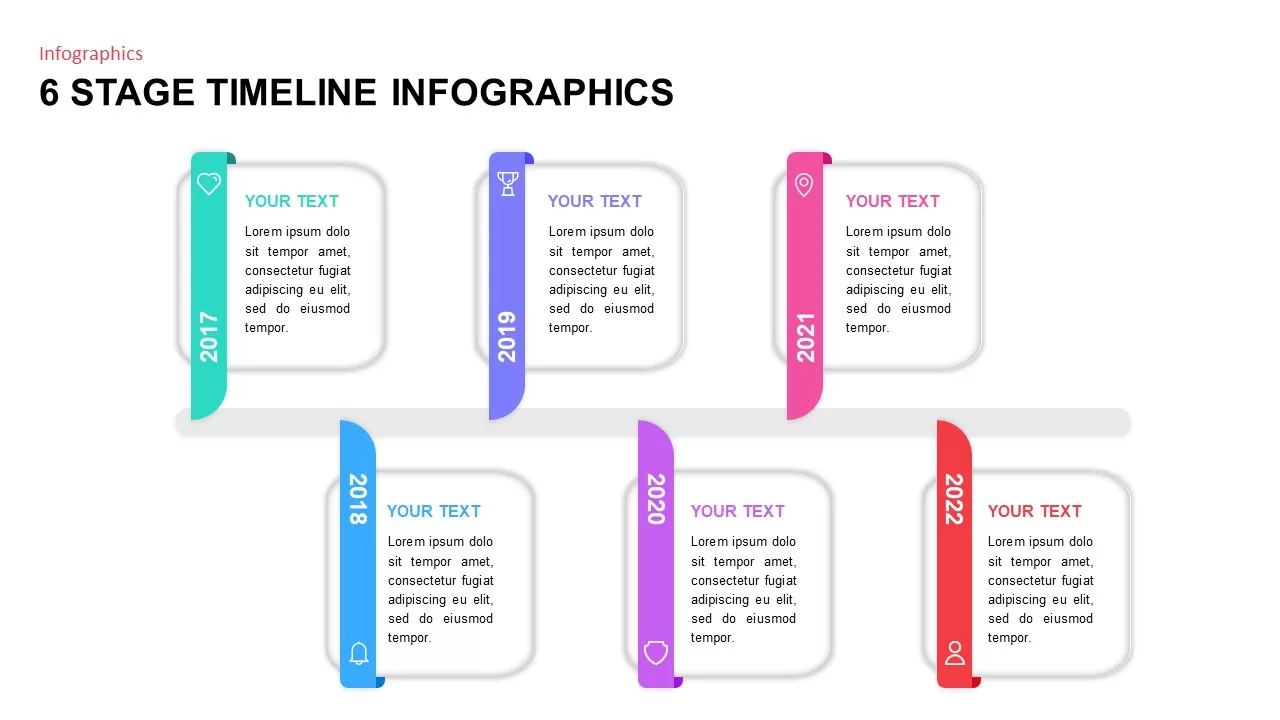
6 Stage Timeline Infographics template for PowerPoint & Google Slides
Timeline
Animated Timeline Infographics template for PowerPoint & Google Slides
Timeline
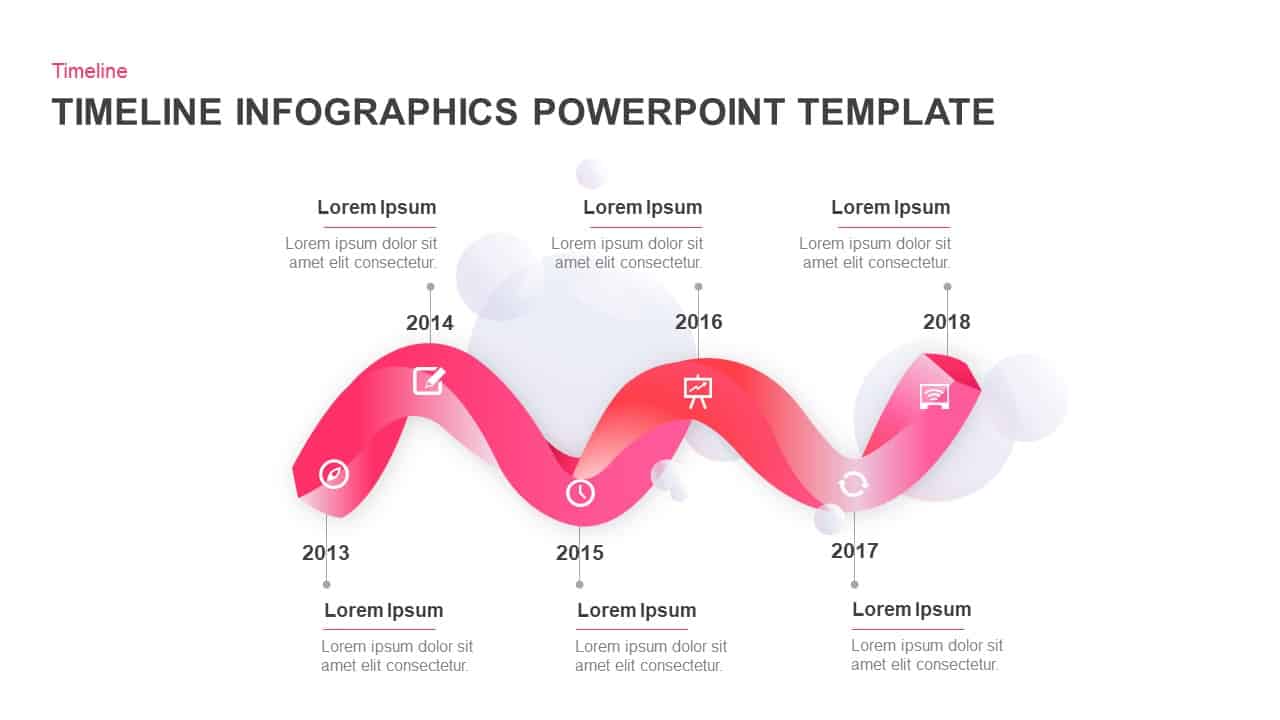
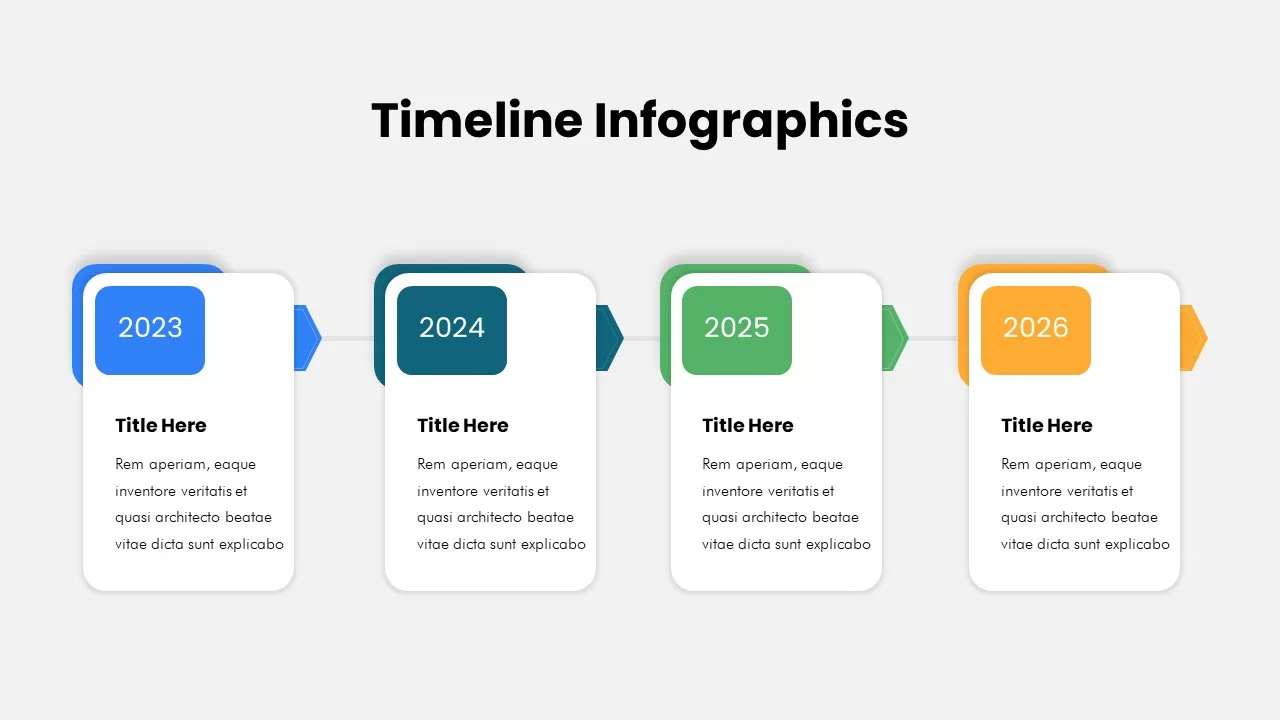
Timeline Infographics template for PowerPoint & Google Slides
Timeline
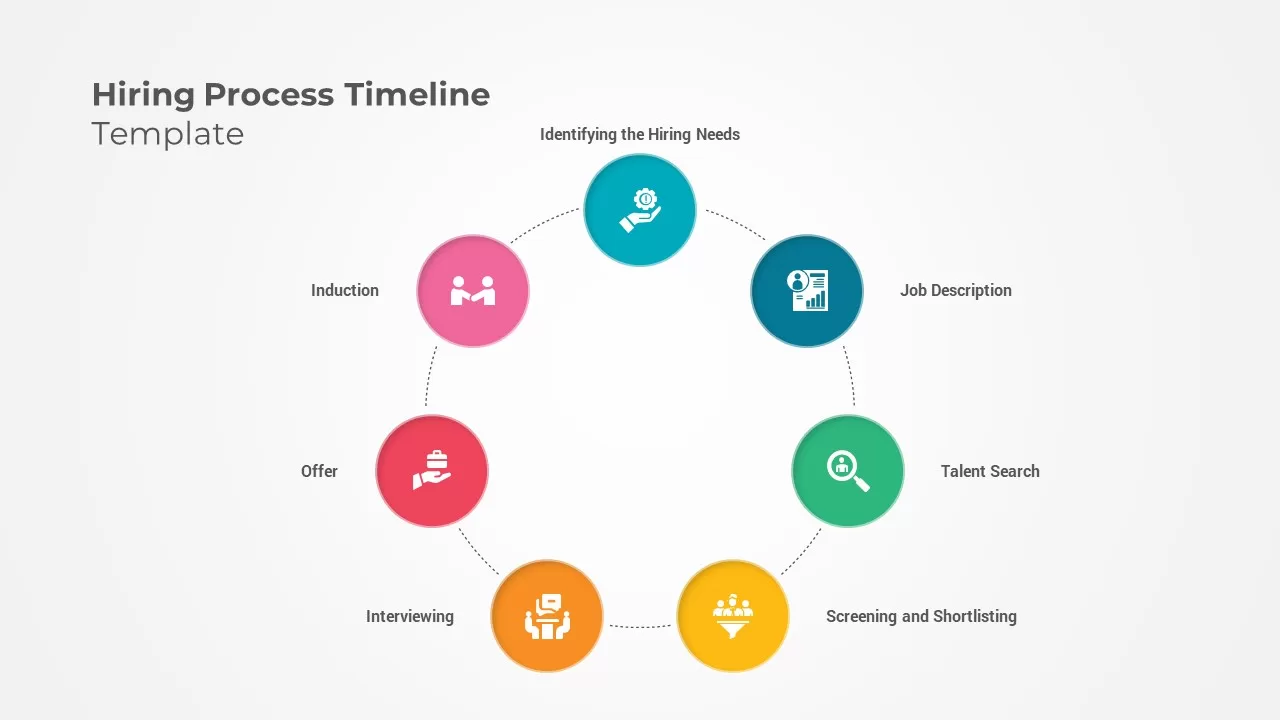
Hiring Process Timeline Infographics Template for PowerPoint & Google Slides
Recruitment

Free Colorful Timeline Infographics Template for PowerPoint & Google Slides
Timeline
Free
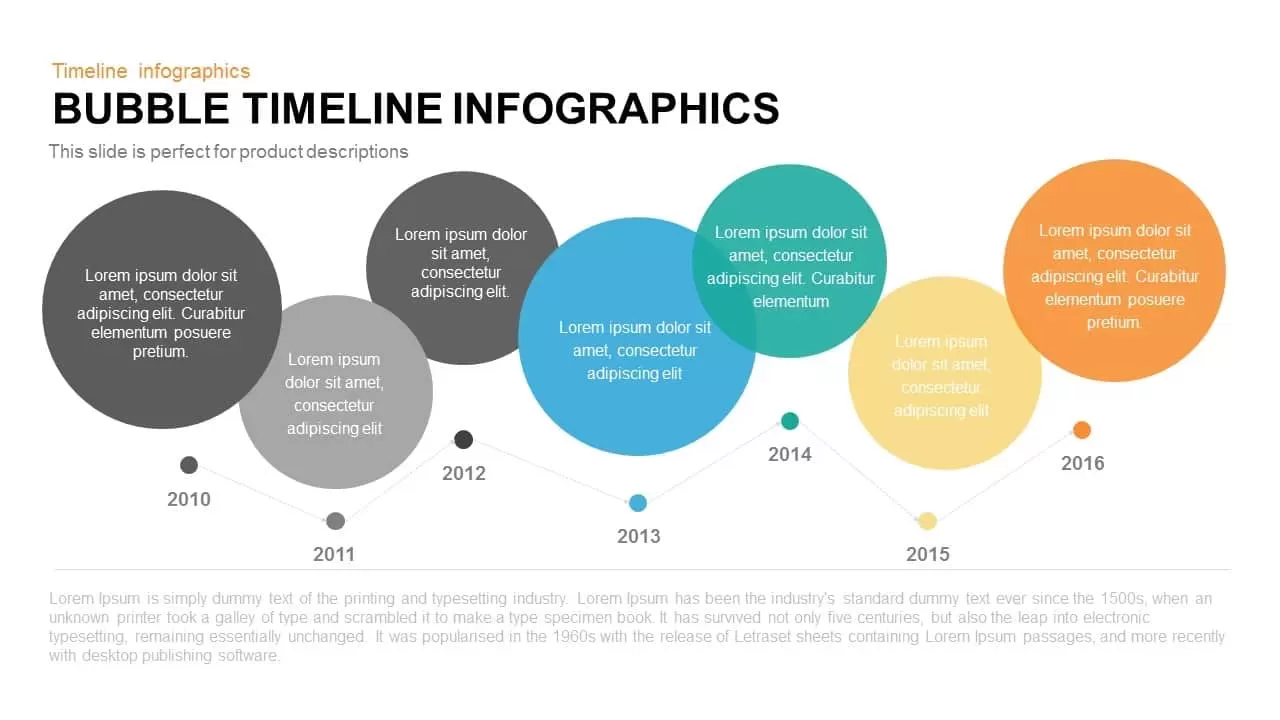
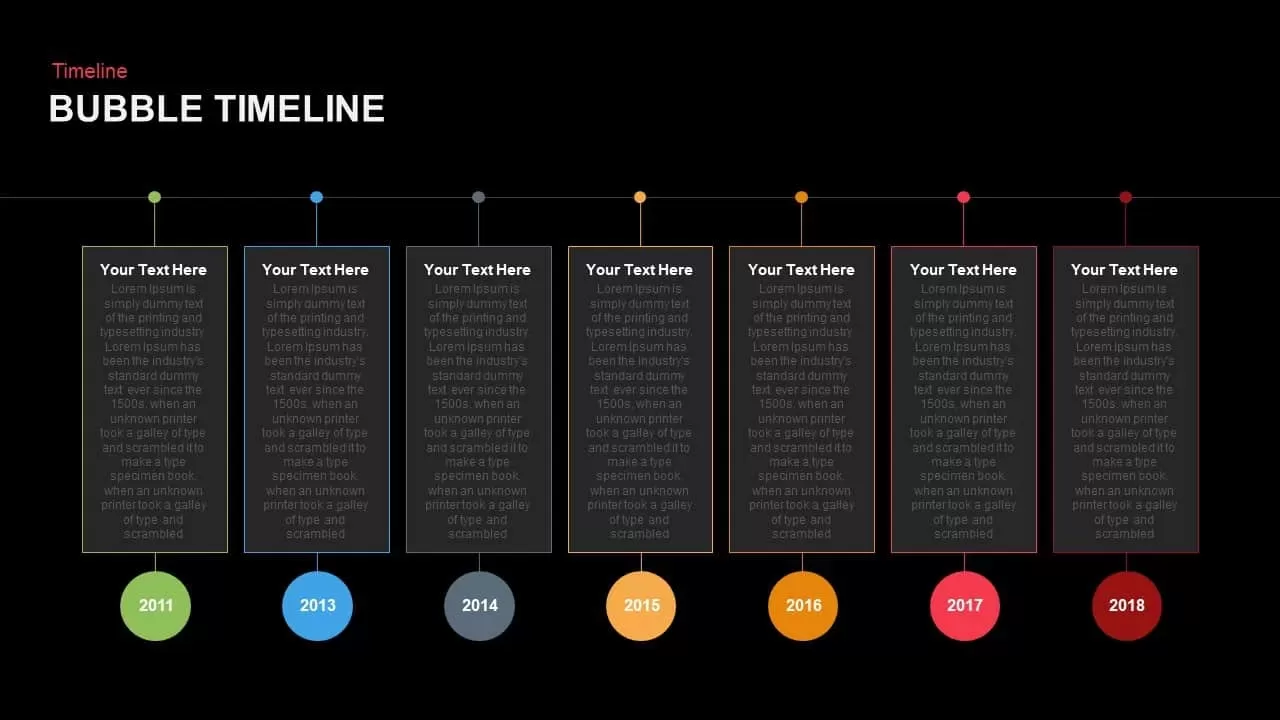
Bubble Timeline Infographics PowerPoint Template and Keynote
Business
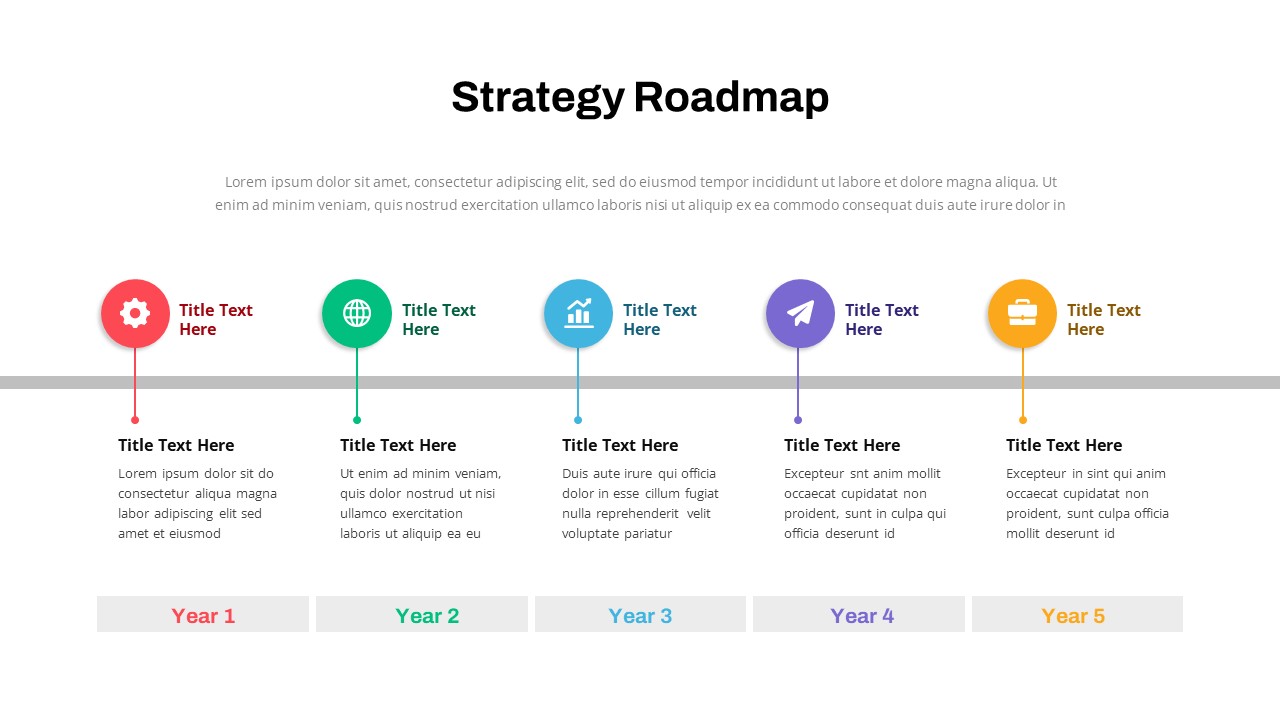
Strategy Roadmap Timeline Slides Template for PowerPoint & Google Slides
Roadmap
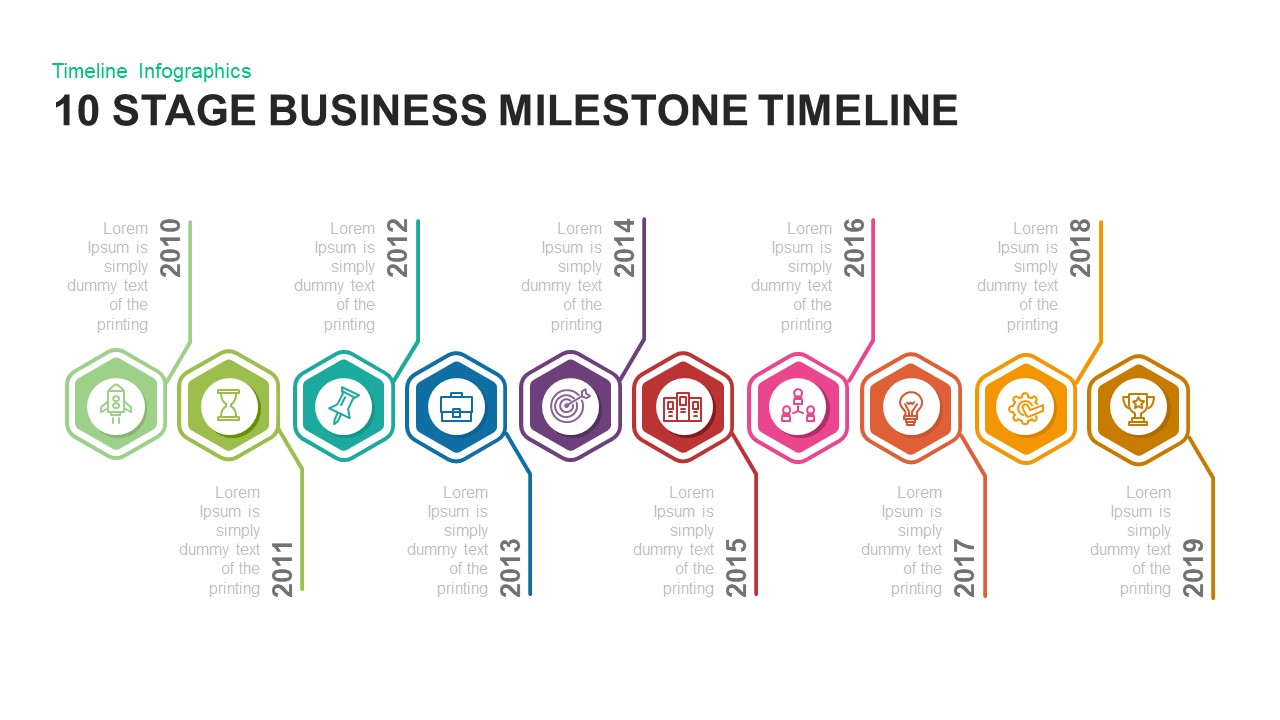
10 Stage Business Milestone Timeline PowerPoint Template for PowerPoint & Google Slides
Timeline
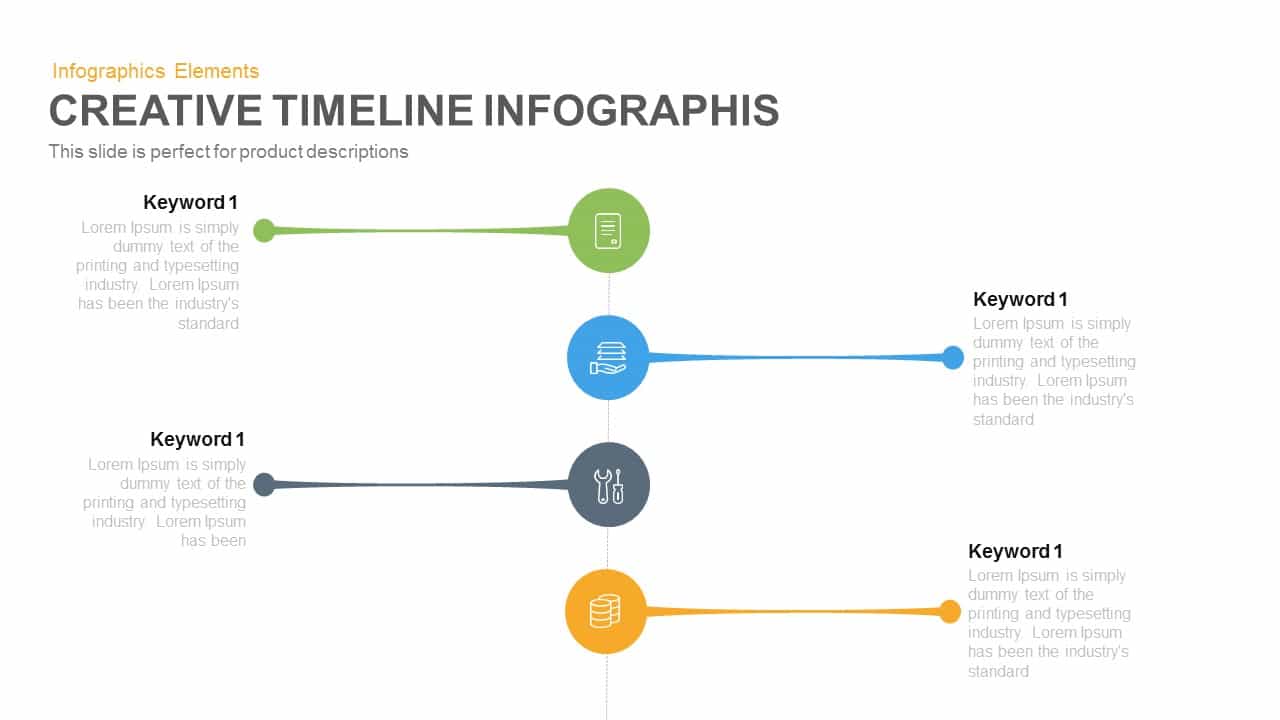
Creative Timeline template for PowerPoint & Google Slides
Timeline
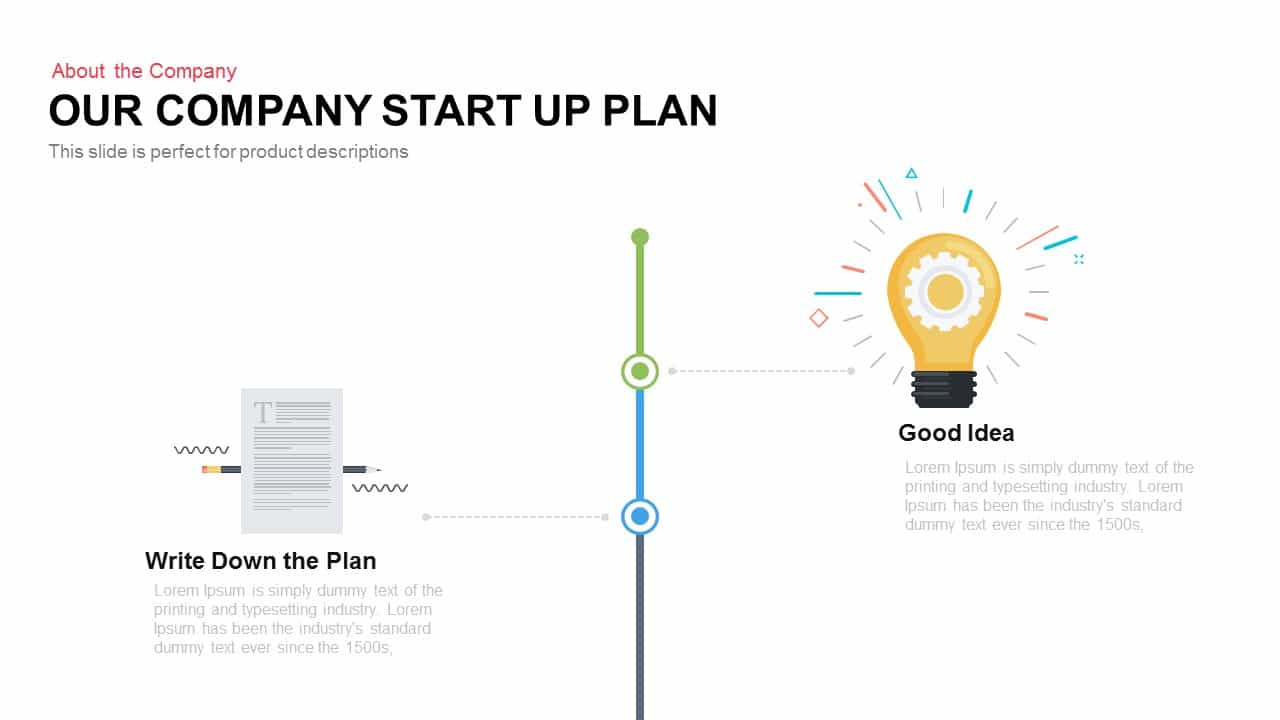
Company Startup Plan Timeline Slide Template for PowerPoint & Google Slides
Timeline
7-Stage Colorful Timeline Infographic Template for PowerPoint & Google Slides
Timeline
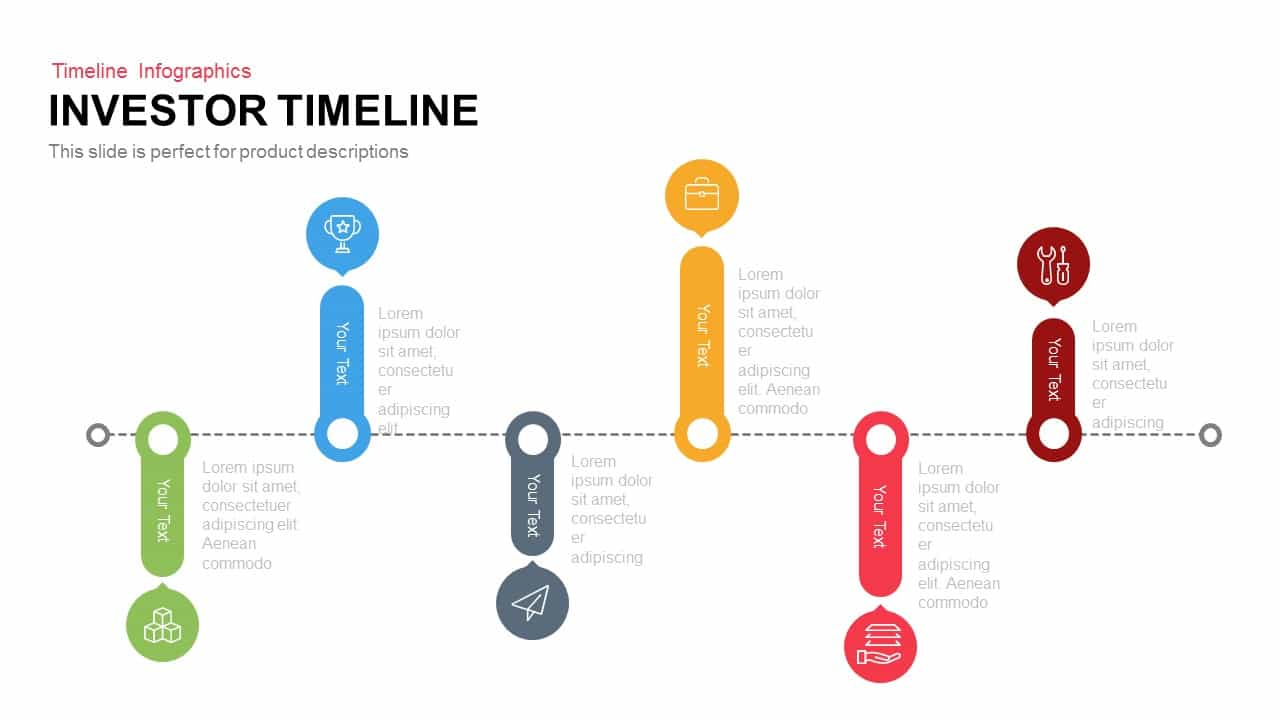
Investor Timeline template for PowerPoint & Google Slides
Timeline
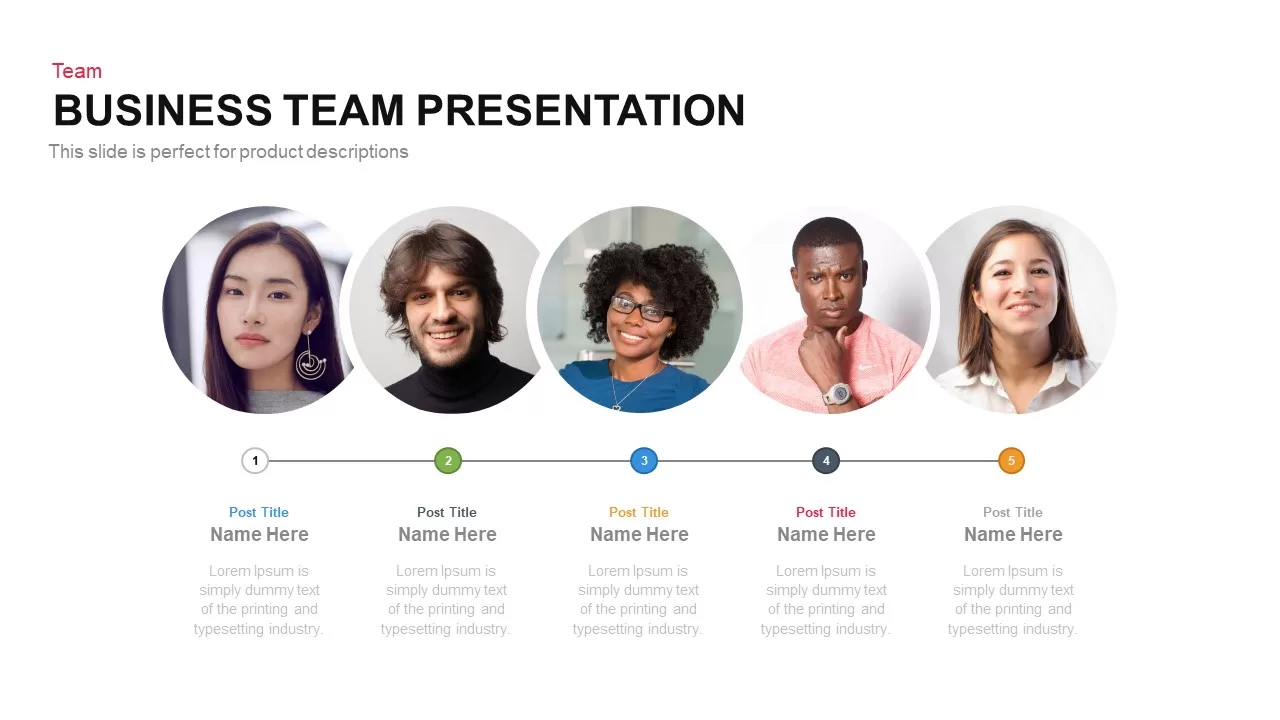
Business Team Timeline Presentation Template for PowerPoint & Google Slides
Our Team
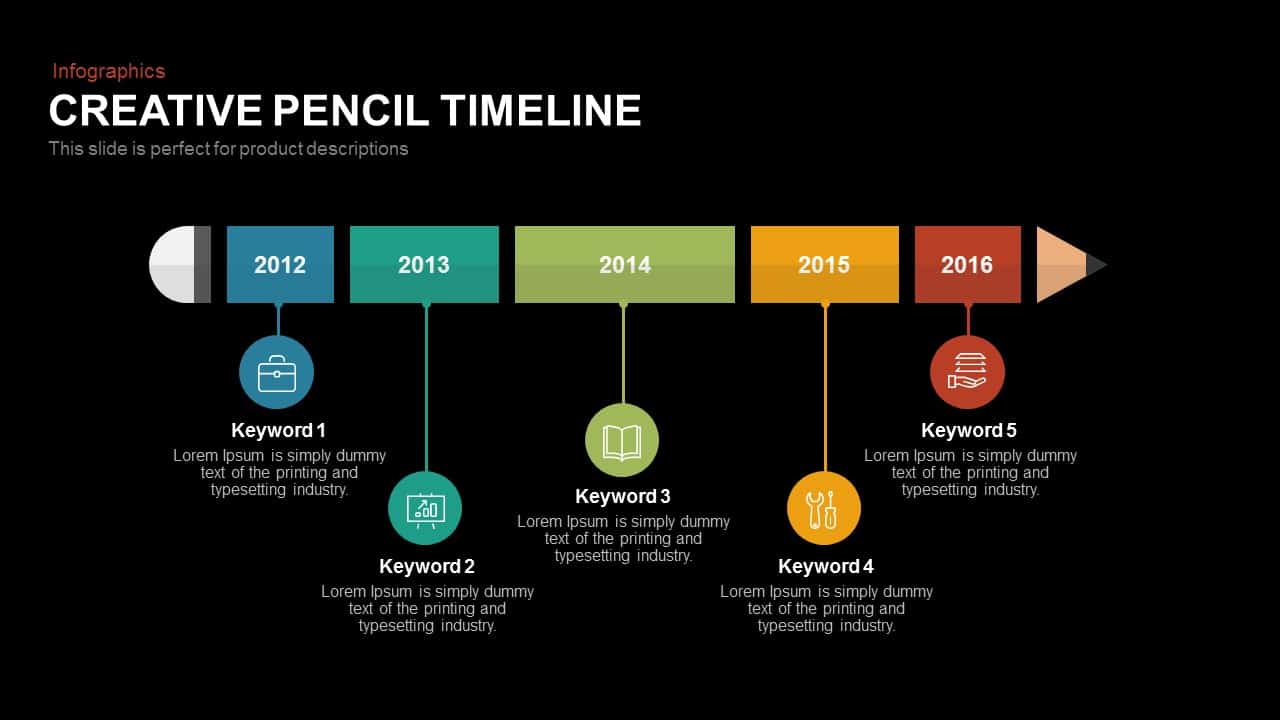
Creative Pencil Timeline Infographic Template for PowerPoint & Google Slides
Timeline
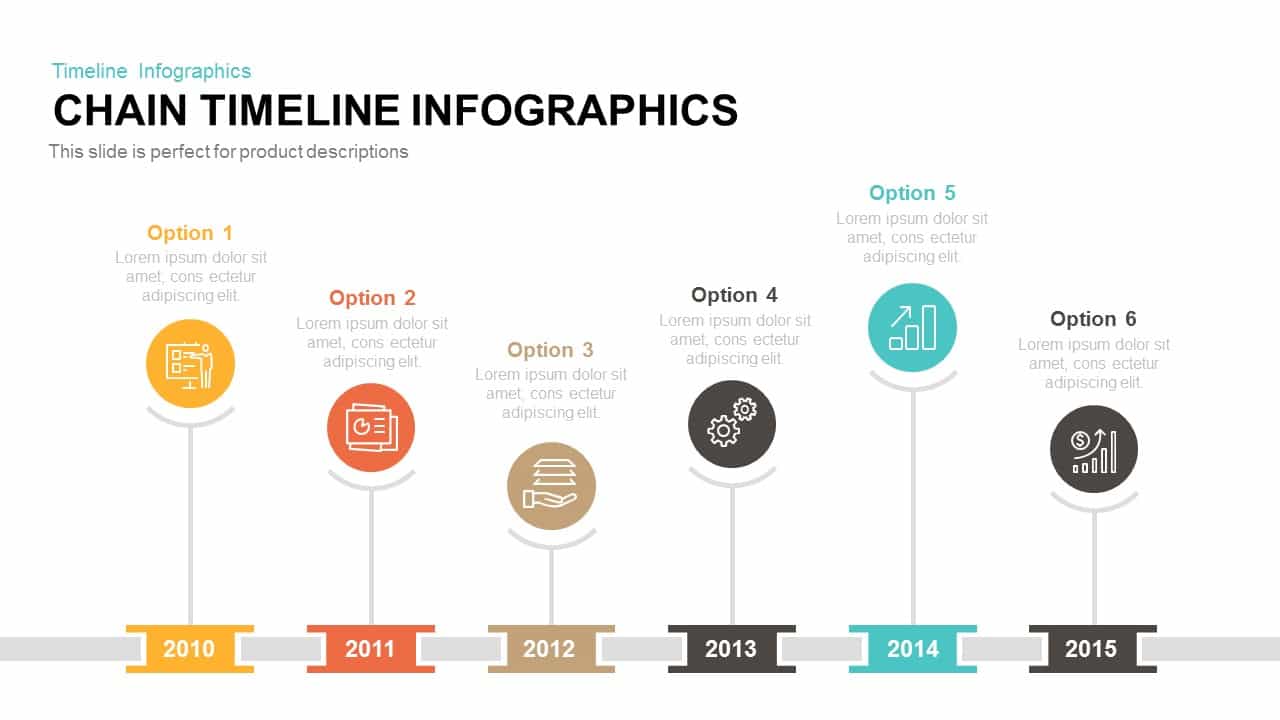
Chain Timeline template for PowerPoint & Google Slides
Timeline

Product Roadmap Gantt Chart Timeline template for PowerPoint & Google Slides
Gantt Chart
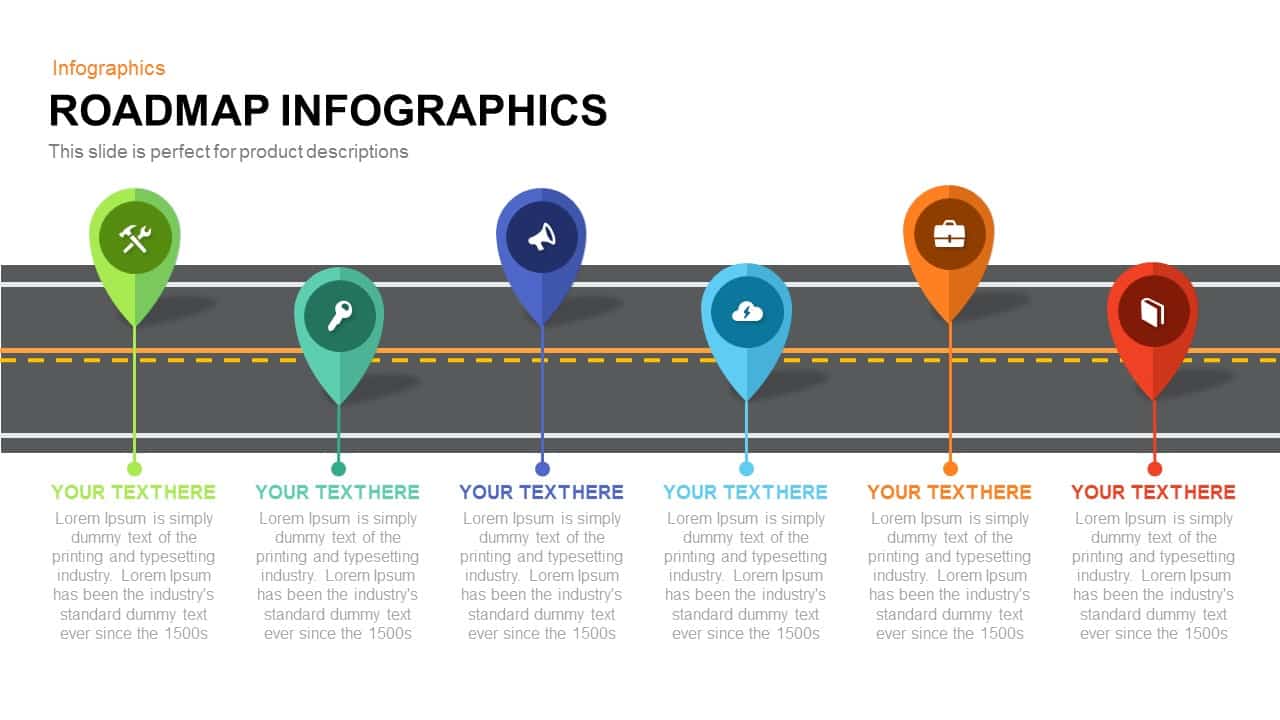
Roadmap Infographic Timeline Slide Template for PowerPoint & Google Slides
Roadmap
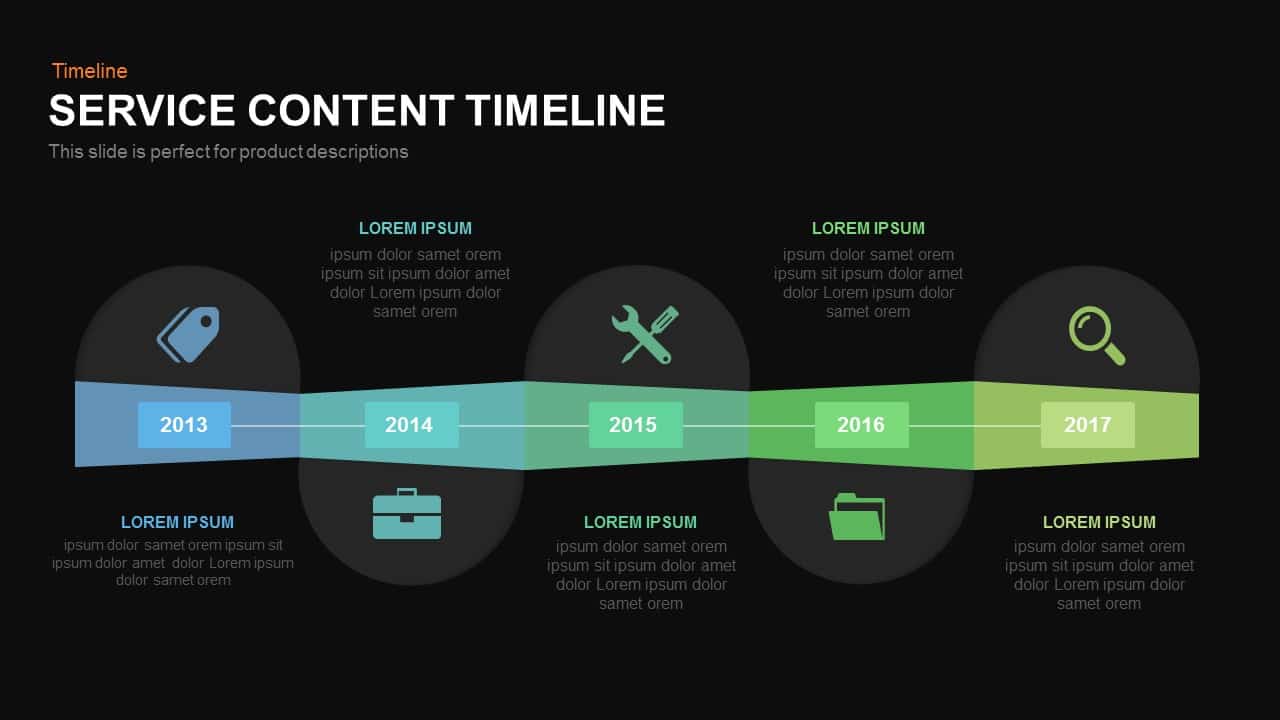
Service Content Timeline Diagram Template for PowerPoint & Google Slides
Timeline
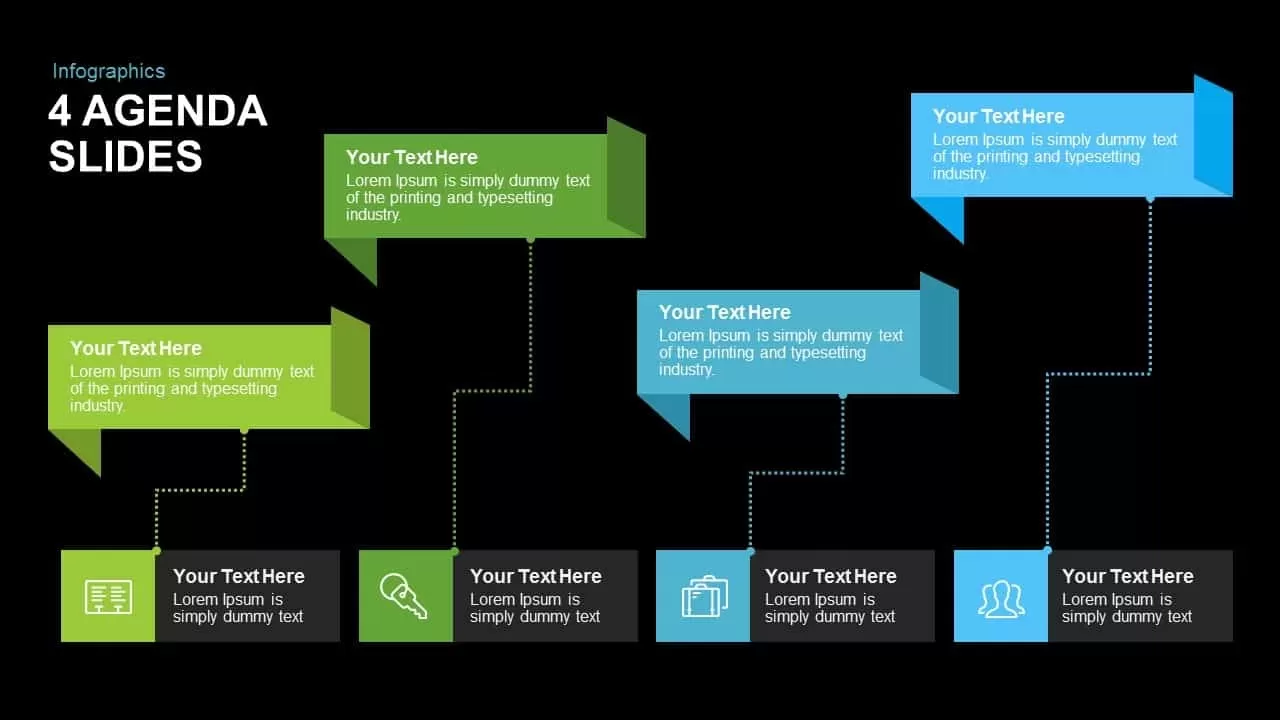
Editable Four-Point Timeline Agenda Template for PowerPoint & Google Slides
Agenda
Timeline Arrow for PowerPoint & Google Slides
Timeline
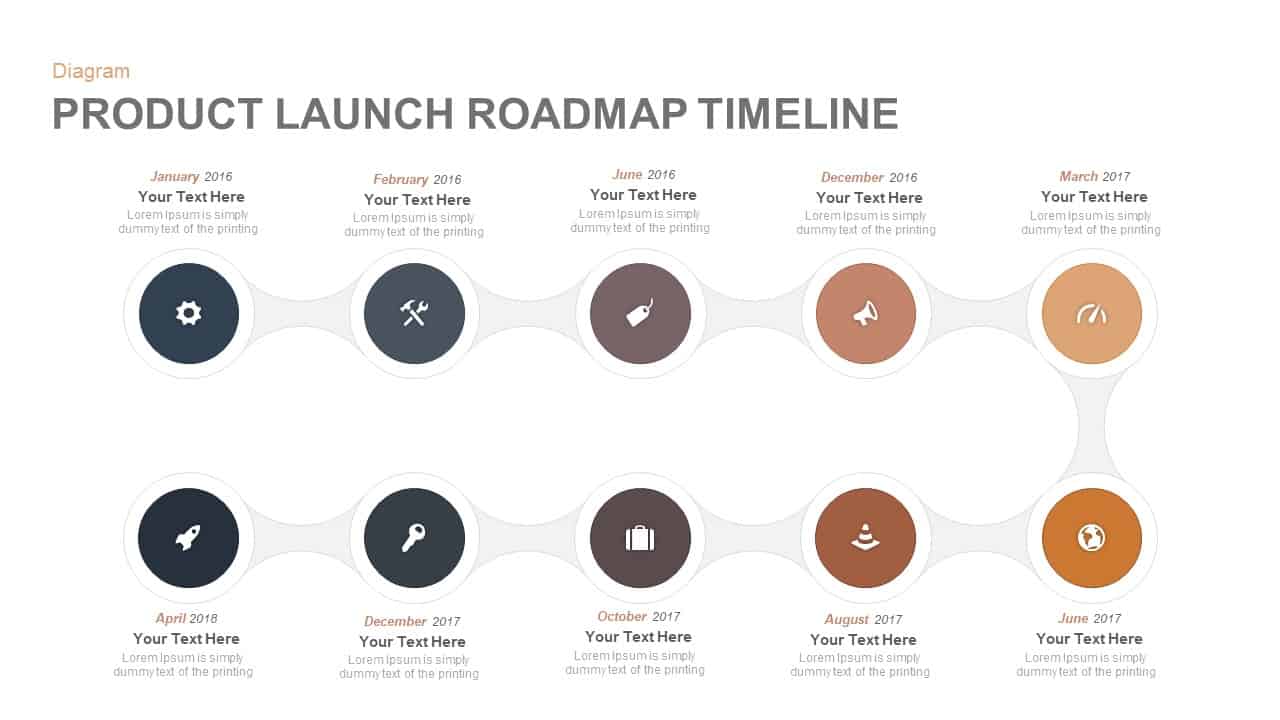
Product Launch Roadmap Timeline Template for PowerPoint & Google Slides
Timeline
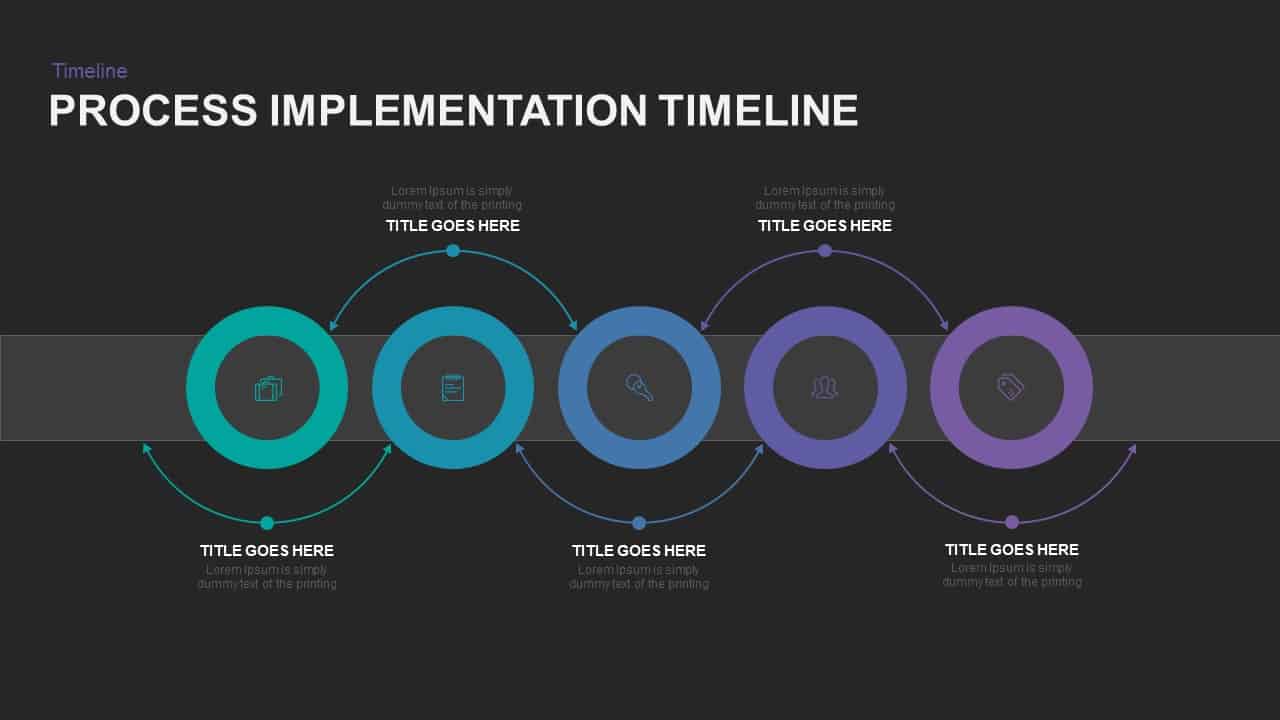
5-Stage Process Implementation Timeline Template for PowerPoint & Google Slides
Timeline
Modern Bubble Timeline Infographic Template for PowerPoint & Google Slides
Timeline
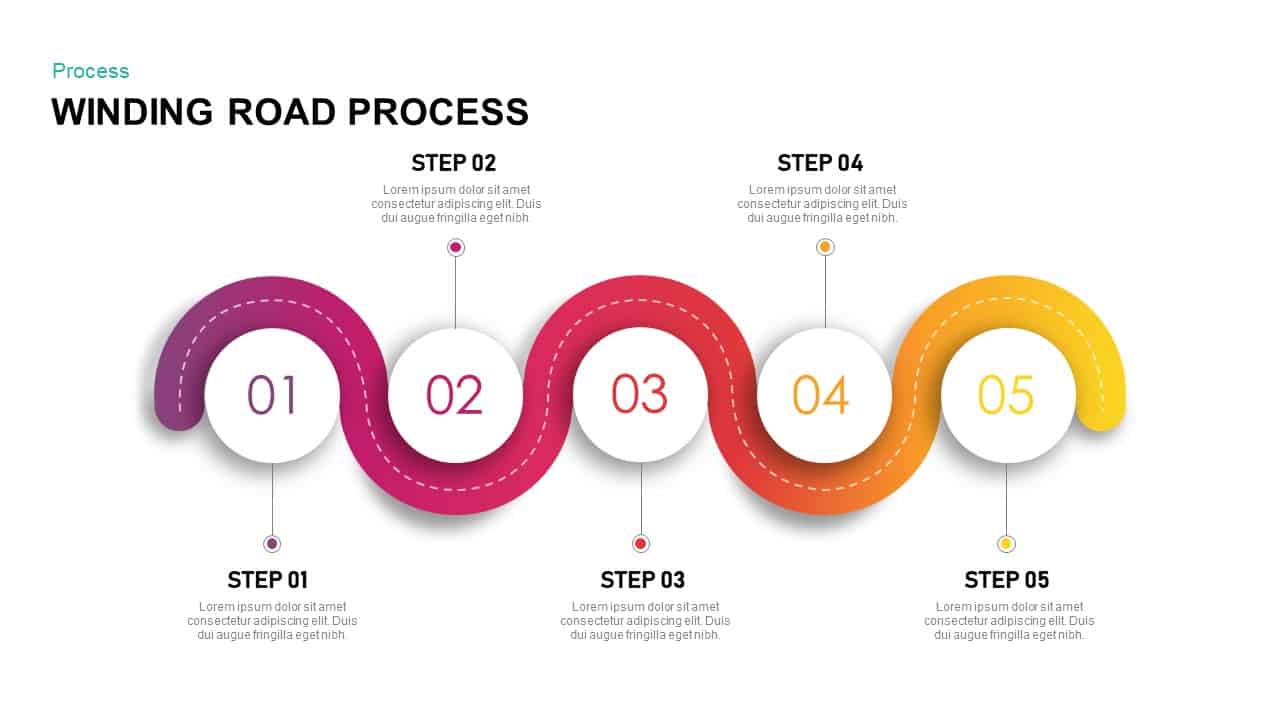
Dynamic Winding Road Process Timeline Template for PowerPoint & Google Slides
Process
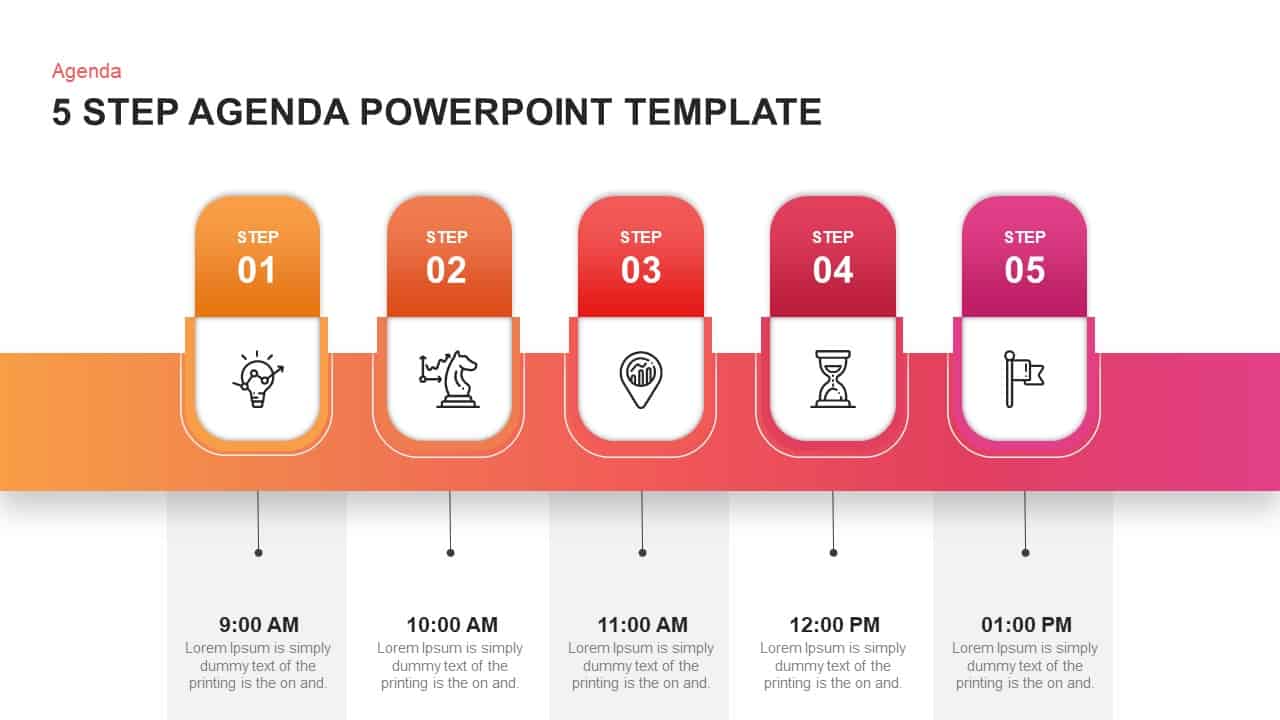
Five-Step Gradient Agenda Timeline Template for PowerPoint & Google Slides
Agenda
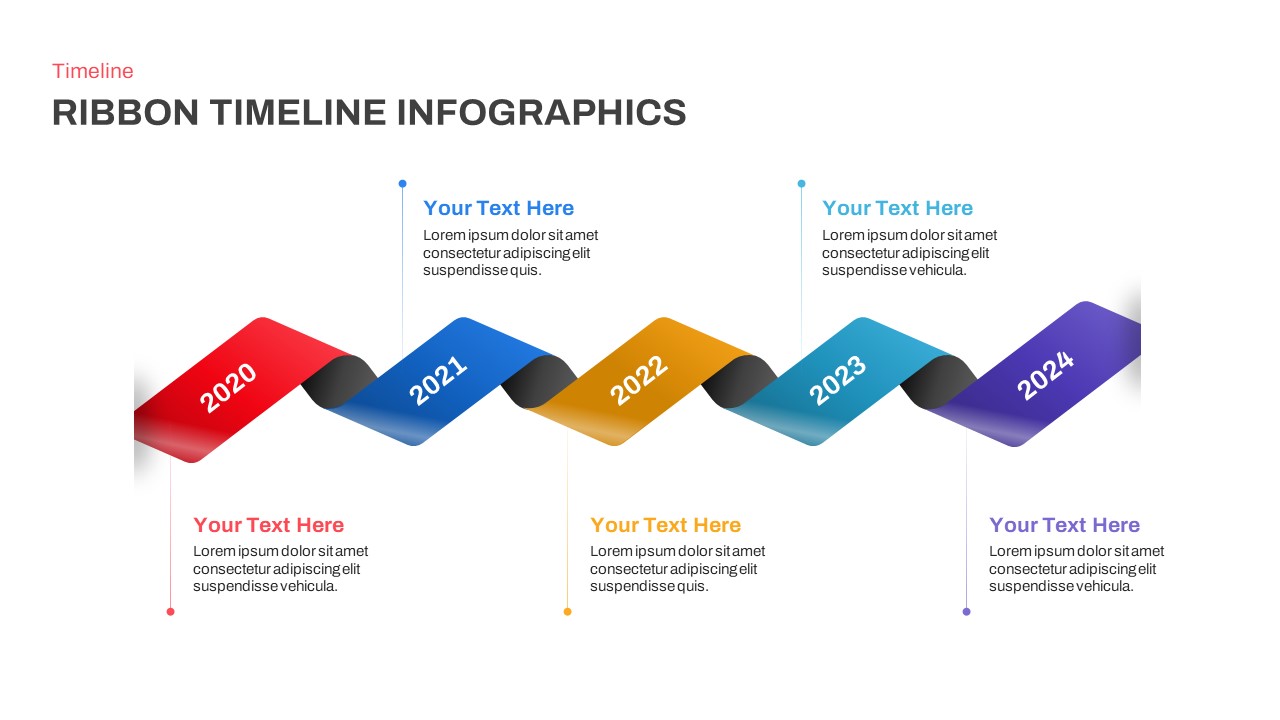
Five-Year Ribbon Timeline Diagram Template for PowerPoint & Google Slides
Timeline
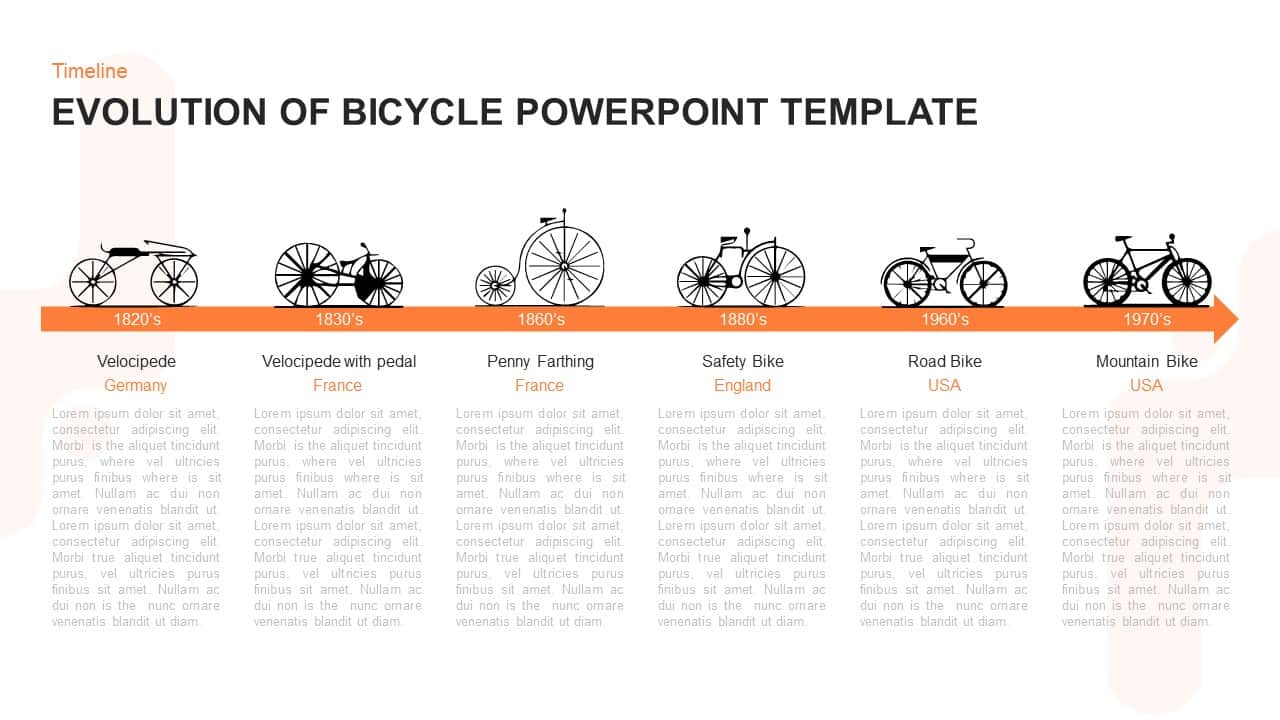
Evolution of Bicycle Timeline Diagram Template for PowerPoint & Google Slides
Timeline
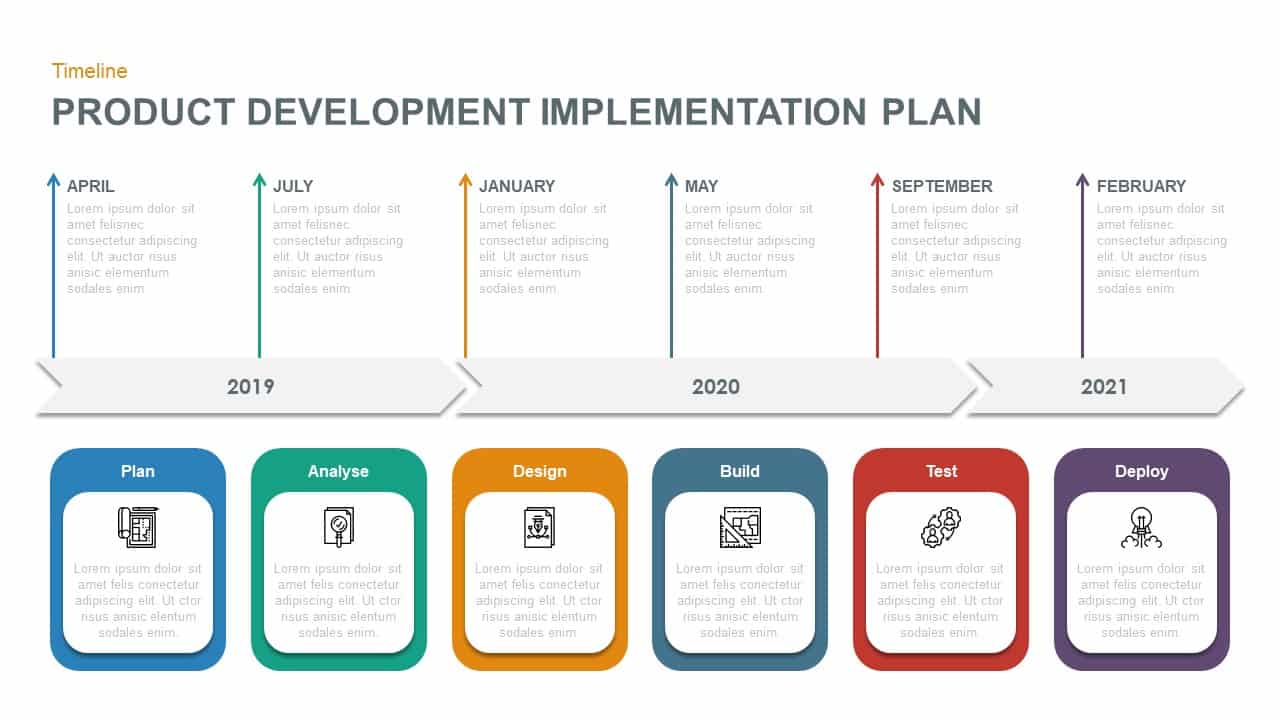
Product Development Plan Timeline Template for PowerPoint & Google Slides
Timeline
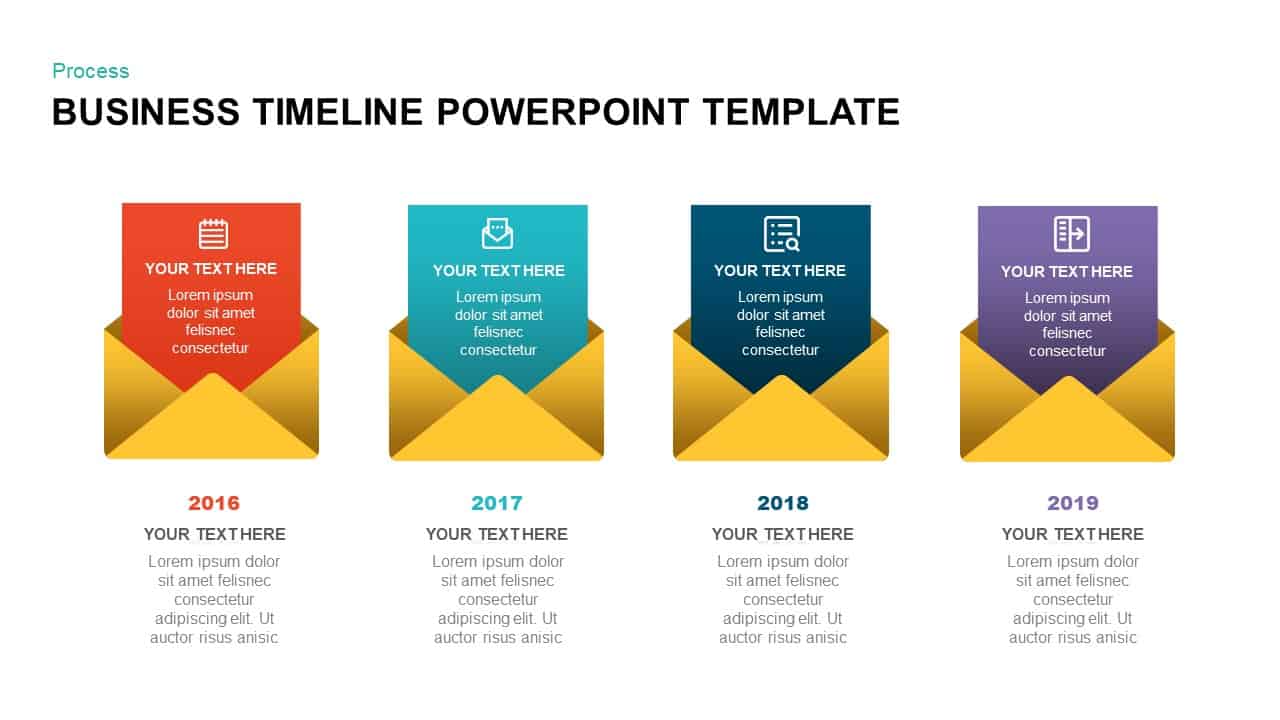
Business Timeline Envelope Infographic Template for PowerPoint & Google Slides
Timeline
Free Fundraising Pitch Deck Timeline Template for PowerPoint & Google Slides
Pitch Deck
Free
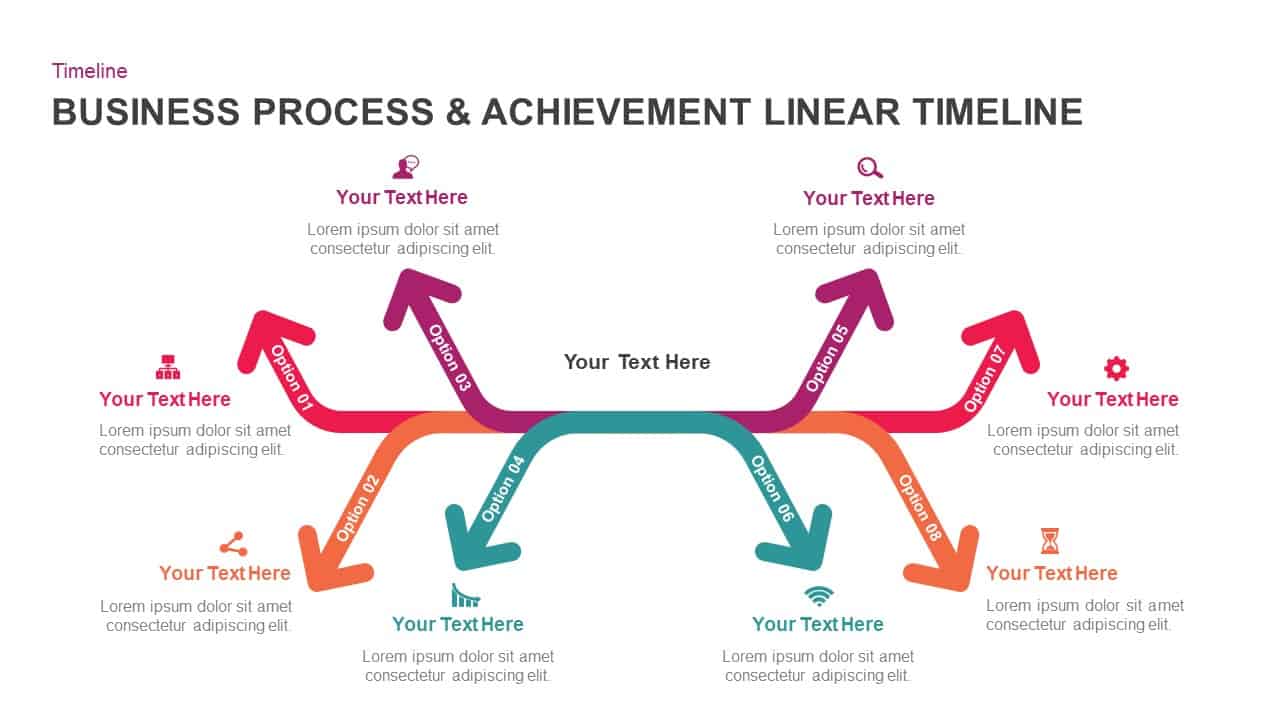
Business Process Achievement Timeline Template for PowerPoint & Google Slides
Timeline
5-Stage Financial Growth Timeline Template for PowerPoint & Google Slides
Timeline
5-Stage Timeline Infographic Slide Template for PowerPoint & Google Slides
Timeline
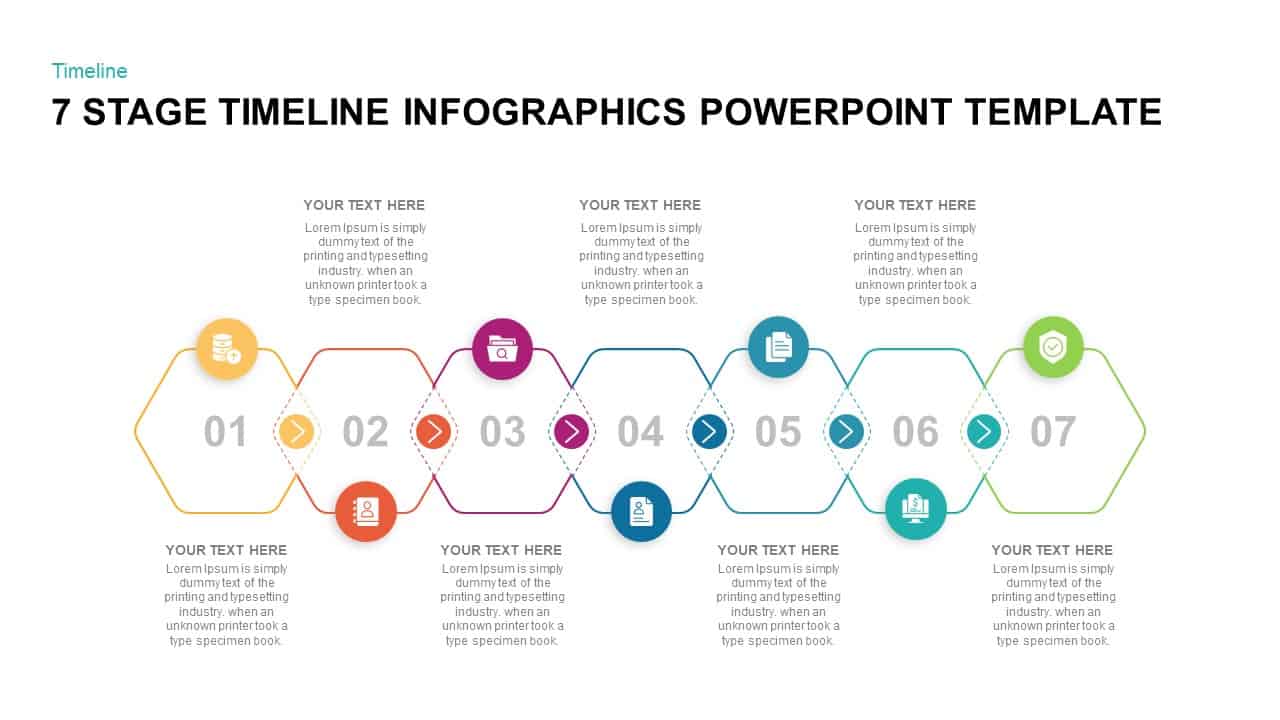
Seven-Stage Hexagon Timeline Infographic Template for PowerPoint & Google Slides
Timeline
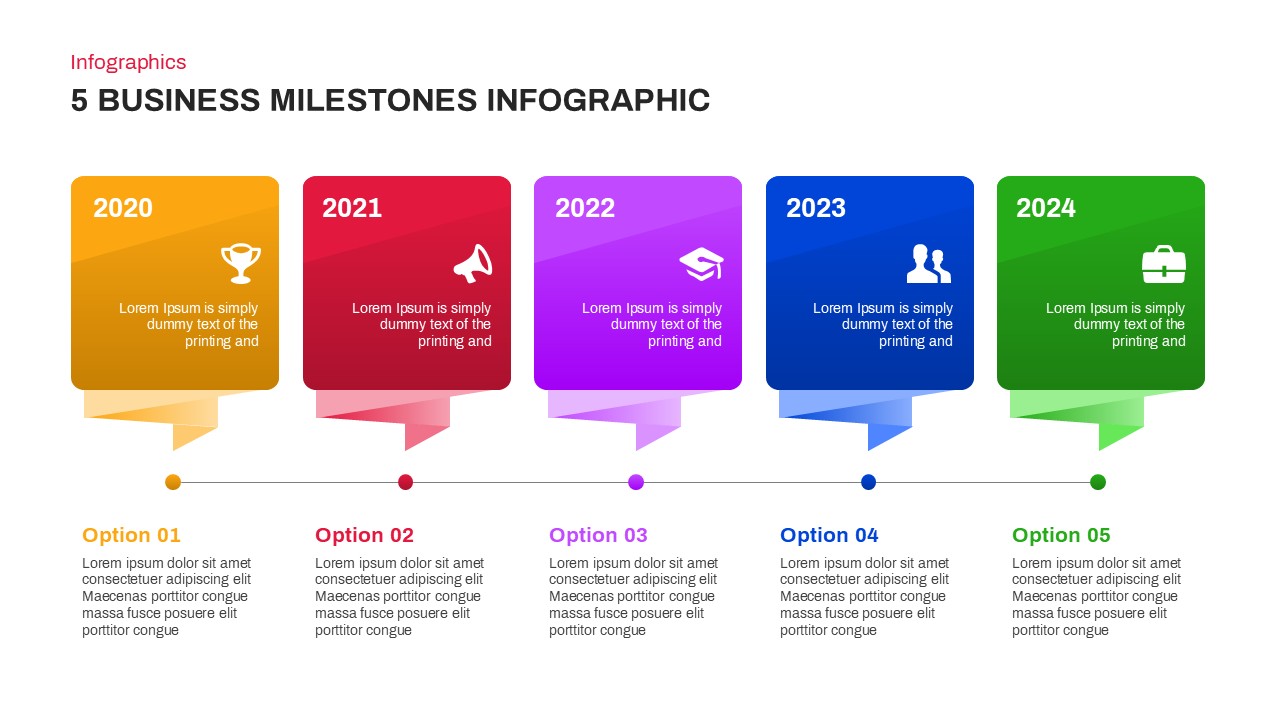
5 Business Milestones Timeline Template for PowerPoint & Google Slides
Timeline
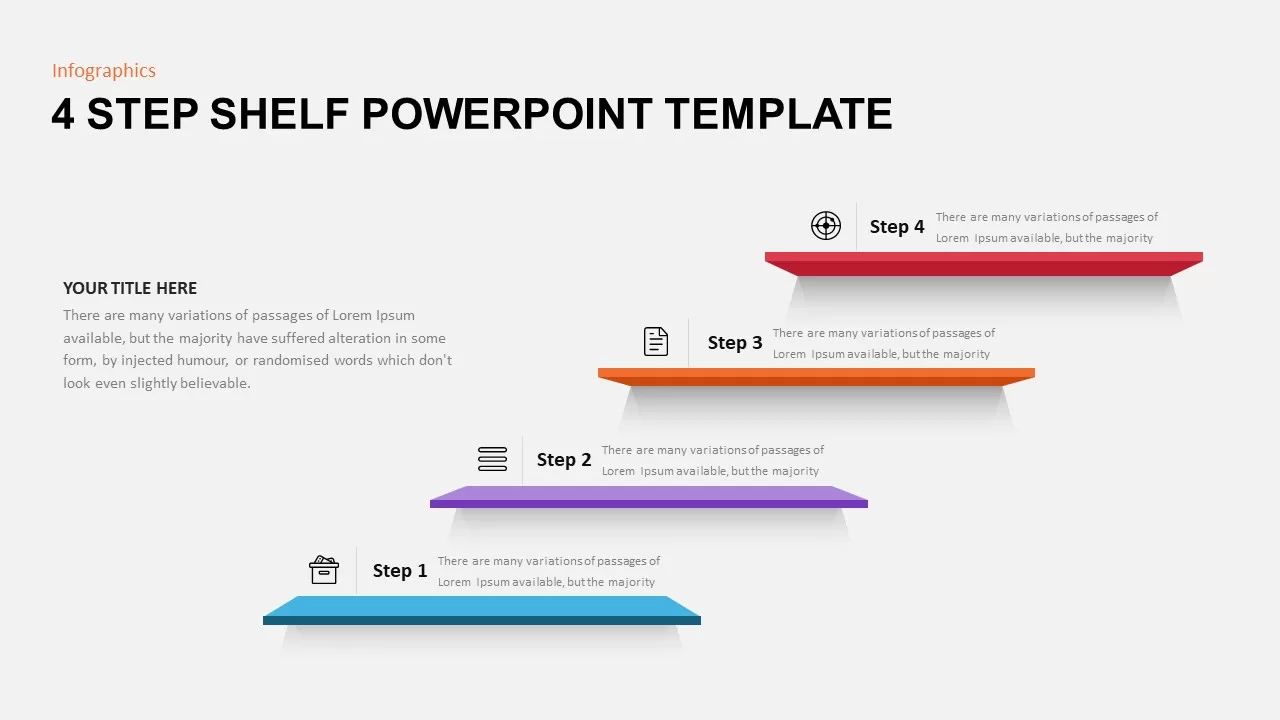
Animated 4 Step Shelf Timeline Template for PowerPoint & Google Slides
Infographics
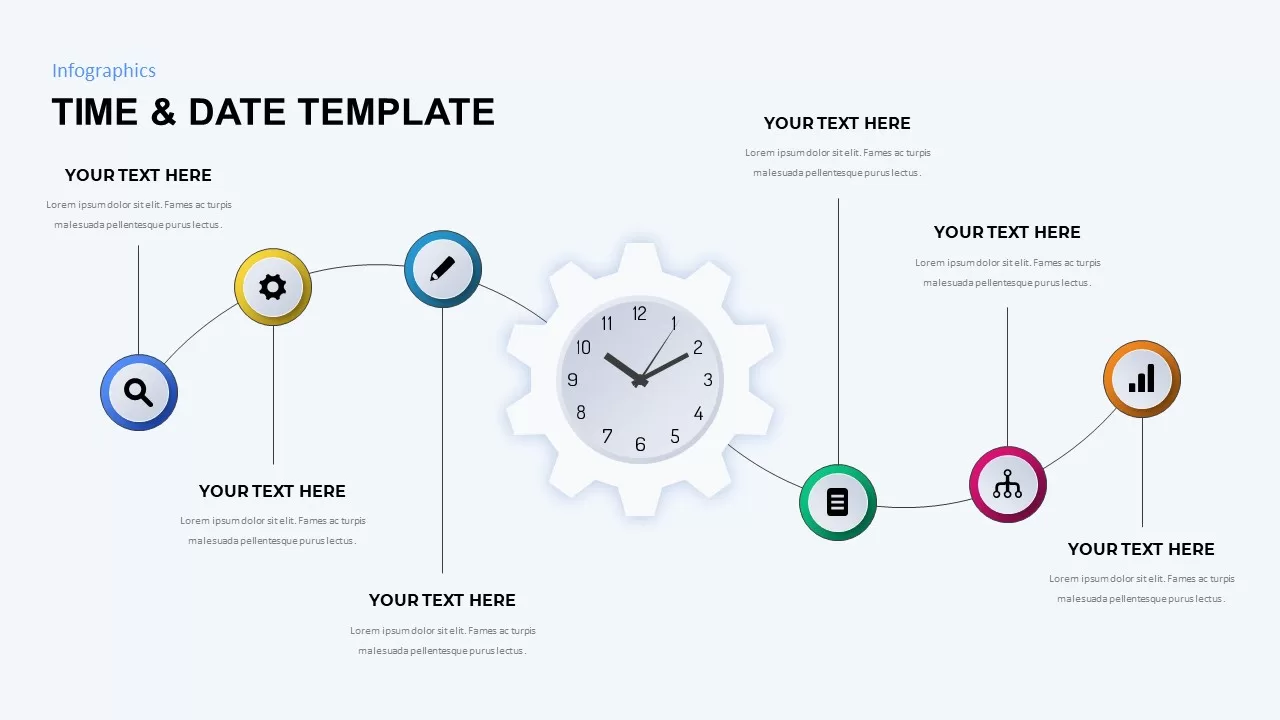
Time & Date Infographic Timeline Template for PowerPoint & Google Slides
Decks
Free Timeline for Powerpoint and Google Slides
Free
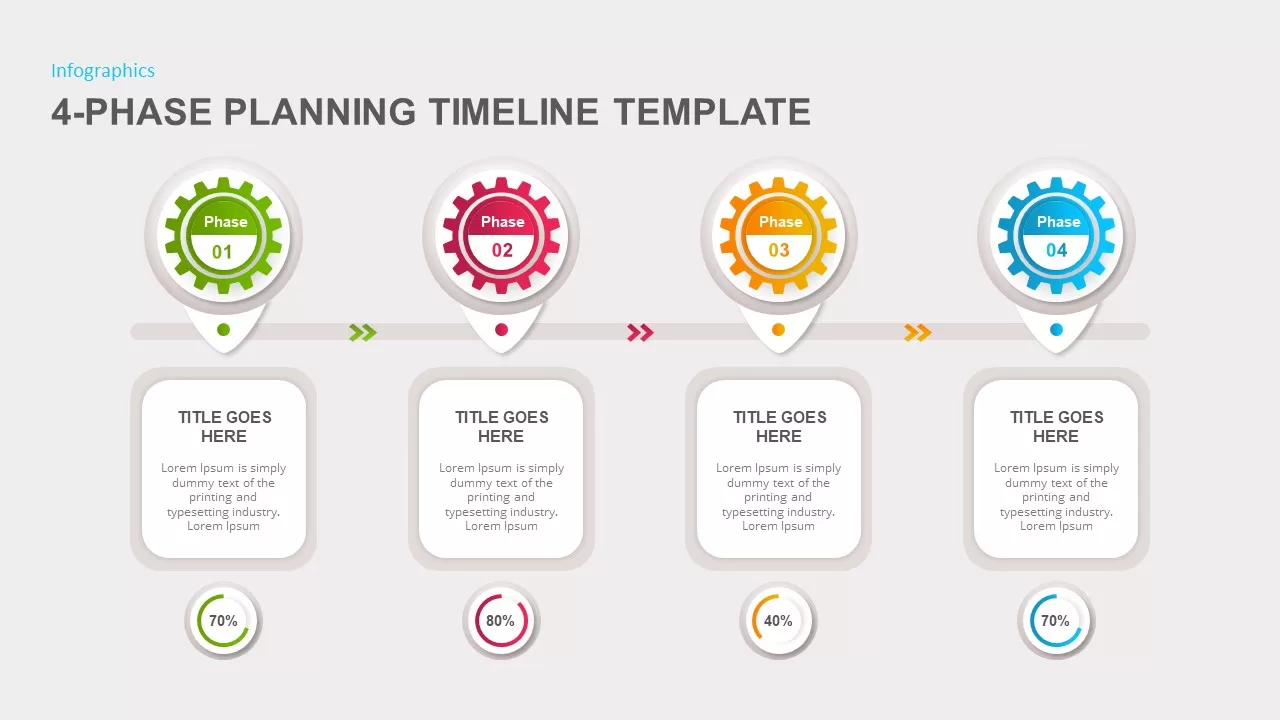
4-Phase Planning Timeline template for PowerPoint & Google Slides
Infographics
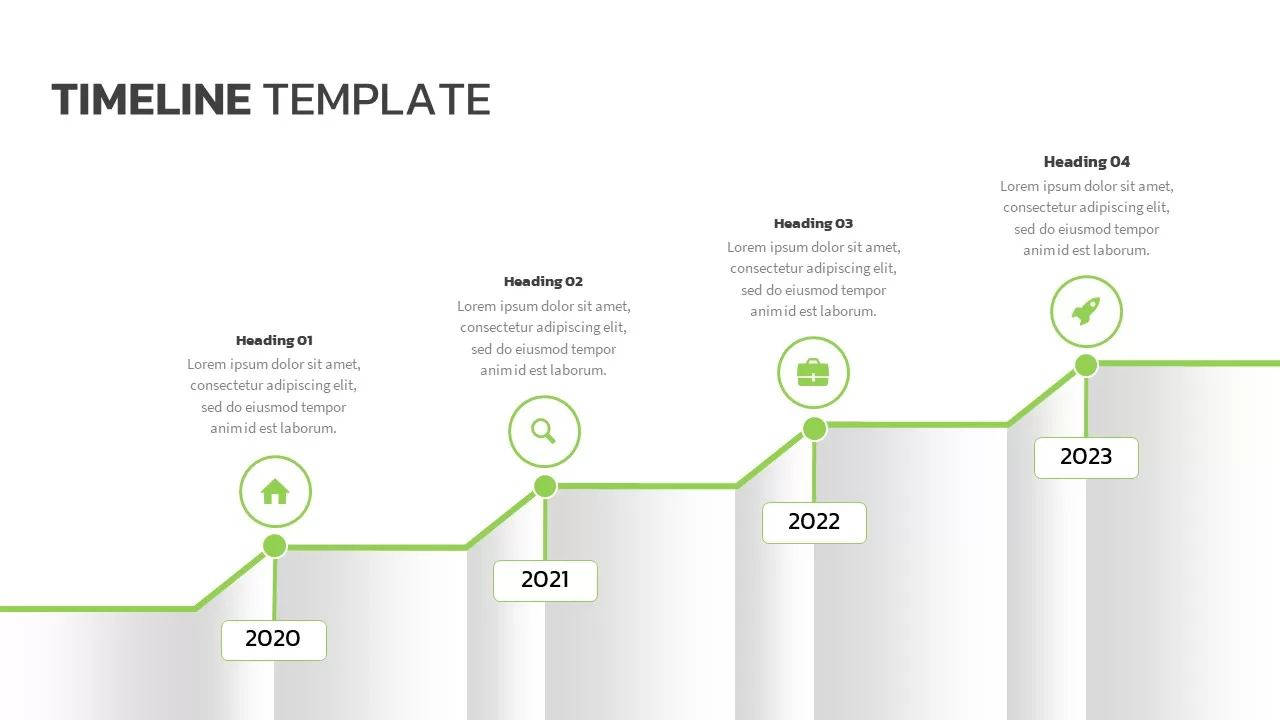
Modern Green Timeline Infographic Template for PowerPoint & Google Slides
Timeline
Colorful Five-Year Timeline Layout Template for PowerPoint & Google Slides
Timeline

Free Colorful Roadmap Timeline Infographic Template for PowerPoint & Google Slides
Roadmap
Free
Free Winding Road Timeline Milestones Template for PowerPoint & Google Slides
Roadmap
Free
Timeline Template for PowerPoint & Google Slides
Business Plan
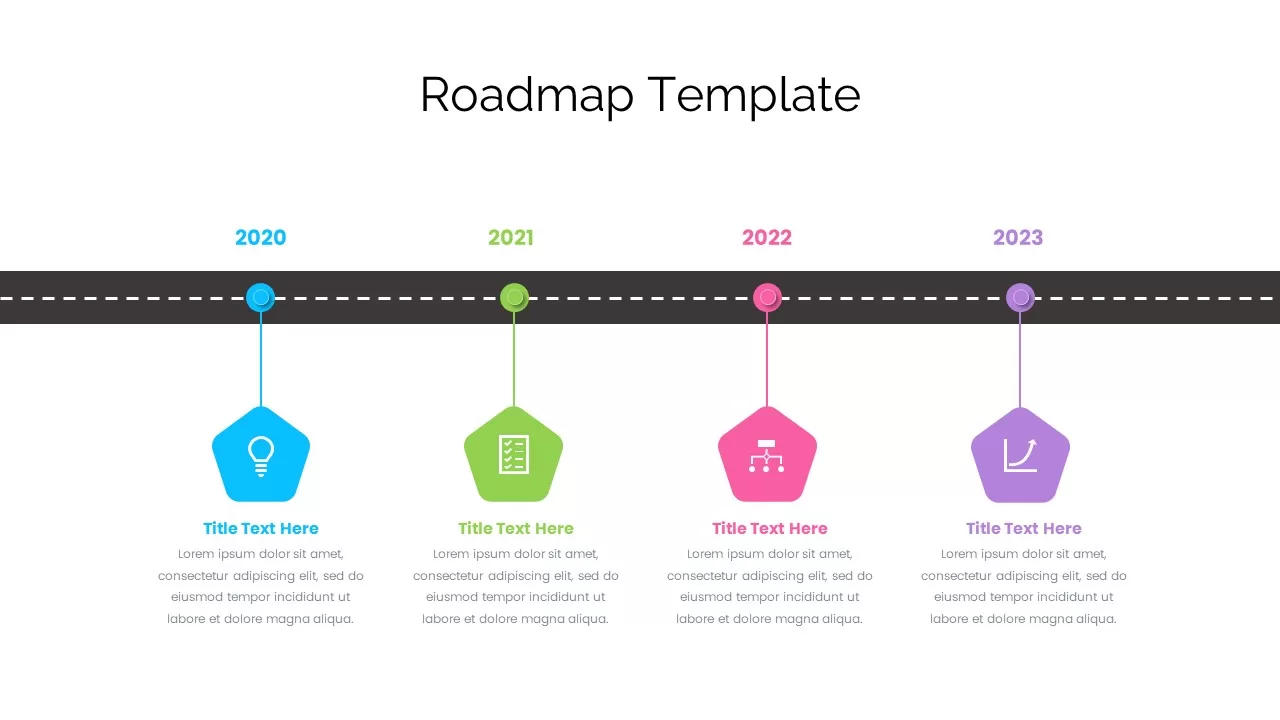
Roadmap Timeline Template for PowerPoint & Google Slides
Timeline
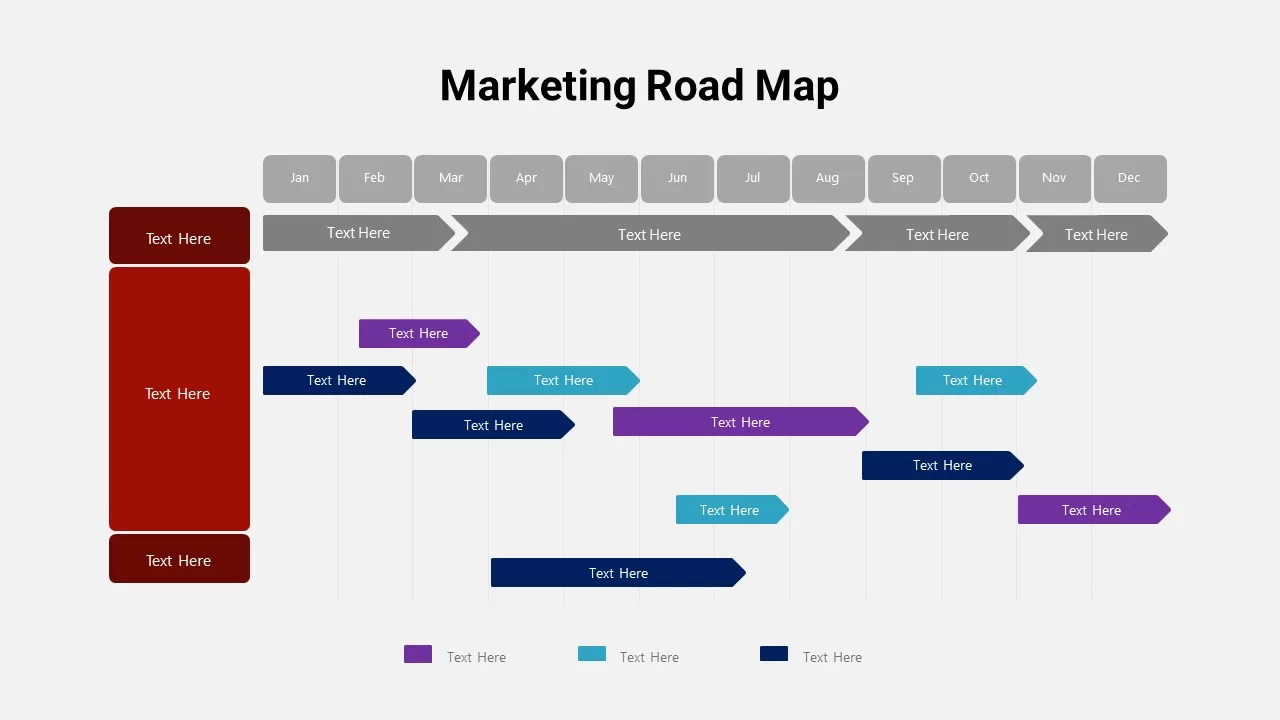
Detailed Marketing Road Map Timeline Template for PowerPoint & Google Slides
Timeline
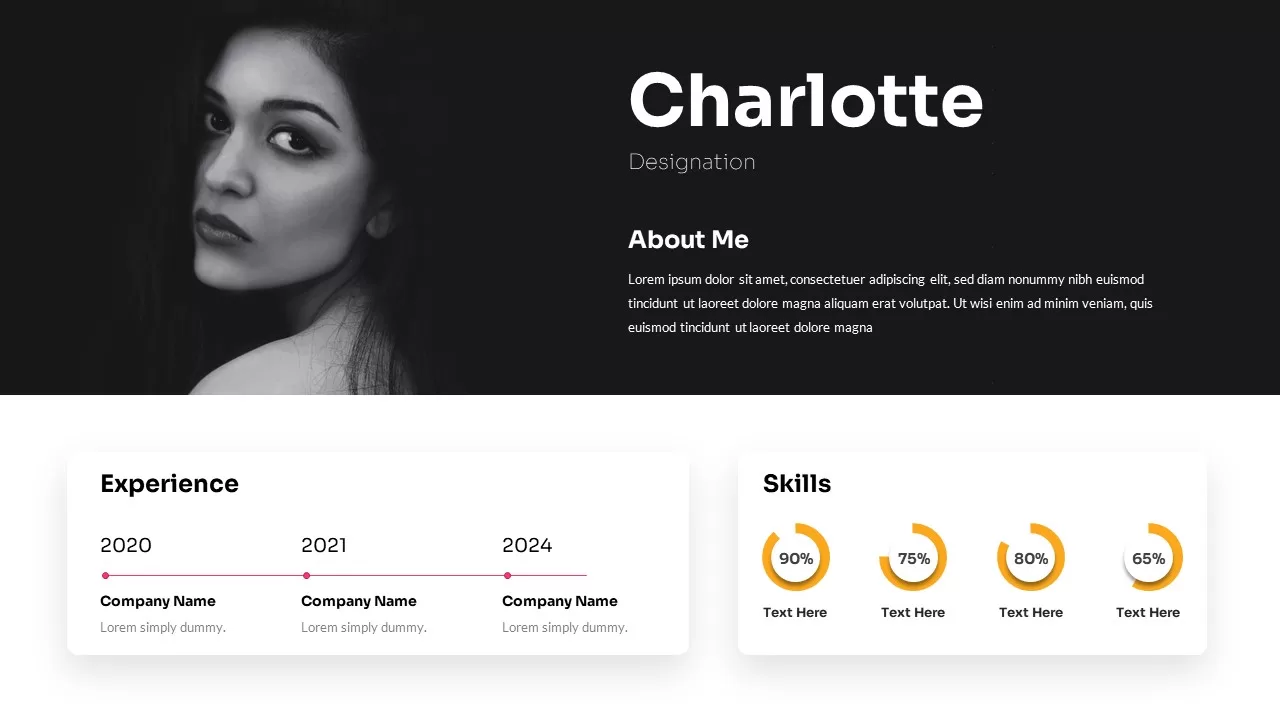
Profile Slide with Timeline & Skills Template for PowerPoint & Google Slides
Our Team
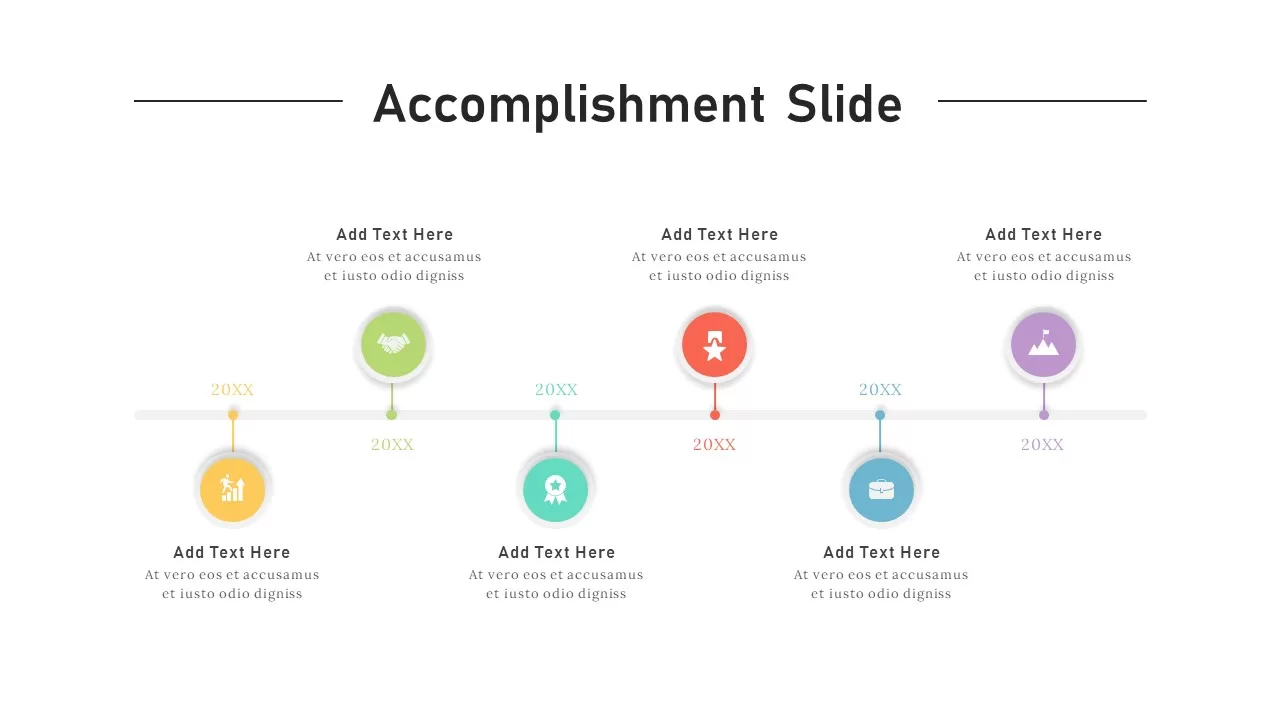
Accomplishment Timeline Presentation Slide for PowerPoint & Google Slides
Timeline
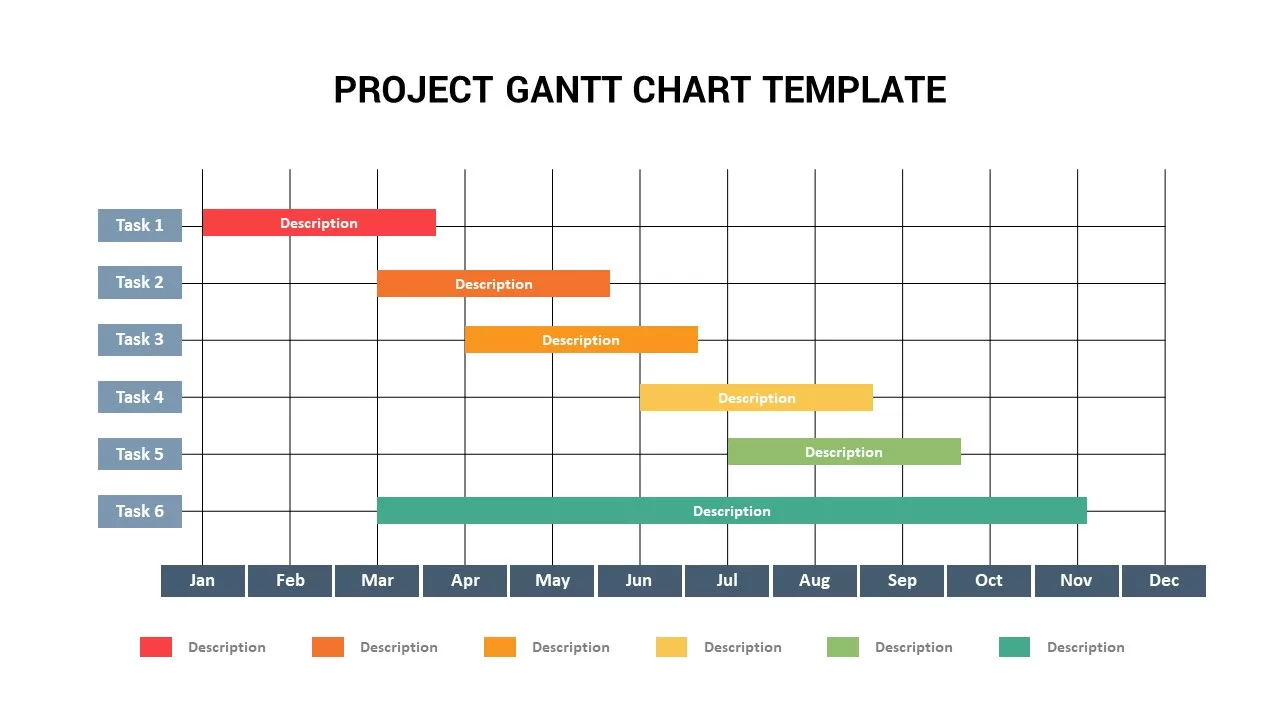
Annual Project Gantt Chart Timeline Template for PowerPoint & Google Slides
Gantt Chart
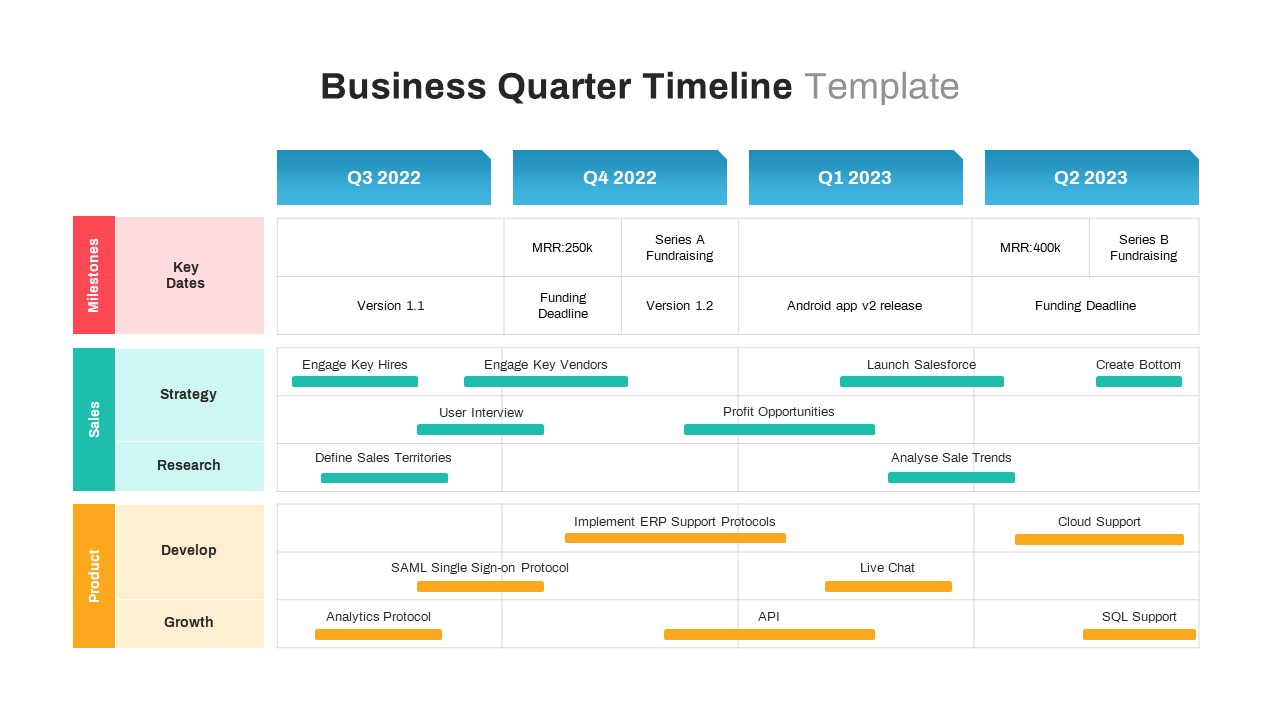
Business Quarter Roadmap Timeline Template for PowerPoint & Google Slides
Timeline
Overlapping Timeline Gantt Chart Diagram Template for PowerPoint & Google Slides
Timeline
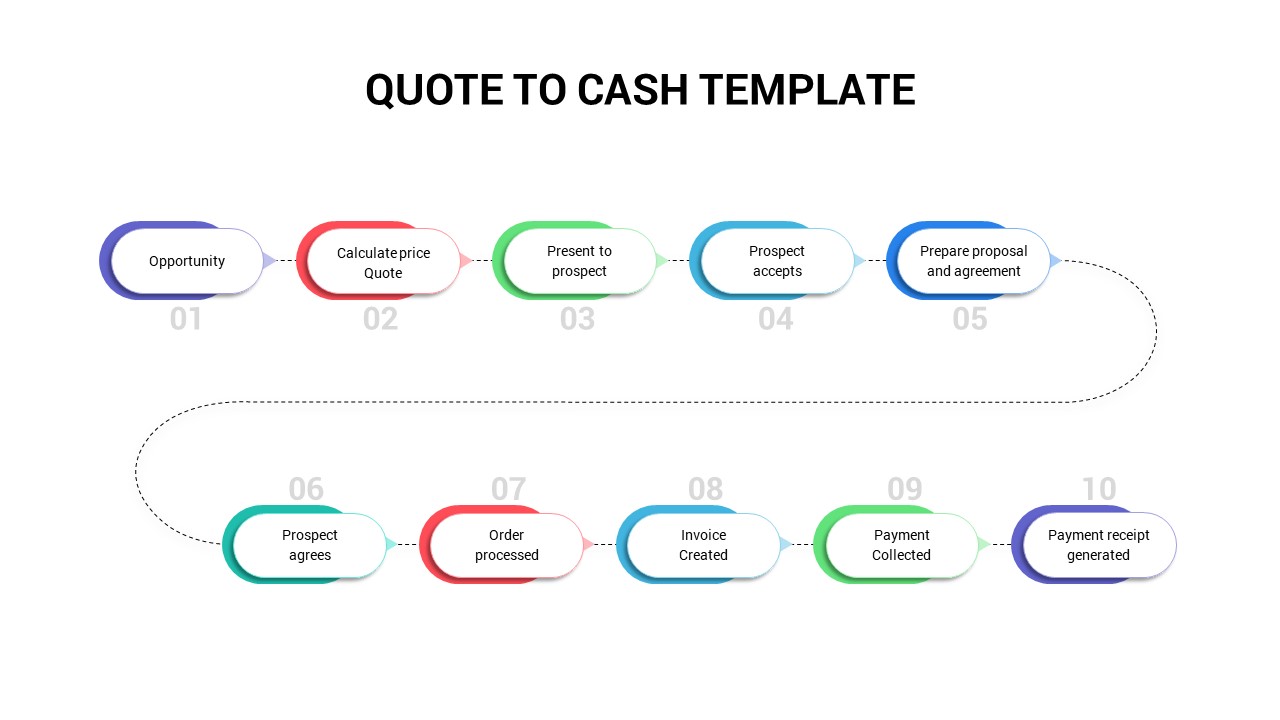
Quote to Cash Process Timeline Template for PowerPoint & Google Slides
Process
Minimalist Timeline Infographic Template for PowerPoint & Google Slides
Timeline
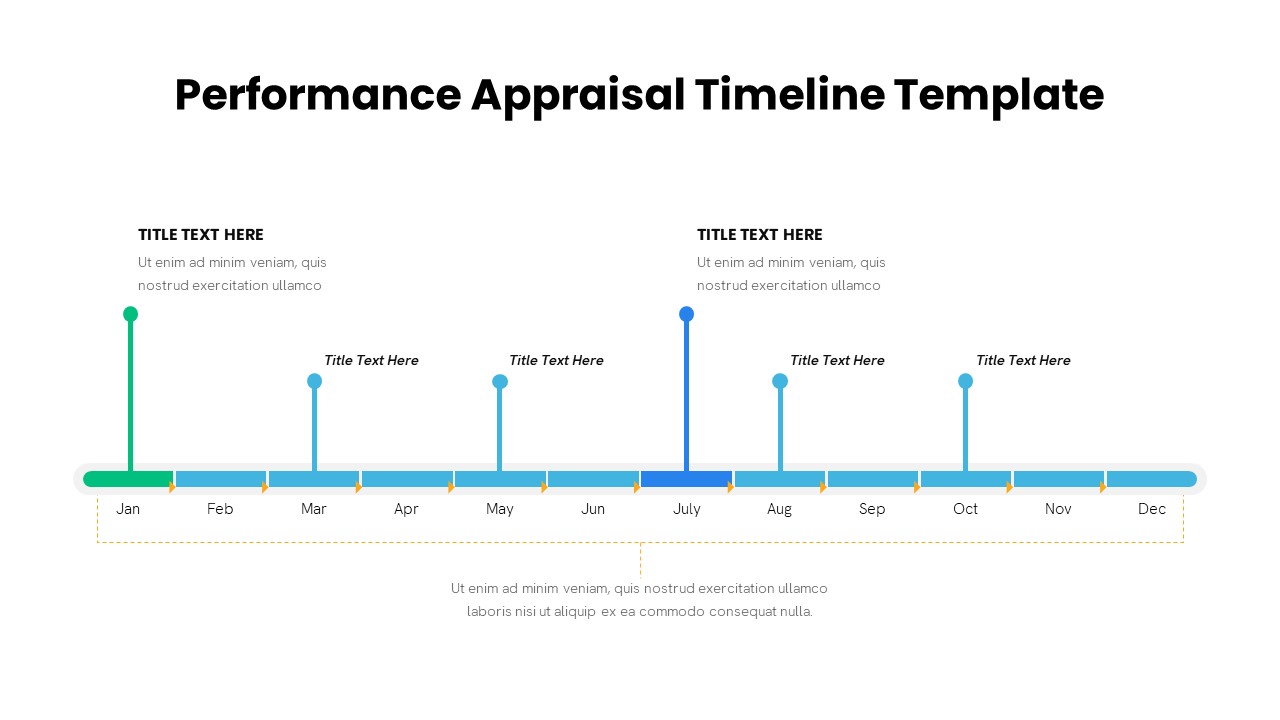
Performance Appraisal Timeline Diagram Template for PowerPoint & Google Slides
Timeline
Modern Six-Point Timeline Infographic Template for PowerPoint & Google Slides
Timeline
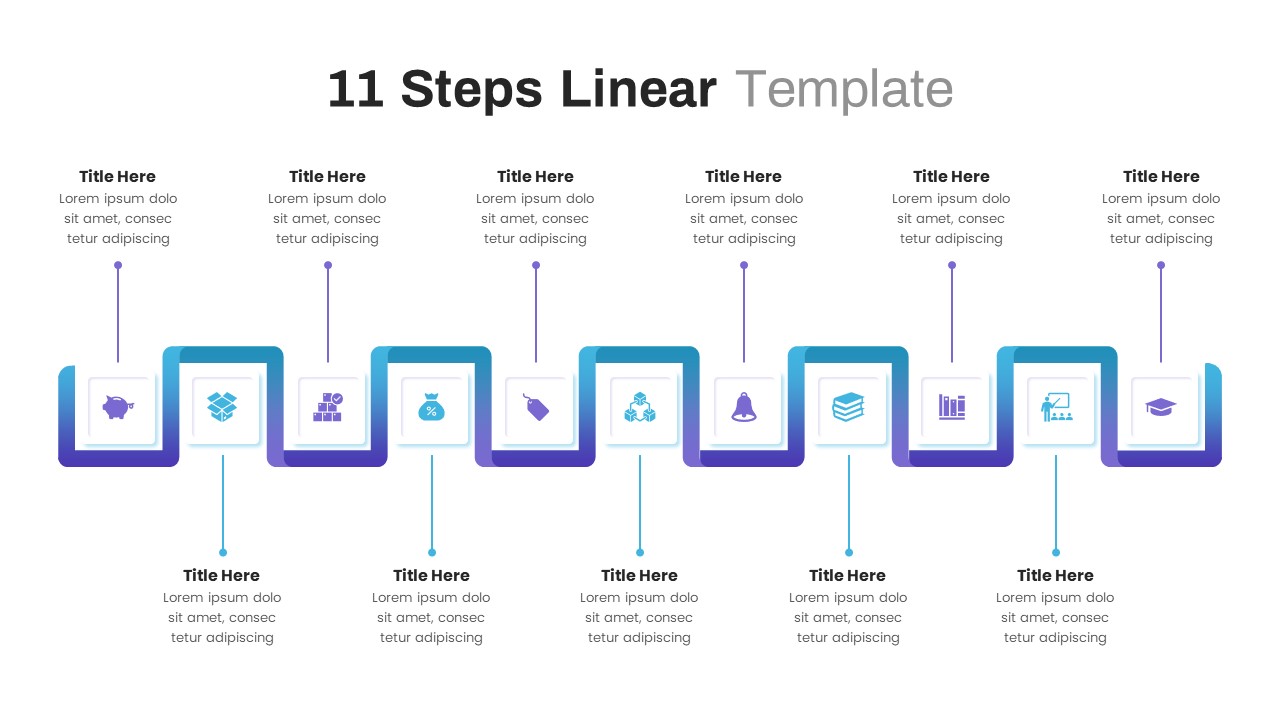
Modern 11-Step Linear Timeline Template for PowerPoint & Google Slides
Timeline
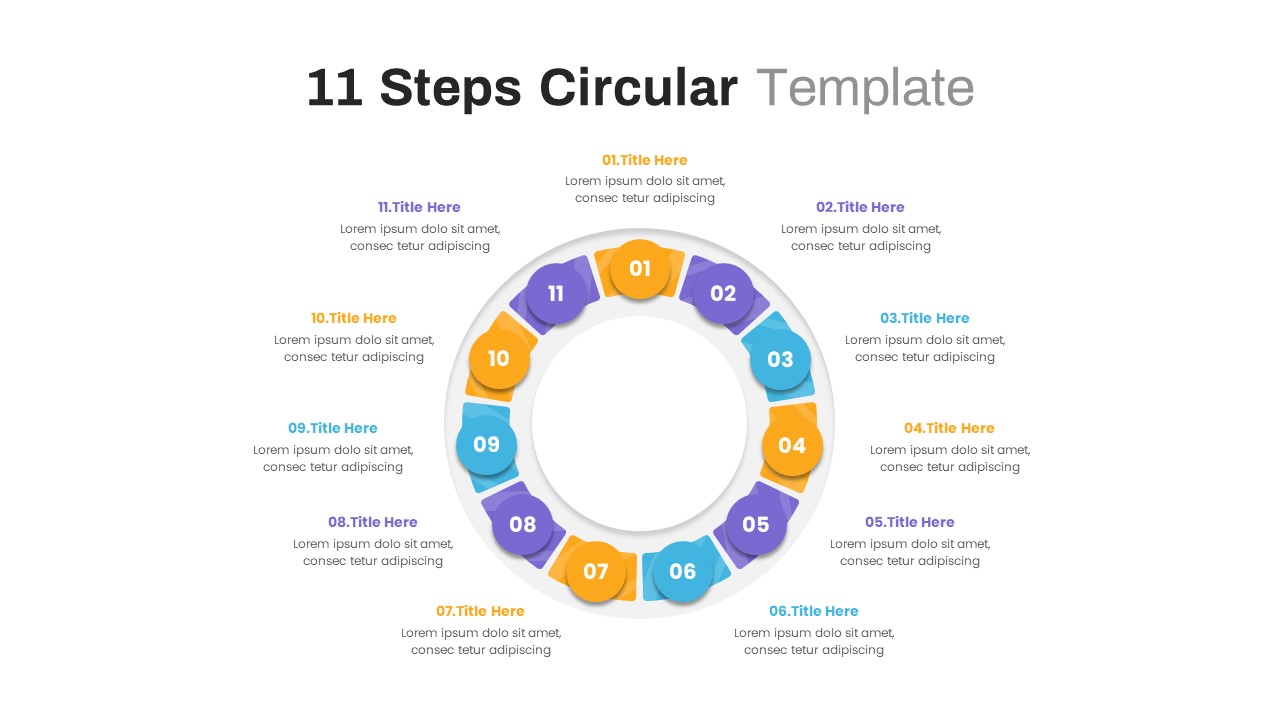
Modern 11-Step Circular Timeline Template for PowerPoint & Google Slides
Timeline
Multi-Color Milestone Timeline Layout Template for PowerPoint & Google Slides
Timeline
Two-Row Ten-Step Timeline Template for PowerPoint & Google Slides
Timeline
RCA Process Timeline Table Slide Template for PowerPoint & Google Slides
Timeline
Delivery Timeline Multi-Row Template for PowerPoint & Google Slides
Timeline
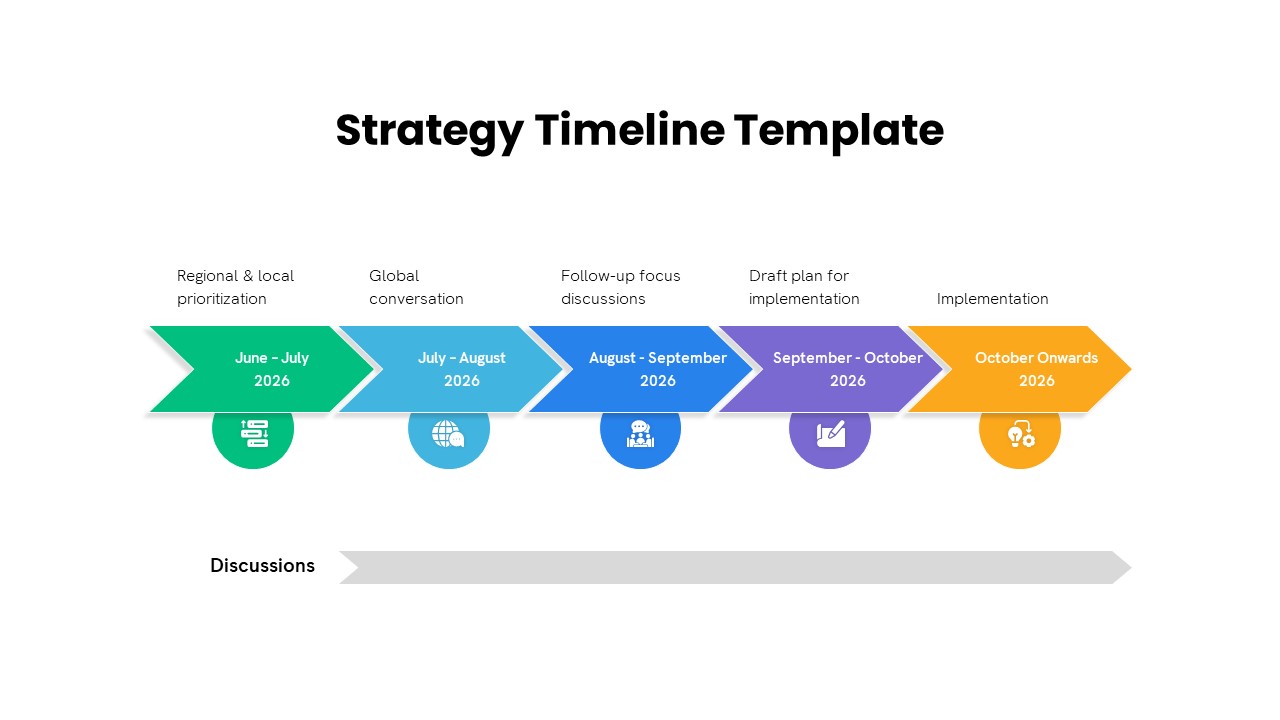
Five-Phase Strategy Timeline Diagram Template for PowerPoint & Google Slides
Timeline
Five-Phase Horizontal Timeline Chart Template for PowerPoint & Google Slides
Timeline
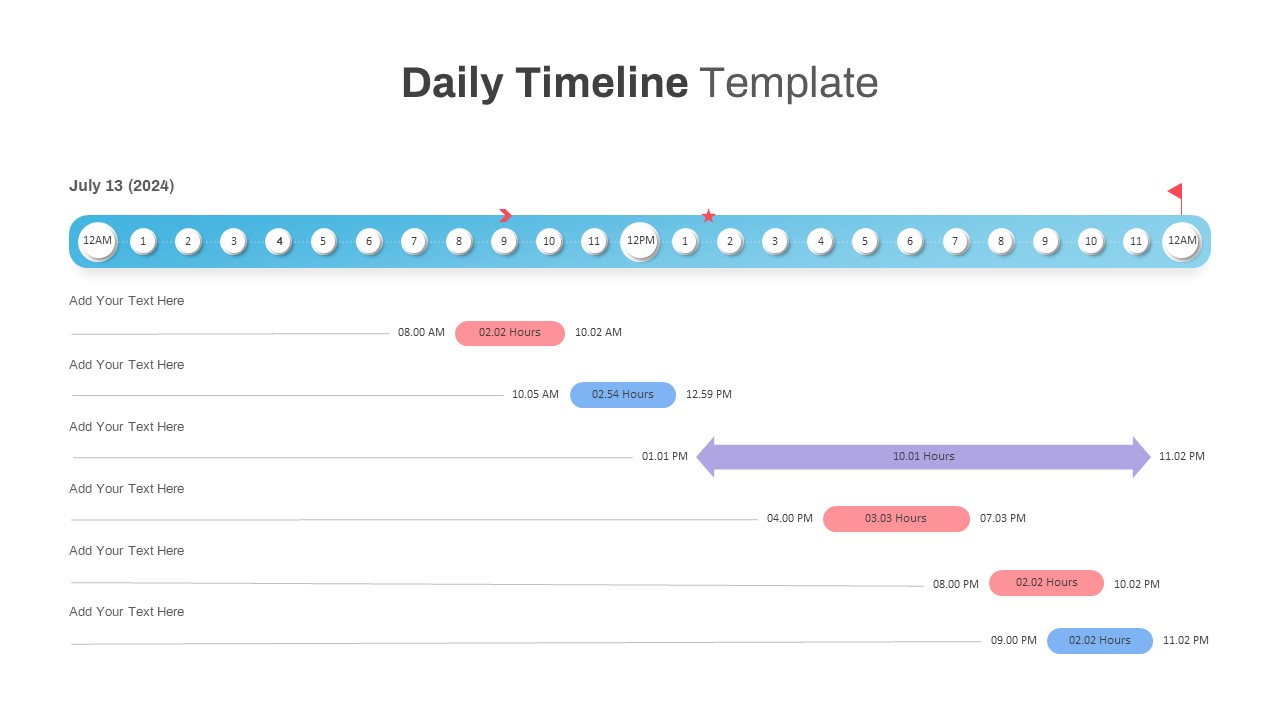
Interactive Daily Timeline Schedule Chart Template for PowerPoint & Google Slides
Timeline
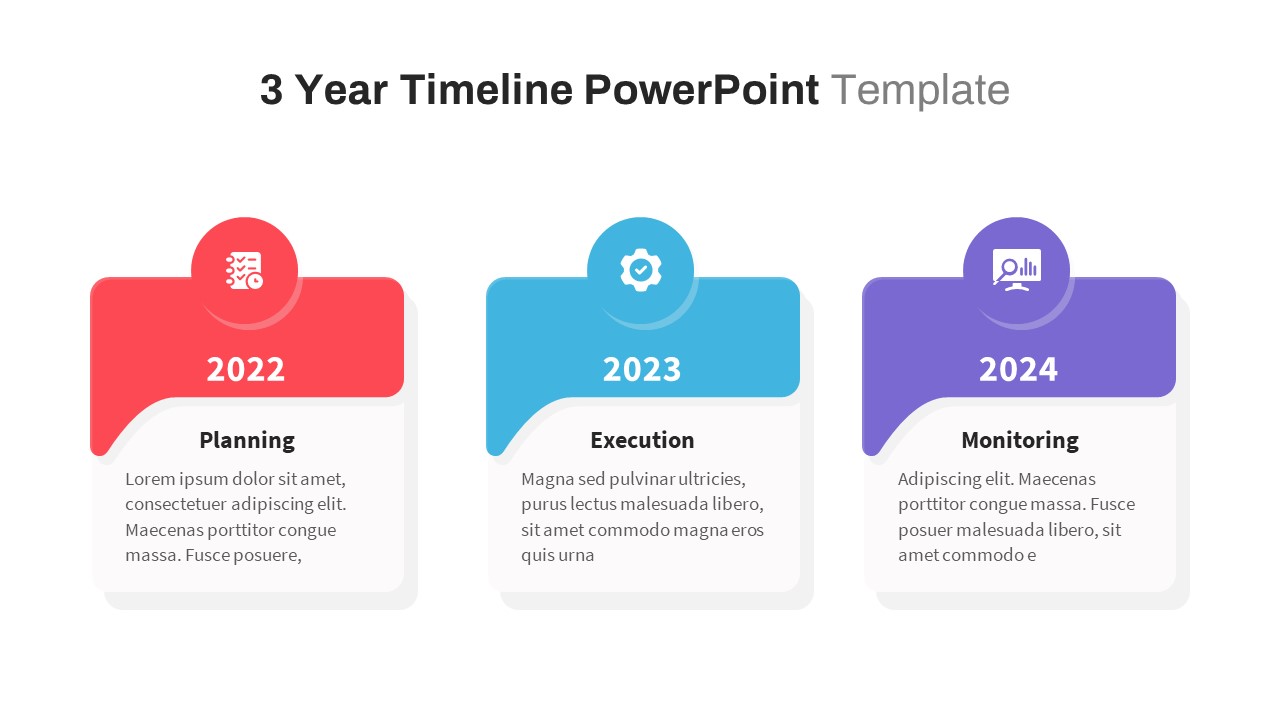
Three-Year Project Roadmap Timeline Template for PowerPoint & Google Slides
Timeline
Professional Milestone Timeline Chart Template for PowerPoint & Google Slides
Timeline
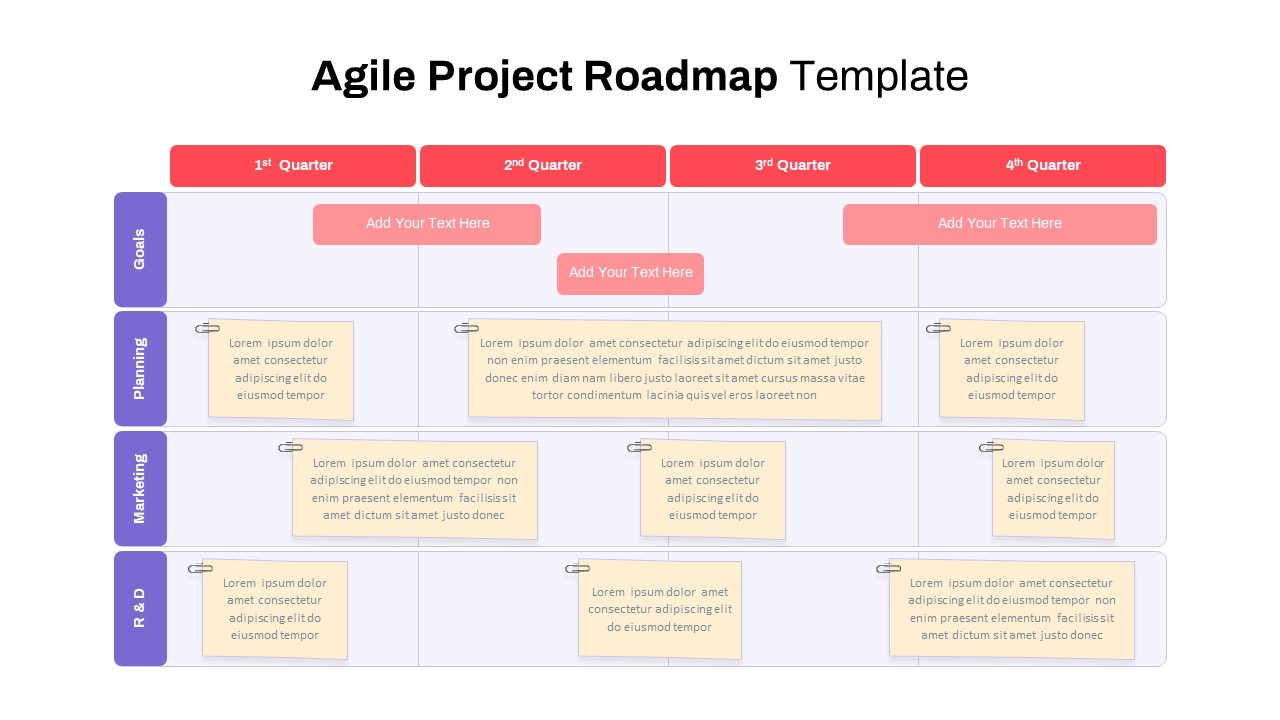
Agile Project Roadmap Timeline Template Pack for PowerPoint & Google Slides
Scrum
5 Year Timeline Template for PowerPoint & Google Slides
Timeline
Free Multicolor Five-Stage Milestone Timeline Template for PowerPoint & Google Slides
Timeline
Free
Wavy Timeline Project Roadmap Slide for PowerPoint & Google Slides
Project Status
Cybersecurity Timeline Roadmap Slide for PowerPoint & Google Slides
Information Technology
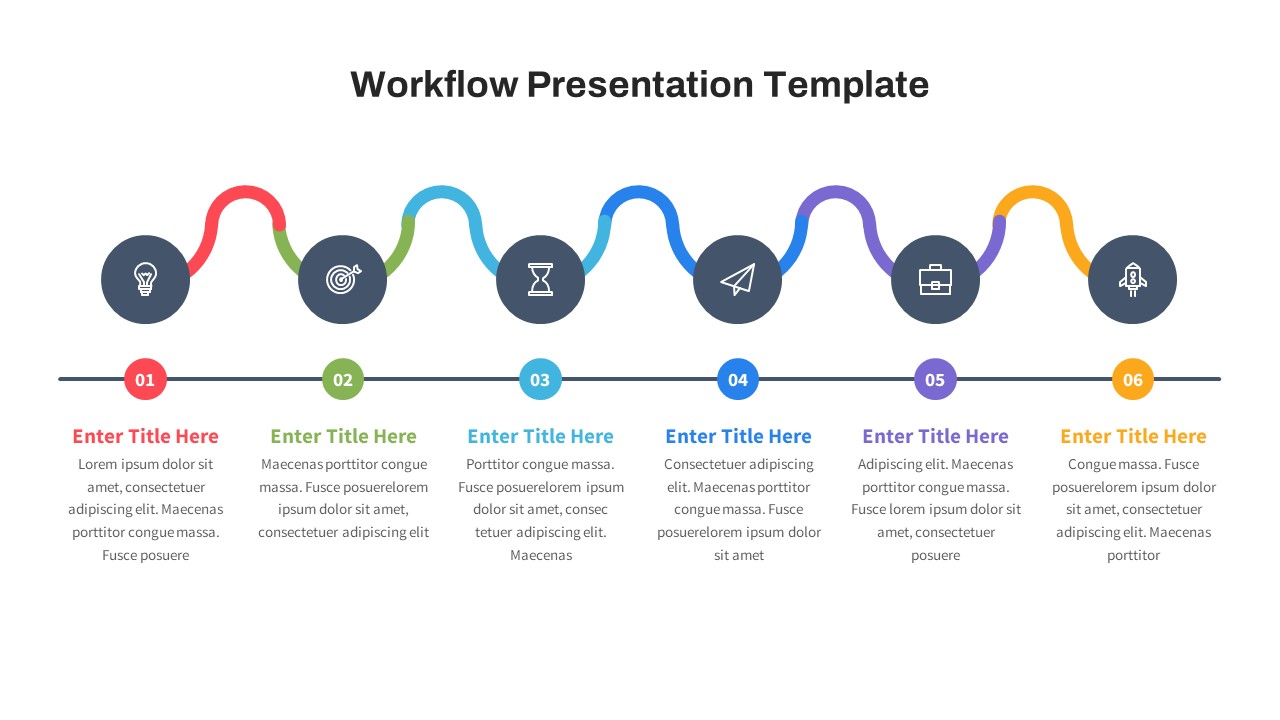
Free 6-Step Curved Workflow Timeline for PowerPoint & Google Slides
Timeline
Free
Multicolor Alternating Timeline Roadmap Template for PowerPoint & Google Slides
Timeline
Roman History Timeline Presentation Template for PowerPoint & Google Slides
Decks
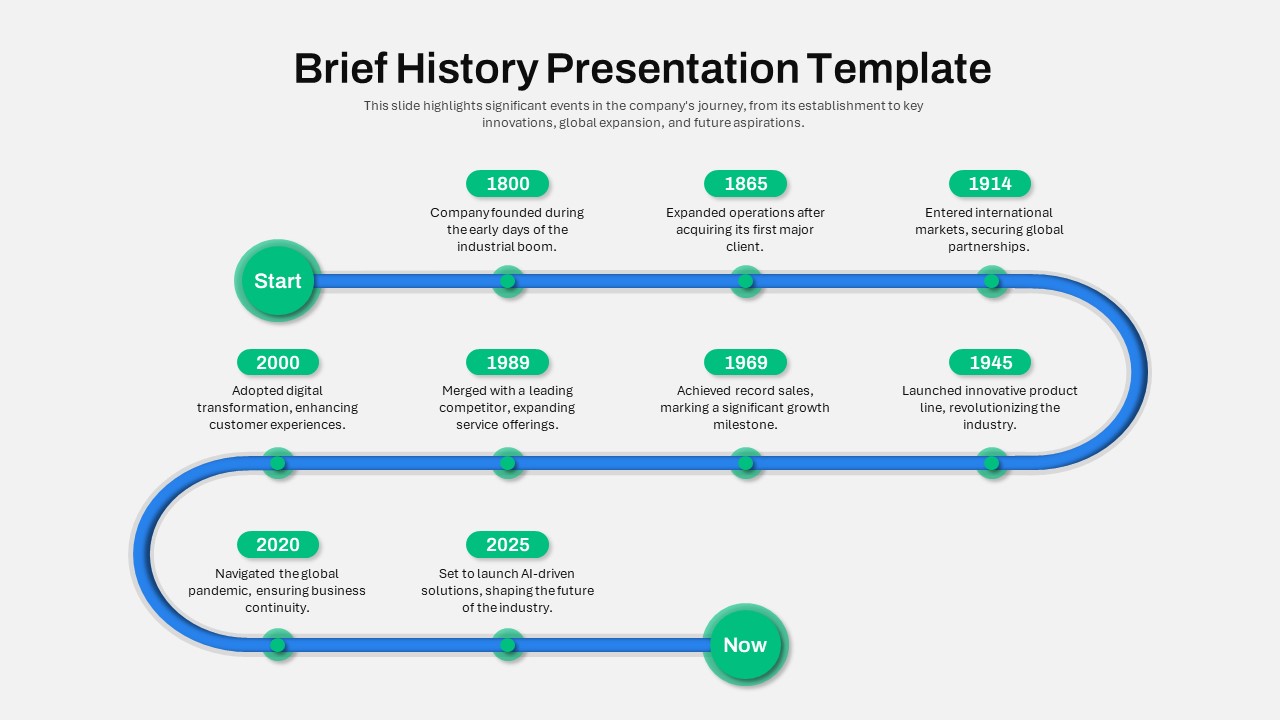
Brief History Timeline Infographic Template for PowerPoint & Google Slides
Timeline
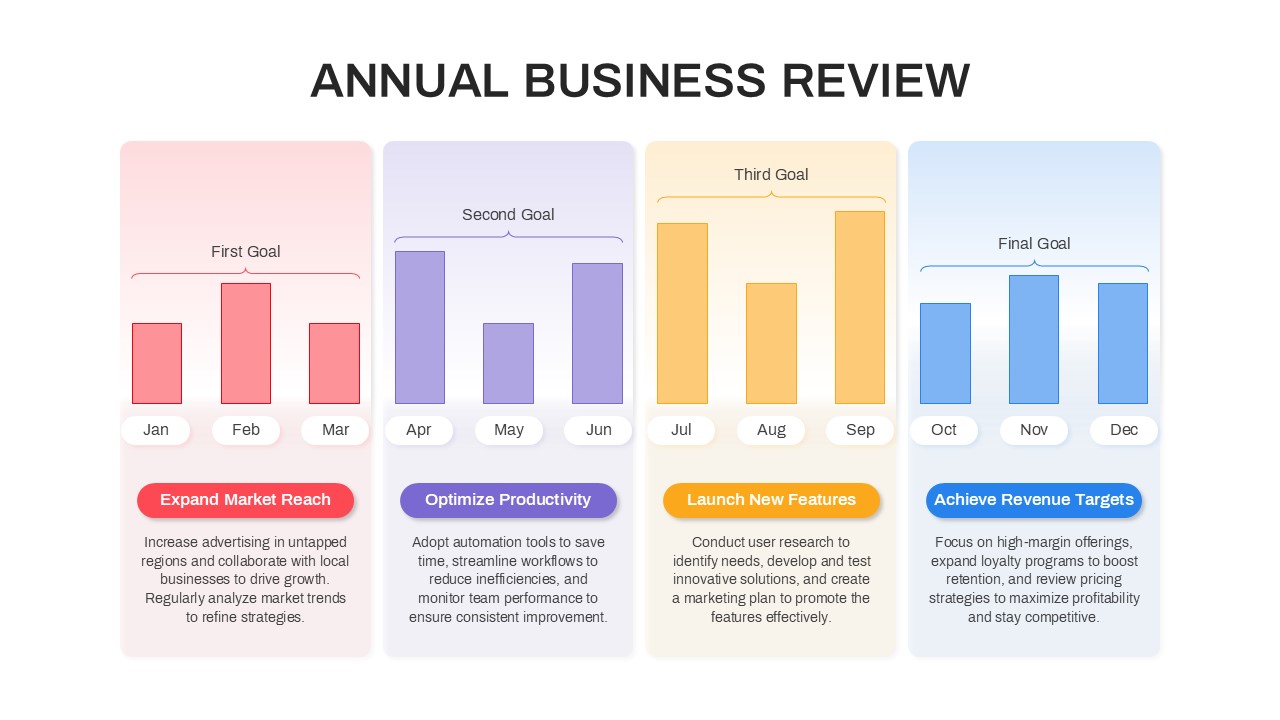
Annual Business Review Timeline Template for PowerPoint & Google Slides
Timeline
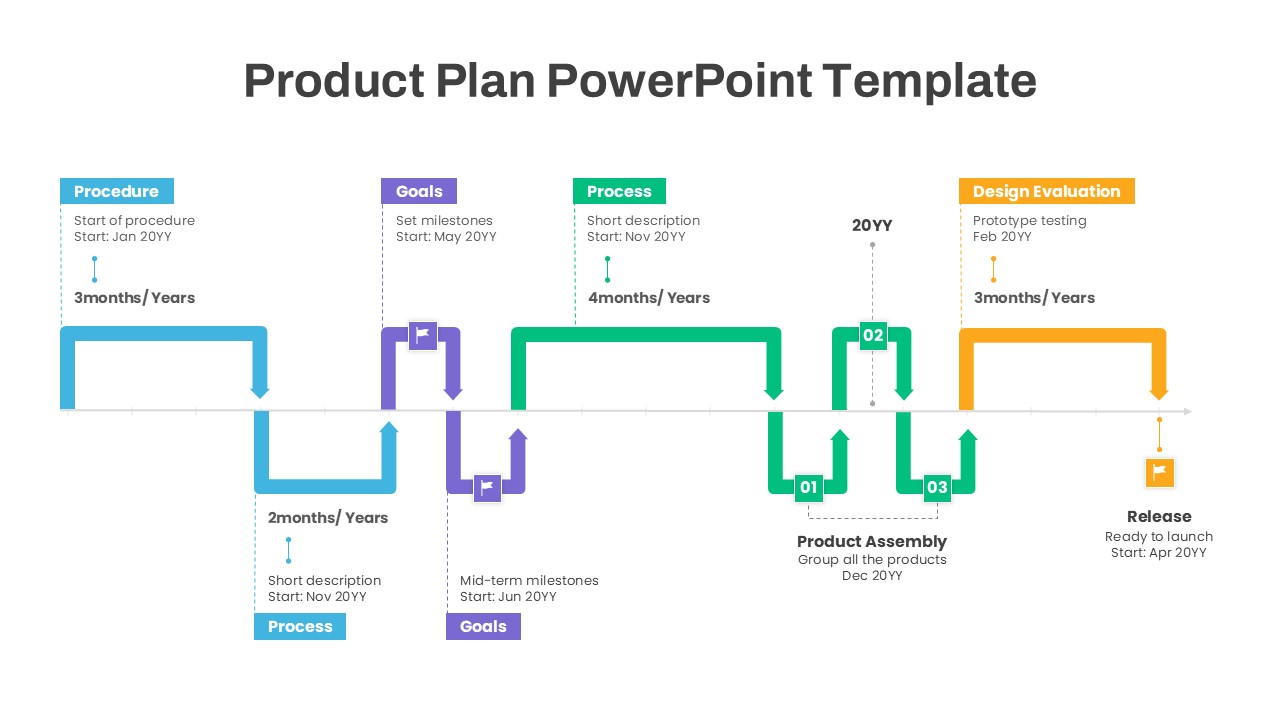
Product Plan Timeline and Milestones Template for PowerPoint & Google Slides
Timeline
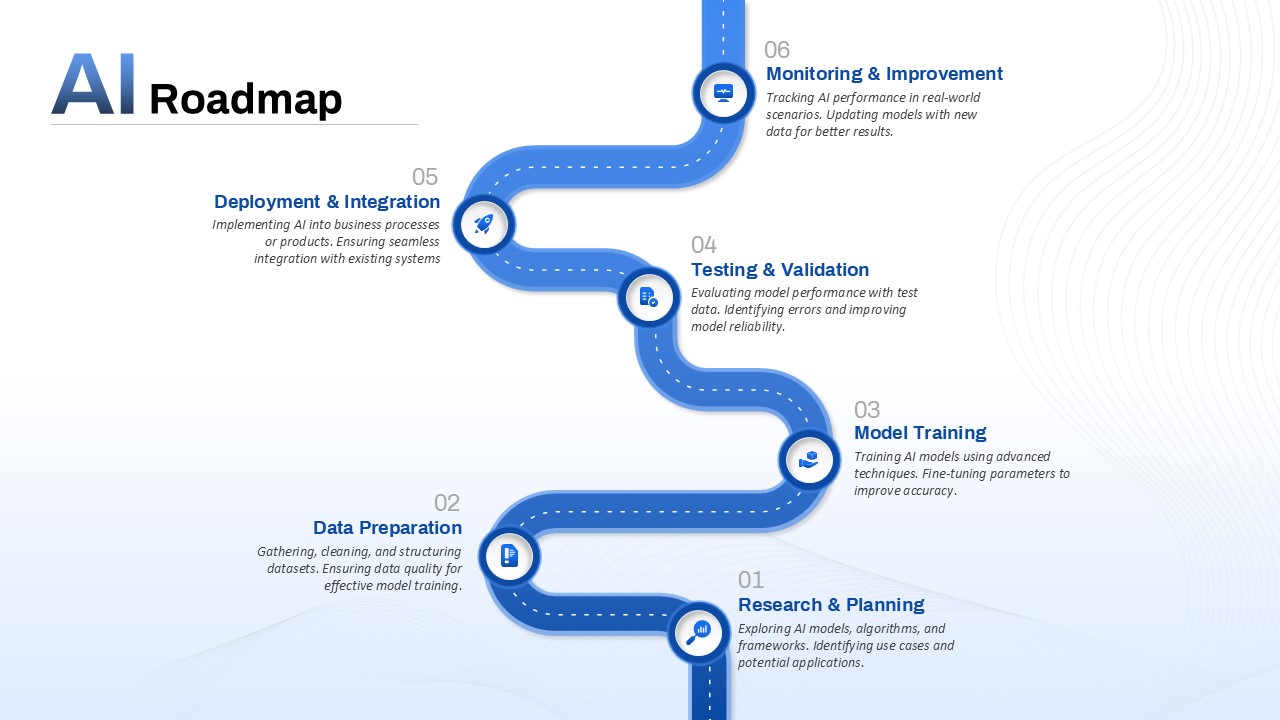
AI Roadmap & Planning Timeline Template for PowerPoint & Google Slides
Roadmap
Stacked Gantt Chart Timeline Slide Template for PowerPoint & Google Slides
Gantt Chart
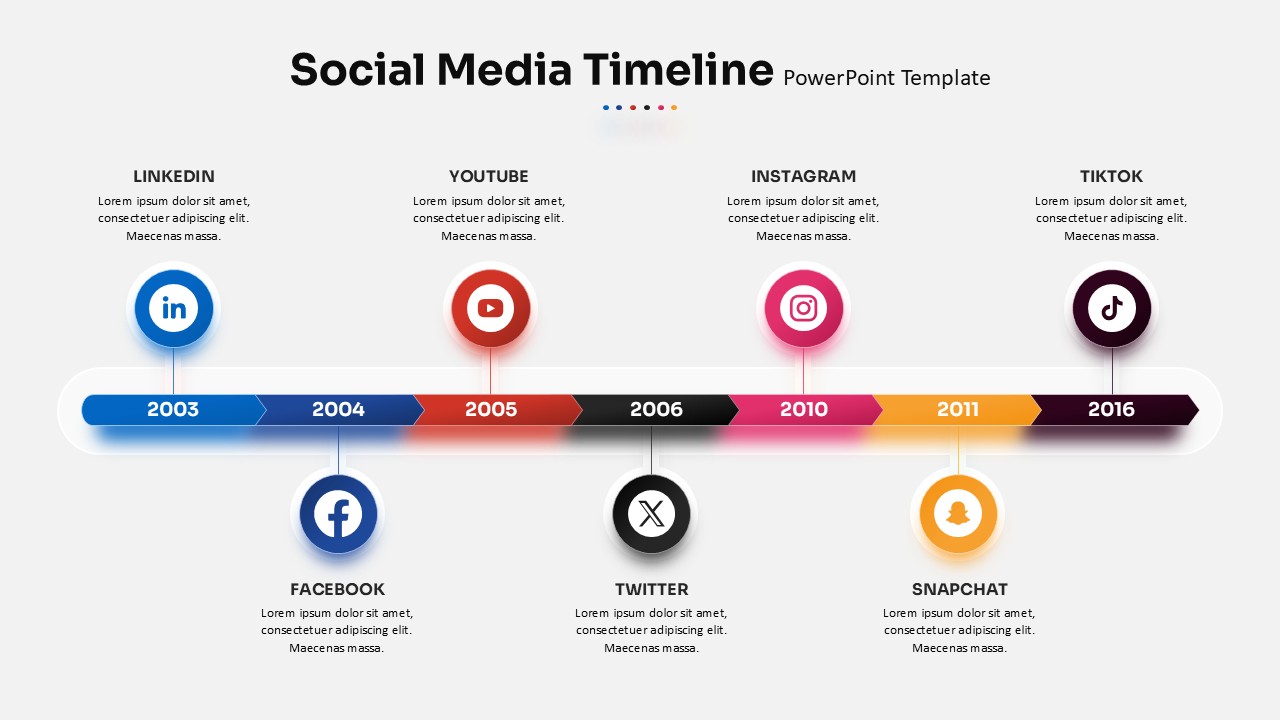
Social Media Timeline template for PowerPoint & Google Slides
Timeline
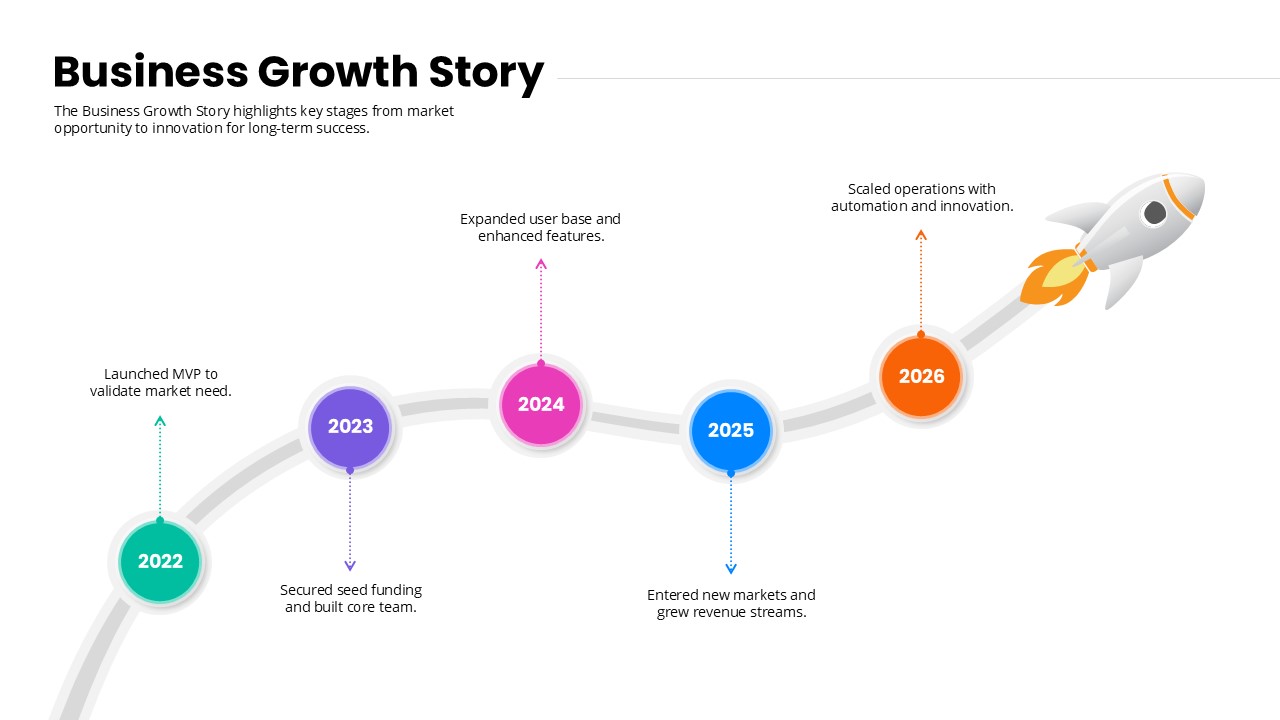
Business Growth Story timeline template for PowerPoint & Google Slides
Timeline
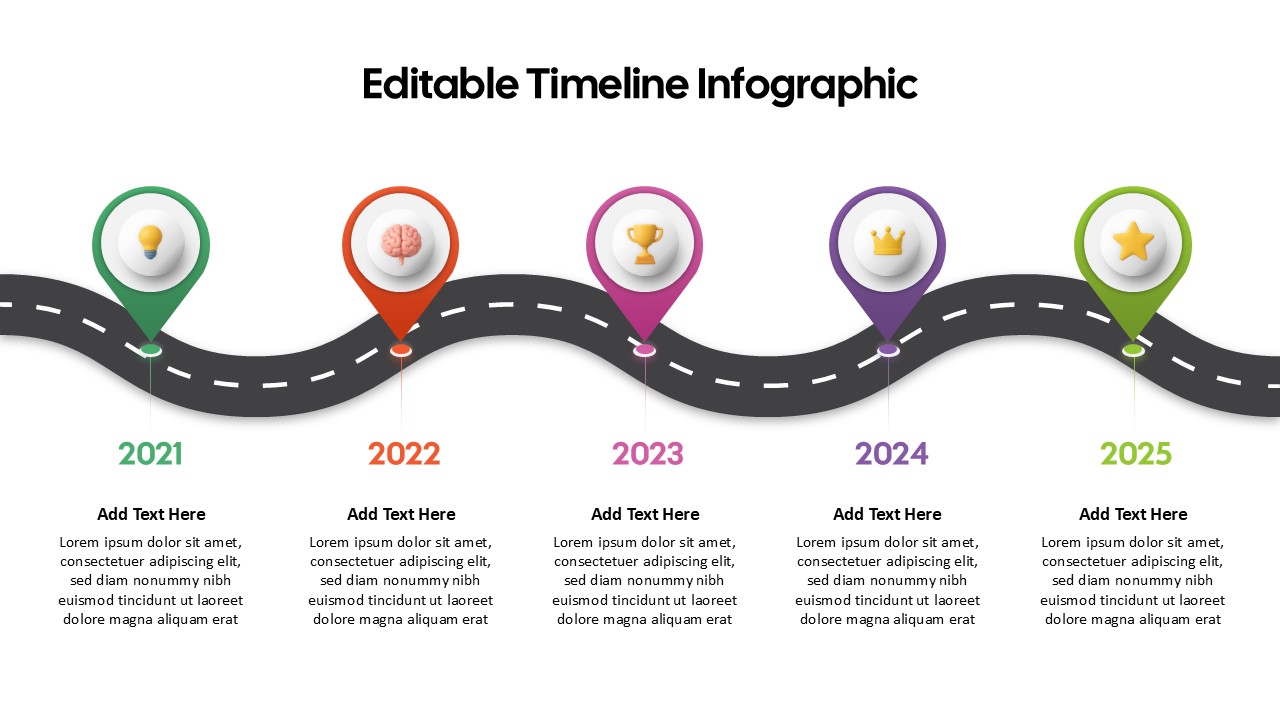
Curved Road Timeline Infographic Template for PowerPoint & Google Slides
Timeline
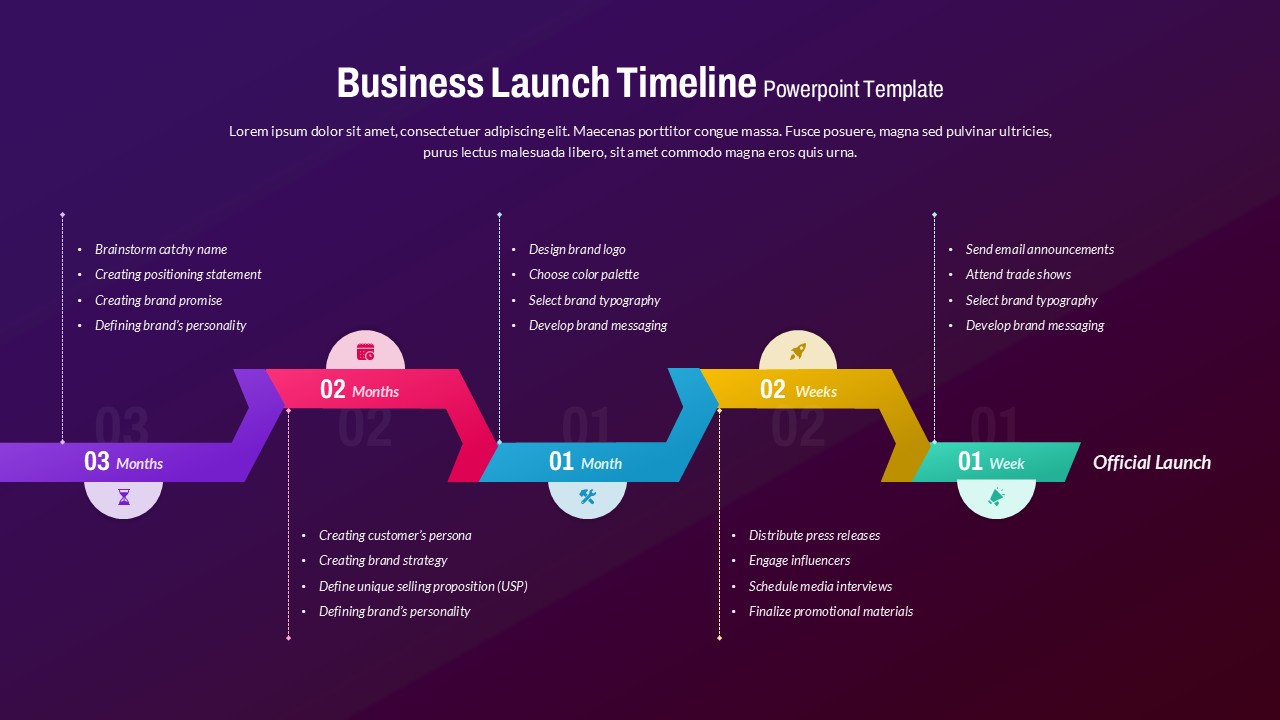
Business Launch Timeline Roadmap 5-Phase Template for PowerPoint & Google Slides
Business
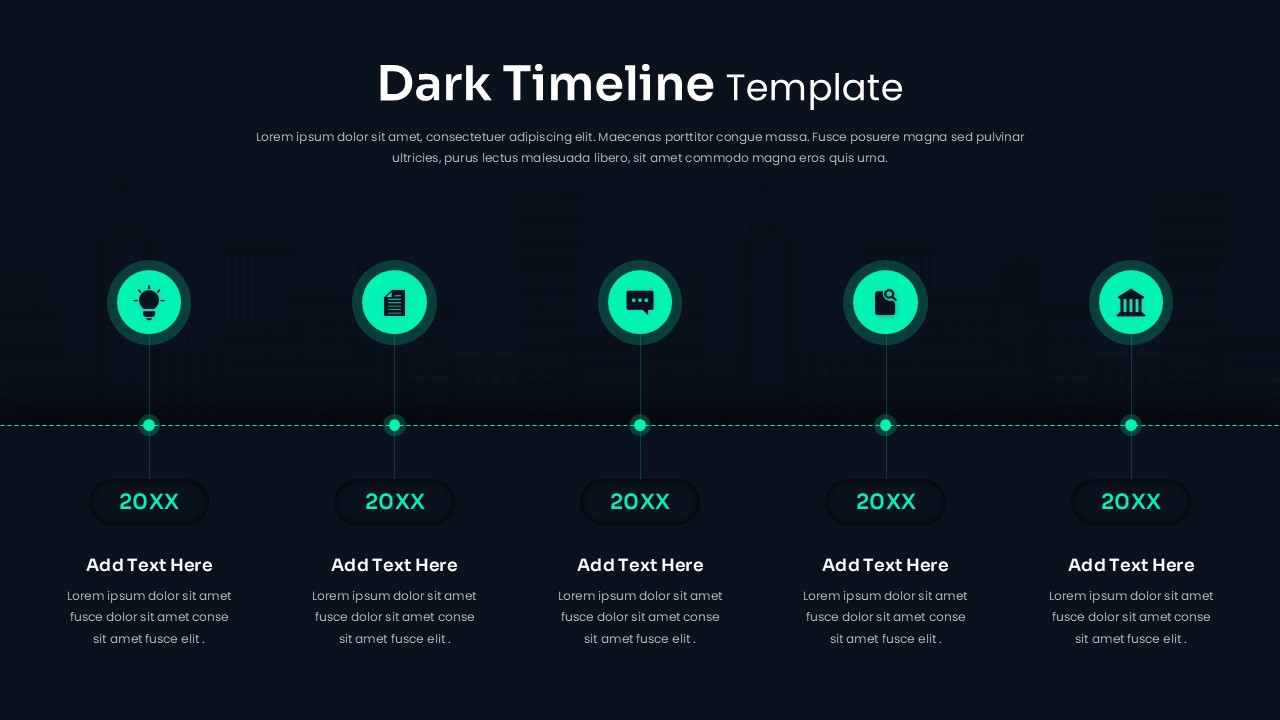
Dark Horizontal Timeline Infographic Template for PowerPoint & Google Slides
Timeline
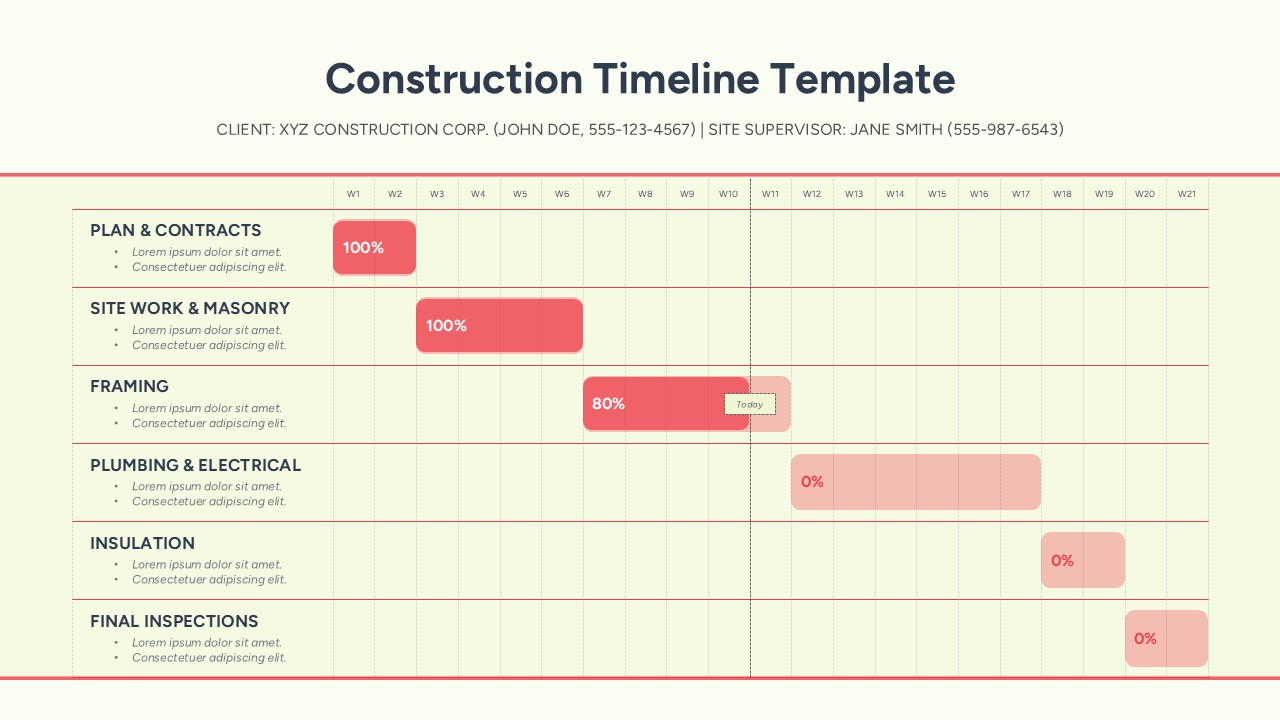
Construction Timeline Template for PowerPoint & Google Slides
Timeline
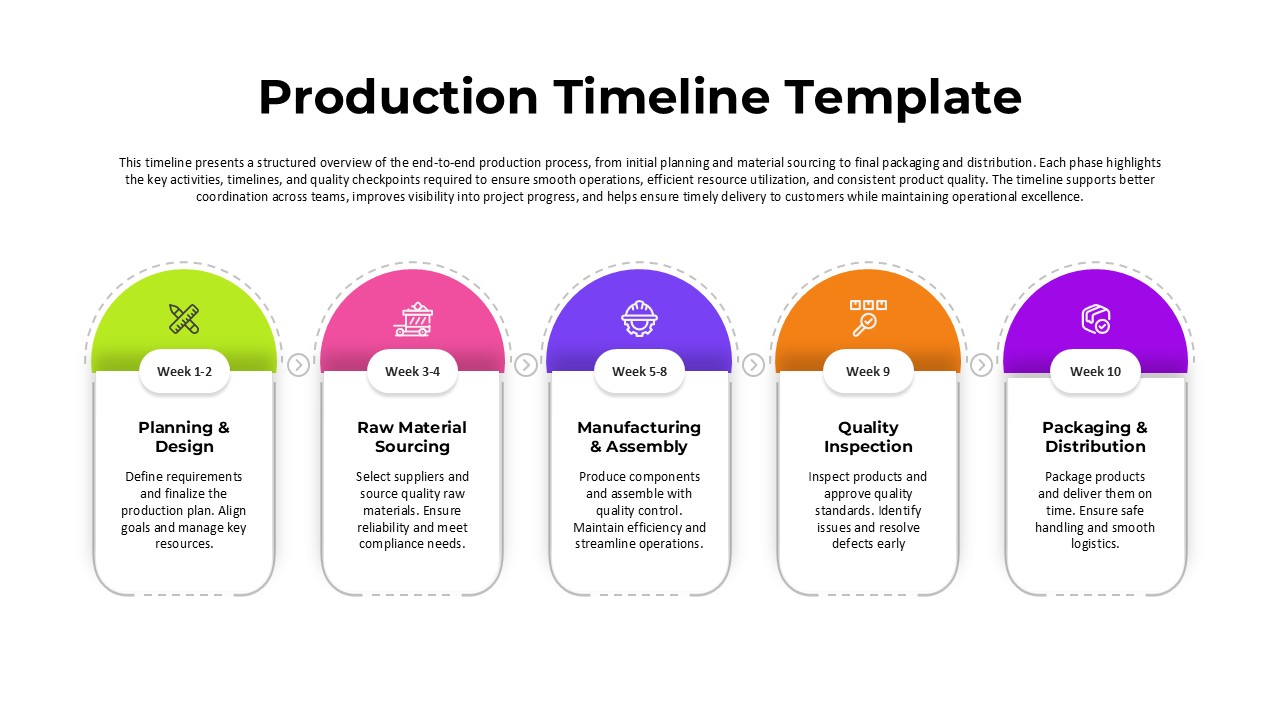
Production Timeline Template for PowerPoint & Google Slides
Timeline
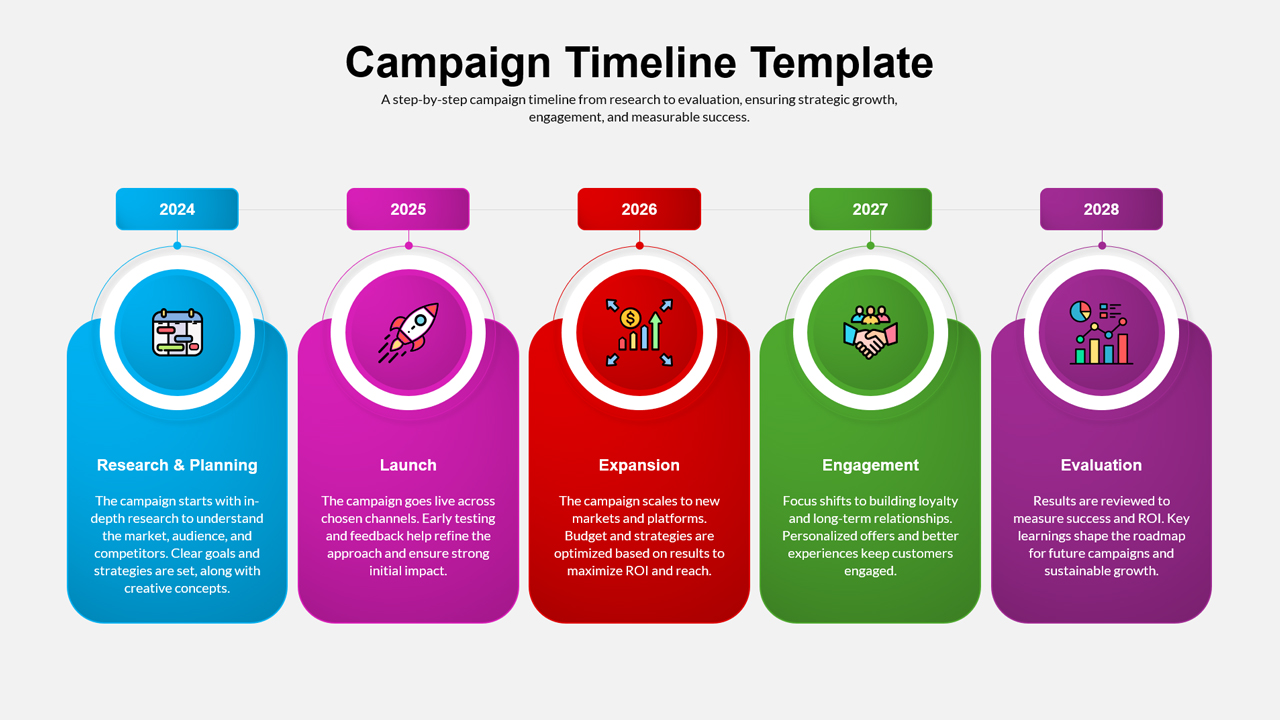
Campaign Timeline Marketing Roadmap Slide Template for PowerPoint & Google Slides
Timeline