
















3D Spheres Section Diagram PowerPoint Template


3D Spheres Diagram Design for PowerPoint and Keynote
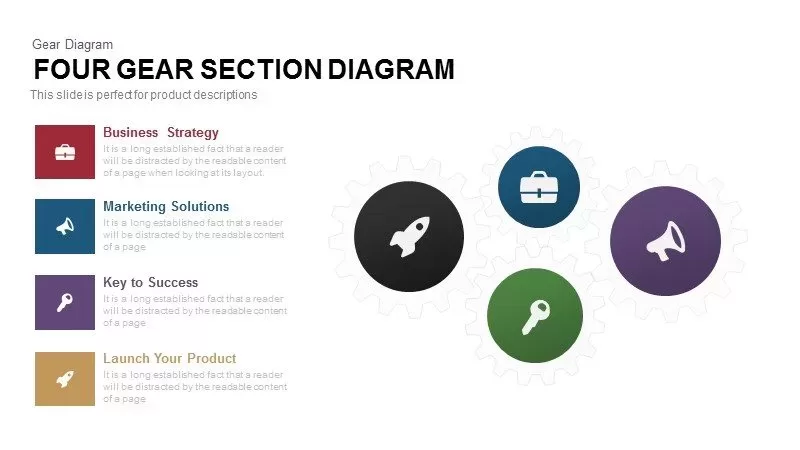
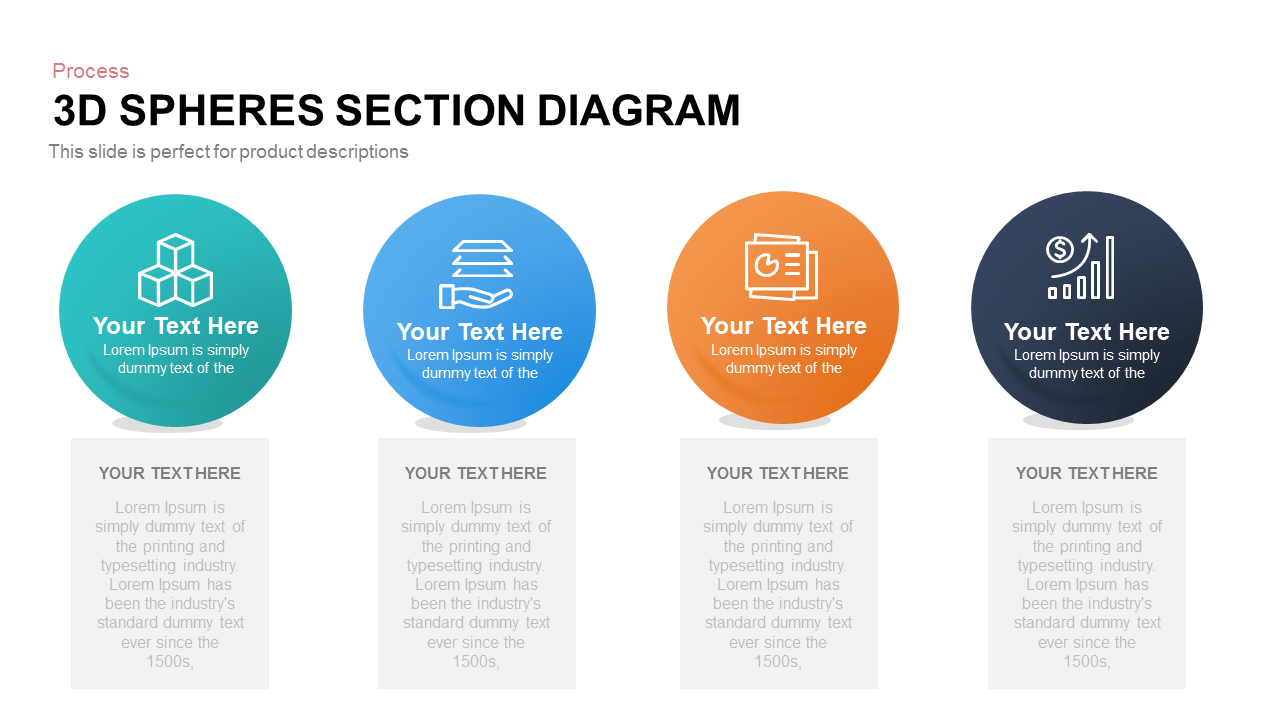
The generic design of 3d spheres diagram design for PowerPoint presentation may consume any topic under the sun. The diagram template is created as a general-purpose PowerPoint. The simple and elegant slide contains four circles and each circle has a descriptive text zone for more explanatory notes and a topic placeholder in the middle of the circles. The circle also contains infographics icons which will make extra decorations for your presentation. The infographic icons include; steps, the hand with documents, tag, and statistical graph. Each icon represents a different type of topic. For example, the steps icons look like a podium represents the goal-oriented mode of presentation, which indicates the growth of professional and personal life. The second icons hand with documents symbolizes the importance of knowledge exploration. If you are ready to start a new venture, you must have better knowledge of that field. Similarly, users can utilize the meaning of the other two icons.
Section diagram PowerPoint template created with three-dimensional effects. The customizable diagram allows a complete makeover of the shapes and effects. The color combination and the text font sizes are also changeable. The presenter can use the generic design for a variety of presentations and the simple effects and shapes ensure the attention of the audience. You can access more process flow templates & powerpoint 3d shapes here. Grab the free ppt here.
3d spheres diagram design for PowerPoint is very elementary and contains four 3D spheres ranged horizontally in blue, orange, black, and green colors. Under each sphere, there is a square text box wherein you can write a detailed description for each associated concept. You also have an option to write content or title inside the sphere as well. The 3d Spheres Section Diagram Design is obtainable in white and black background and can be used to indicate the various elements in an organization, a process, market study, types of audience, financial sources, etc. The slide is very self-explanatory and can be used in any field from medicine, academic, human resources, management, business, etc. The template is designed in both PowerPoint and keynote.
Login to download this file

Item ID
SB00315


Related Templates

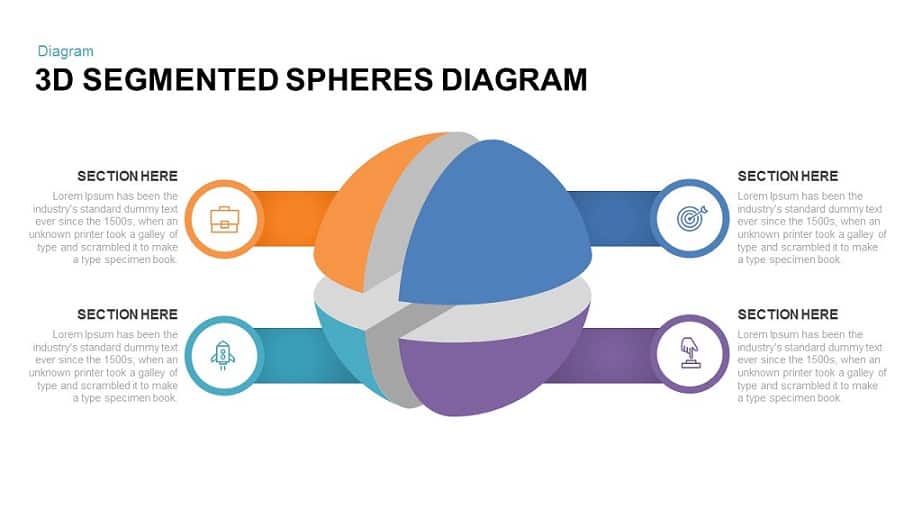
3D Segmented Spheres Diagram template for PowerPoint & Google Slides
Infographics

3D Spheres Sliced Diagram for PowerPoint Presentation
Infographics

3D Spheres Connected PowerPoint Template and Google Slide Template
Process
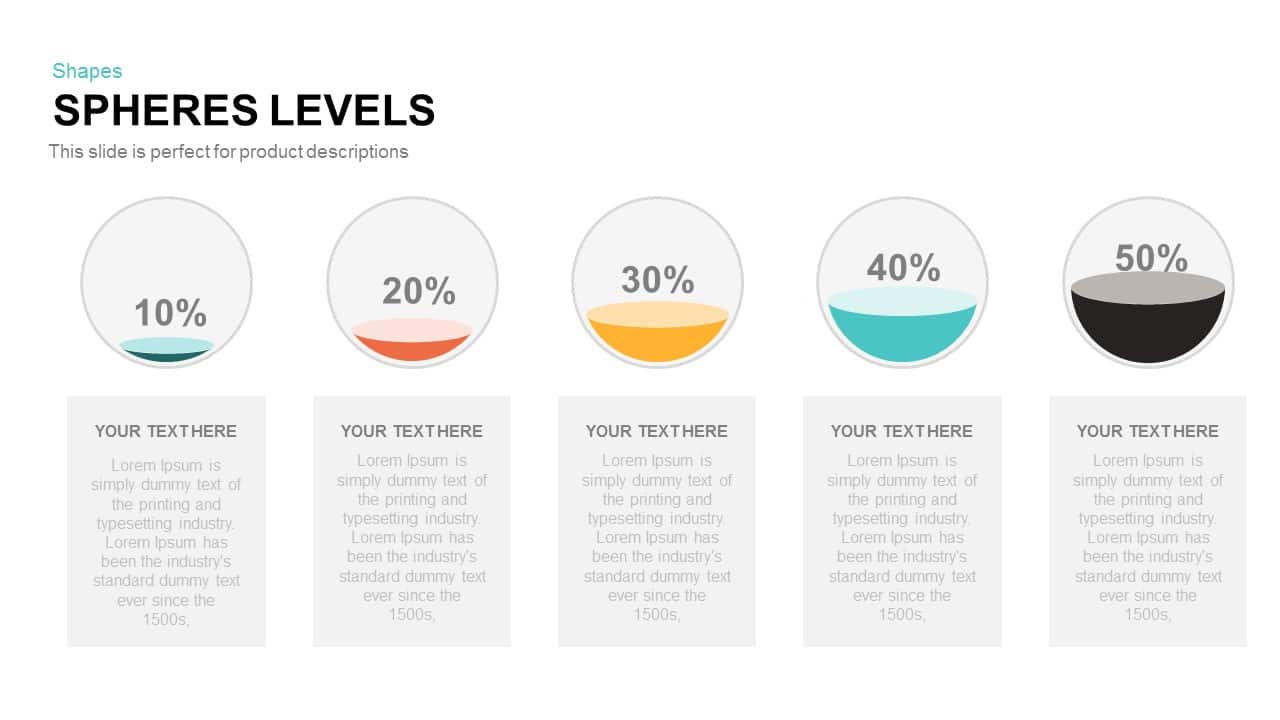
Spheres Levels PowerPoint Template
Infographics
3D Spheres Fill Level Infographic Deck Template for PowerPoint & Google Slides
Comparison
6 Section Diagram PowerPoint Template
Circular
4 Section Pipe Diagram PowerPoint Template
Process
3D Layer Section Diagram PowerPoint Template
Circular
Eight Section Circular Diagram Template for PowerPoint & Google Slides
Circular
Eight Section Circular Diagram PowerPoint Template
Circular
5 Section Arrow Diagram Template for PowerPoint
Arrow

4 Section Gear Diagram PowerPoint Template and Google Slide
Circular
3d Shaped Section Diagram PowerPoint Template and Keynote
Infographics
5 Section Circular Arrow Diagram PowerPoint Template
Circular
Business Section Diamond Process Diagram Template for PowerPoint & Google Slides
Process
Ten Section PowerPoint Diagram Template
Process
3 Section Triangle Diagram Template for PowerPoint
Process
Four Section Infographic Diagram Template for PowerPoint & Google Slides
Circular
4 Section Diagram template for PowerPoint & Google Slides
Infographics
Four Section Processes Diagram PowerPoint Template
Process