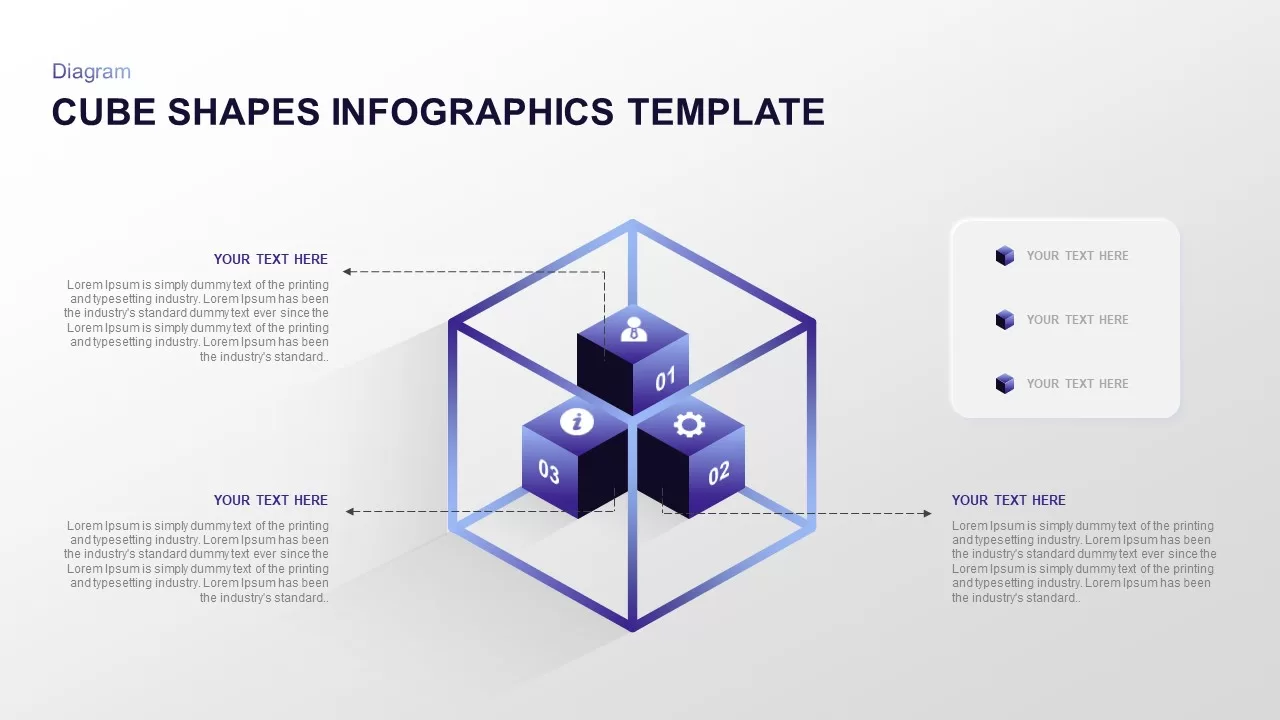
Versatile 3D Modular Shape Infographics Template for PowerPoint & Google Slides
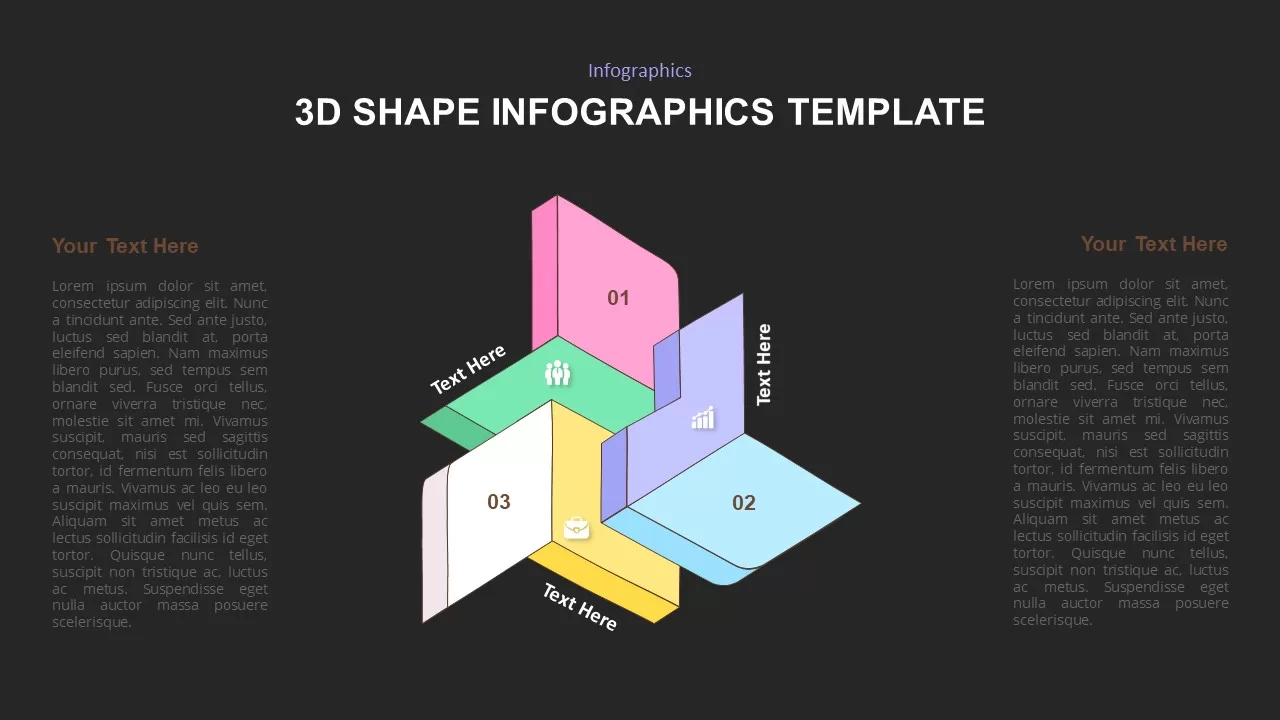
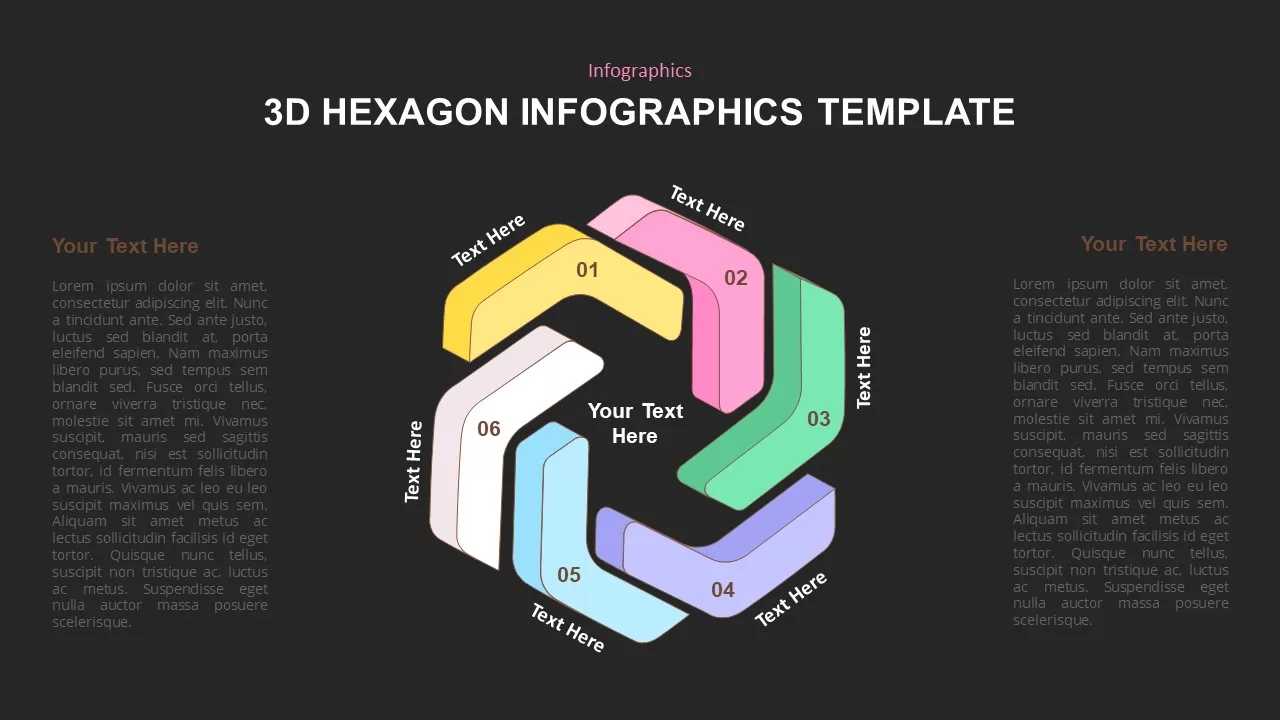

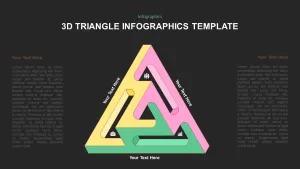


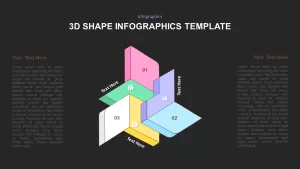
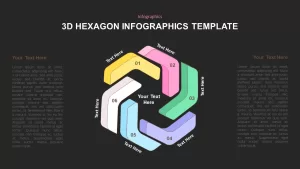
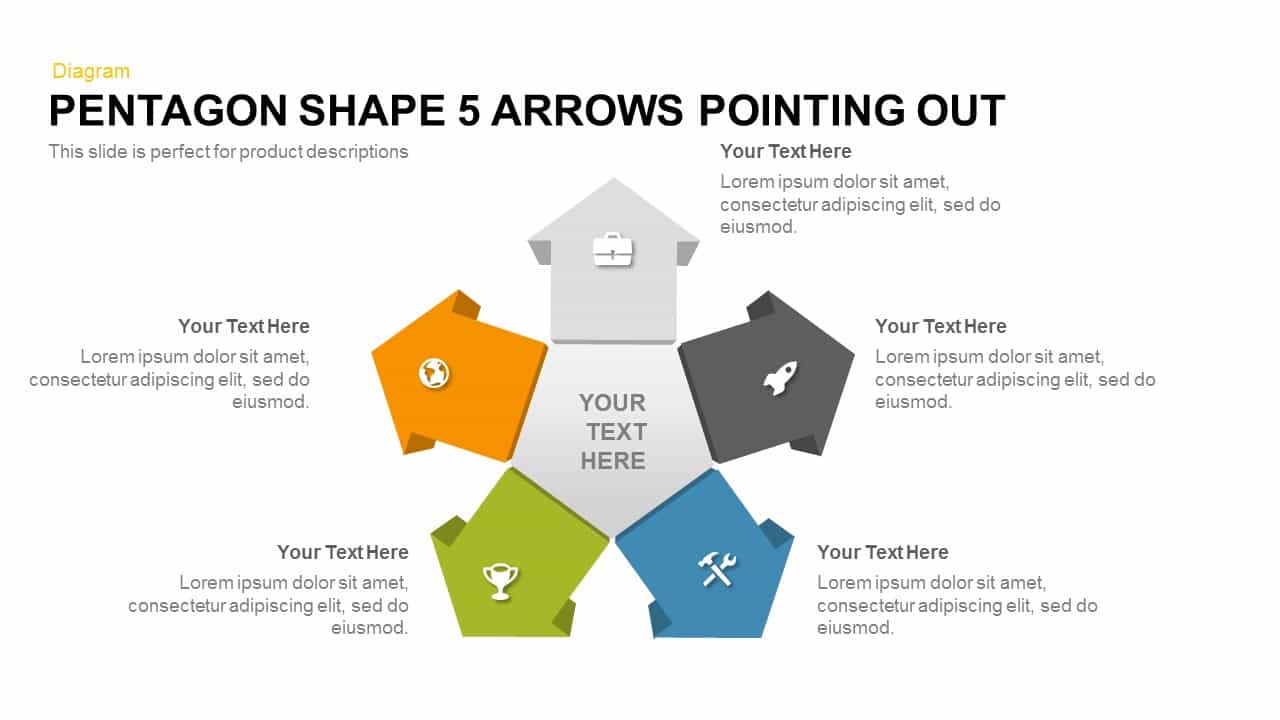
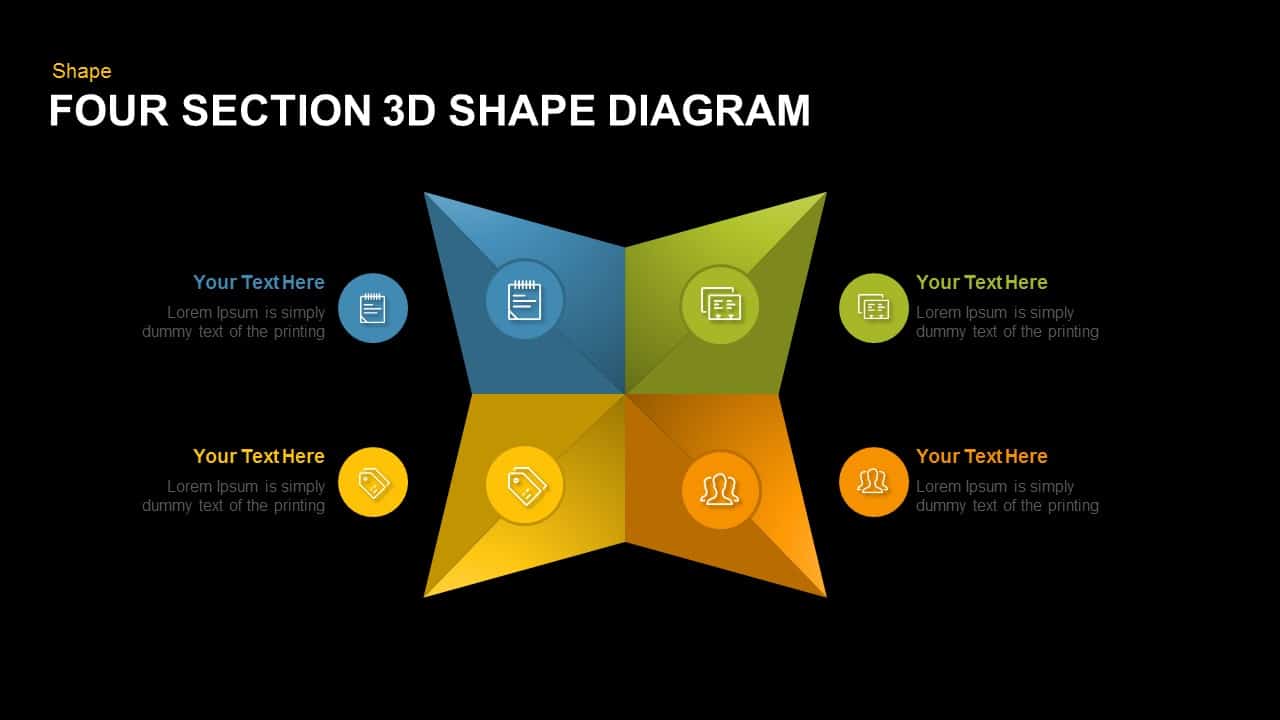
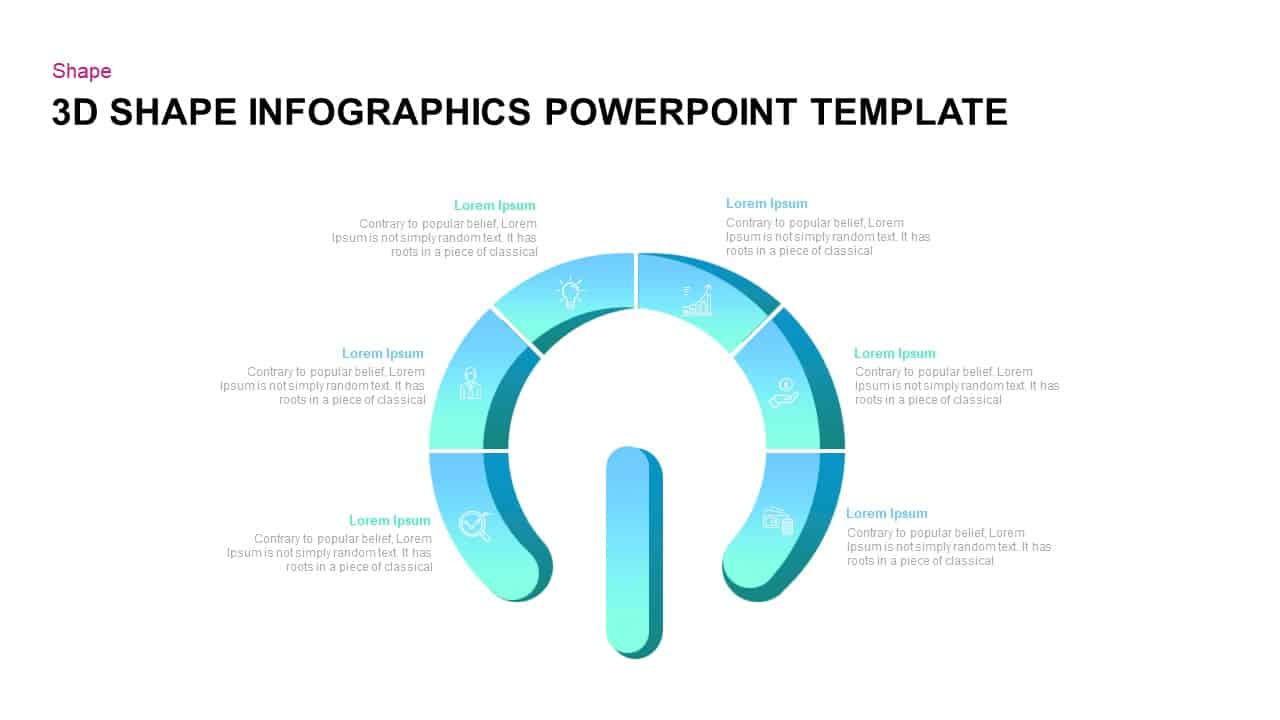
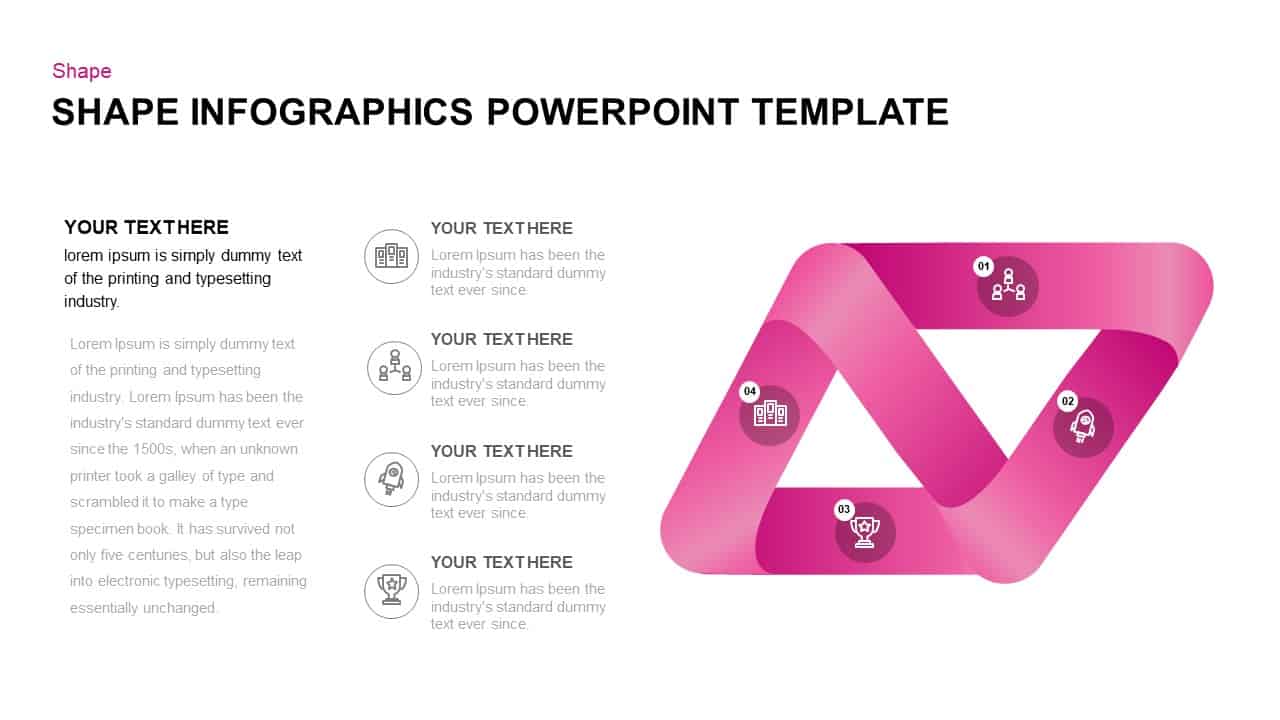
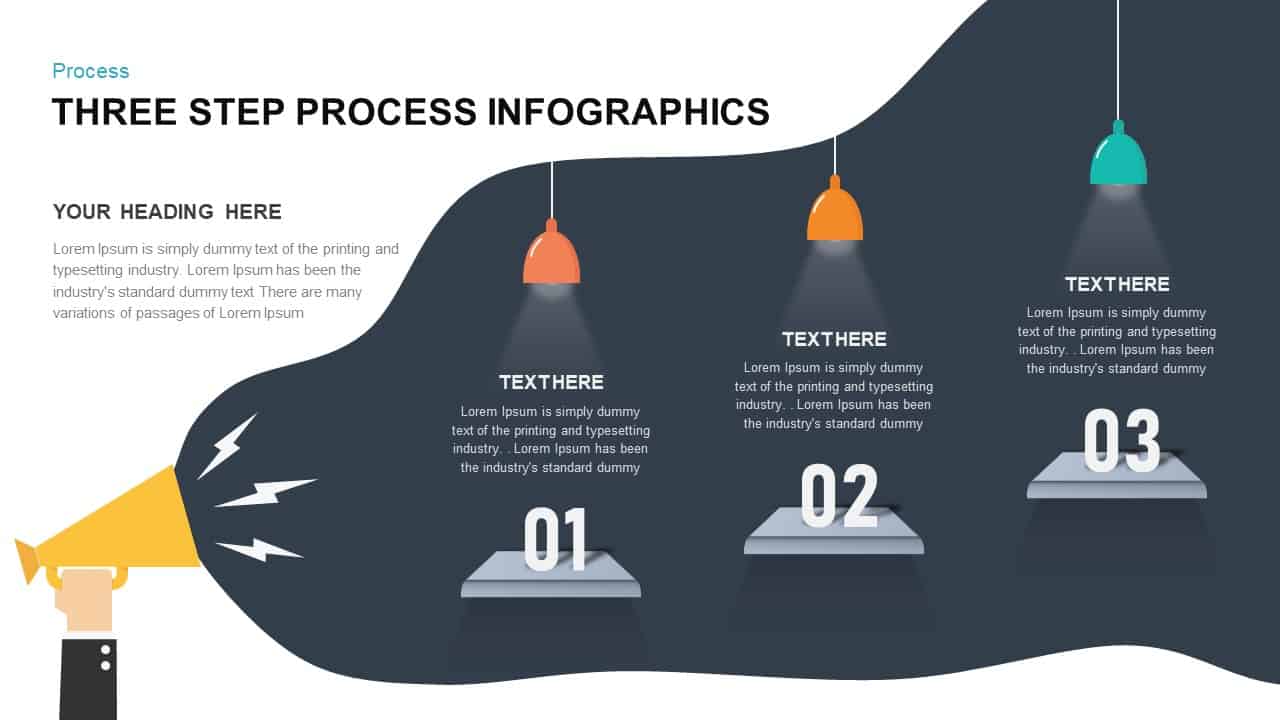
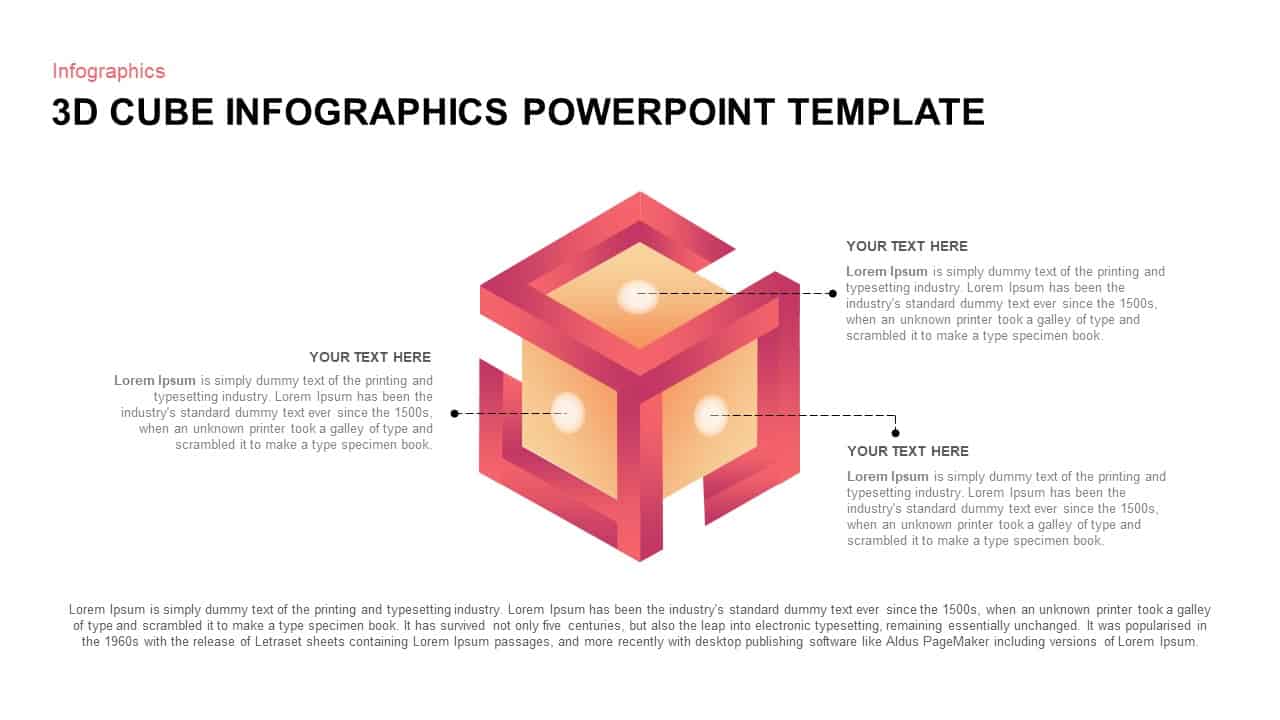
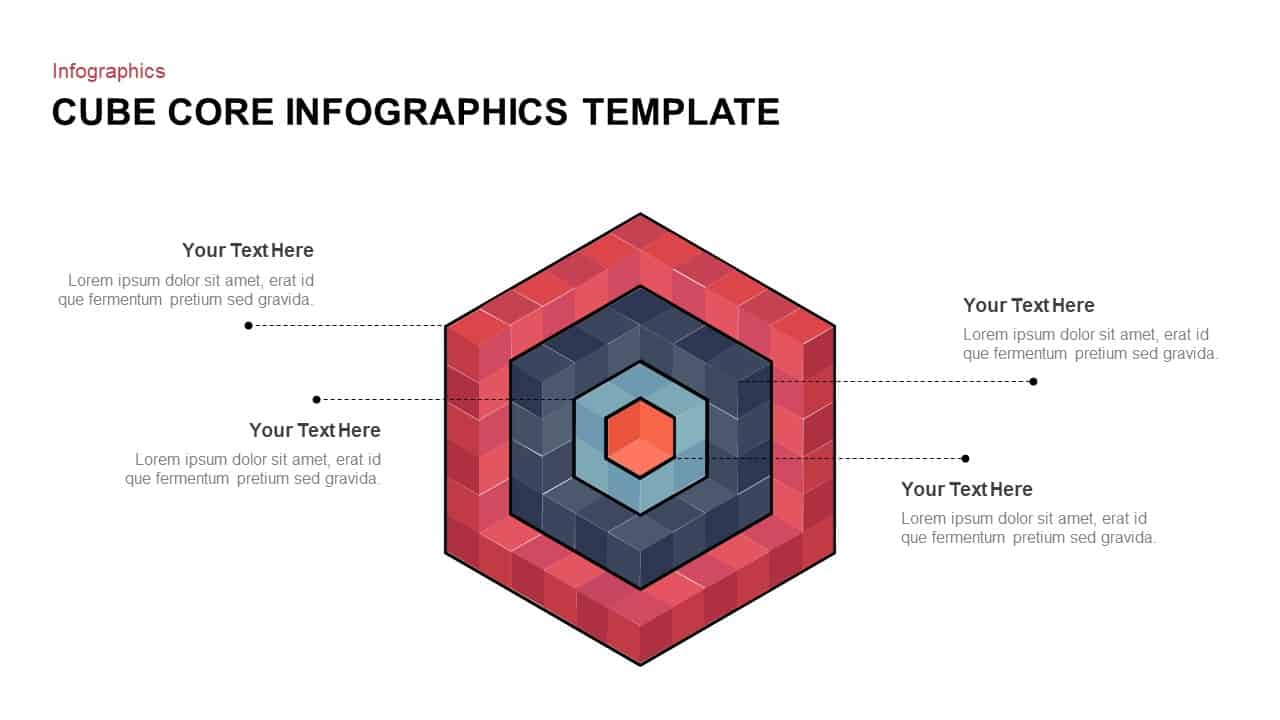
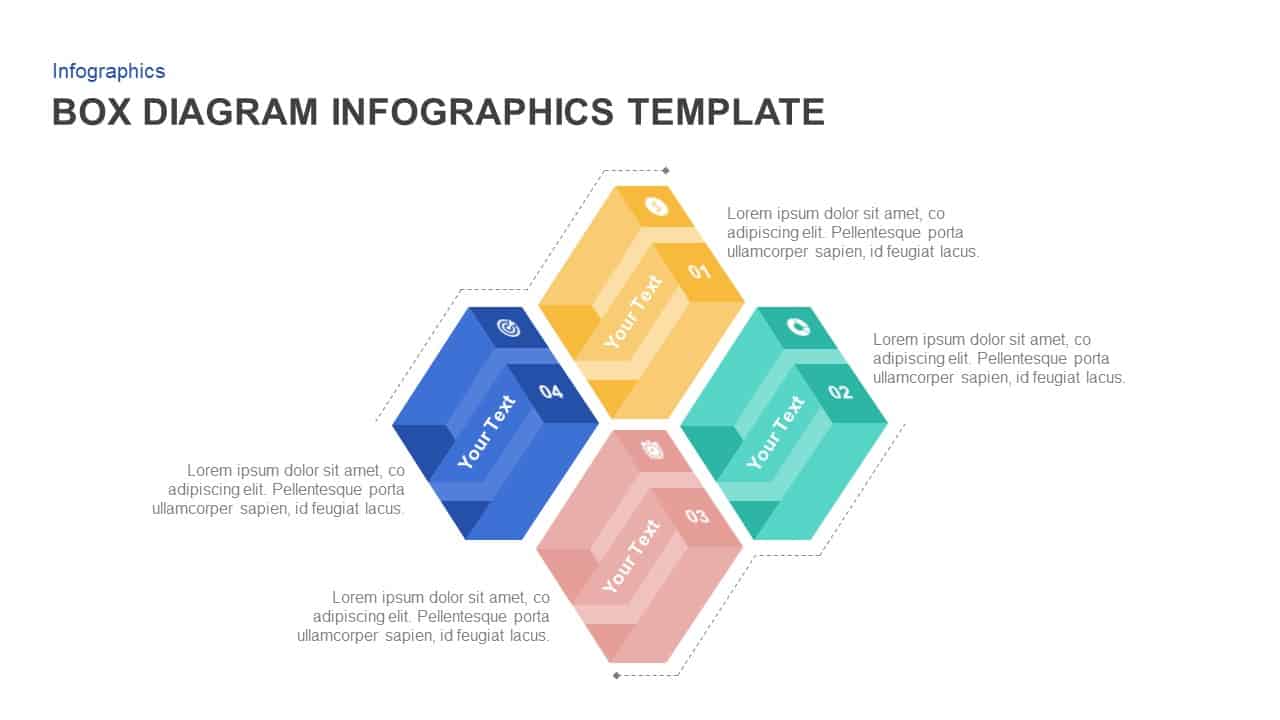
Leverage this dynamic 3D infographic template series to present complex information in a visually compelling, spatially engaging format. Choose from three interchangeable layouts—a three-segment triangular loop, a six-part hexagonal ring, or a bespoke modular shape configuration—each rendered in crisp 3D style with vibrant accent colors. Each segment features an integrated icon placeholder for metrics, team symbols, workflow arrows, or custom graphics paired with editable text labels, enabling you to highlight key points with clarity. The central area remains flexible for core titles or summary metrics, while outer segment callouts accommodate supporting details and directional guides.
Built on customizable vector shapes and integrated into master slides for PowerPoint and Google Slides, this template pack ensures seamless editing: recolor segments to match your brand palette, adjust extrusion depth, or swap icons in seconds with intuitive drag-and-drop controls. Alignment guides and grid snapping guarantee perfect placement, while theme color support lets you apply global color changes in a single click.
Beyond static layouts, leverage interactive hyperlinks to navigate sections or apply subtle entrance and exit animations to draw audience focus. Optimized for high-resolution displays and dual-platform consistency, the design maintains 3D depth and color fidelity on any device. Whether mapping project phases, illustrating hub-and-spoke frameworks, comparing strategic options, or training teams on multi-step workflows, these versatile infographics streamline data storytelling and boost engagement. With user-friendly placeholders and time-saving customization tools, you can craft professional-quality visuals in minutes, freeing you to refine insights and strategy.
Designed with global audiences in mind, this template supports right-to-left languages and includes accessible color contrast compliant with ADA guidelines. Export easily as high-resolution PDF or JPEG for print materials, or integrate into interactive reports. Whether preparing boardroom briefings, investor pitches, academic lectures, or online training modules, these infographics adapt to diverse contexts and audiences.
Who is it for
Business strategists, marketing managers, consultants, educators, project leaders, and data analysts who need to visualize processes, comparisons, or multi-part frameworks in a clear, engaging 3D format.
Other Uses
Repurpose these 3D infographics as process overviews, strategic roadmaps, project status trackers, sales funnels, or team organizational diagrams. Use individual segments to showcase KPIs, performance metrics, milestones, or resource allocation across marketing, finance, operations, or educational settings.
Login to download this file

Item ID
SB02029
Related Templates

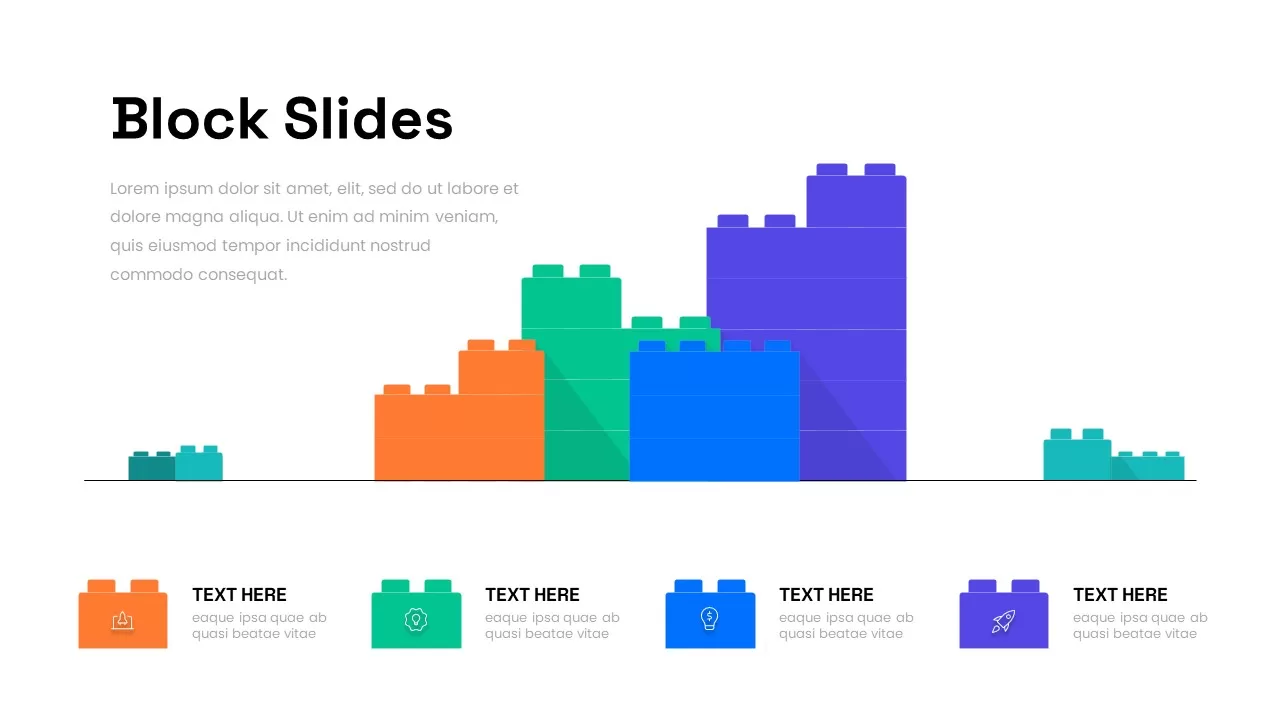
Modular Block Infographic Slide Template for PowerPoint & Google Slides
Infographics
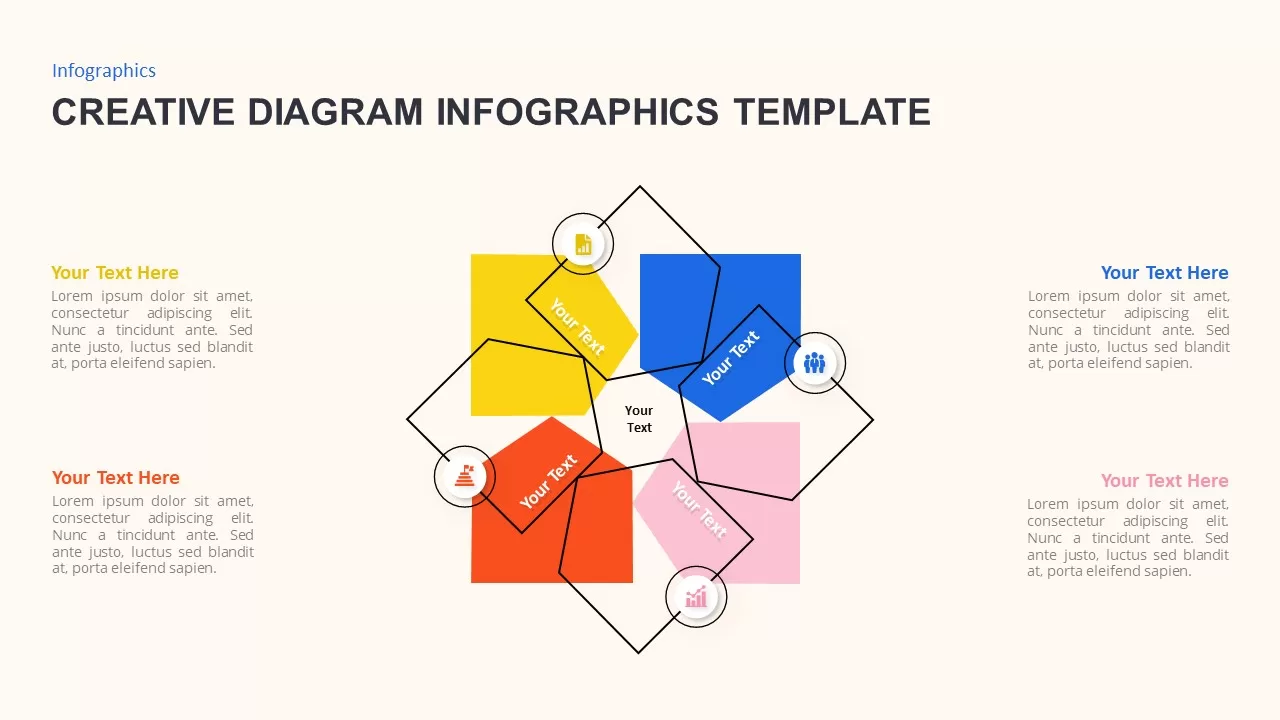
Versatile Creative Diagram Infographics Template for PowerPoint & Google Slides
Process
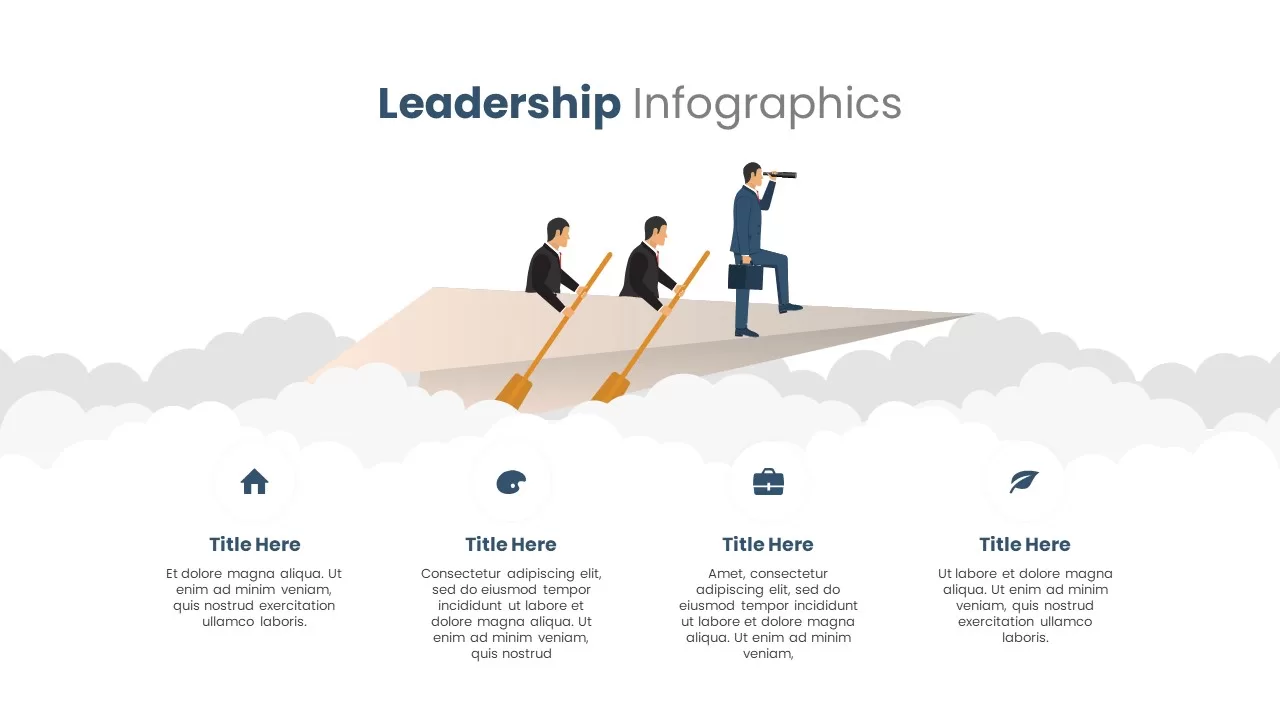
Versatile Leadership Infographics Template for PowerPoint & Google Slides
Infographics
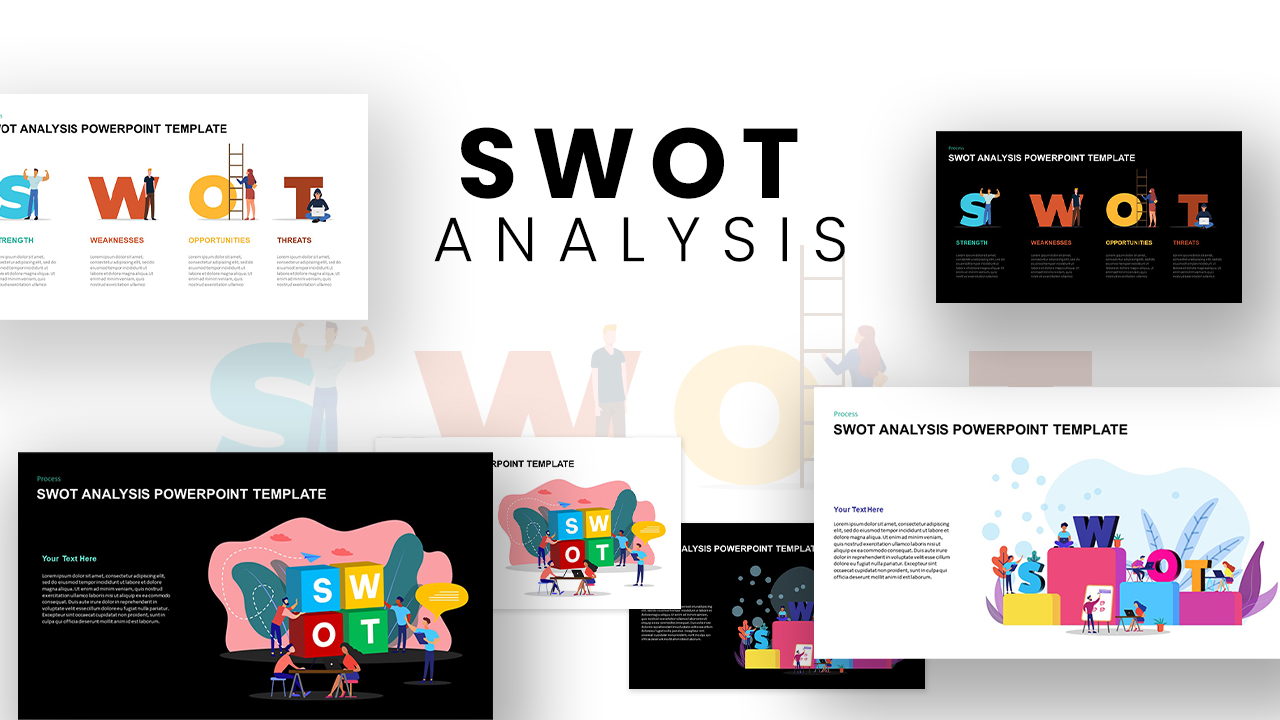
Versatile SWOT Analysis Slide Collection Template for PowerPoint & Google Slides
SWOT
Versatile Mind Map Infographic Template for PowerPoint & Google Slides
Mind Maps
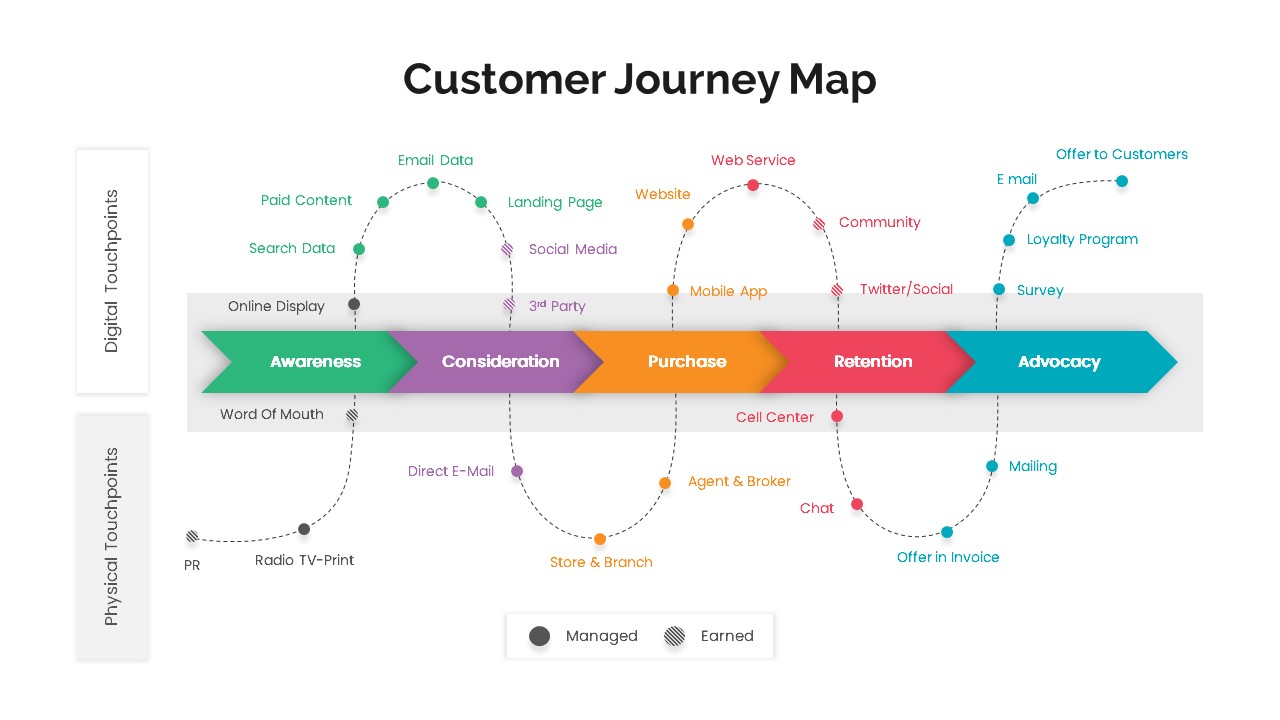
Versatile Customer Journey Map Template for PowerPoint & Google Slides
Customer Journey
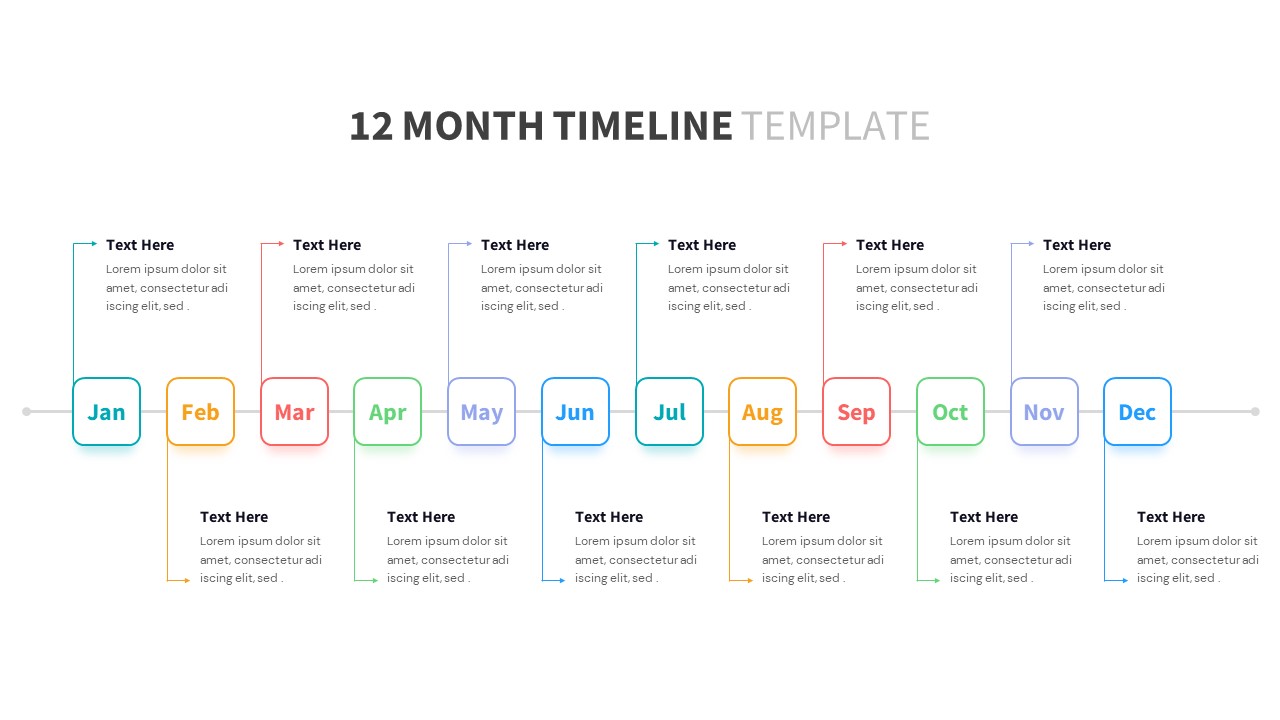
Versatile 12-Month Multi-Style Timeline Template for PowerPoint & Google Slides
Timeline
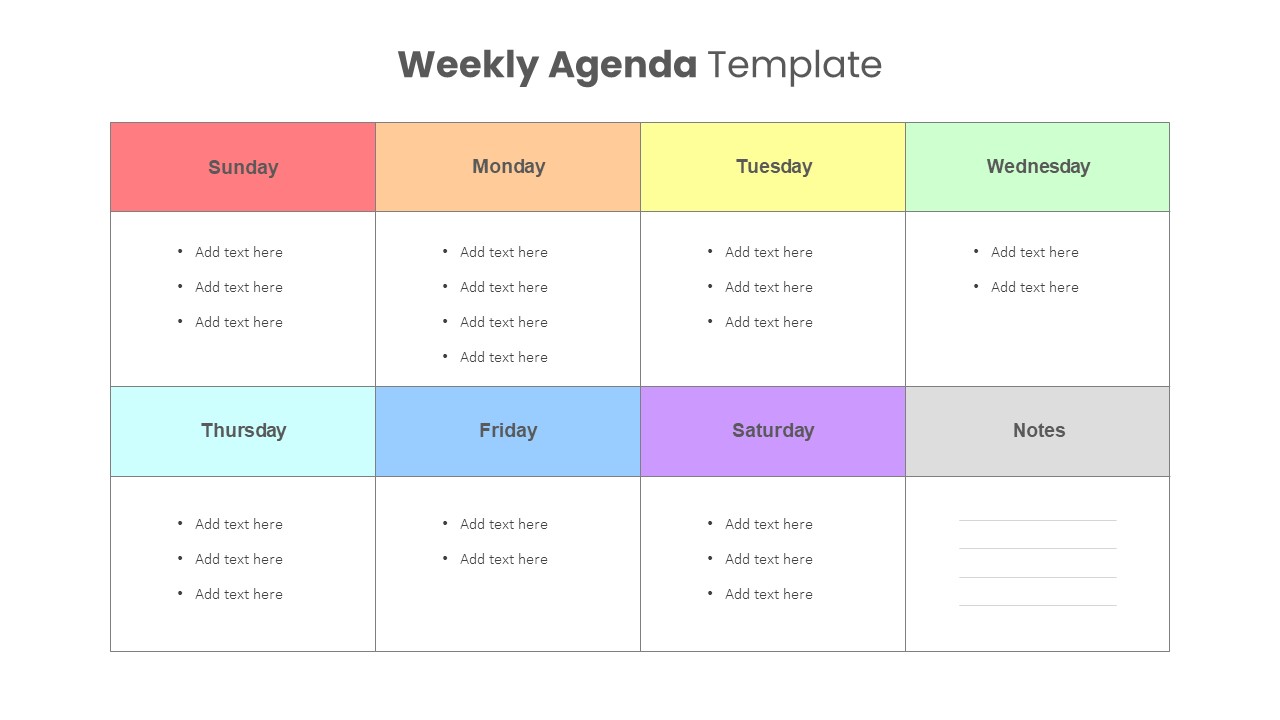
Versatile Weekly Agenda Planner Template for PowerPoint & Google Slides
Agenda
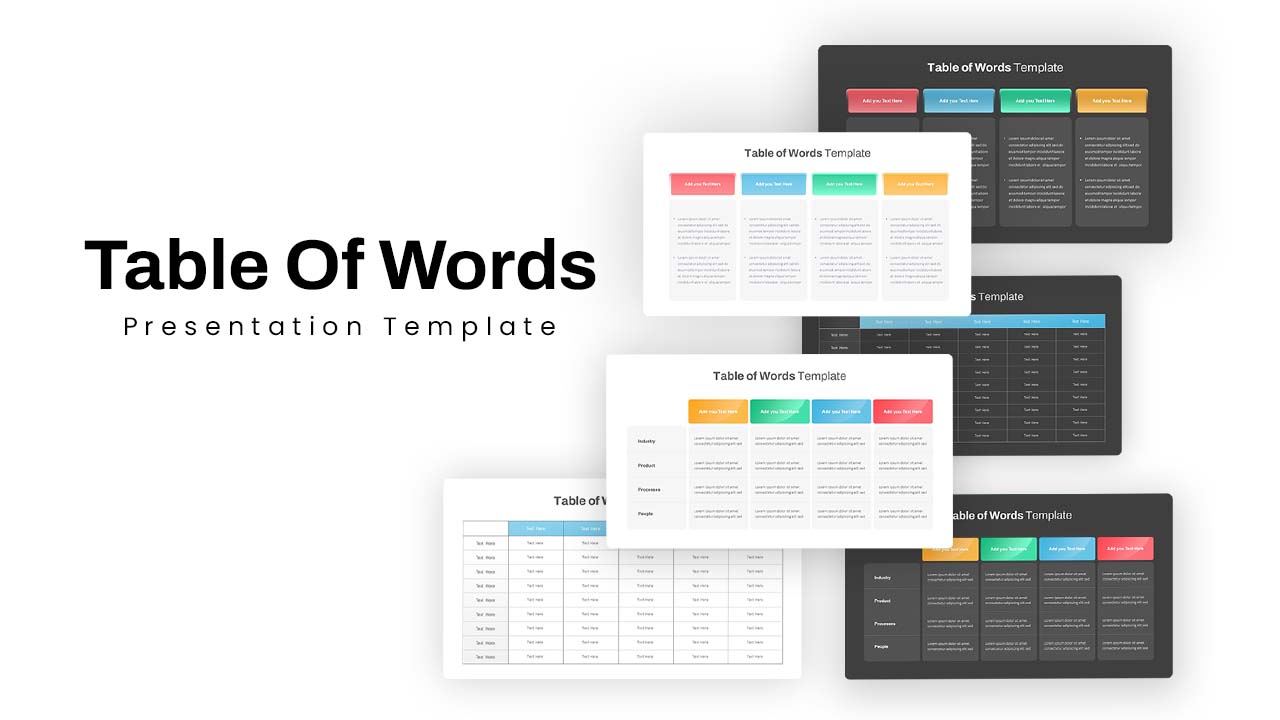
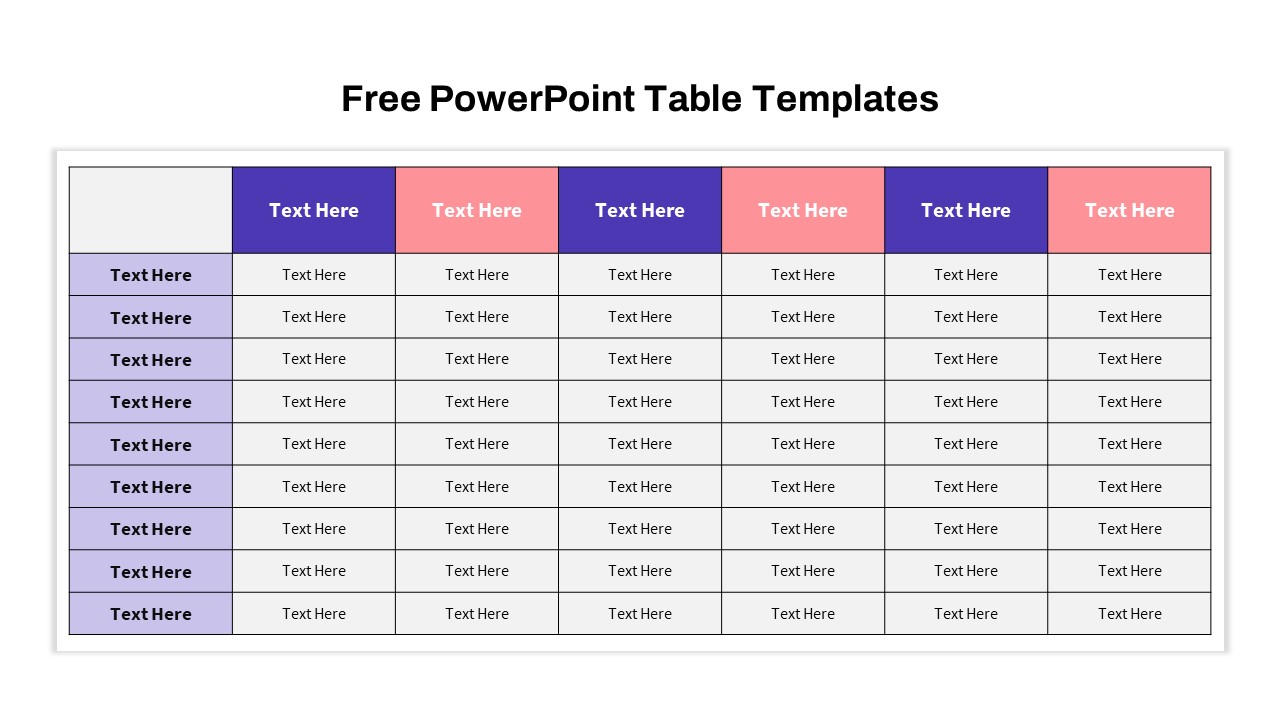
Versatile Table of Words Layout Template for PowerPoint & Google Slides
Table
Free Versatile Table Collection Template for PowerPoint & Google Slides
Pitch Deck
Free
Free Versatile Product Comparison Chart Template for PowerPoint & Google Slides
Charts
Free
Versatile Startup Roadmap Slide Pack Template for PowerPoint & Google Slides
Timeline
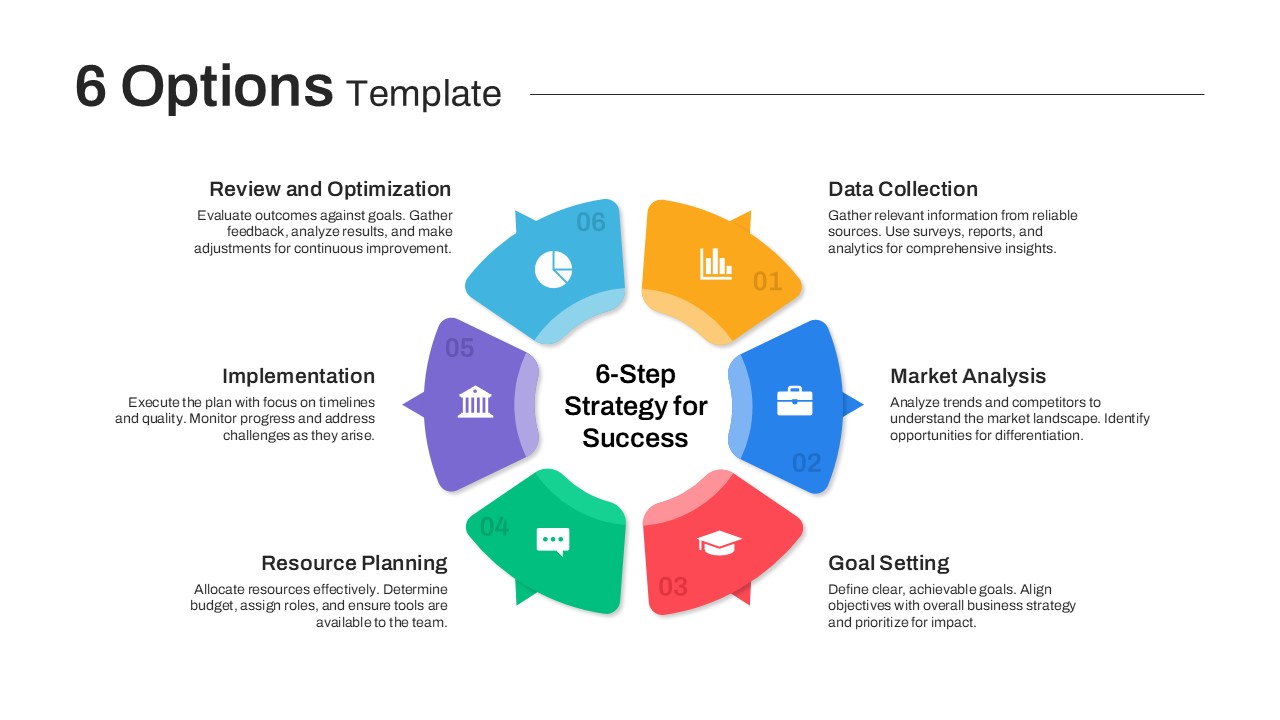
Versatile 6 Options Infographic Layout Template for PowerPoint & Google Slides
Process
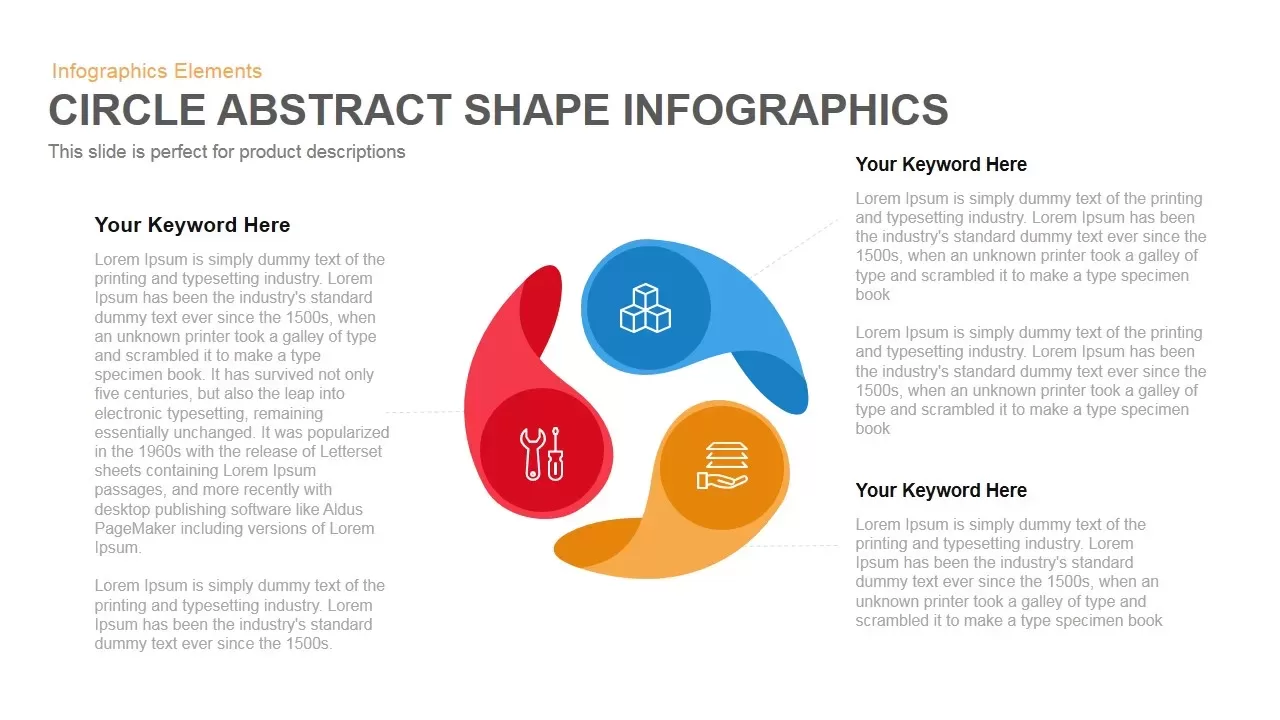
Circle Abstract Shape Infographics Template for PowerPoint & Google Slides
Circular
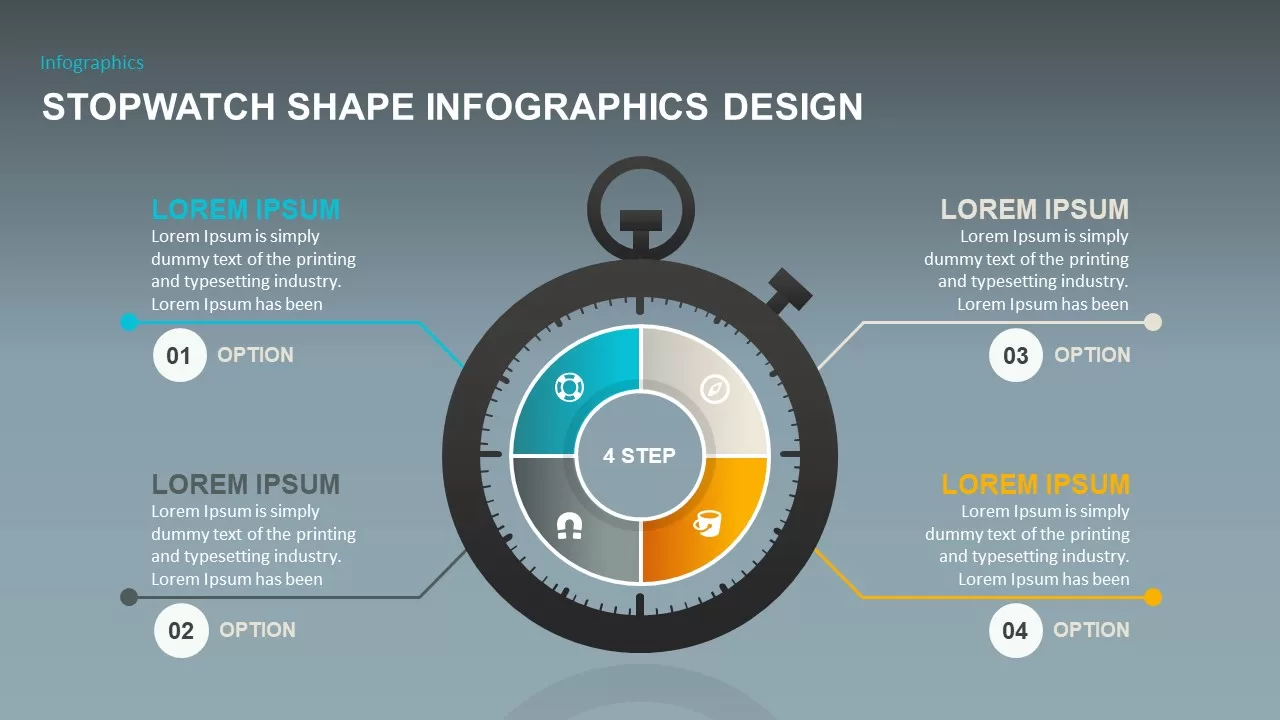
Stopwatch Shape Infographics for PowerPoint & Google Slides
Process
Pentagon Shape 5 Arrows Pointing Out template for PowerPoint & Google Slides
Arrow
3D Shape Linear Process Flow Diagram Template for PowerPoint & Google Slides
Process
Editable Four-Section 3D Shape Diagram Template for PowerPoint & Google Slides
Comparison
3D Segmented Shape Infographic Template for PowerPoint & Google Slides
Circular
Shape Loop Four-Step Infographic Slide Template for PowerPoint & Google Slides
Process
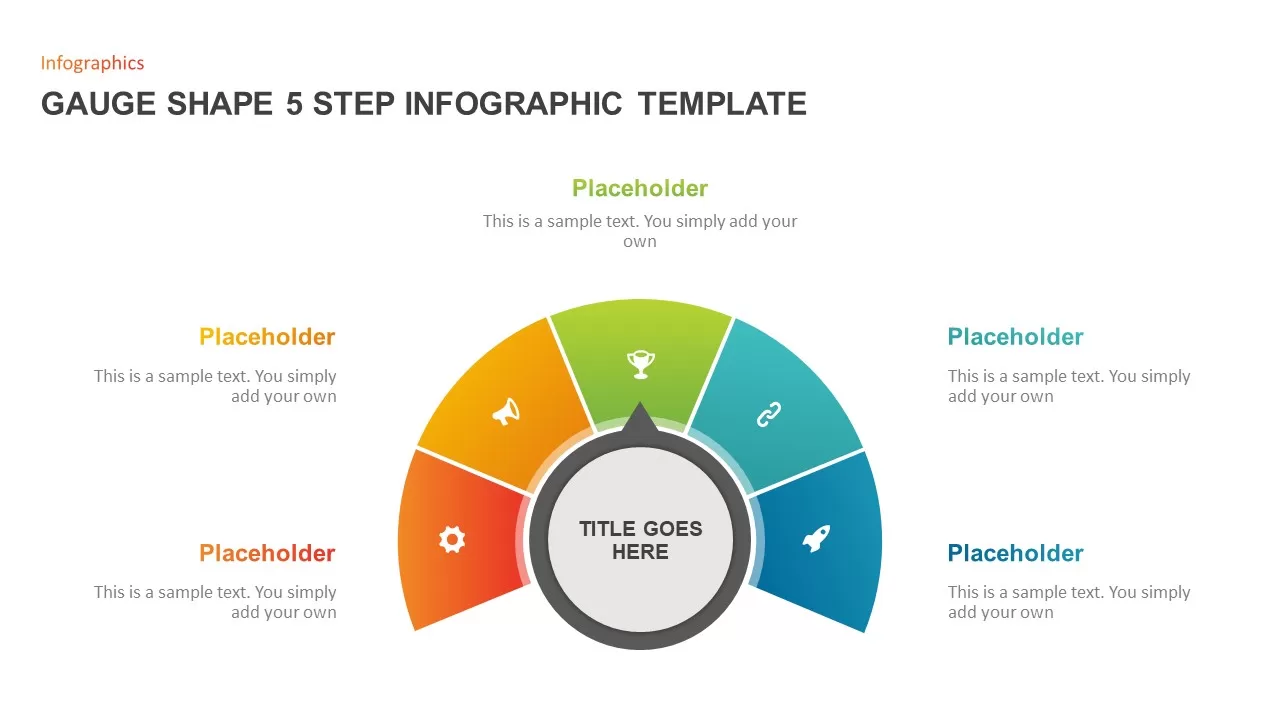
Gauge Shape 5-Step Infographic Diagram Template for PowerPoint & Google Slides
Process
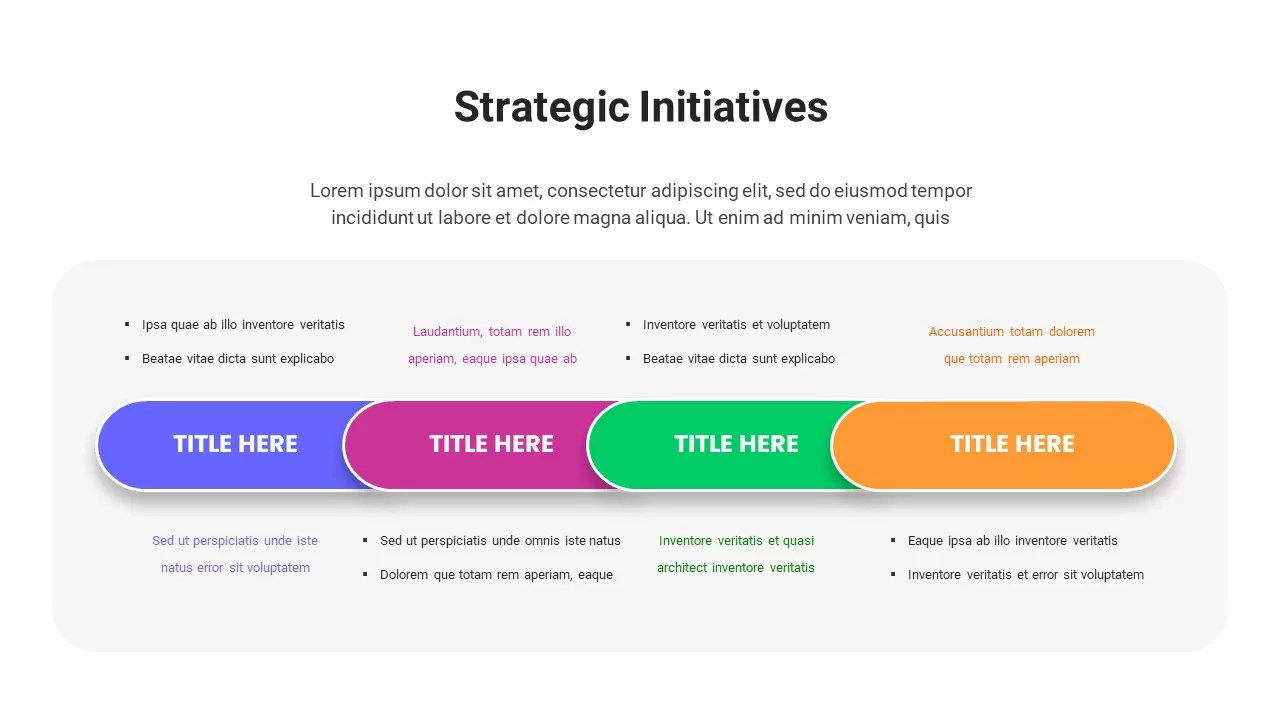
Strategic Initiatives Pill Shape Slide Template for PowerPoint & Google Slides
Pitch Deck
Fluid-Shape Cover Slide Template for PowerPoint & Google Slides
Company Profile
Arrow Types Shape Library Editable Template for PowerPoint & Google Slides
Arrow
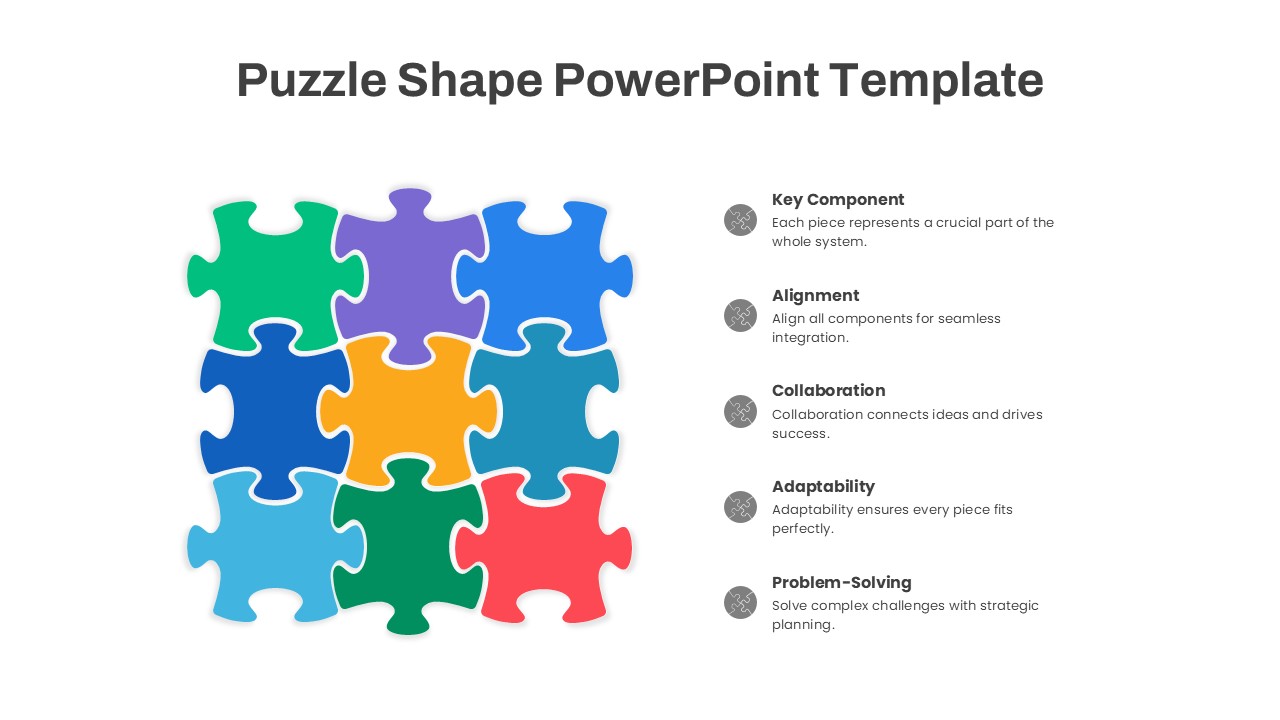
Puzzle Shape Diagram with Five Elements Template for PowerPoint & Google Slides
Circular
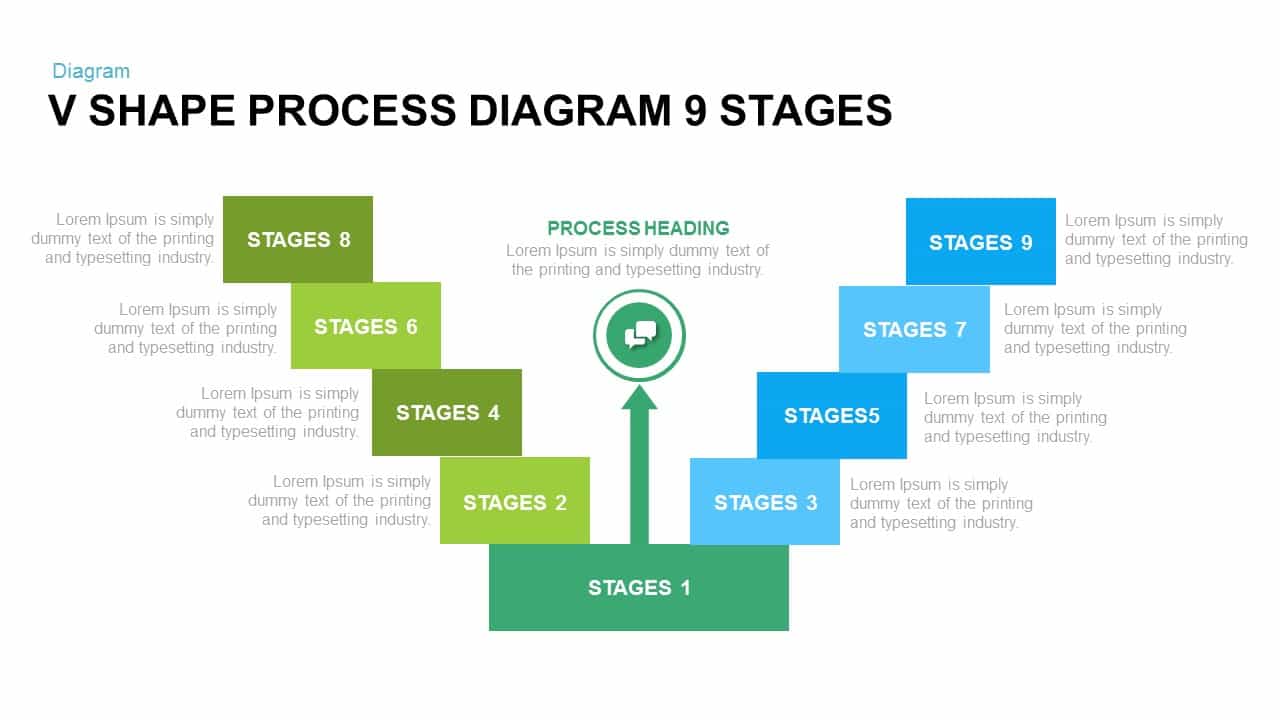
V Shape Process Diagram 9 Stages for PowerPoint & Google Slides
Infographics
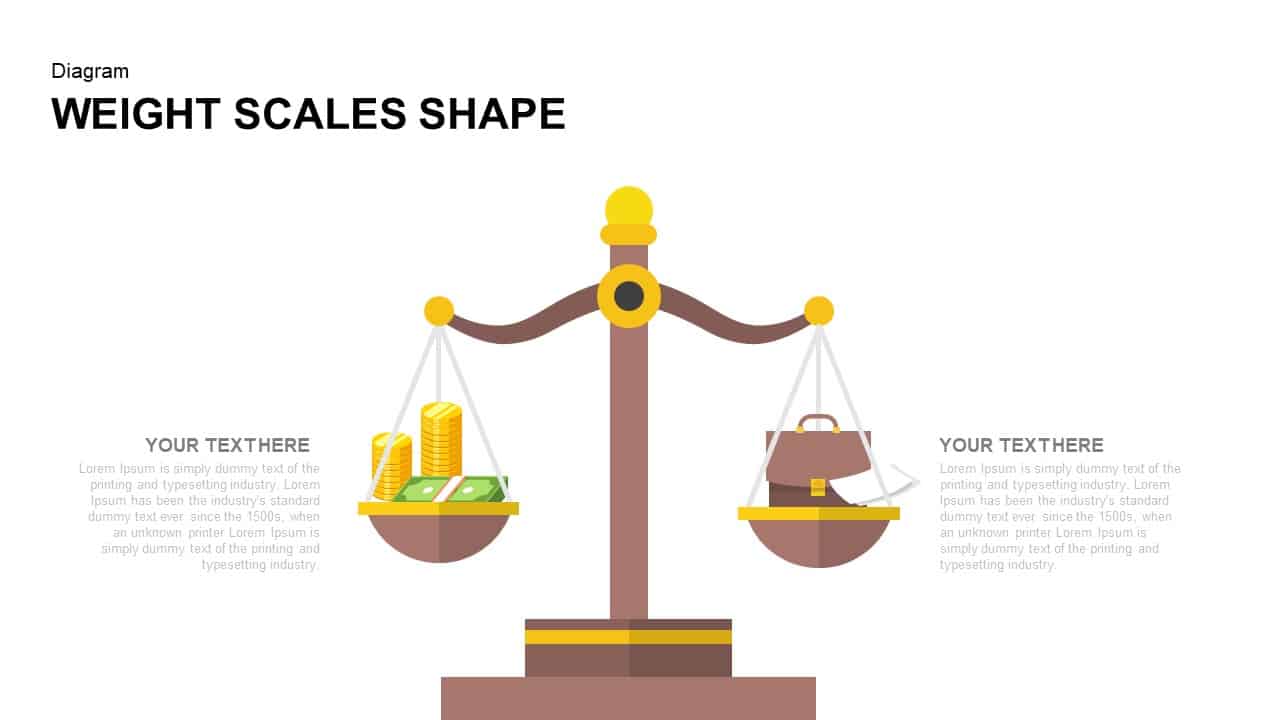
Weight Scales Shape Diagram for PowerPoint & Google Slides
Comparison
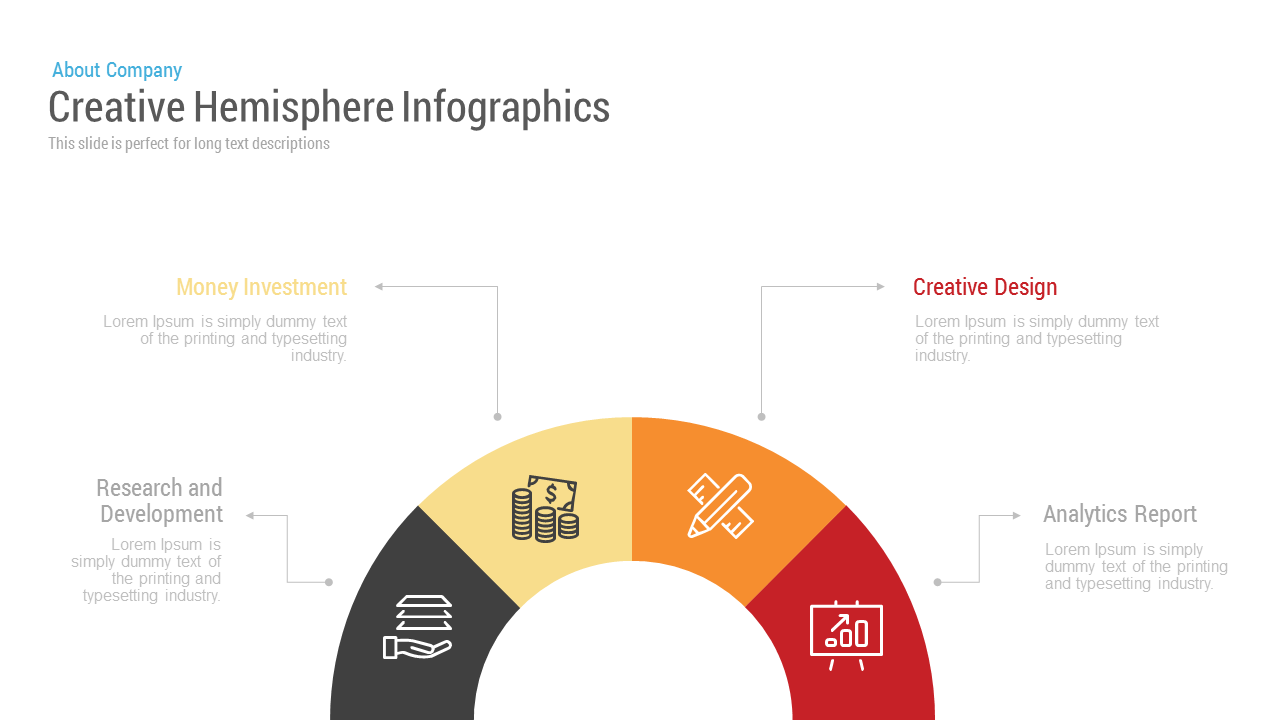
Free Creative Hemisphere Infographics template for PowerPoint & Google Slides
Infographics
Free
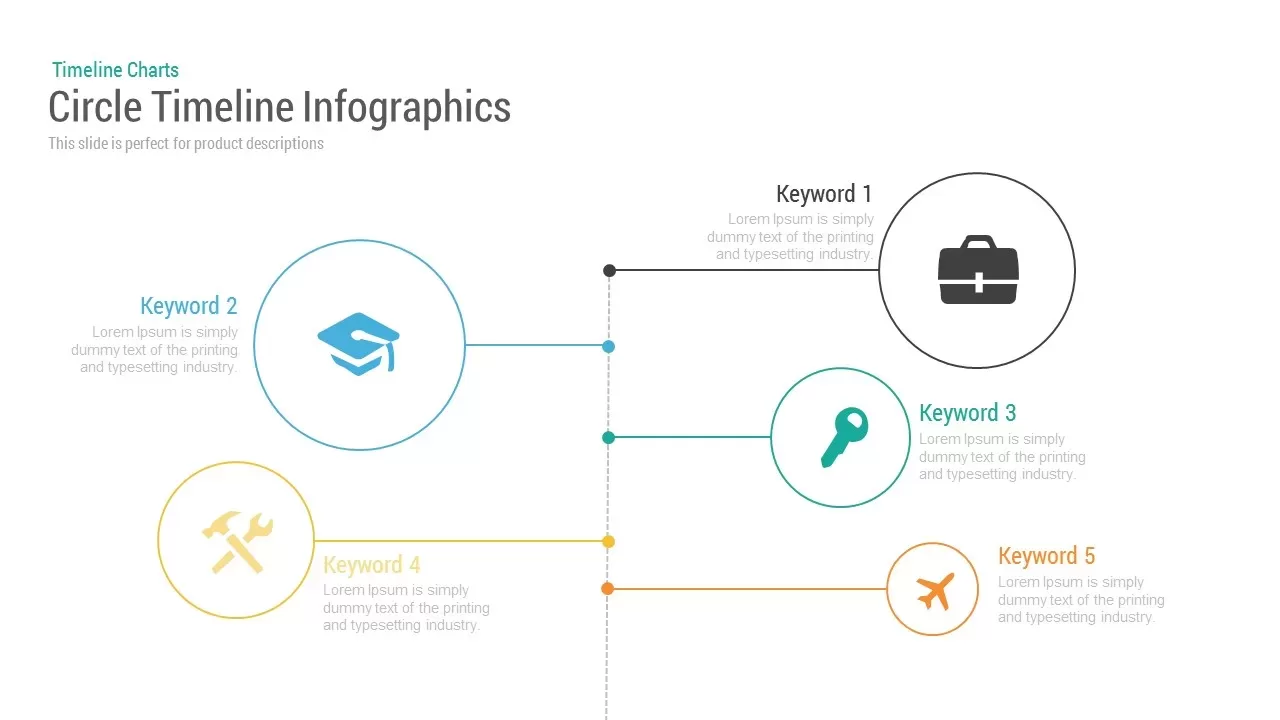
Circle Timeline Infographics template for PowerPoint & Google Slides
Timeline
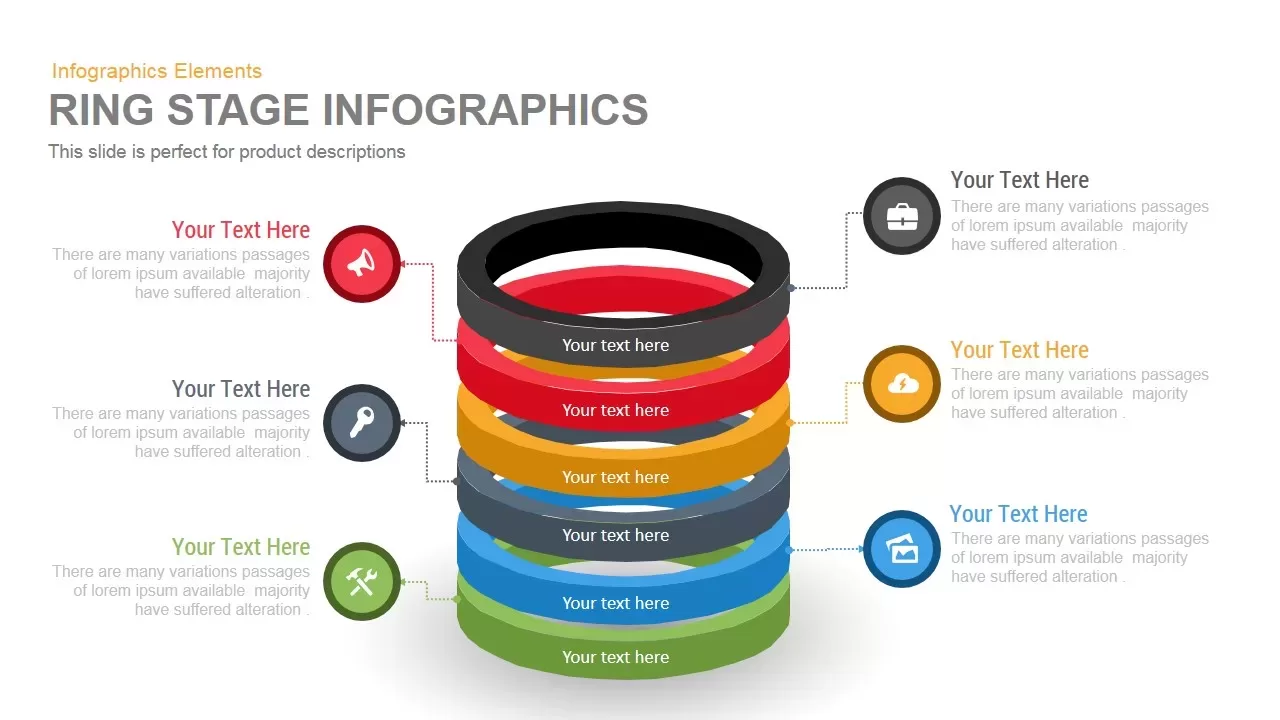
Ring Infographics template for PowerPoint & Google Slides
Circular
3D Four Arrow Infographics Diagram Template for PowerPoint & Google Slides
Arrow
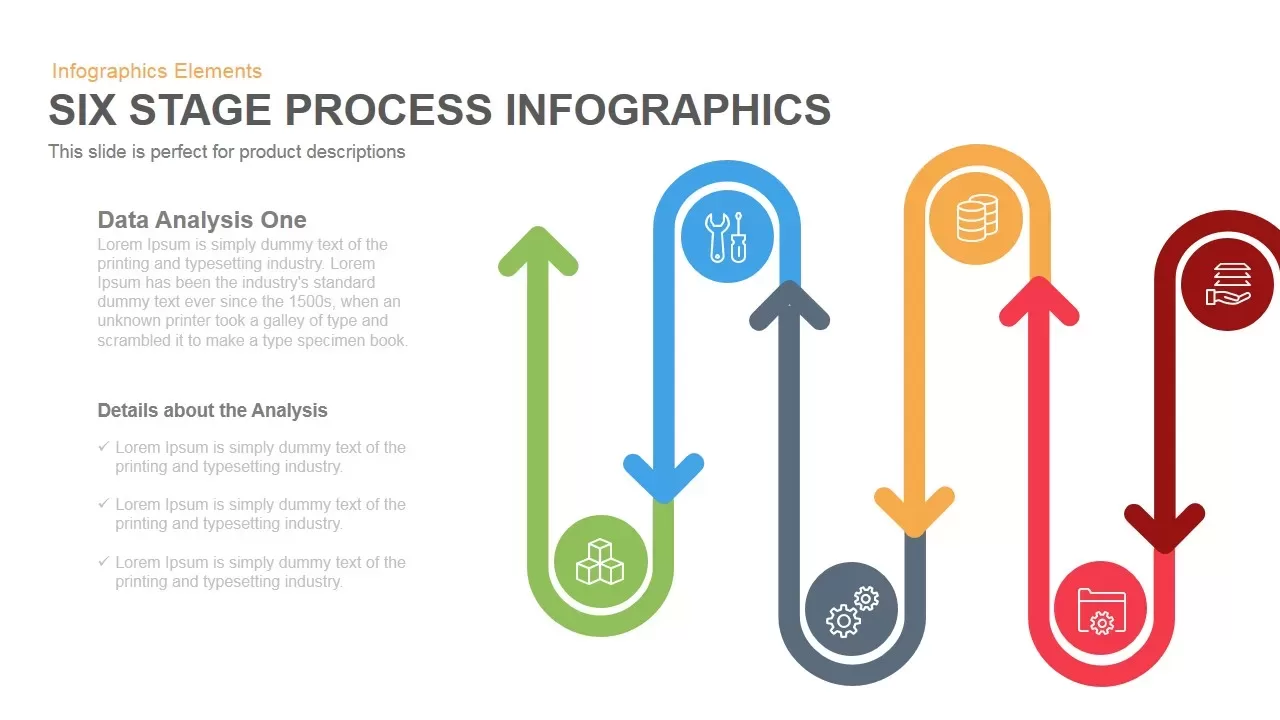
Six-Stage Process Infographics Template for PowerPoint & Google Slides
Process
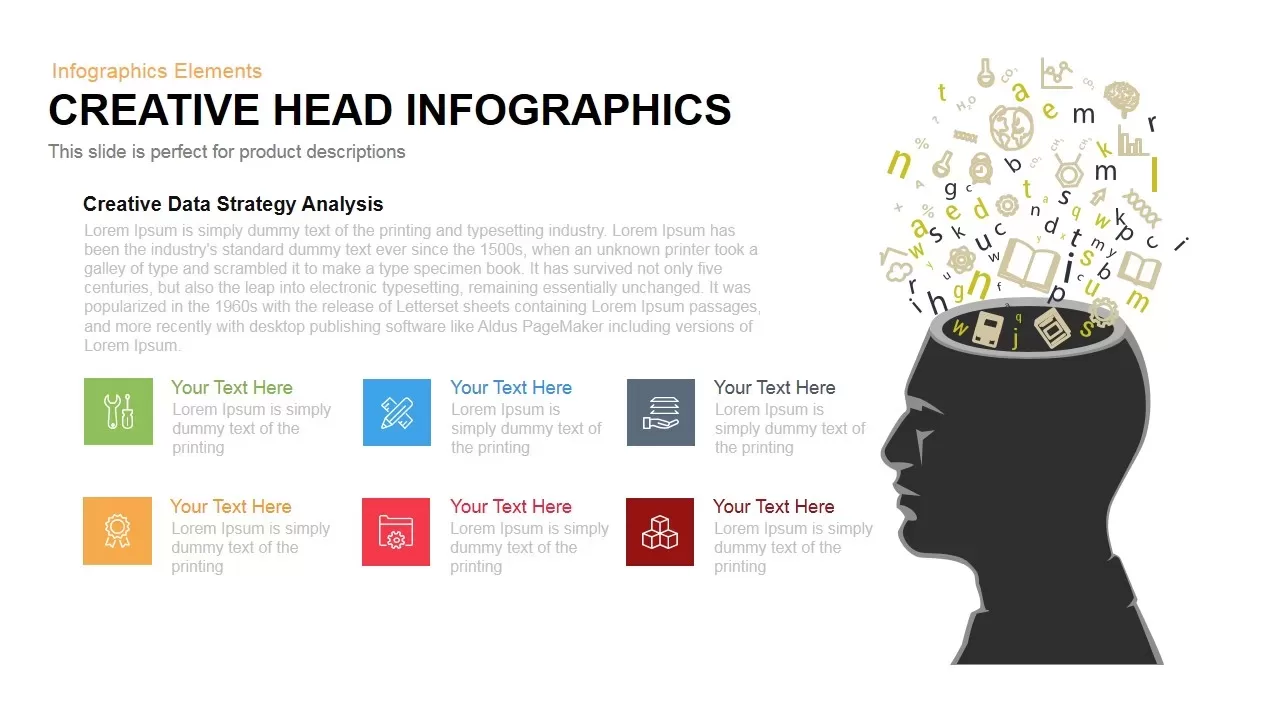
Dynamic Creative Head Infographics Template for PowerPoint & Google Slides
Circular
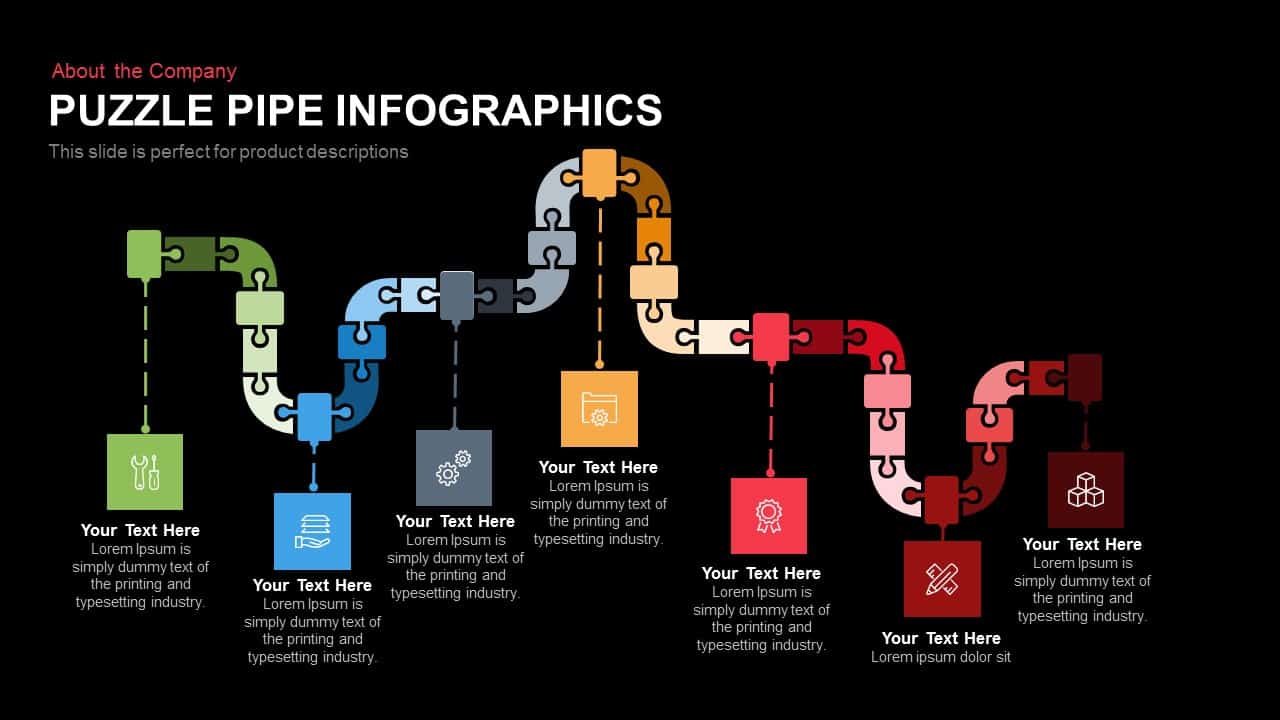
Puzzle Pipe Infographics Process Flow Template for PowerPoint & Google Slides
Process
Four Arrow Square Infographics Template for PowerPoint & Google Slides
Arrow
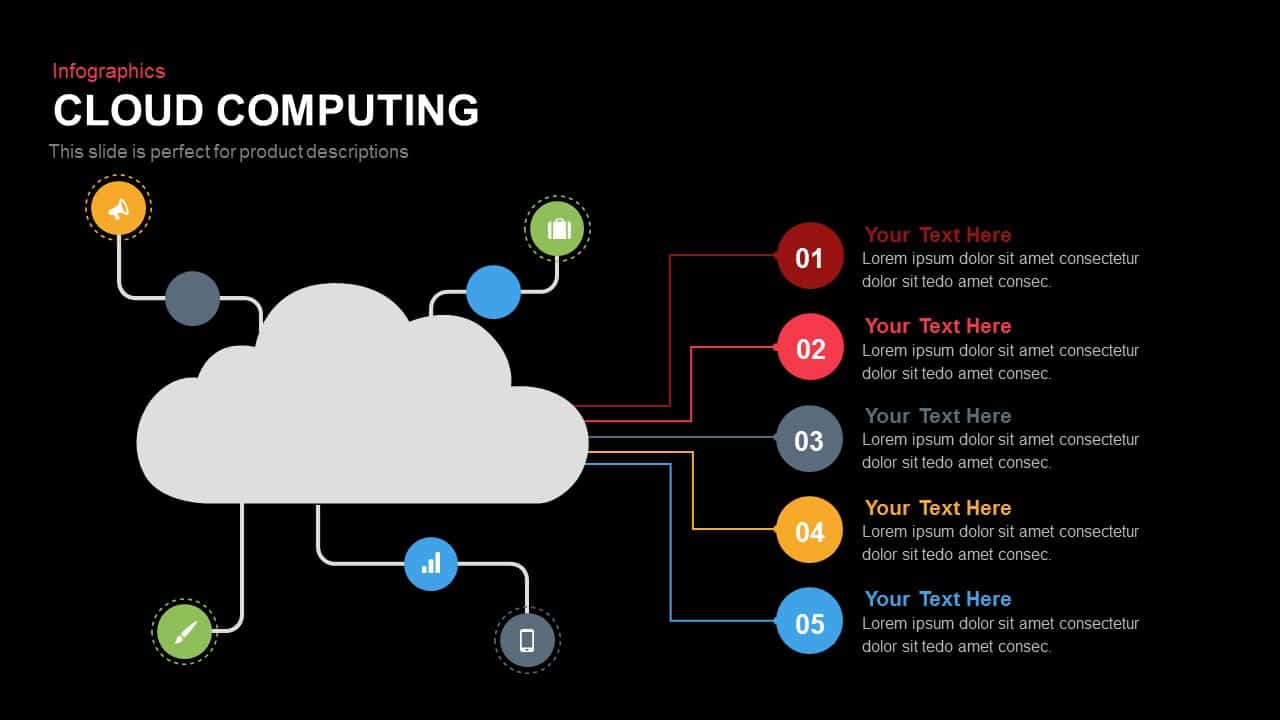
Cloud Computing Infographics template for PowerPoint & Google Slides
Cloud Computing
Brain Gear Hub-and-Spoke Infographics template for PowerPoint & Google Slides
Org Chart
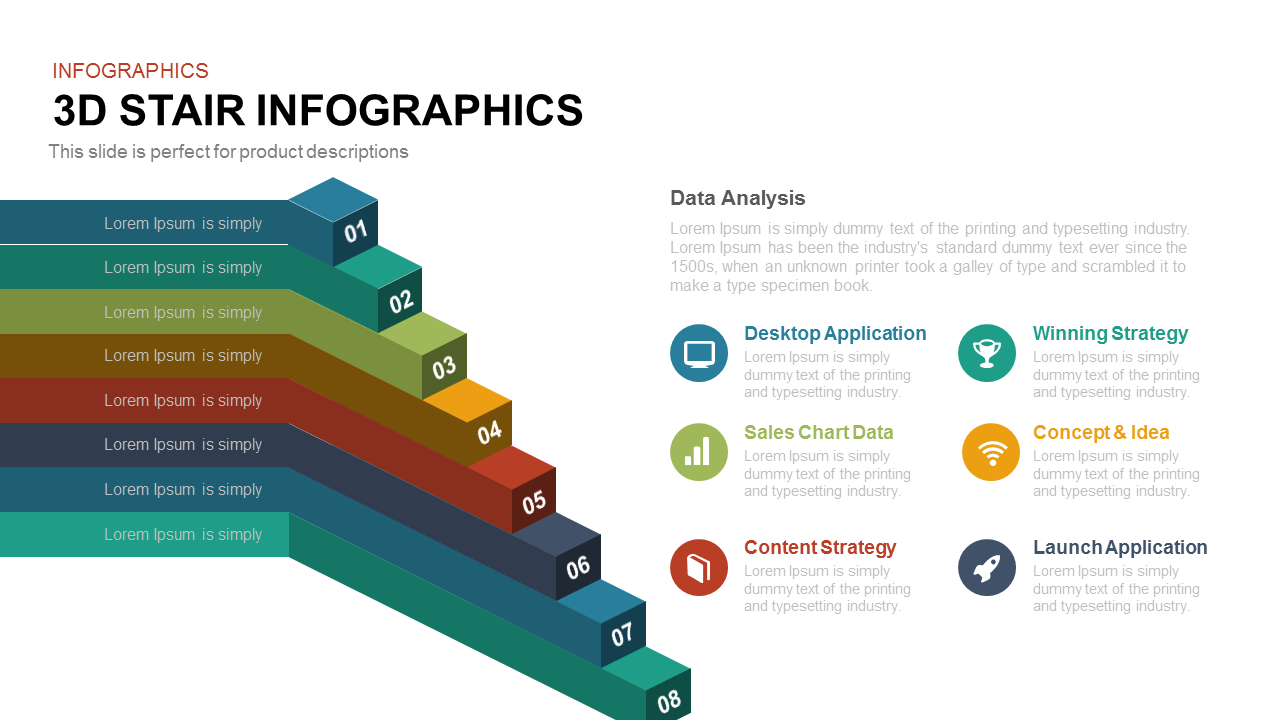
8-Step 3D Stair Infographics Slide template for PowerPoint & Google Slides
Process
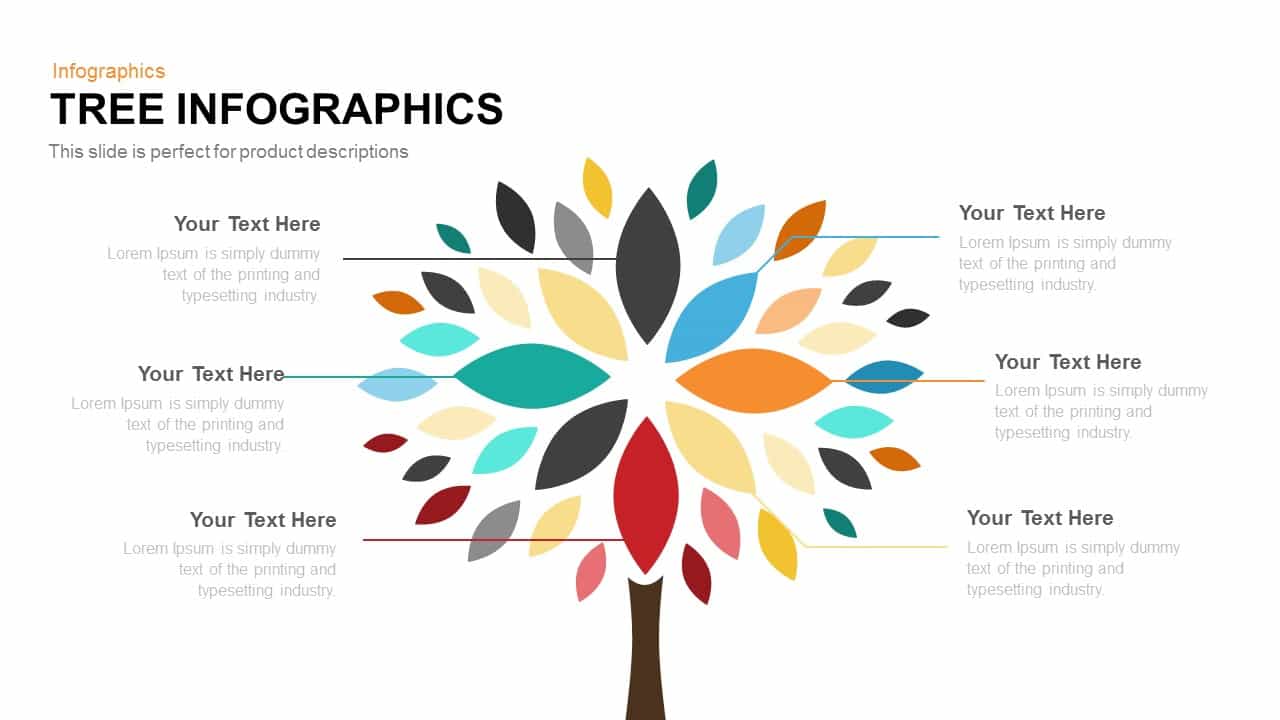
Tree Infographics template for PowerPoint & Google Slides
Infographics
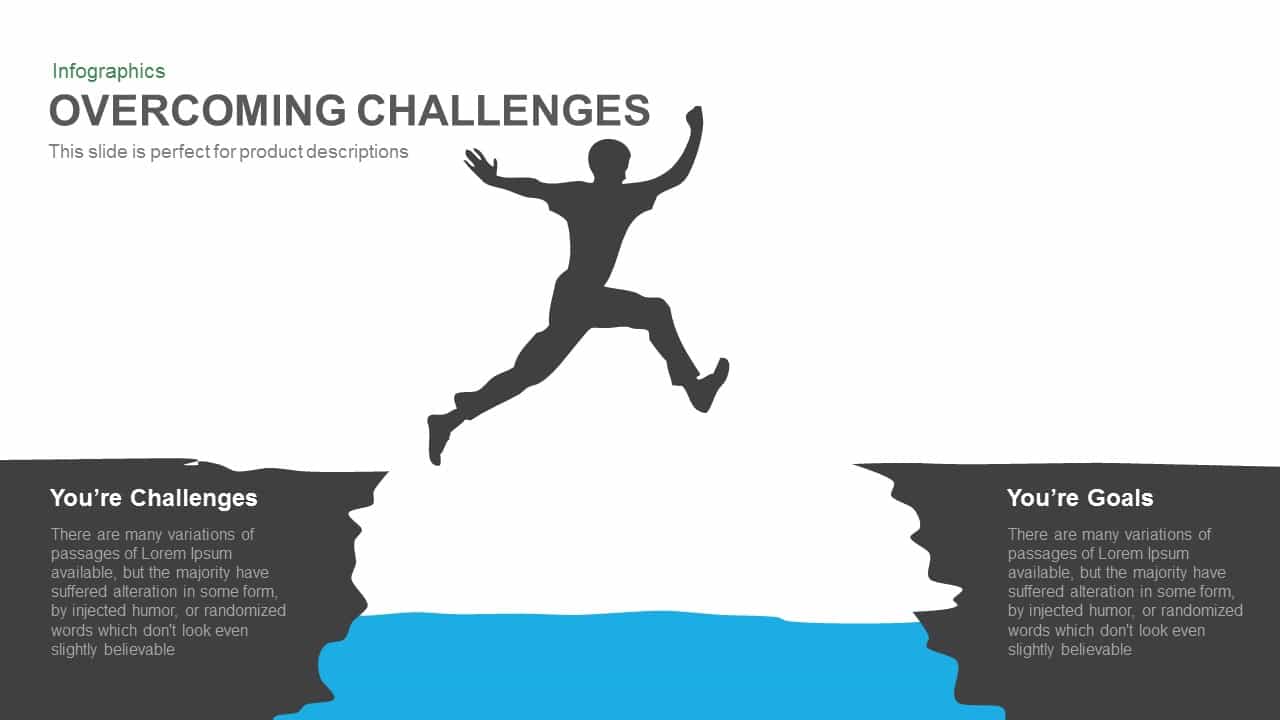
Overcoming Challenges Infographics template for PowerPoint & Google Slides
Opportunities Challenges
Multi-Stage Timeline Infographics Template for PowerPoint & Google Slides
Timeline
Five Arrow Infographics Diagram Template for PowerPoint & Google Slides
Arrow
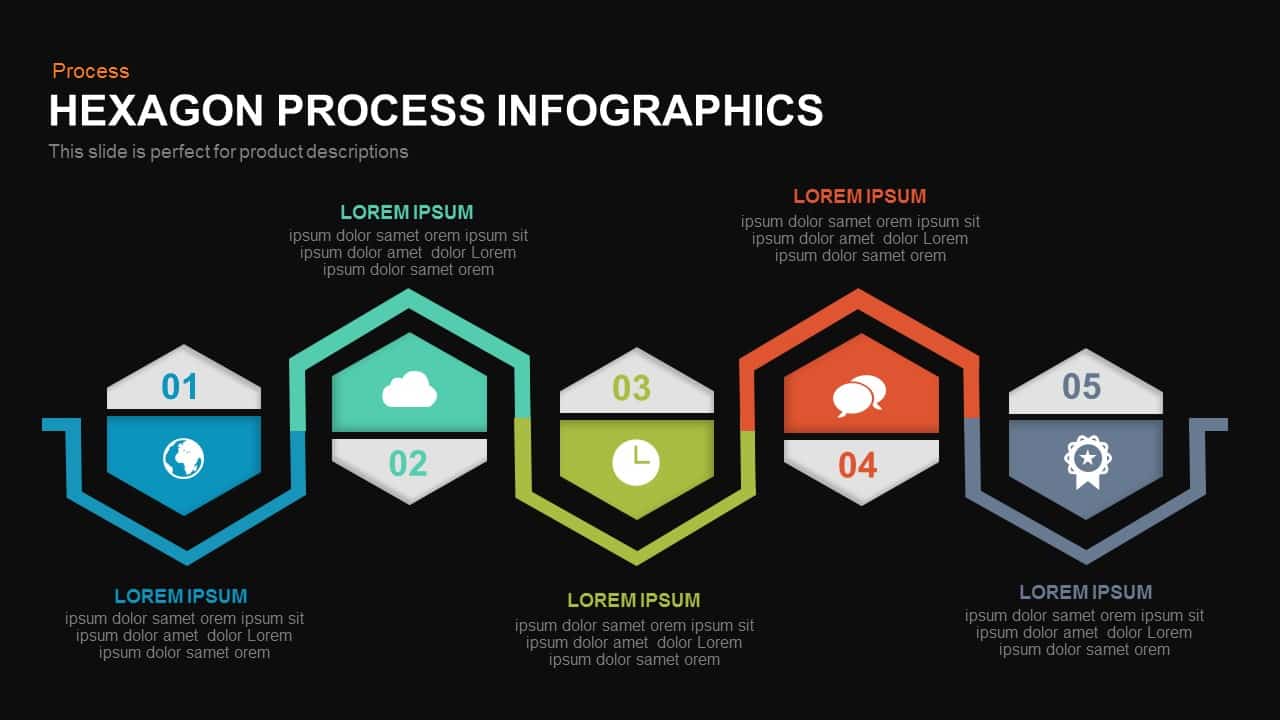
Five-Stage Hexagon Process Infographics template for PowerPoint & Google Slides
Process
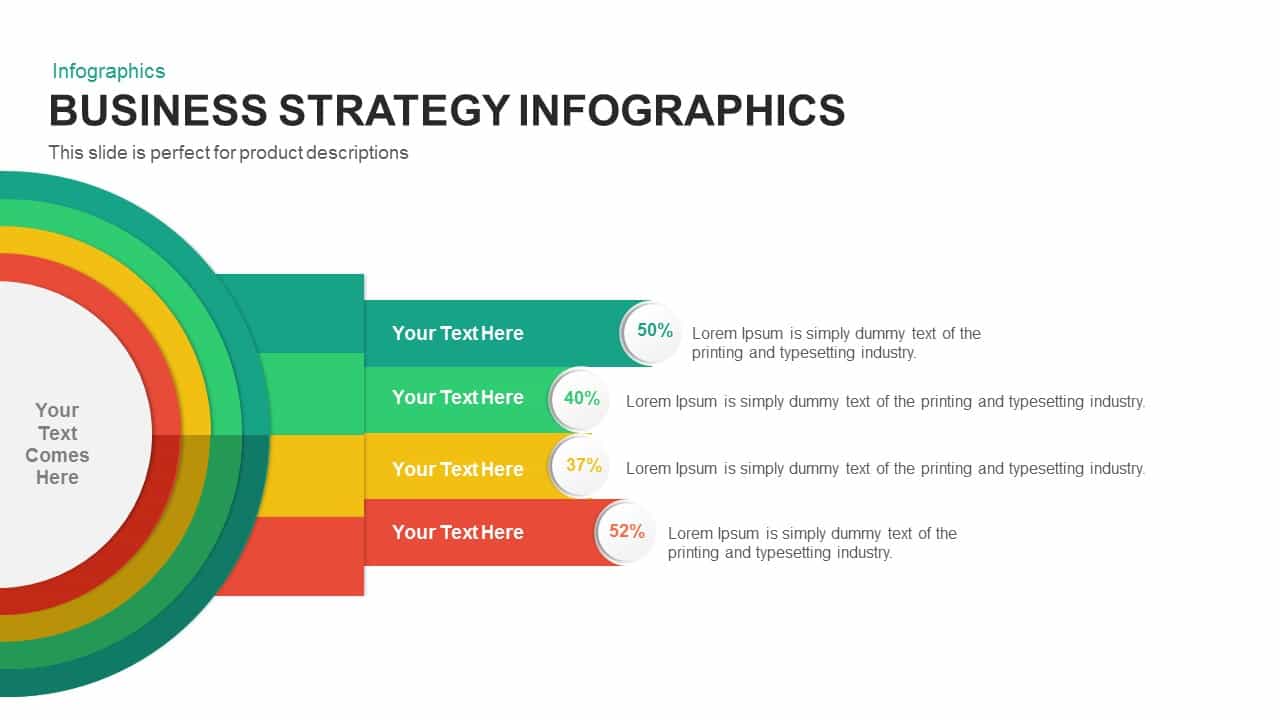
Business Strategy Infographics Diagram Template for PowerPoint & Google Slides
Business Strategy
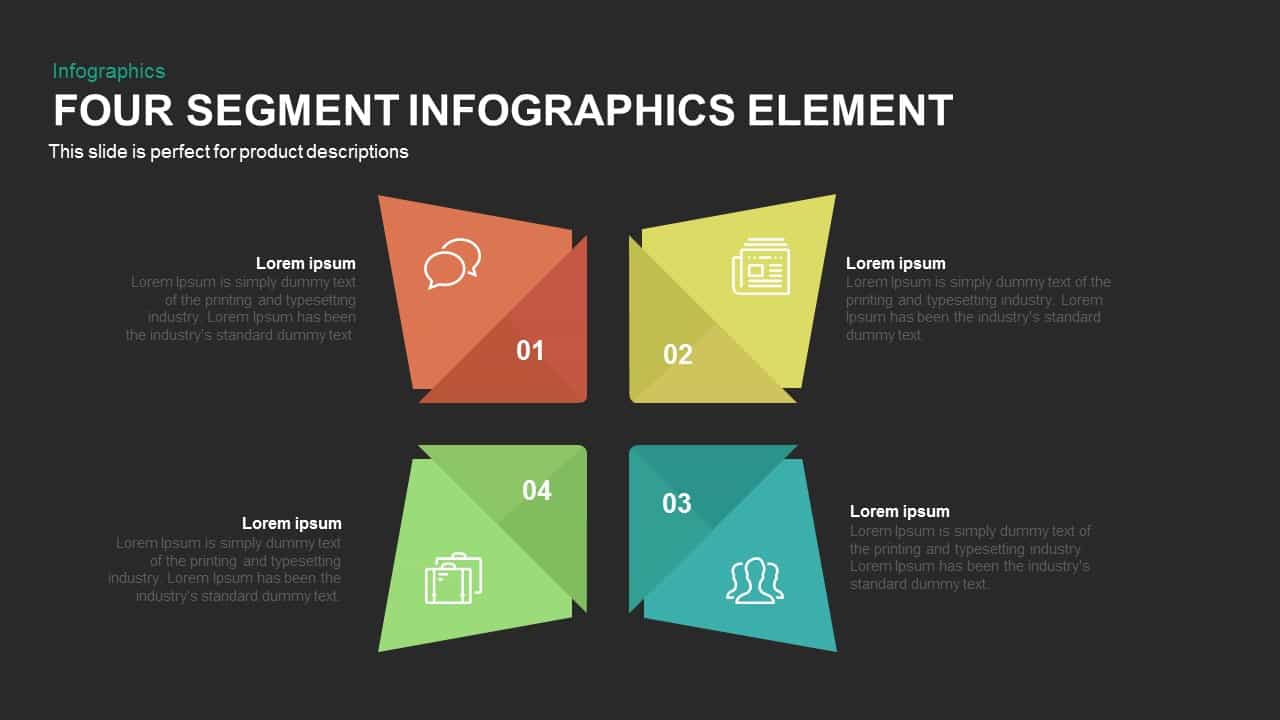
Four Segment Infographics Element Template for PowerPoint & Google Slides
Comparison
Six-Stage Time Arrow Infographics Template for PowerPoint & Google Slides
Arrow
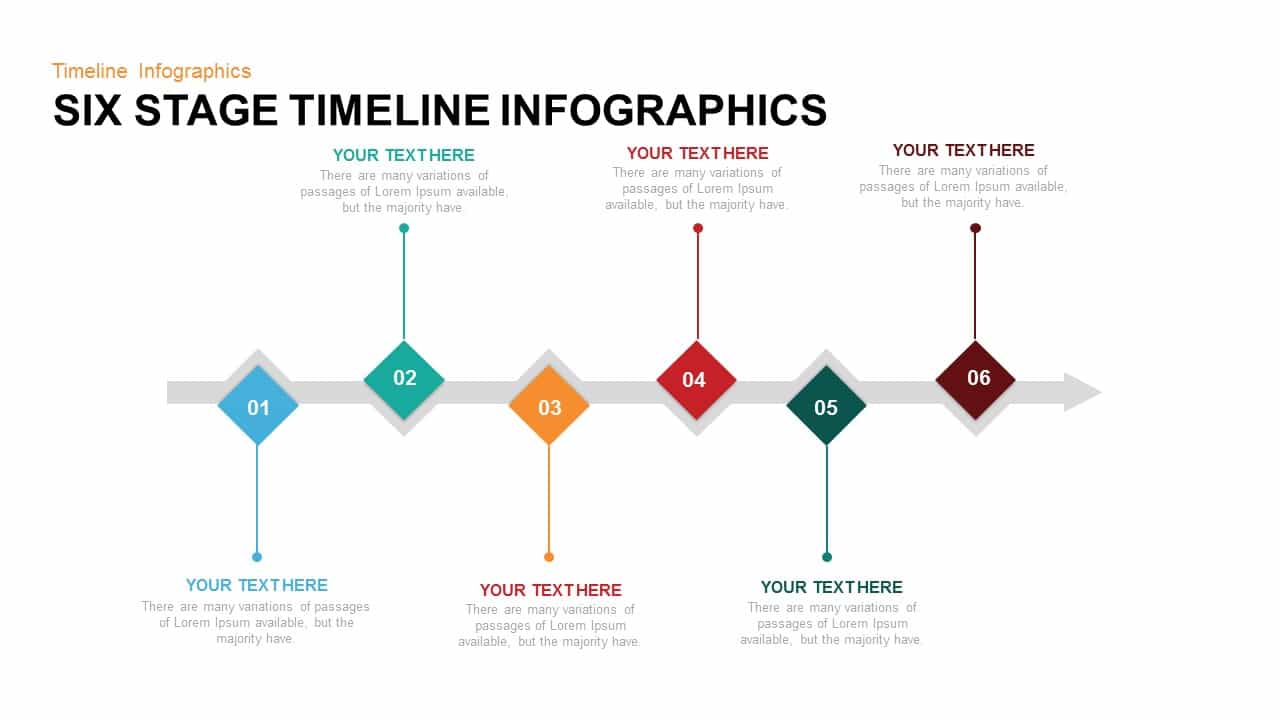
Six Stage Timeline Infographics Template for PowerPoint & Google Slides
Timeline
3D Arrow Infographics template for PowerPoint & Google Slides
Arrow
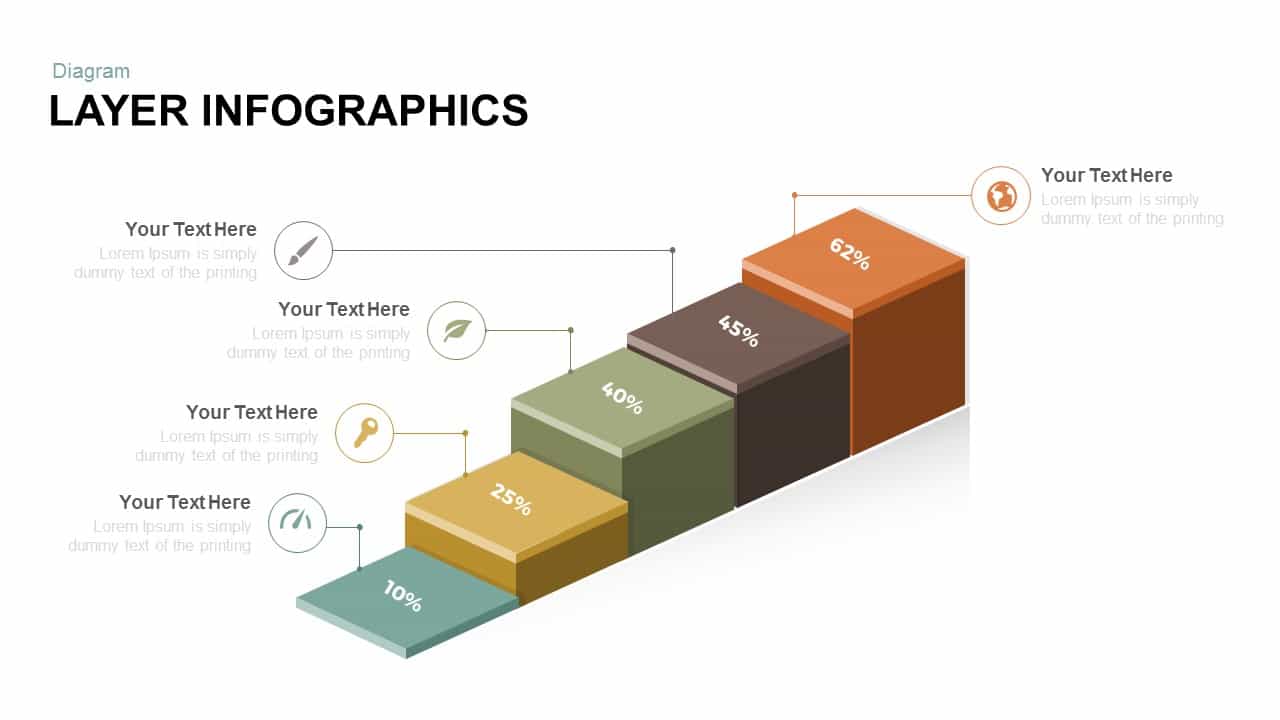
Free Layer Infographics template for PowerPoint & Google Slides
Process
Free

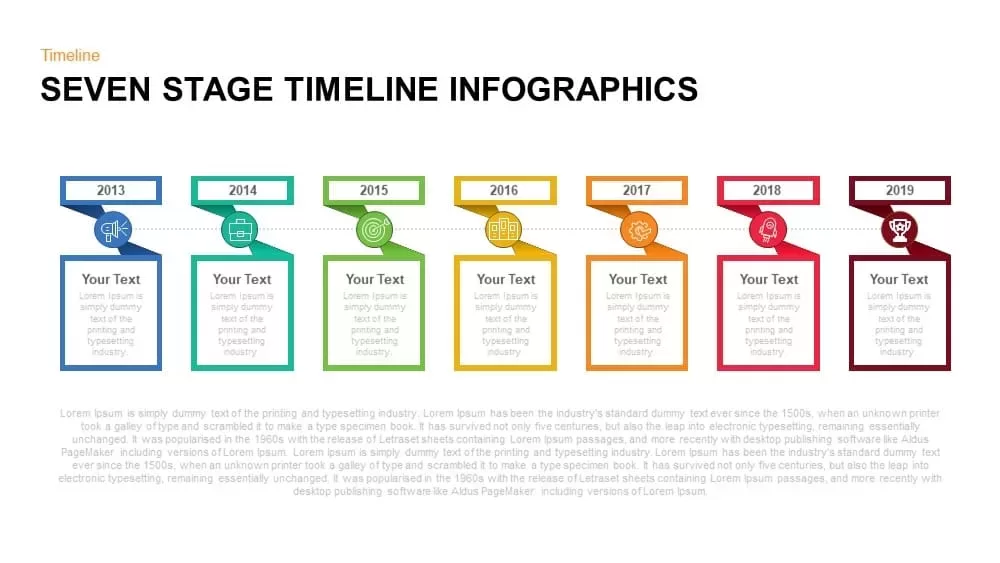
Seven-Stage Timeline Infographics Template for PowerPoint & Google Slides
Timeline
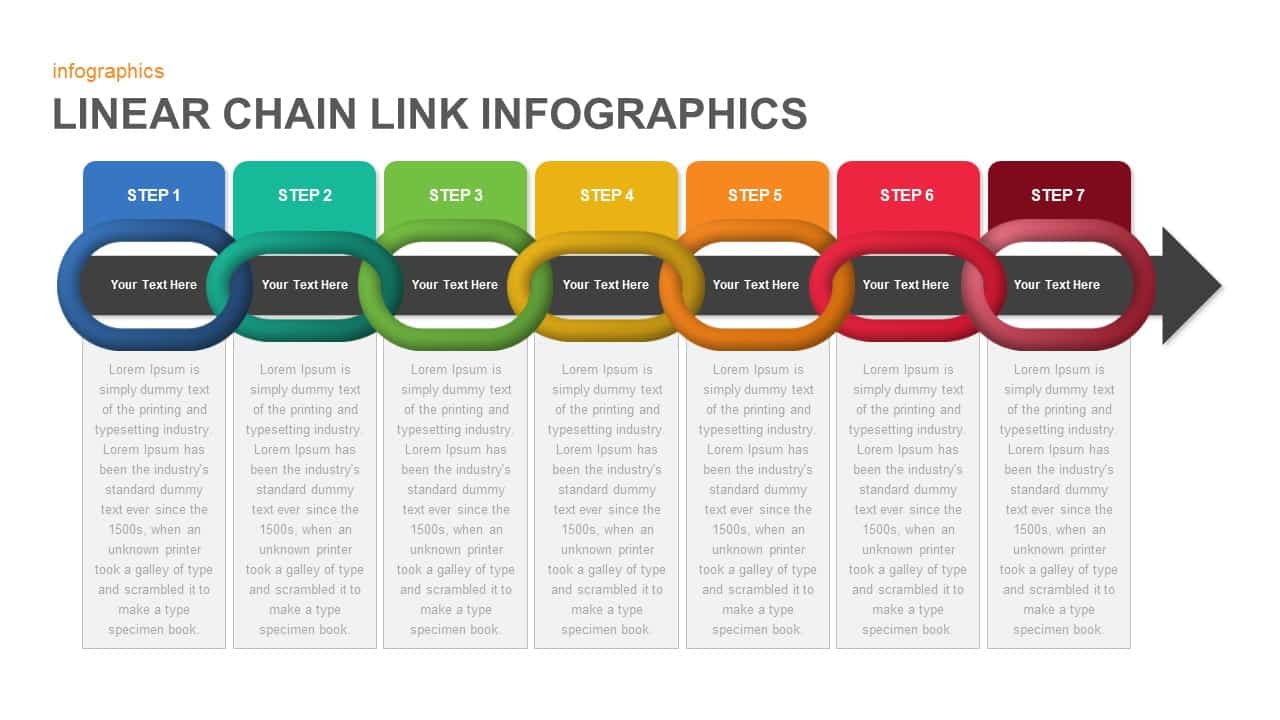
Linear Chain Link Infographics Template for PowerPoint & Google Slides
Process
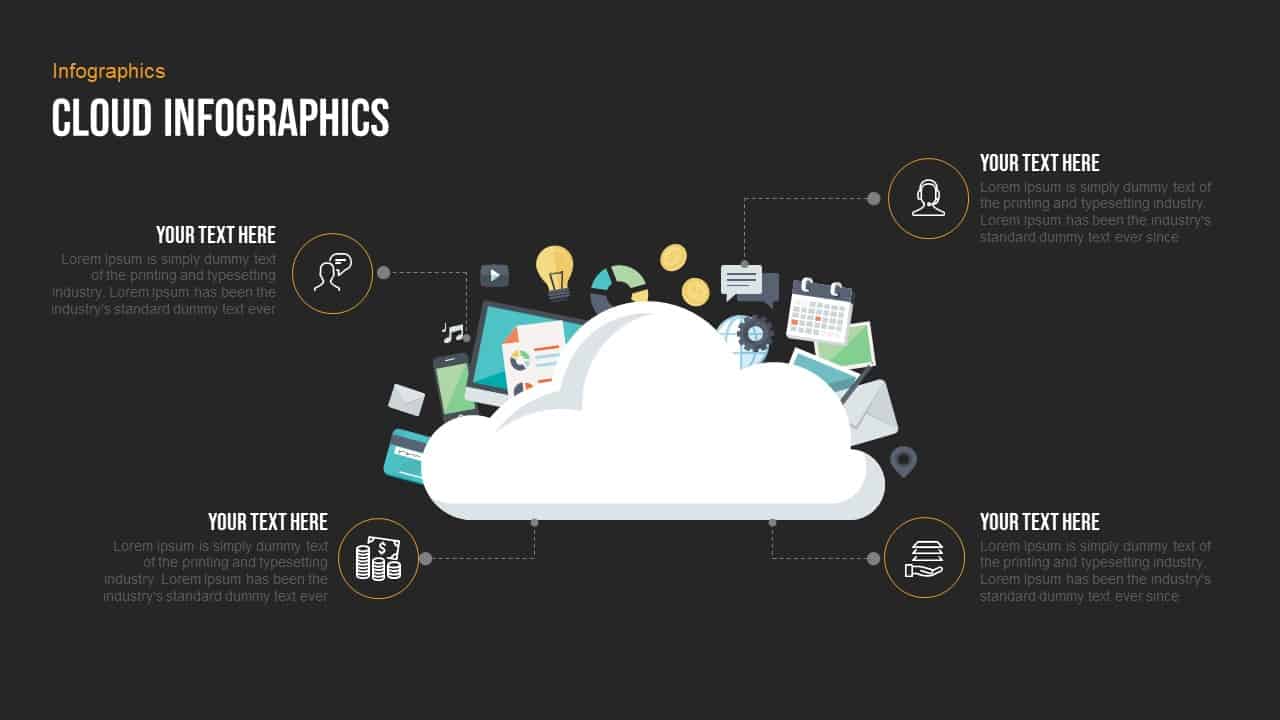
Free Professional Cloud Infographics Template for PowerPoint & Google Slides
Process
Free
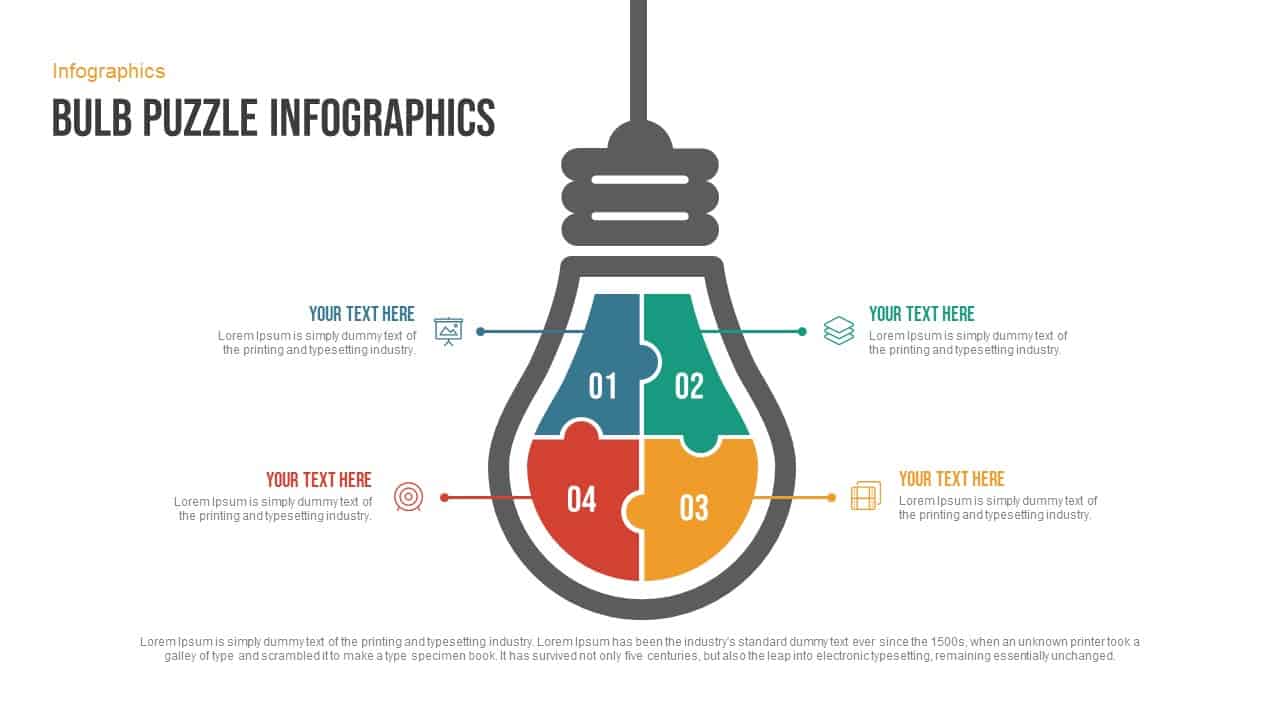
Free Bulb Puzzle Infographics Diagram Template for PowerPoint & Google Slides
Process
Free
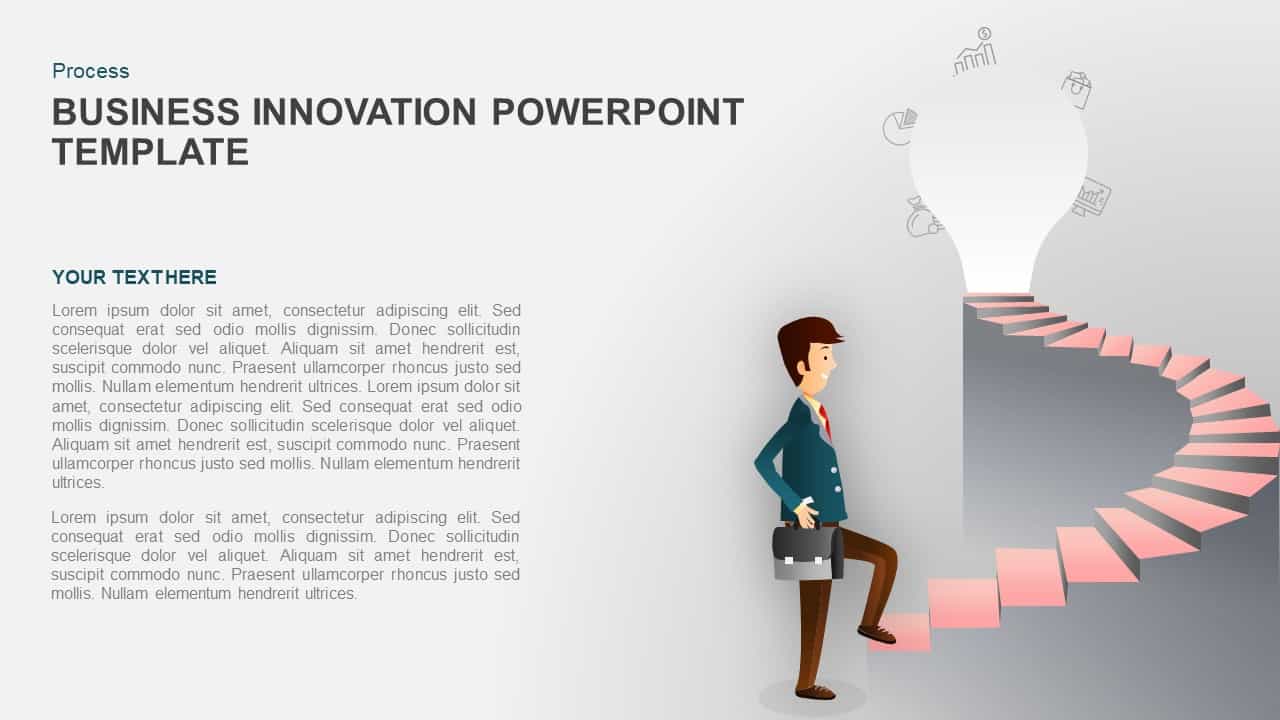
Business Innovation Infographics template for PowerPoint & Google Slides
Process
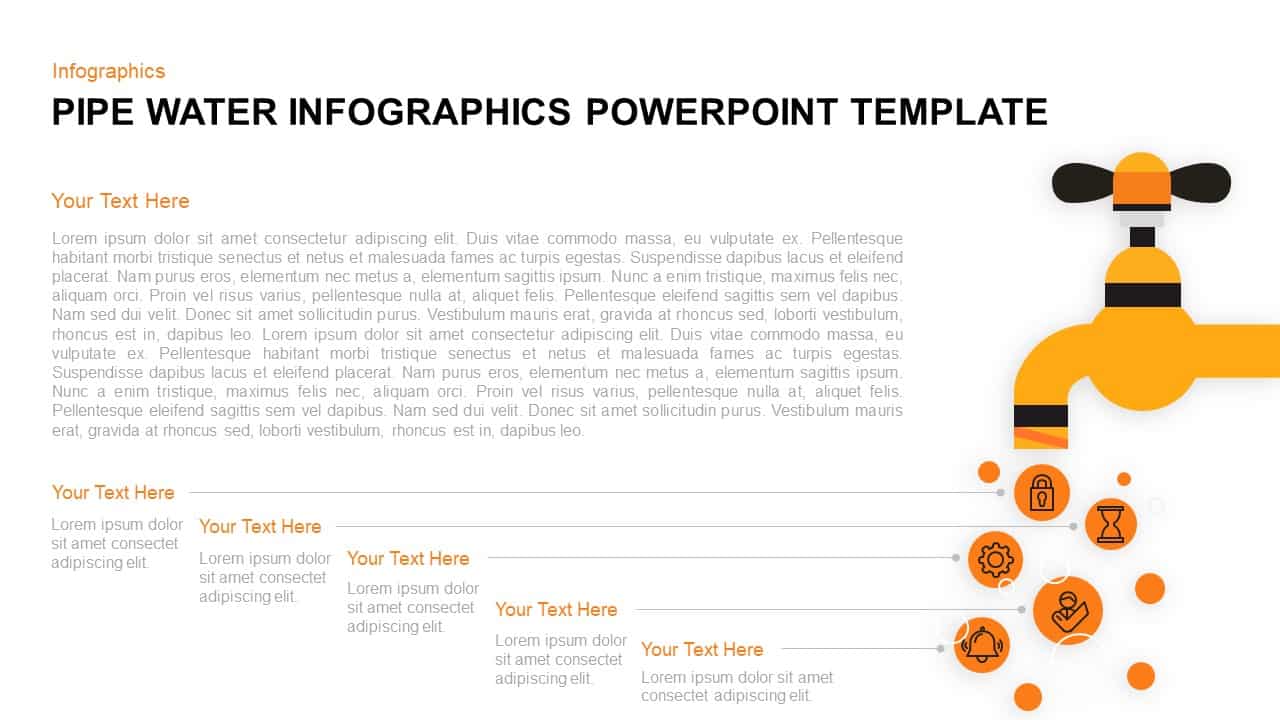
Pipe Water Infographics Flow Diagram Template for PowerPoint & Google Slides
Process
Five-Stage Pyramid Infographics Process Template for PowerPoint & Google Slides
Pyramid
Mobile Infographics Data Visualization Template for PowerPoint & Google Slides
Infographics
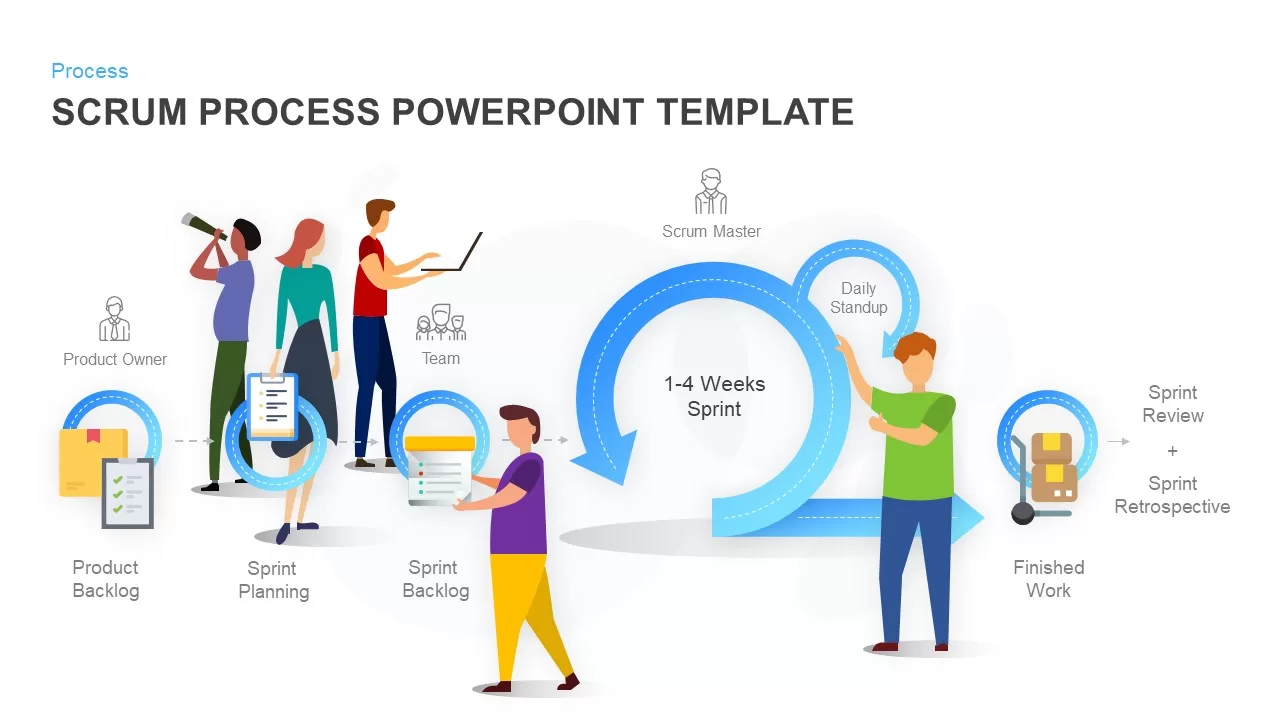
Scrum Process & Roles Infographics Template for PowerPoint & Google Slides
Scrum
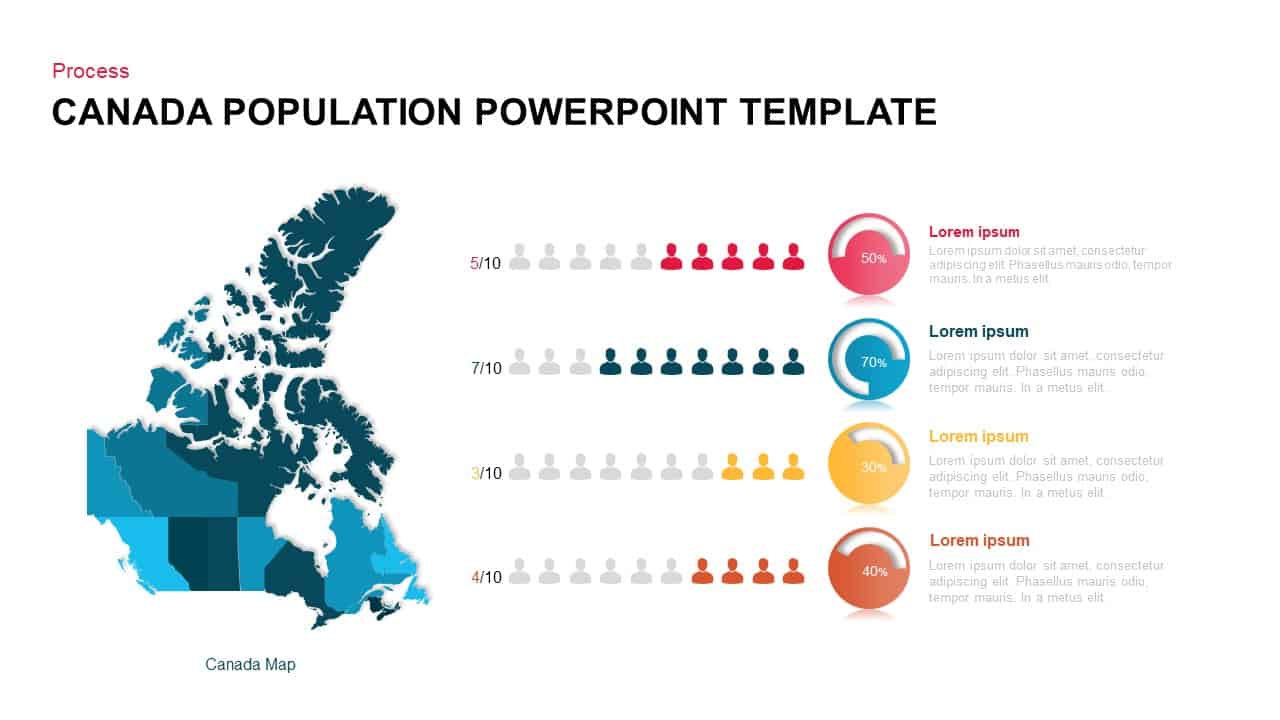
Canada Population Infographics Template for PowerPoint & Google Slides
World Maps
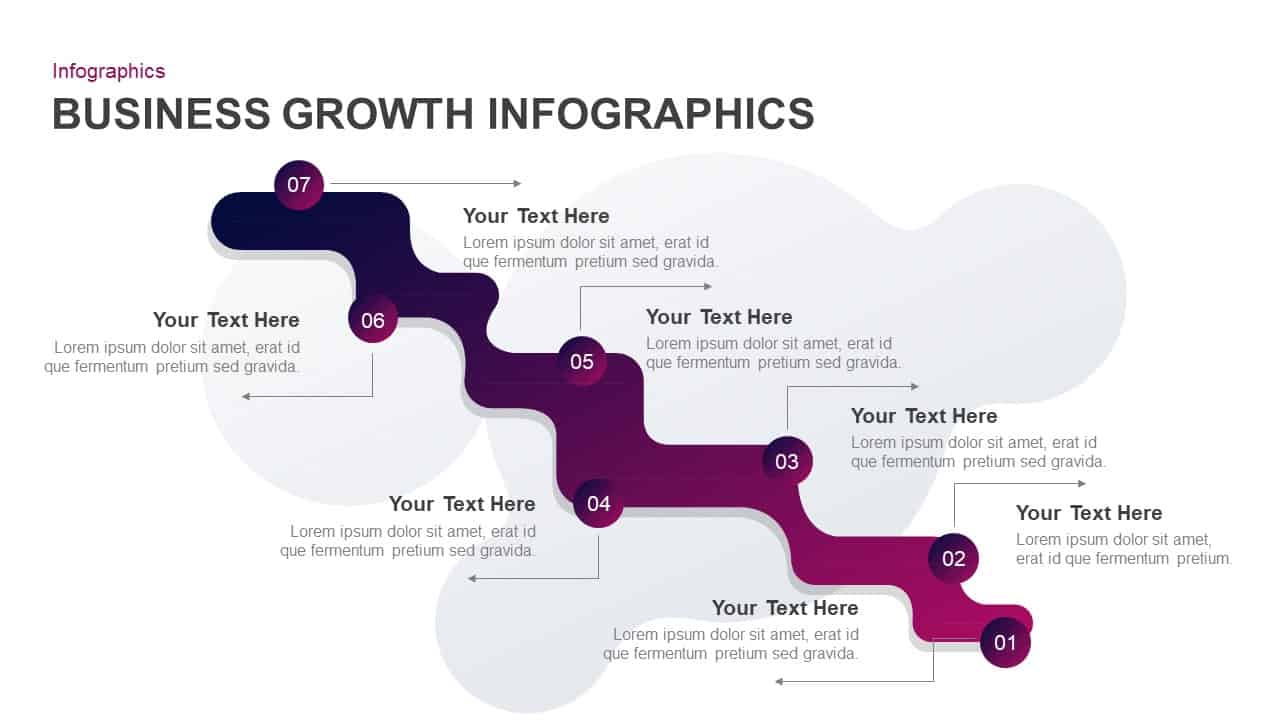
Business Growth Infographics Template for PowerPoint & Google Slides
Roadmap
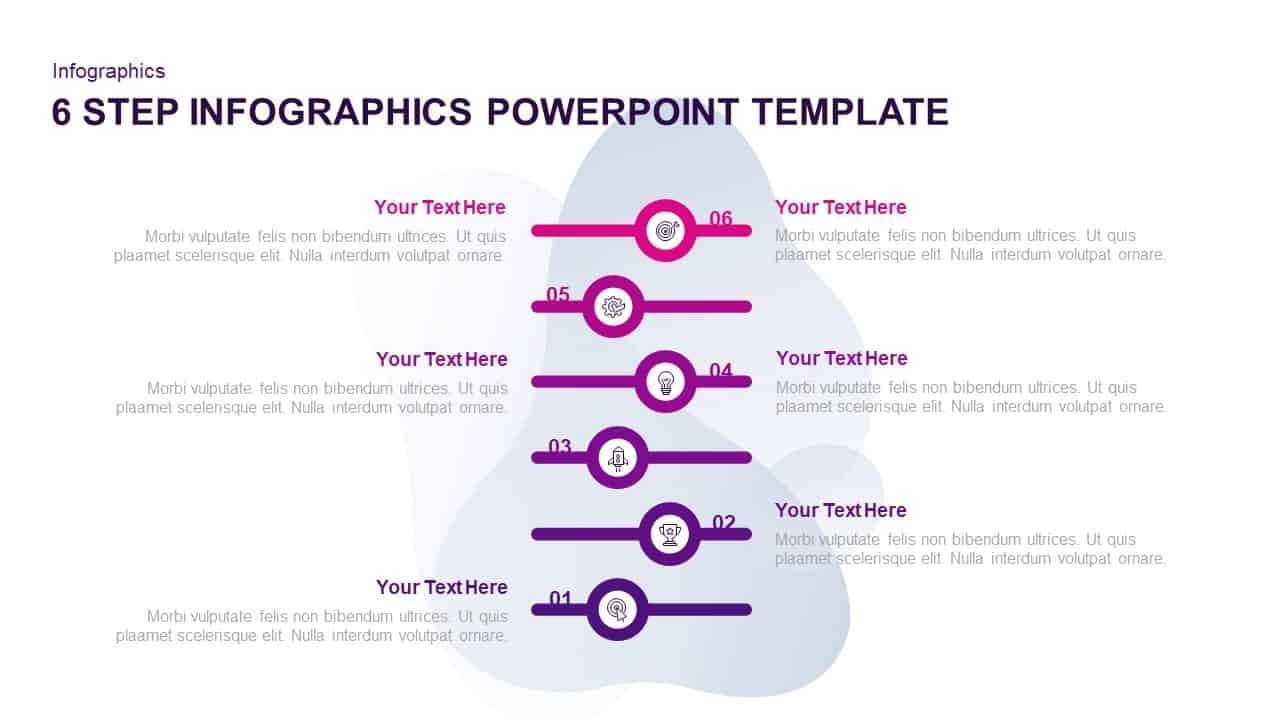
Six-Step Purple Gradient Infographics Template for PowerPoint & Google Slides
Process
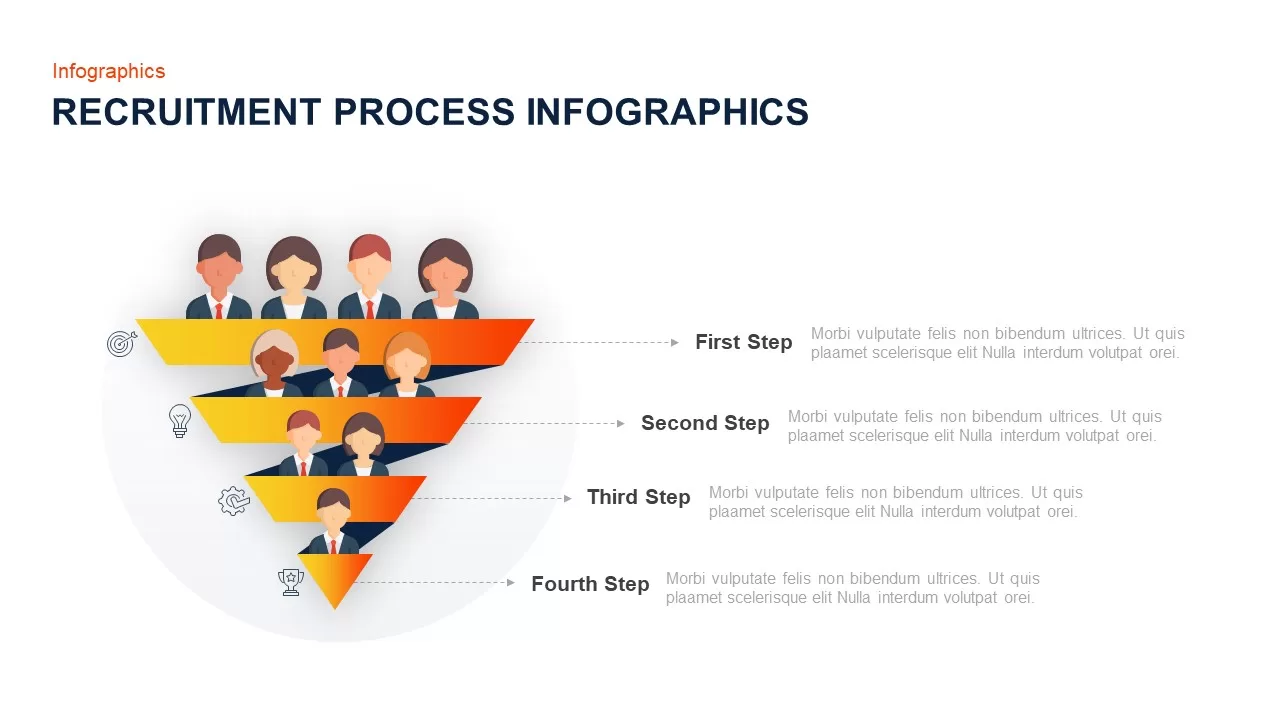
Recruitment Process Funnel Infographics Template for PowerPoint & Google Slides
Recruitment
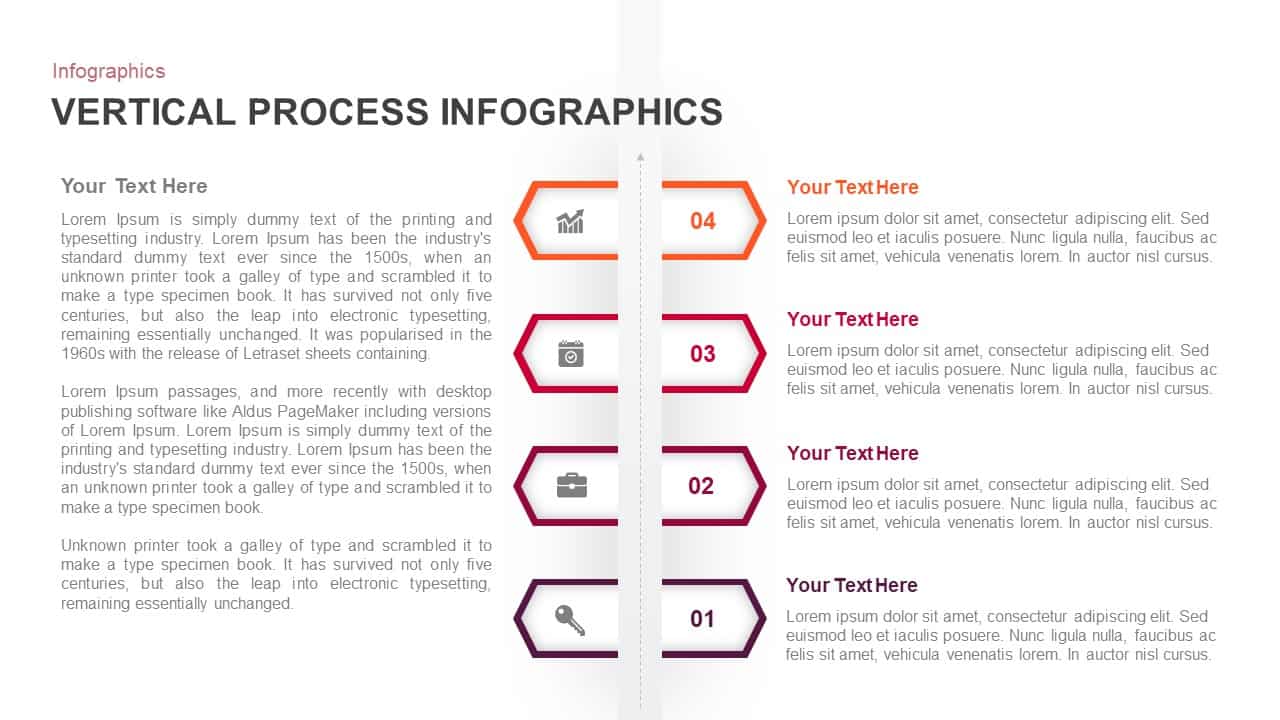
Vertical Process Infographics Template for PowerPoint & Google Slides
Process
Three-Step Process Infographics Template for PowerPoint & Google Slides
Process
3D Cube Infographics template for PowerPoint & Google Slides
Process
Cube Core Infographics Template for PowerPoint & Google Slides
Process
Box Diagram Infographics template for PowerPoint & Google Slides
Business

Creative Cycle Process Infographics Template for PowerPoint & Google Slides
Process
Modern Circular Infographics Template for PowerPoint & Google Slides
Circular
Five-Step Circular Badge Infographics Template for PowerPoint & Google Slides
Circular
5 Step Sales Planning Infographics Template for PowerPoint & Google Slides
Process
Opposing Ideas Infographics Pack Template for PowerPoint & Google Slides
Comparison
Medical Infographics Data Visualization Template for PowerPoint & Google Slides
Health
Isometric 3D Cube Shapes Infographics Template for PowerPoint & Google Slides
Infographics
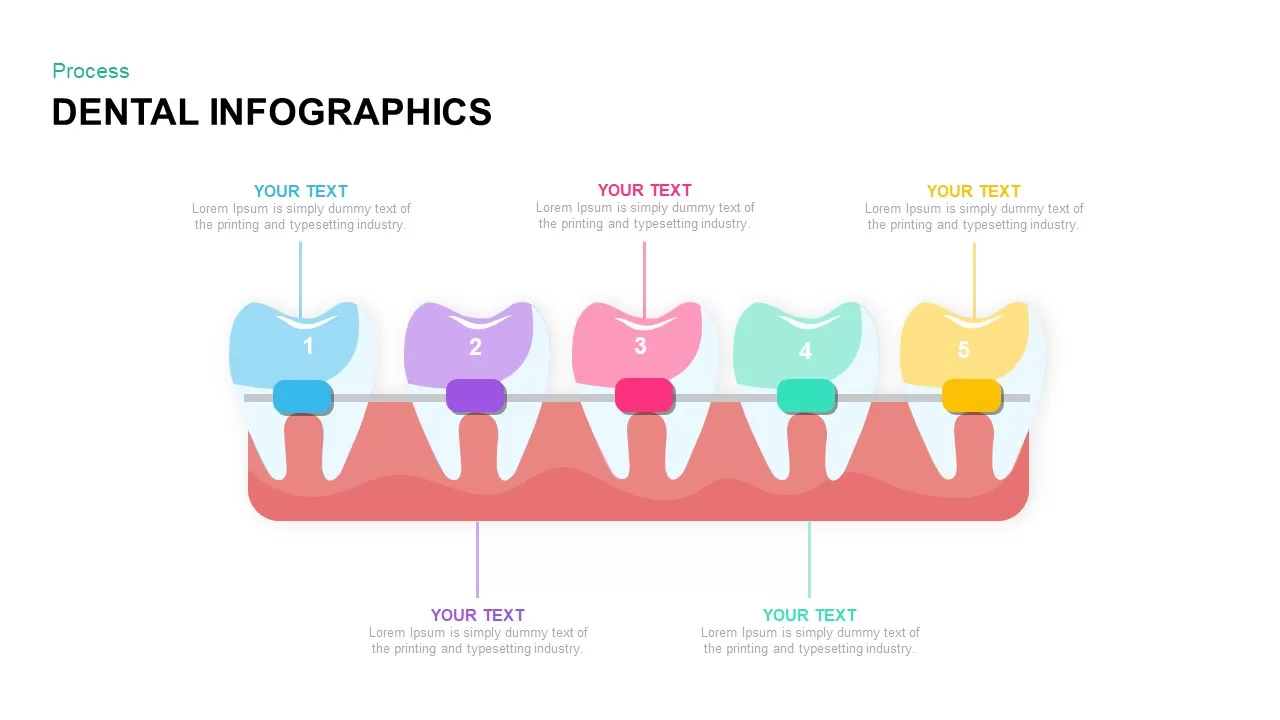
Dental Infographics Process template for PowerPoint & Google Slides
Health
Doodle Infographics Template for PowerPoint & Google Slides
Infographics
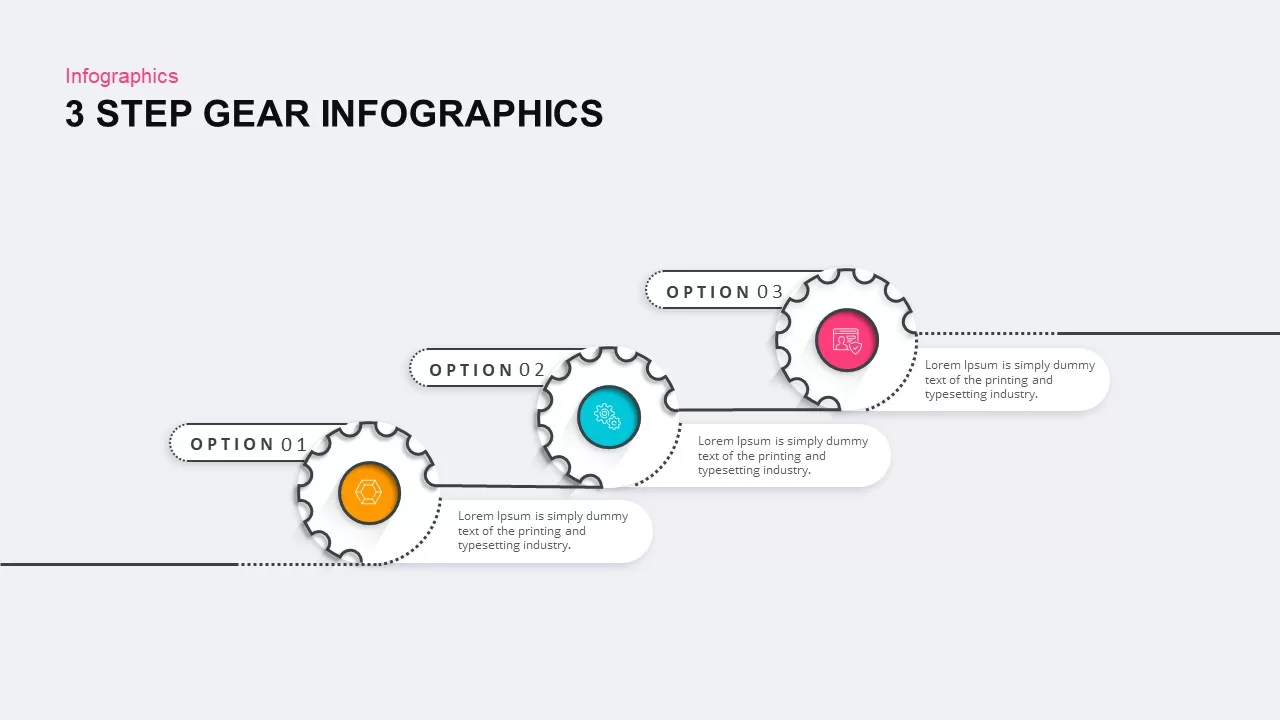
3, 4, and 5 Step Gear Infographics Template for PowerPoint & Google Slides
Process

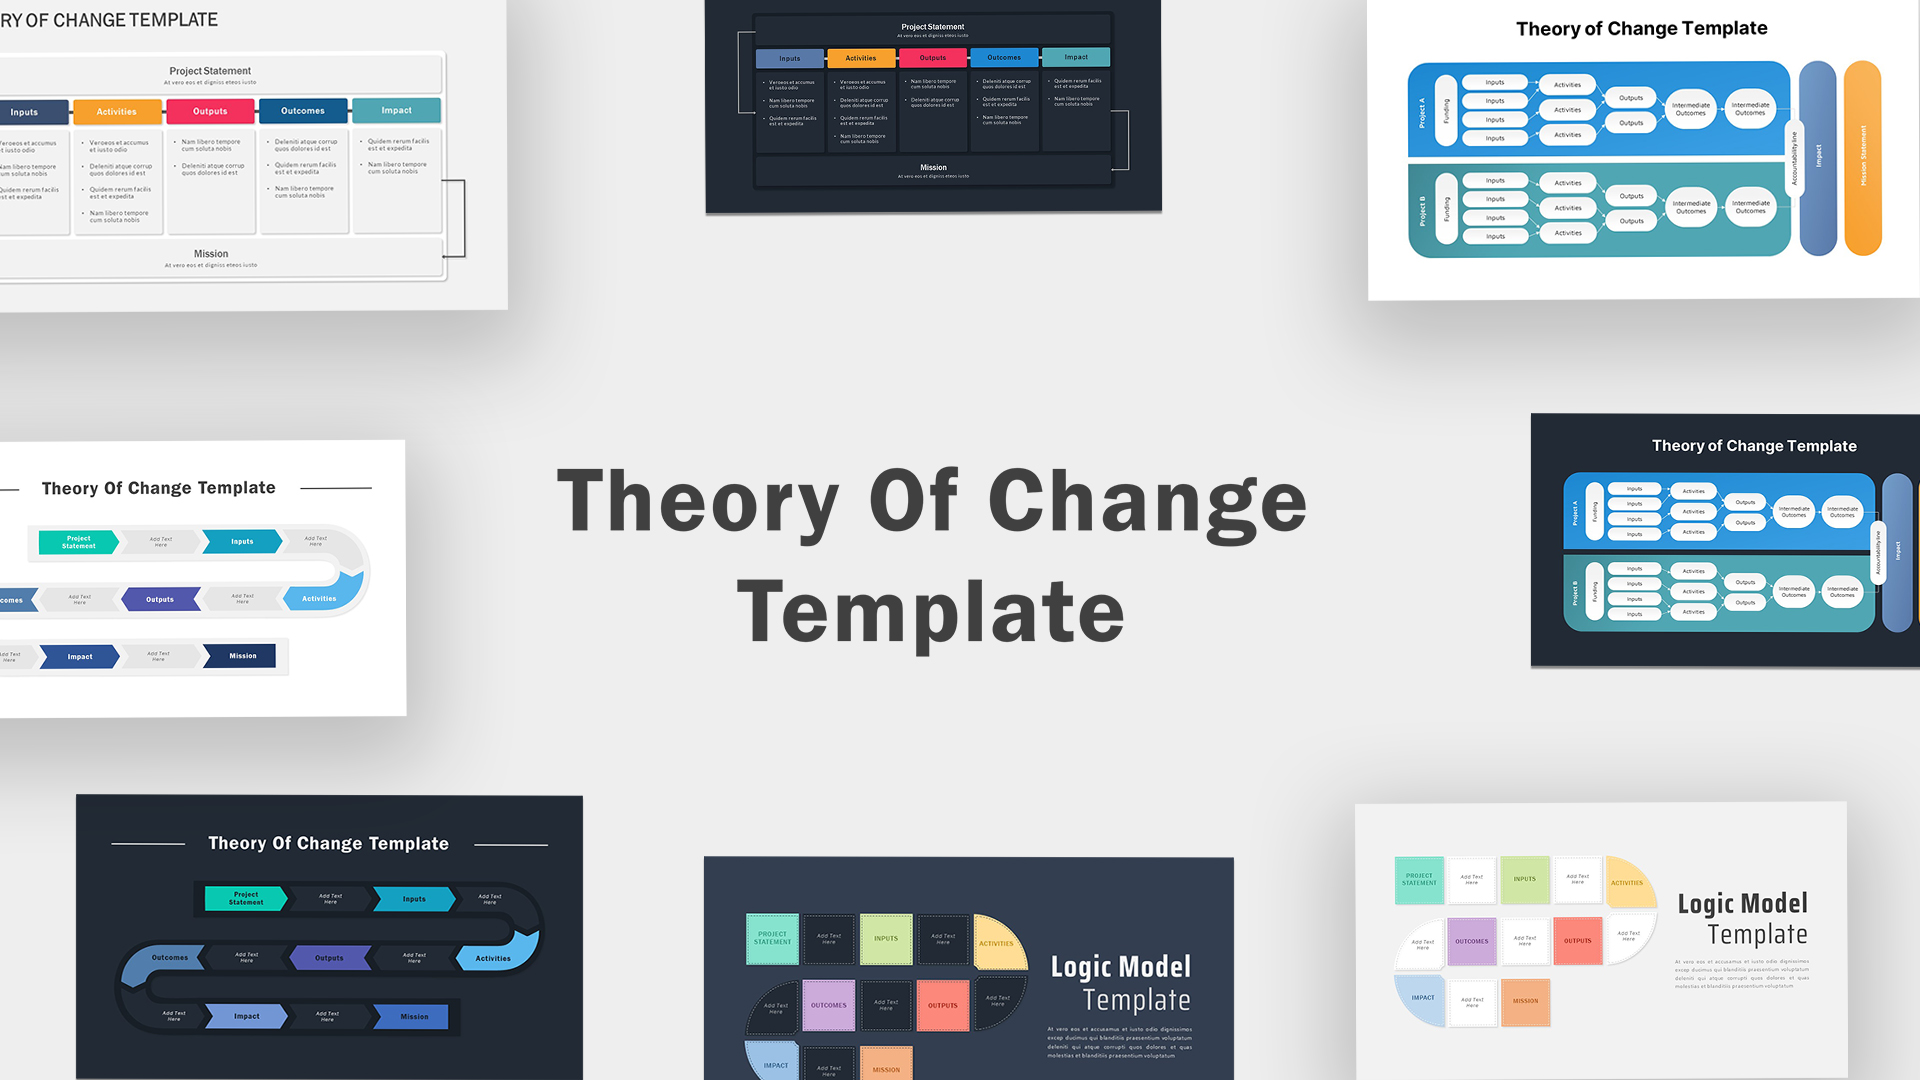
Theory of Change Infographics Pack Template for PowerPoint & Google Slides
Process
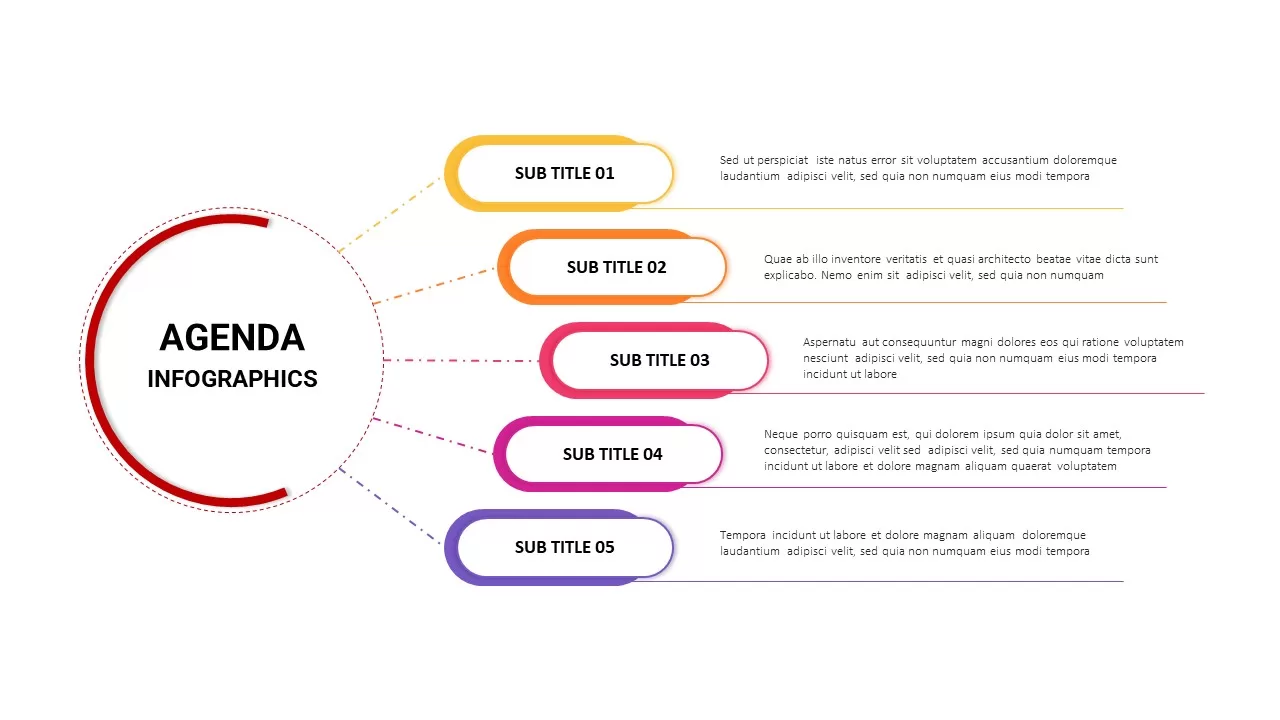
Agenda Infographics Structure template for PowerPoint & Google Slides
Business Plan
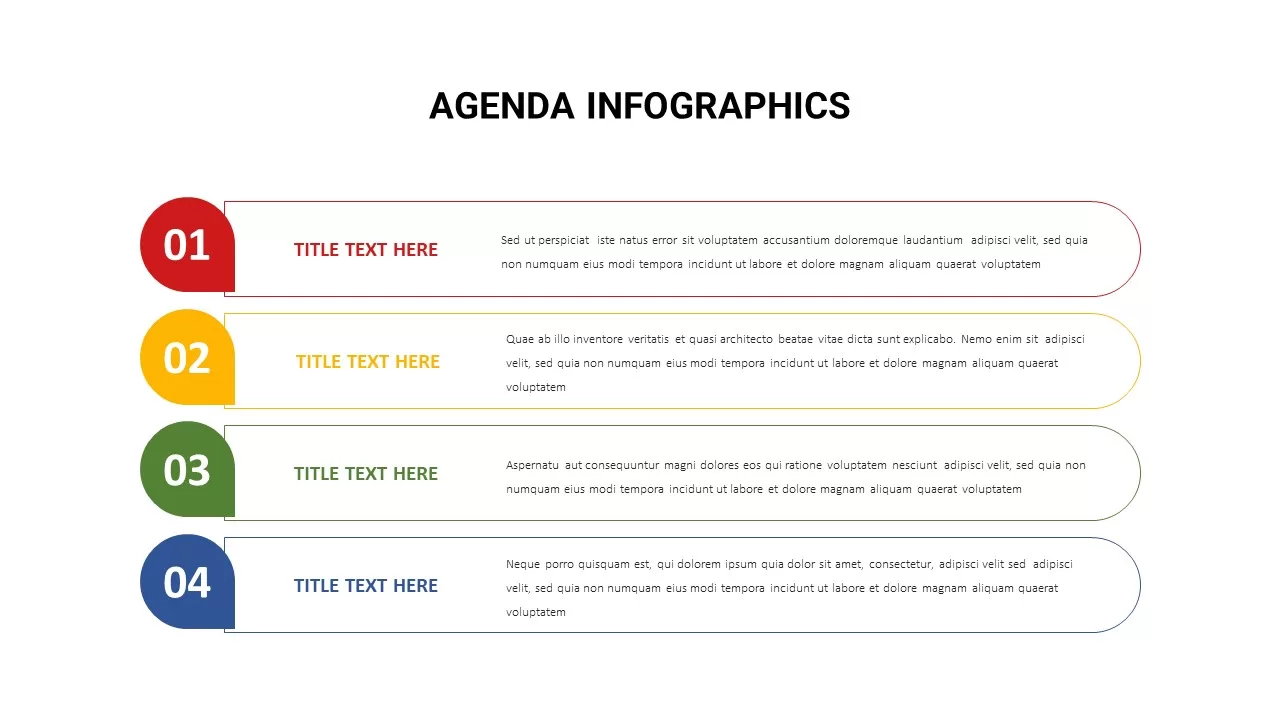
Agenda Infographics List template for PowerPoint & Google Slides
Business Plan
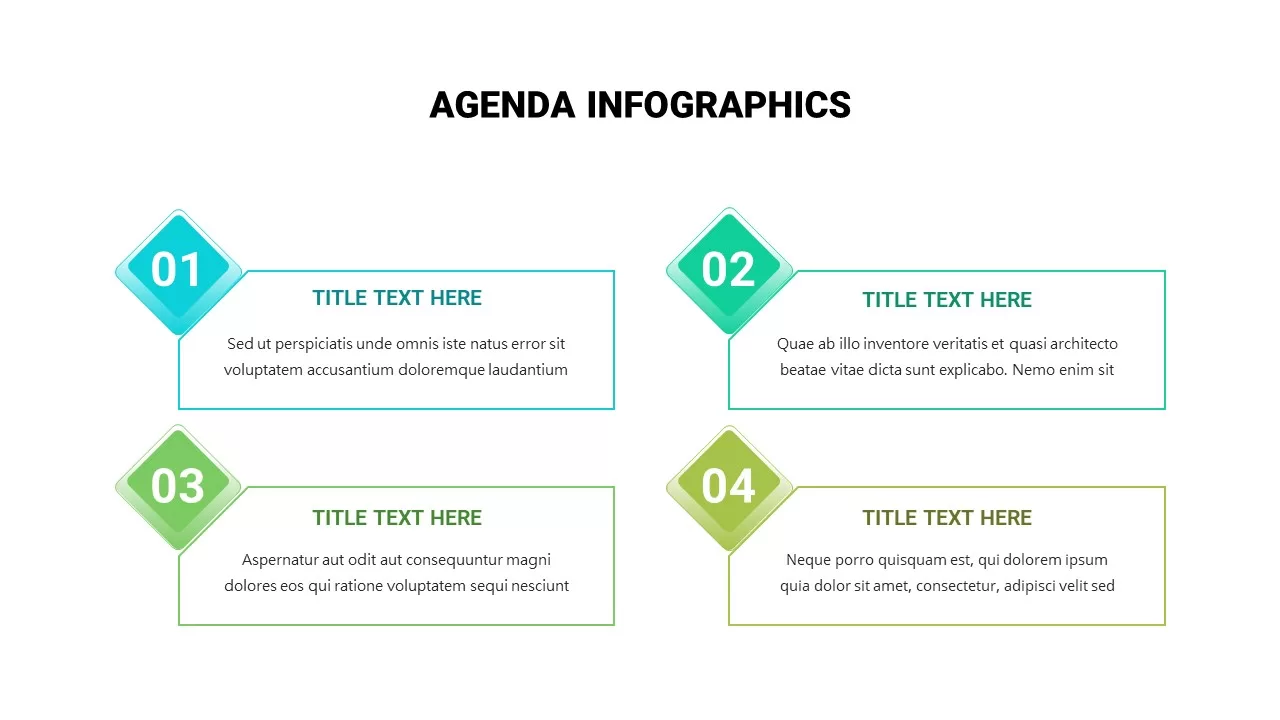
Agenda Infographics Diamond template for PowerPoint & Google Slides
Business Plan
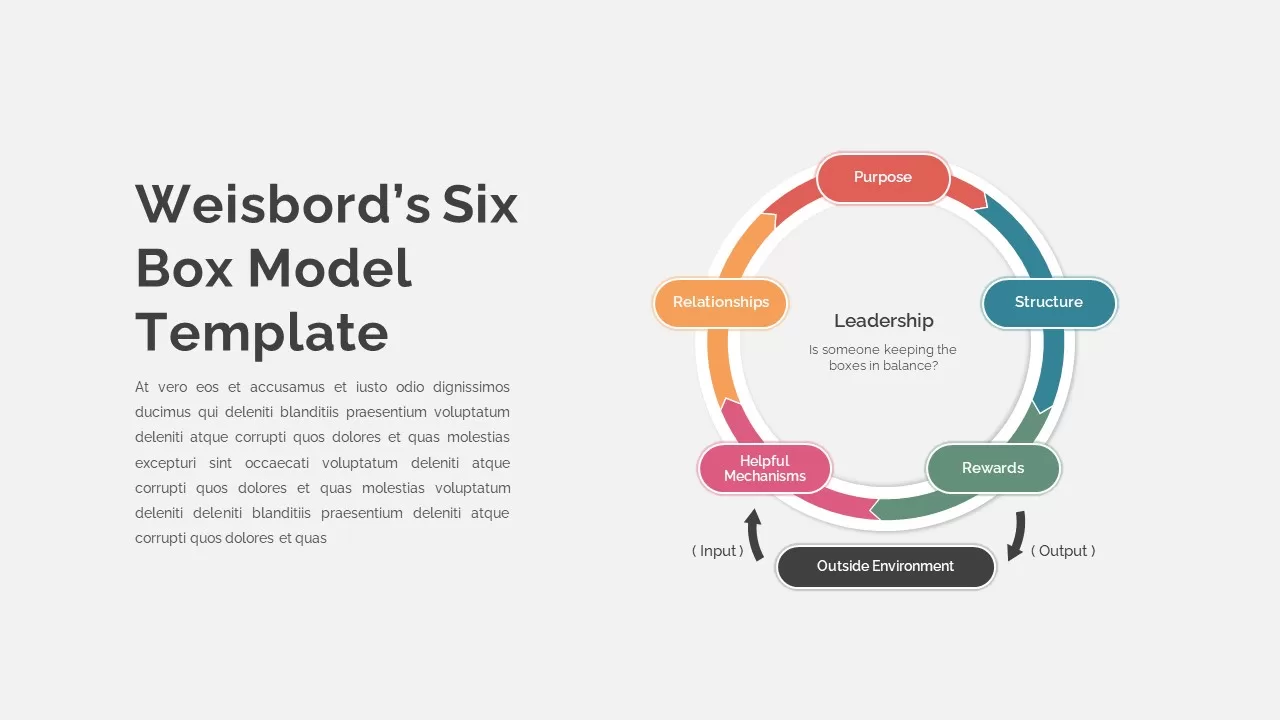
Weisbord’s Six Box Model Infographics Template for PowerPoint & Google Slides
Circular
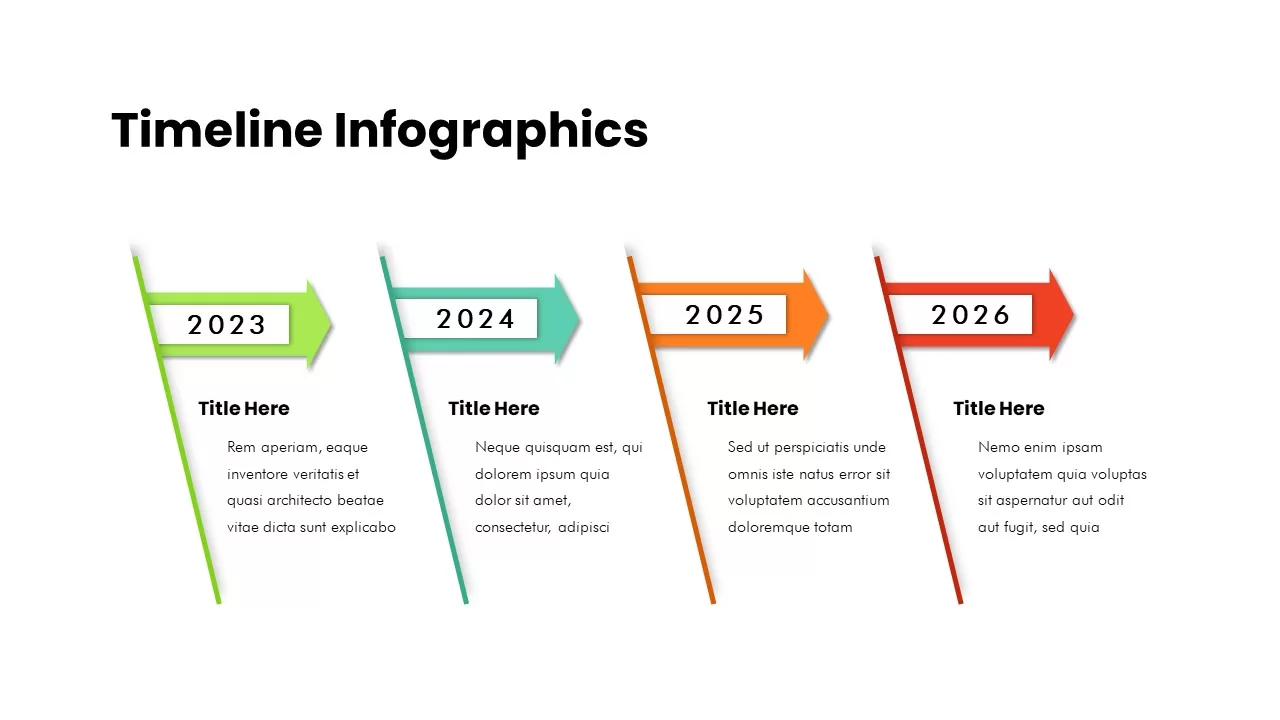
Timeline Infographics template for PowerPoint & Google Slides
Timeline
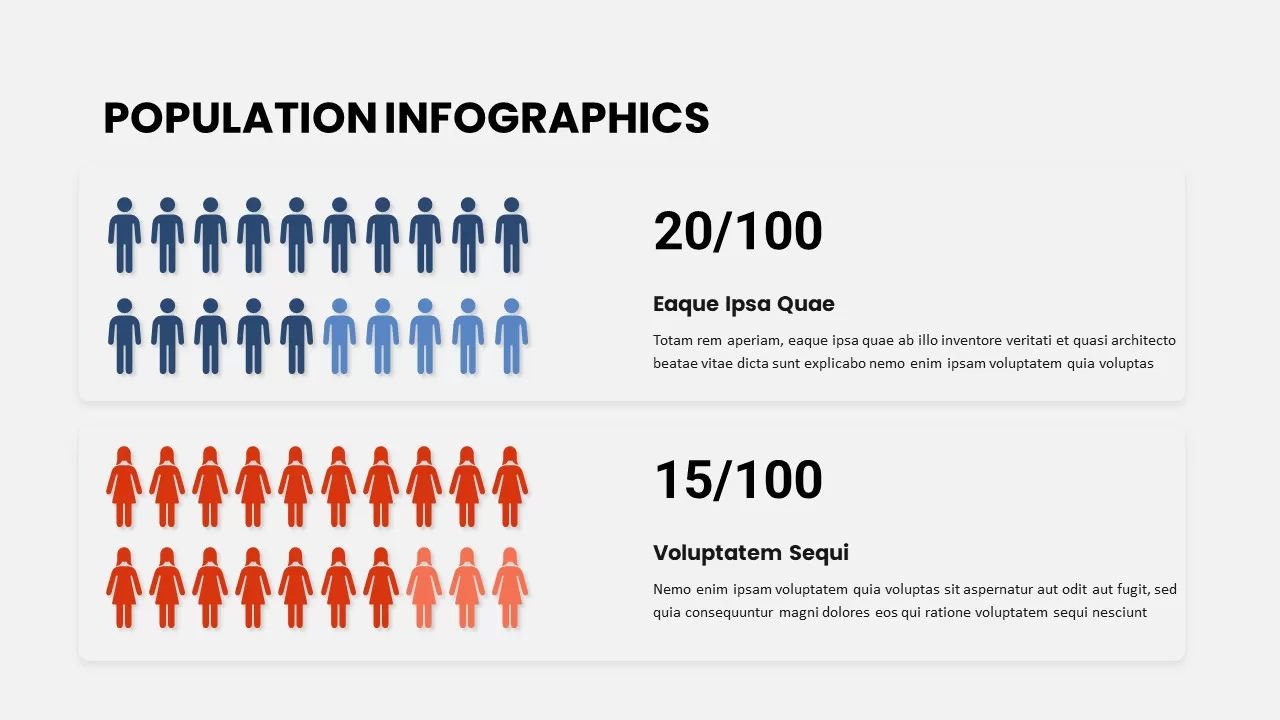
Population Infographics template for PowerPoint & Google Slides
Comparison
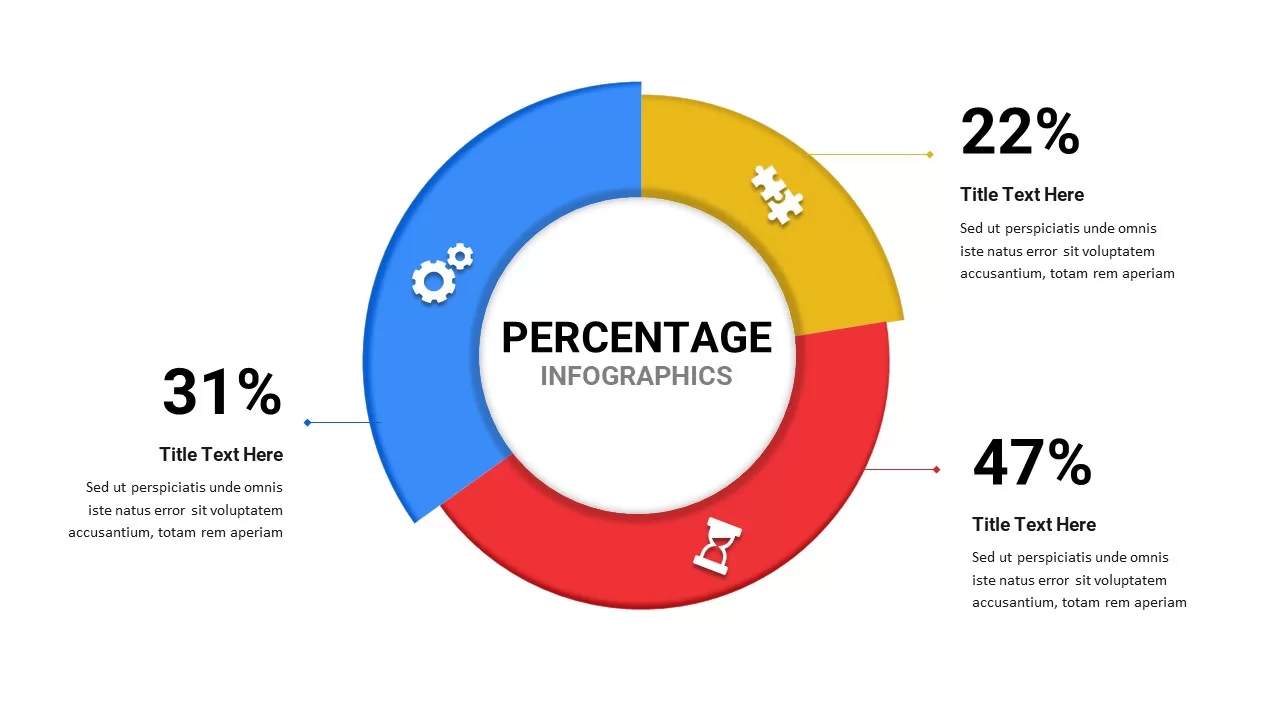
Free Percentage Infographics template for PowerPoint & Google Slides
Comparison
Free
Table of Contents Infographics template for PowerPoint & Google Slides
Company Profile
Supply Chain Circular Process Infographics Template for PowerPoint & Google Slides
Business Strategy
Domino Effect Sequential Infographics Template for PowerPoint & Google Slides
Process
Agriculture Infographics Slide with Progress Rings & Metrics Template for PowerPoint & Google Slides
Pie/Donut
Hiring Process Timeline Infographics Template for PowerPoint & Google Slides
Recruitment
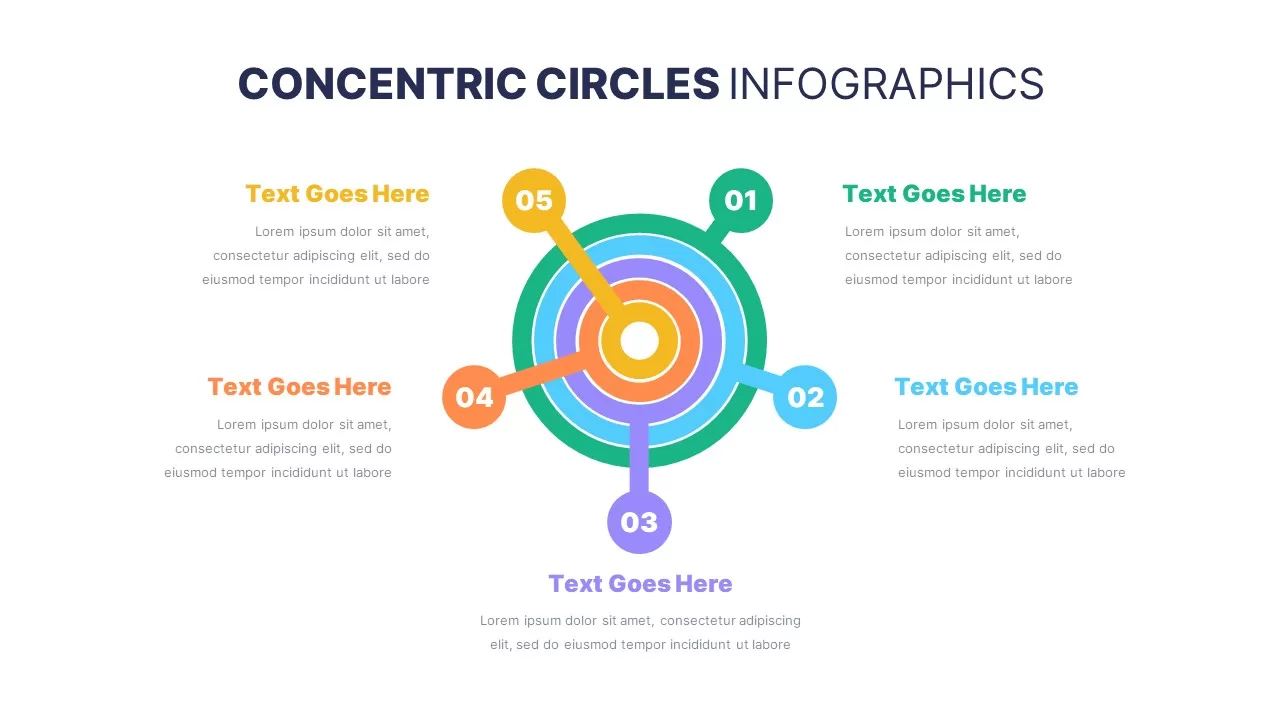
5 Layer Concentric Circles Infographics Template for PowerPoint & Google Slides
Circular
Modern Social Media Infographics Template for PowerPoint & Google Slides
Digital Marketing
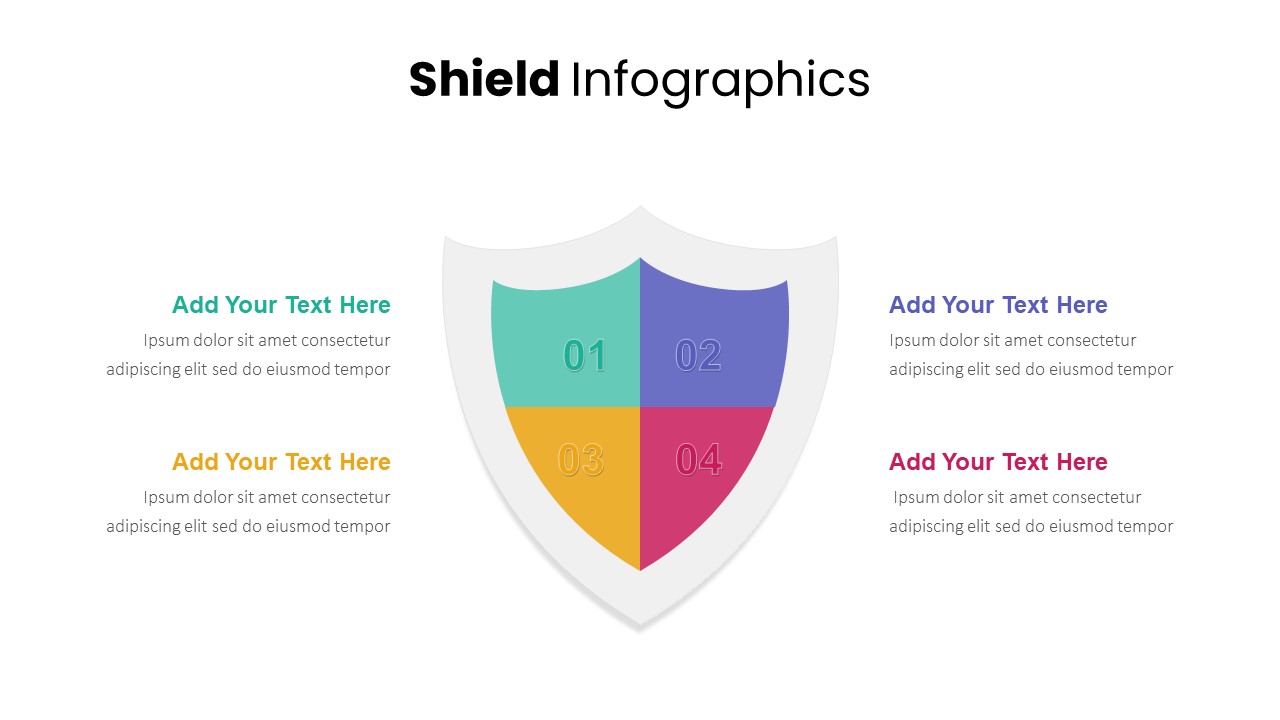
Shield Infographics Four-Part Framework Template for PowerPoint & Google Slides
Process
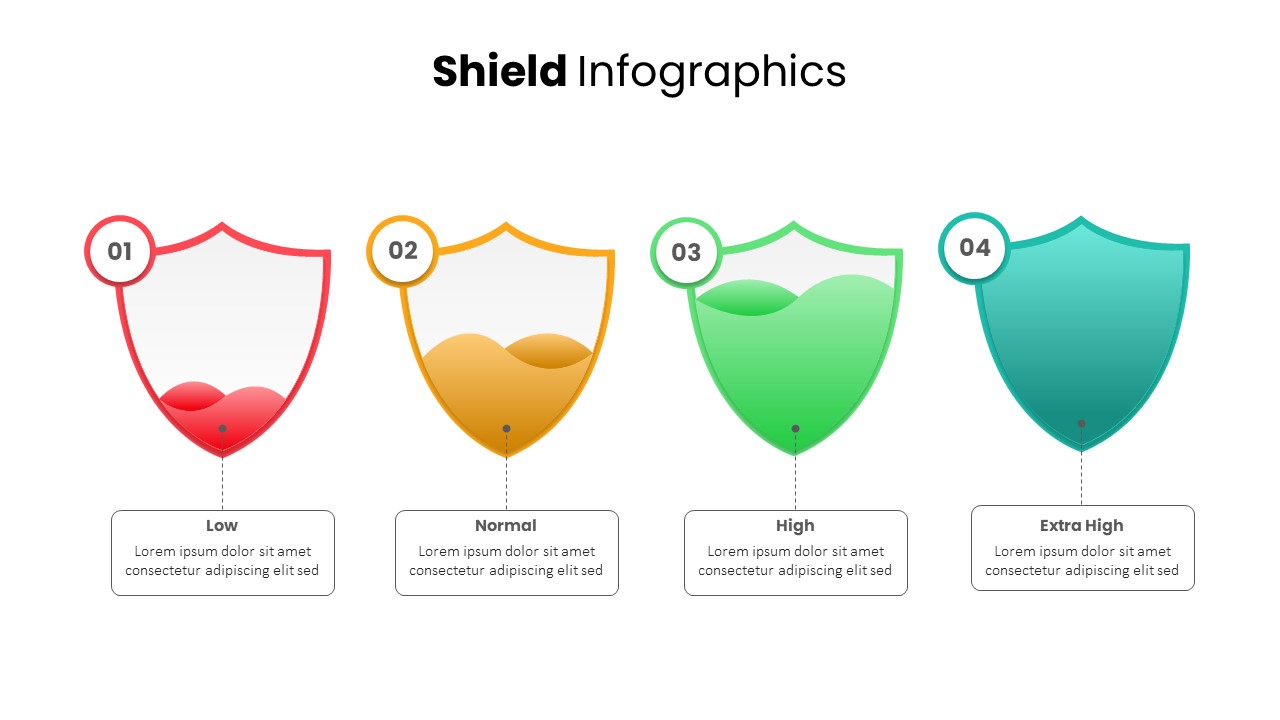
Shield Infographics Risk Indicators Template for PowerPoint & Google Slides
Infographics

DevOps Infographics & Process Flow Template for PowerPoint & Google Slides
Information Technology
Free Colorful Timeline Infographics Template for PowerPoint & Google Slides
Timeline
Free
Banking Service & Finance Infographics Template for PowerPoint & Google Slides
Finance
Free
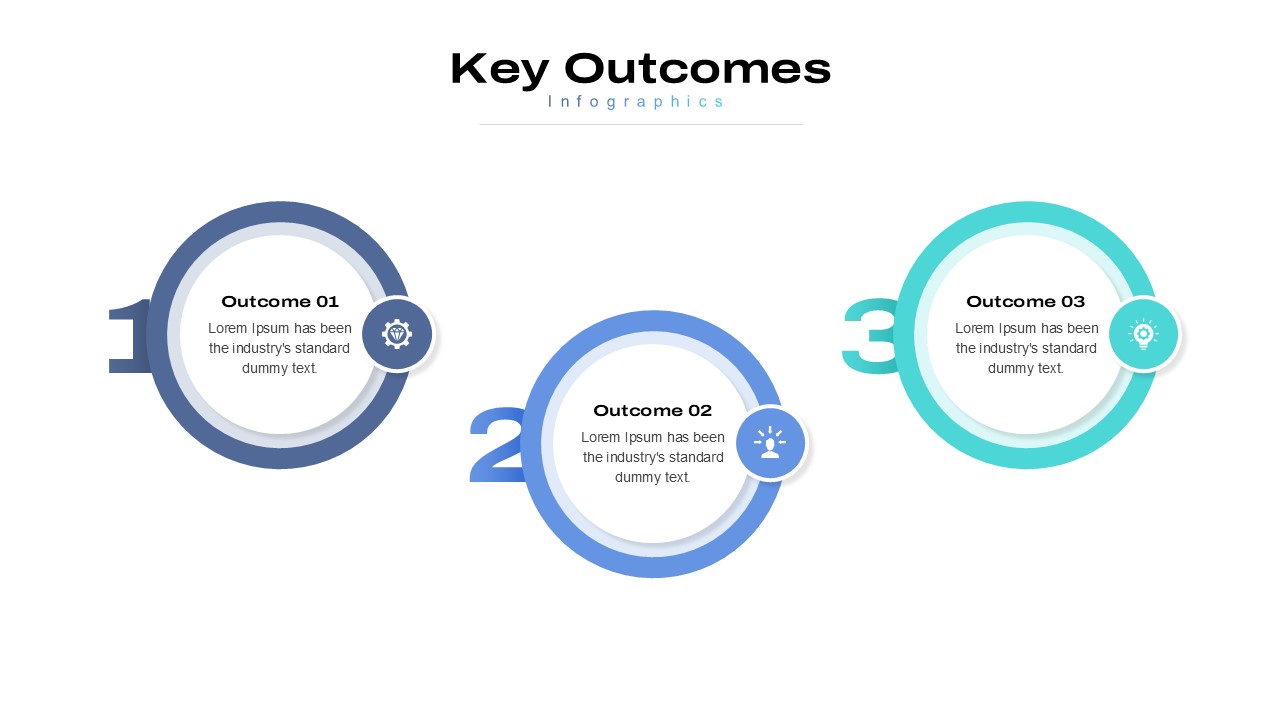
5 Styles Key Outcomes Infographics Pack Template for PowerPoint & Google Slides
Infographics
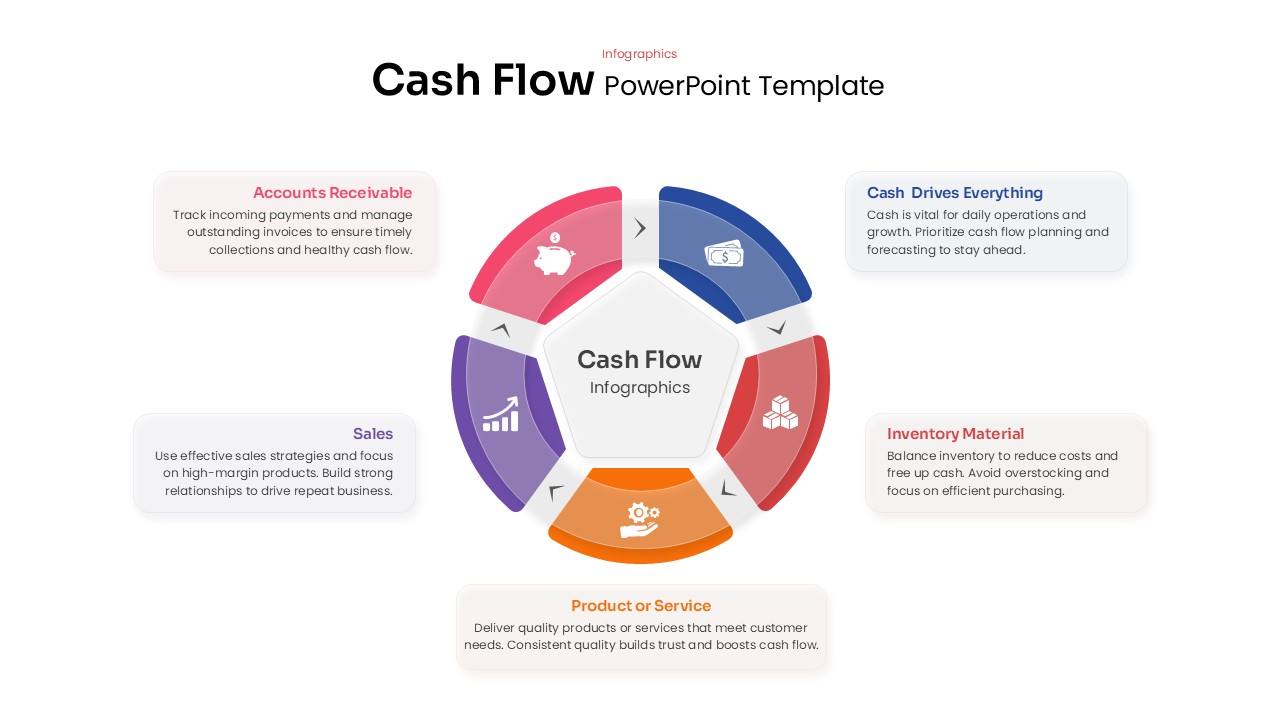
Cash Flow Infographics template for PowerPoint & Google Slides
Business
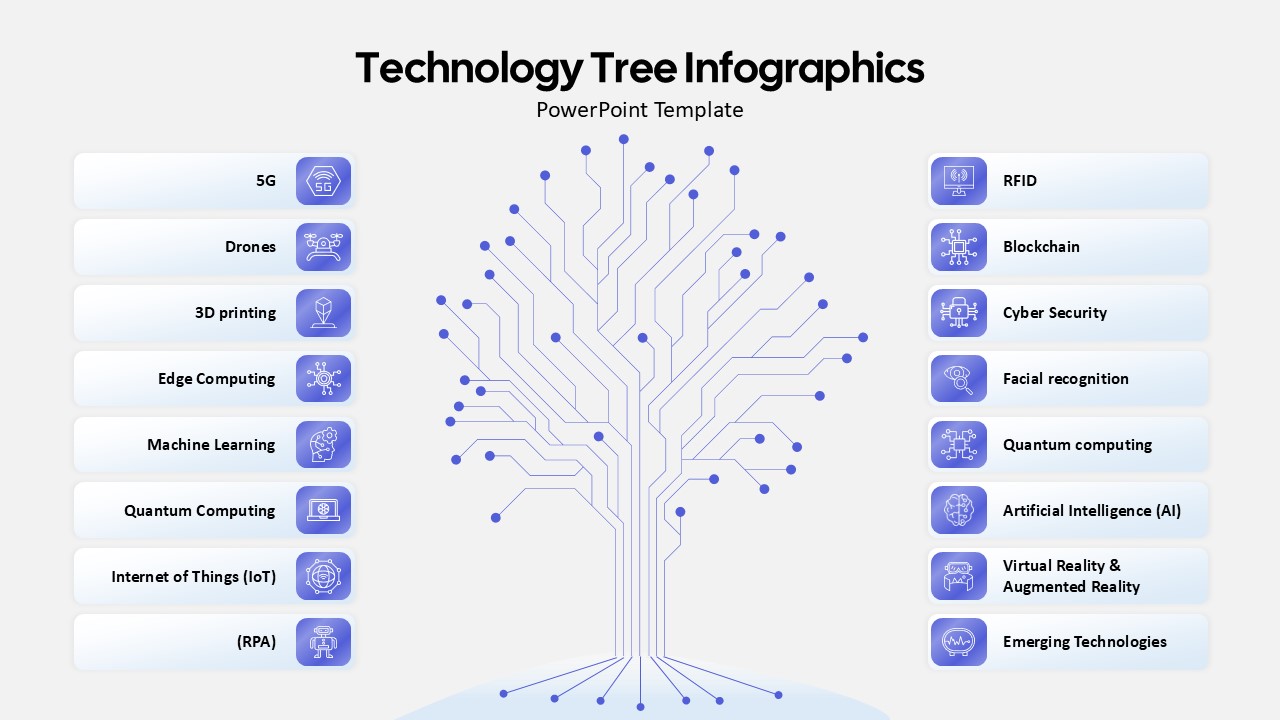
Technology Tree Infographics Template for PowerPoint & Google Slides
AI