3D Block Arrow Infographic Diagram Template for PowerPoint & Google Slides
Description
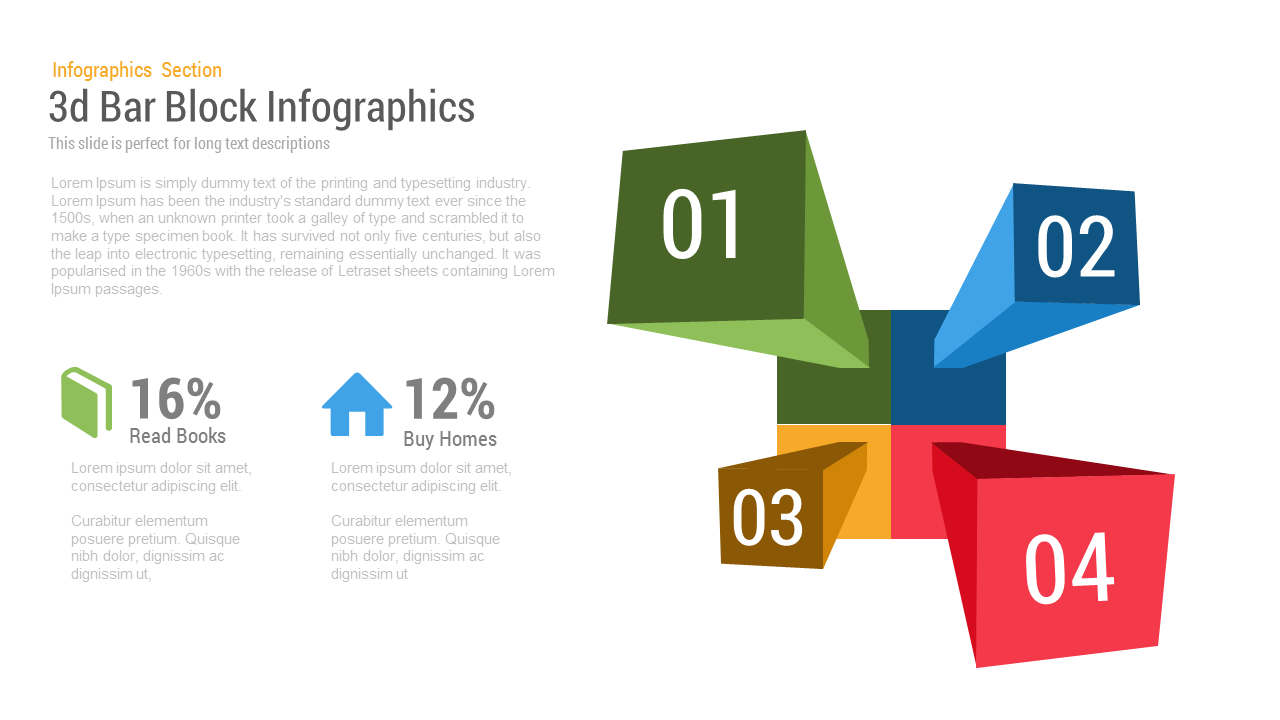
Leverage this 3D block arrow infographic slide to illustrate multi-step processes, workflows, or hierarchical data with modern, eye-catching visuals. The central 3D tower comprises stacked cube layers that wrap into an arrow shape, alternating contrasting hues—teal, dark navy, and light gray—to differentiate each stage. Four callouts with line connectors and icon placeholders surround the shape, guiding viewers through sequential steps or categories. Crisp sans-serif typography and ample white space ensure legibility, while the flat yet dimensional vector design adds professional depth without visual clutter.
Fully editable and vector-based, this template supports rapid customization. Swap out icons, adjust layer colors, or modify the number of block segments to match your brand identity or presentation theme. Master slide integration and grouped shapes enable drag-and-drop operations and seamless resizing across all elements, preserving alignment and proportions as you tailor the slide. Transparent PNG exports and slide-layout options further expand your creative control.
Optimized for both PowerPoint and Google Slides, the slide delivers consistent formatting and full-resolution clarity across devices. Built-in theme colors let you apply corporate palettes in seconds, preventing version conflicts during collaborative editing. Whether you are mapping project phases, outlining strategic roadmaps, or presenting KPI breakdowns, the 3D arrow design commands attention and facilitates comprehension.
Who is it for
Project managers, product owners, and team leads can use this slide to map sequential workflows and strategic roadmaps. Marketing and sales teams can illustrate campaign phases and performance milestones with clarity. Consultants, trainers, and educators will find the visual metaphor useful for illustrating multi-step frameworks during workshops and training sessions.
Other Uses
Beyond process mapping, repurpose this template for KPI tracking, risk assessment stages, or audit checklists. Adapt the block layers to depict life cycle phases, decision tree branches, or customer journey touchpoints. The 3D arrow structure lends itself to digital transformation roadmaps, product development timelines, and resource allocation overviews.
Login to download this file

Item ID
SB01537
Related Templates

3D Block Infographic template for PowerPoint & Google Slides
Infographics
Modular Block Infographic Slide Template for PowerPoint & Google Slides
Infographics
Six-Layer 3D Block Stack Infographic Template for PowerPoint & Google Slides
Process
Isometric Block Infographic Steps Template for PowerPoint & Google Slides
Process
Colorful Block Infographic Metrics Slide Template for PowerPoint & Google Slides
Infographics
Isometric Block Steps Infographic Template for PowerPoint & Google Slides
Process
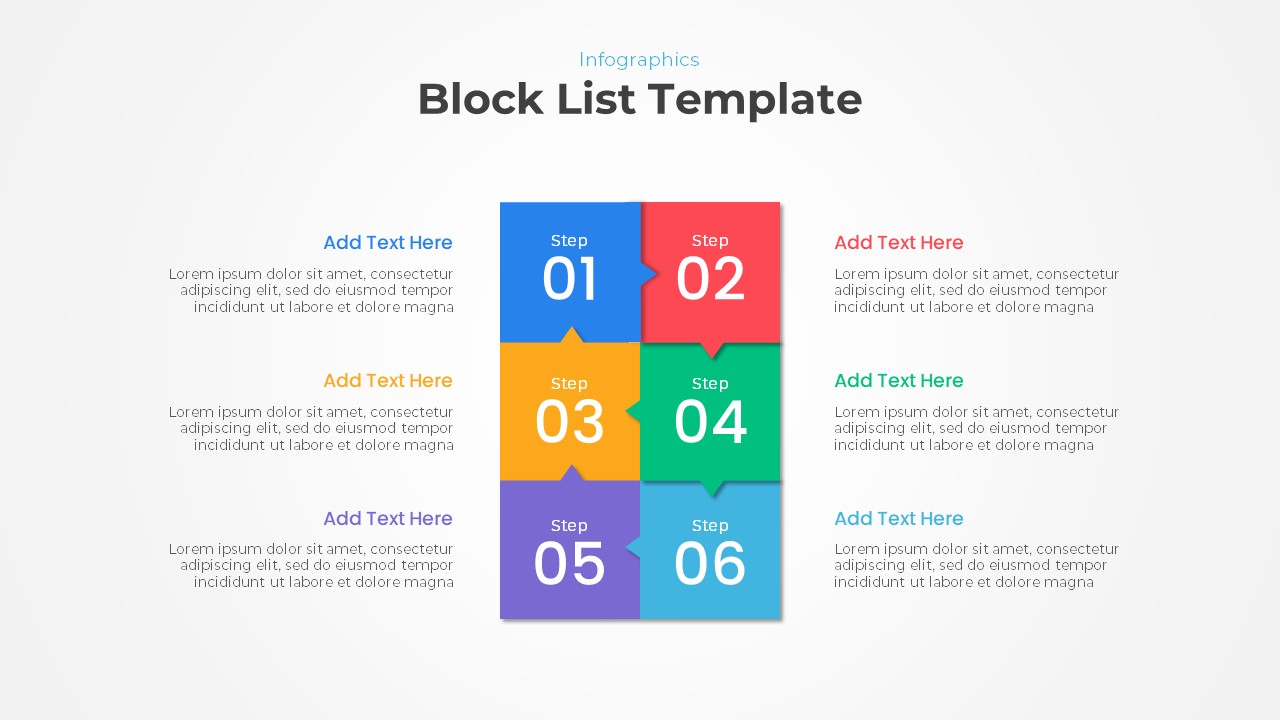
Creative Block List Infographic Template for PowerPoint & Google Slides
Agenda
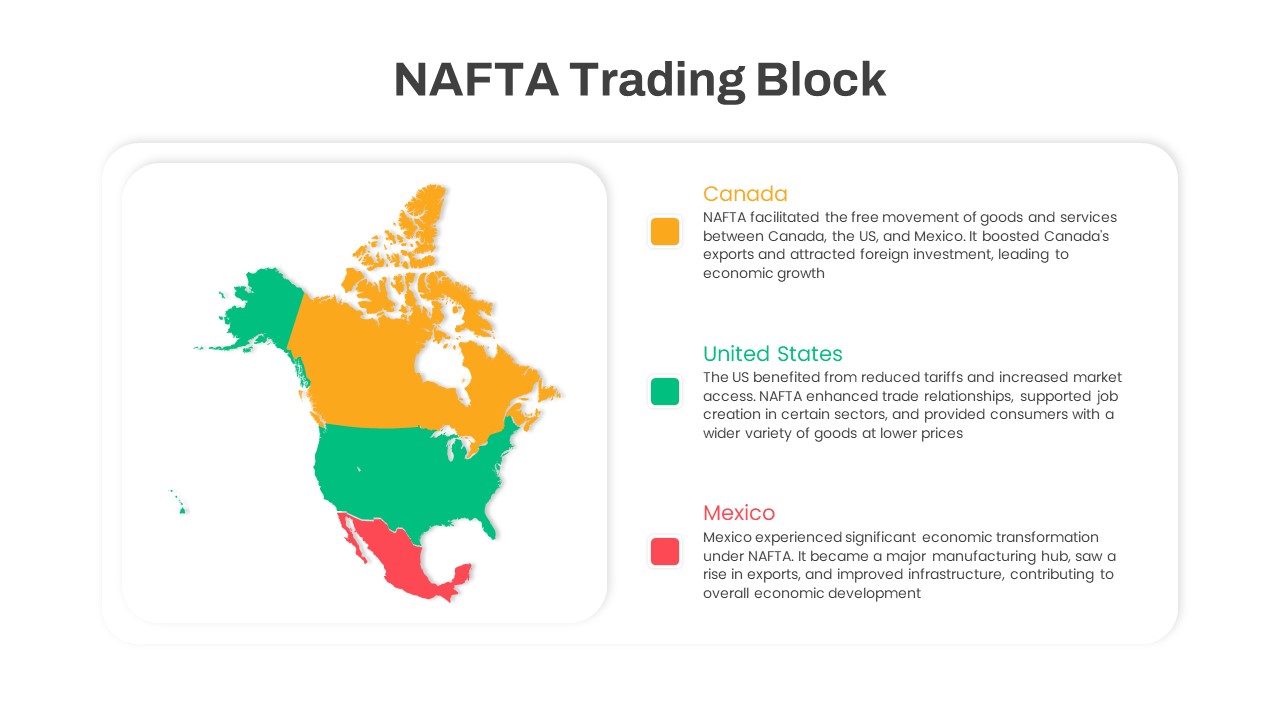
NAFTA Trading Block Map Infographic Template for PowerPoint & Google Slides
World Maps
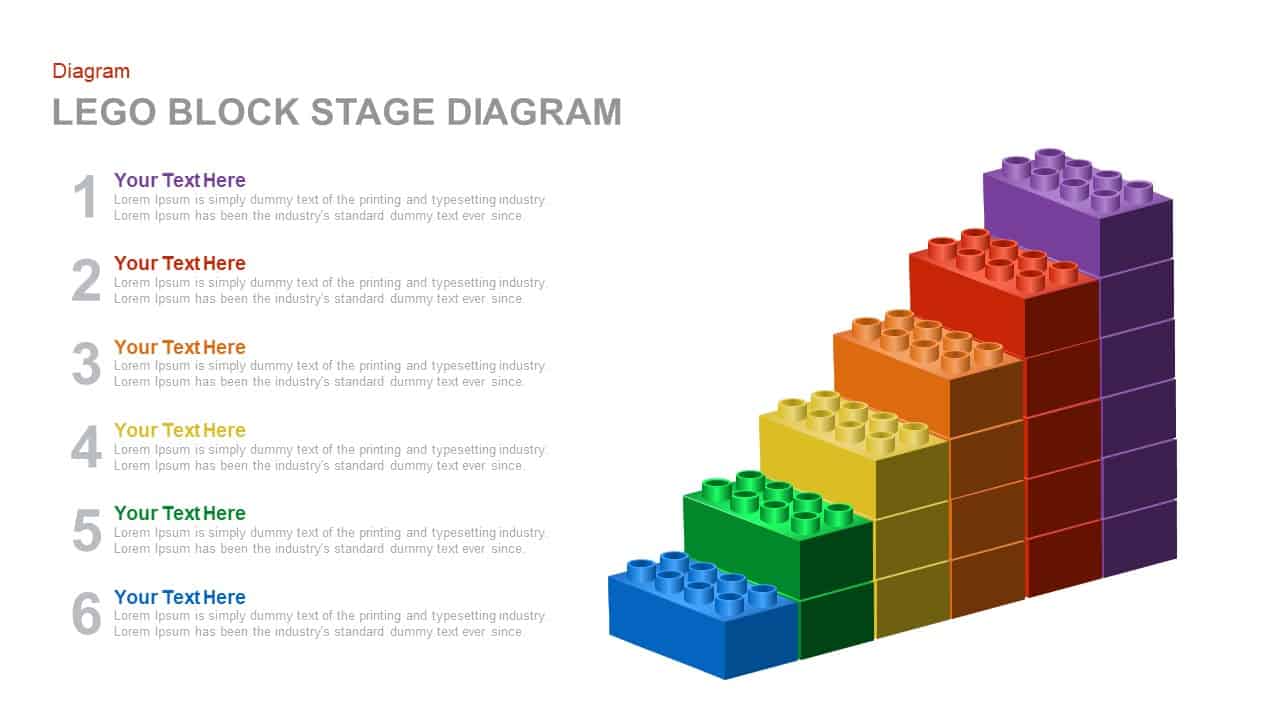
Colorful LEGO Block Stage Diagram Template for PowerPoint & Google Slides
Process

Isometric 3D Block Comparison Diagram Template for PowerPoint & Google Slides
Comparison
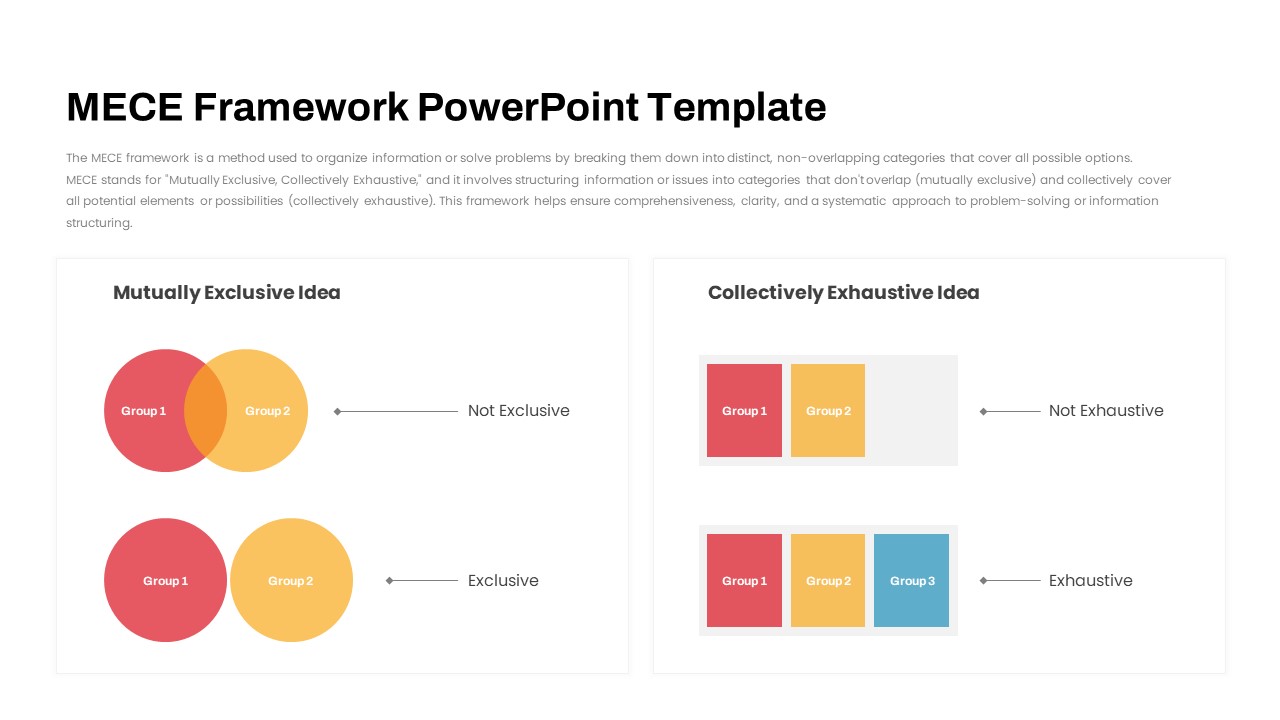
MECE Framework Venn & Block Diagram Template for PowerPoint & Google Slides
Comparison
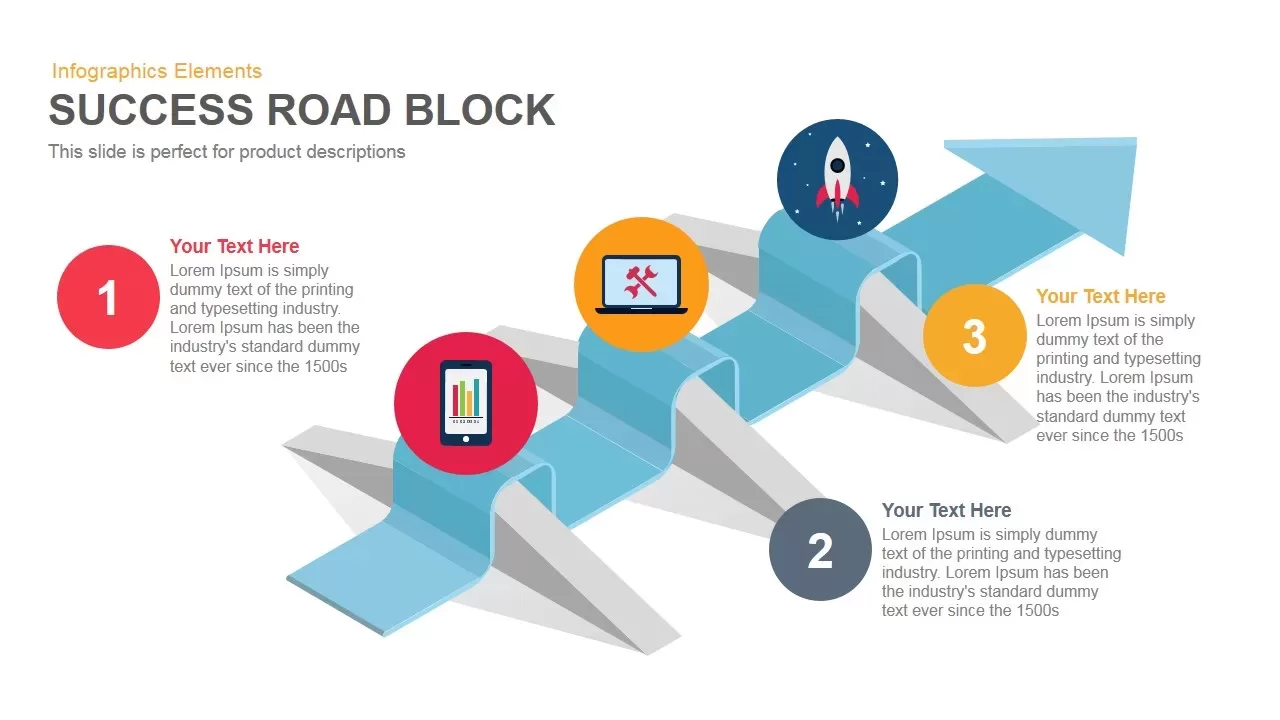
Success Road Block template for PowerPoint & Google Slides
Process

Modern Ten-Block Section Title Chart template for PowerPoint & Google Slides
Comparison
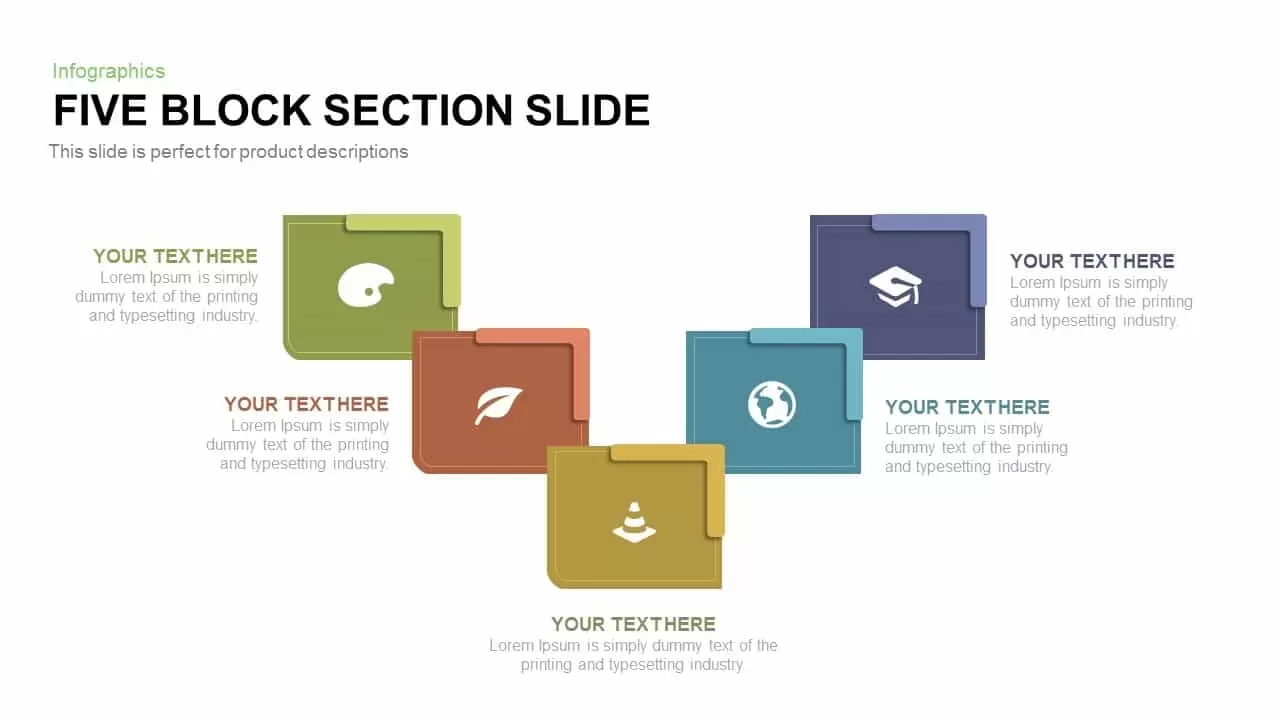
Five-Block Section Feature Highlights Template for PowerPoint & Google Slides
Comparison
Six-Block Capability Statement Template for PowerPoint & Google Slides
Business Report
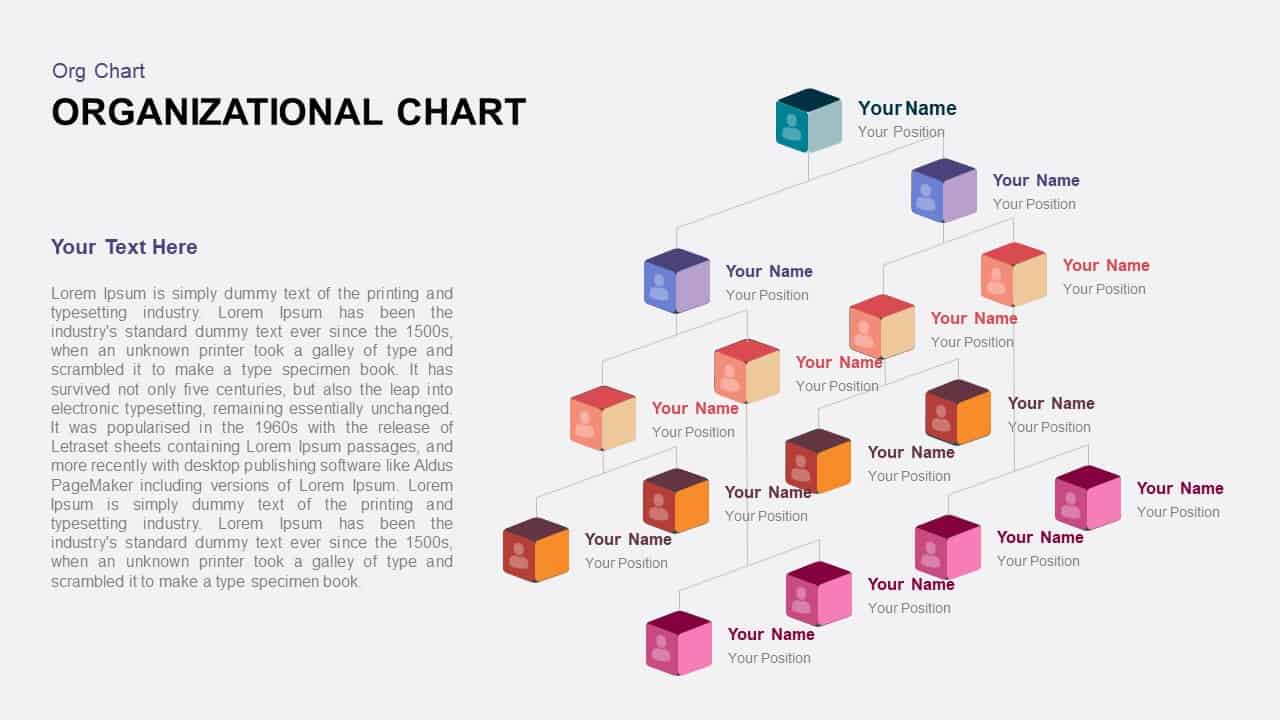
3D Color Block Organizational Chart Slide for PowerPoint & Google Slides
Org Chart
Five Up Arrow Infographic Diagram Template for PowerPoint & Google Slides
Arrow
Four-Section Arrow Infographic Diagram Template for PowerPoint & Google Slides
Arrow
Free Curved Arrow Infographic Diagram Template for PowerPoint & Google Slides
Arrow
Free
Different Directional Arrow Infographic Template for PowerPoint & Google Slides
Arrow
Five 3D Growth Arrow Infographic Slide Template for PowerPoint & Google Slides
Arrow
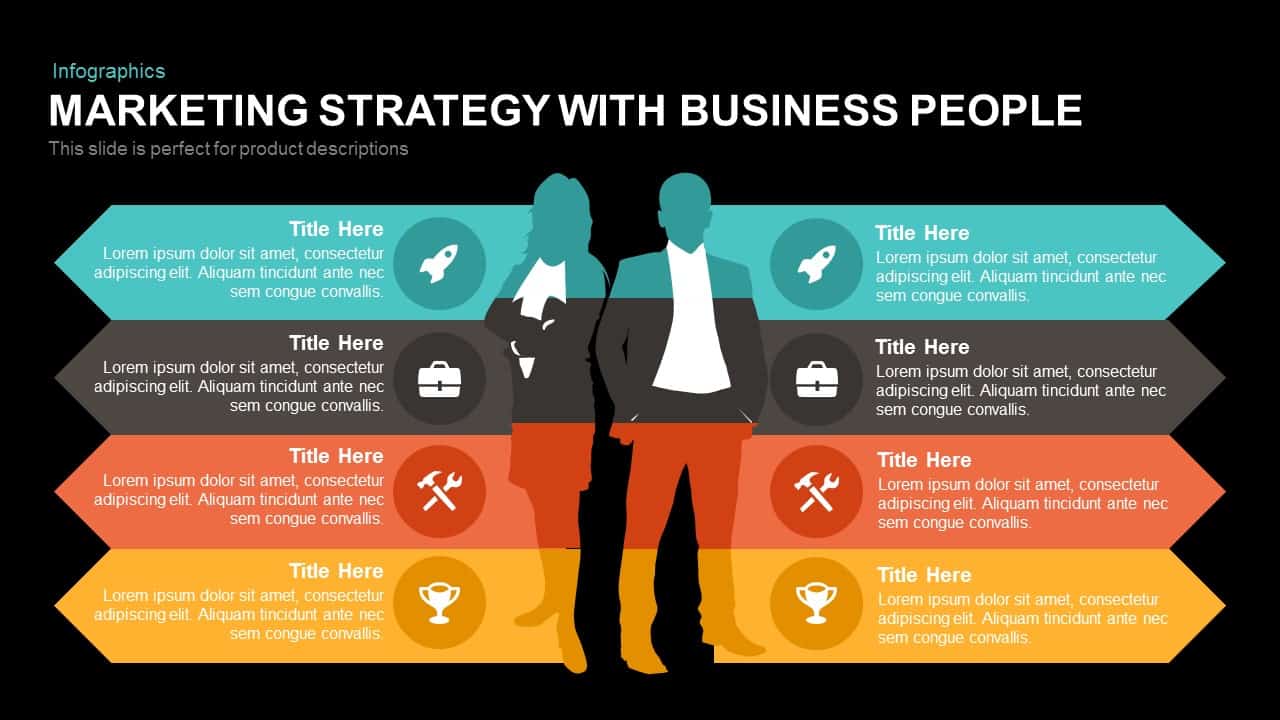
Marketing Strategy Arrow Infographic Template for PowerPoint & Google Slides
Comparison

Arrow Infographic Template for PowerPoint & Google Slides
Arrow

Two Directional Arrow Infographic Template for PowerPoint & Google Slides
Arrow
Five-Stage Growth Arrow Infographic Template for PowerPoint & Google Slides
Arrow

Eight Post-It Note Arrow Infographic Template for PowerPoint & Google Slides
Arrow
Four-Step Arrow Process Infographic Template for PowerPoint & Google Slides
Arrow
Arrow Timeline Infographic Slide Template for PowerPoint & Google Slides
Timeline
Four-Option 4-Step Arrow Infographic Template for PowerPoint & Google Slides
Arrow
Dynamic Growth Arrow Step Infographic Template for PowerPoint & Google Slides
Process
Goal Arrow and Target Infographic Template for PowerPoint & Google Slides
Goals
4-Way Radial Arrow Infographic Template for PowerPoint & Google Slides
Arrow
Technology Arrow Infographic Template for PowerPoint & Google Slides
Pitch Deck
Upward Arrow infographic template for PowerPoint & Google Slides
Infographics
Arrow infographic template for PowerPoint & Google Slides
Business
Free Multi-Year Arrow Timeline Infographic Template for PowerPoint & Google Slides
Timeline
Free
Curved Arrow Process Flow Infographic Template for PowerPoint & Google Slides
Process
5-Step Curved Arrow Infographic Template for PowerPoint & Google Slides
Arrow
Three-Path Curved Arrow Infographic Template for PowerPoint & Google Slides
Arrow
Four-Stage Circle Arrow Infographic Template for PowerPoint & Google Slides
Circular
Accomplishment Arrow Infographic Template for PowerPoint & Google Slides
Accomplishment
Five-Stage Circular Arrow Infographic Template for PowerPoint & Google Slides
Circular
Four-Stage Circle Arrow Infographic Template for PowerPoint & Google Slides
Circular
Six-Segment Circular Arrow Infographic Template for PowerPoint & Google Slides
Circular
Social Media Infographic Arrow Layout Template for PowerPoint & Google Slides
Arrow
Bow and Arrow Goal Infographic Slide Template for PowerPoint & Google Slides
Goals
4 Step Arrow Diagram template for PowerPoint & Google Slides
Arrow
5-Step Arrow Diagram template for PowerPoint & Google Slides
Arrow
3D Four Arrow Infographics Diagram Template for PowerPoint & Google Slides
Arrow
5 Arrow Process Diagram Template for PowerPoint & Google Slides
Infographics
Six Arrow Radial Process Diagram template for PowerPoint & Google Slides
Infographics
6-Step Arrow Process Diagram Template for PowerPoint & Google Slides
Process
Colorful Arrow Process Diagram Template for PowerPoint & Google Slides
Arrow
Arrow Process Diagram Template for PowerPoint & Google Slides
Process
Three Circle Arrow Process Diagram template for PowerPoint & Google Slides
Circular
5 Arrow Diagram template for PowerPoint & Google Slides
Arrow
3D Sphere Arrow Process Diagram template for PowerPoint & Google Slides
Arrow

Three Stage 3D Arrow Process Diagram Template for PowerPoint & Google Slides
Process
Arrow Stage Process Diagram template for PowerPoint & Google Slides
Arrow
Four Directional Arrow Diagram Template for PowerPoint & Google Slides
Arrow
Five Arrow Infographics Diagram Template for PowerPoint & Google Slides
Arrow
Five-Section Circular Arrow Diagram Template for PowerPoint & Google Slides
Circular
Six Pointing Arrow Process Diagram Template for PowerPoint & Google Slides
Arrow
Seven-Stage Arrow Process Diagram Template for PowerPoint & Google Slides
Process
Five-Stage Zig-Zag Arrow Diagram Template for PowerPoint & Google Slides
Process
Five-Section Arrow Signpost Diagram Template for PowerPoint & Google Slides
Arrow
Five-Stage Circle Arrow Diagram Template for PowerPoint & Google Slides
Circular
Four-Way Directional Arrow Diagram Template for PowerPoint & Google Slides
Arrow
Timeline Arrow Infographics Diagram Template for PowerPoint & Google Slides
Timeline
Five-Stage Pentagon Arrow Diagram Template for PowerPoint & Google Slides
Arrow
Seven-Segment Circular Arrow Diagram Template for PowerPoint & Google Slides
Arrow
8-Step Circular Arrow Diagram Template for PowerPoint & Google Slides
Arrow
Six-Process Circular Arrow Diagram Template for PowerPoint & Google Slides
Circular
8 Steps Arrow Process Diagram template for PowerPoint & Google Slides
Process
Pros & Cons Arrow Diagram template for PowerPoint & Google Slides
Comparison Chart

Elegant Process Support Arrow Diagram Template for PowerPoint & Google Slides
Arrow
Four-Point Arrow Cycle Diagram Template for PowerPoint & Google Slides
Arrow
Six-Step Two-Sided Arrow Diagram Template for PowerPoint & Google Slides
Process
Four-Staged Business Arrow Diagram Template for PowerPoint & Google Slides
Process
Five-Stage Cyclic Process Arrow Diagram Template for PowerPoint & Google Slides
Process
Eight-Stage Zigzag Arrow Diagram Template for PowerPoint & Google Slides
Process
Free Six-Stage Arrow Process Diagram Template for PowerPoint & Google Slides
Process
Free
Six-Step Linear Arrow Process Diagram Template for PowerPoint & Google Slides
Process
Eight-Step Inward Arrow Diagram Template for PowerPoint & Google Slides
Arrow
Three-Way Decision Process Arrow Diagram Template for PowerPoint & Google Slides
Arrow
Five Stage Circular Arrow Diagram Template for PowerPoint & Google Slides
Process
Six-Stage Arrow Timeline Diagram Template for PowerPoint & Google Slides
Timeline
Agile Work Streams Arrow Diagram Template for PowerPoint & Google Slides
Process
Curved Arrow Process Flow Diagram Template for PowerPoint & Google Slides
Process
Curved Arrow Process Flow Diagram Template for PowerPoint & Google Slides
Arrow
Curved Arrow Flow Diagram template for PowerPoint & Google Slides
Business
Concentric Circular Arrow Cycle Diagram Template for PowerPoint & Google Slides
Process
Three-Step Curved Arrow Process Diagram Template for PowerPoint & Google Slides
Arrow
Four-Arrow Curved Hub-and-Spoke Diagram Template for PowerPoint & Google Slides
Arrow
Hand-Drawn Four-Step Curved Arrow Diagram Template for PowerPoint & Google Slides
Arrow
Four-Step Curved Arrow Diagram Template for PowerPoint & Google Slides
Arrow
Circular Arrow Process Diagram Template for PowerPoint & Google Slides
Circular
Pentagon Arrow Process Diagram Template for PowerPoint & Google Slides
Process
Four-Step Arrow Reference Diagram Slide Template for PowerPoint & Google Slides
Arrow
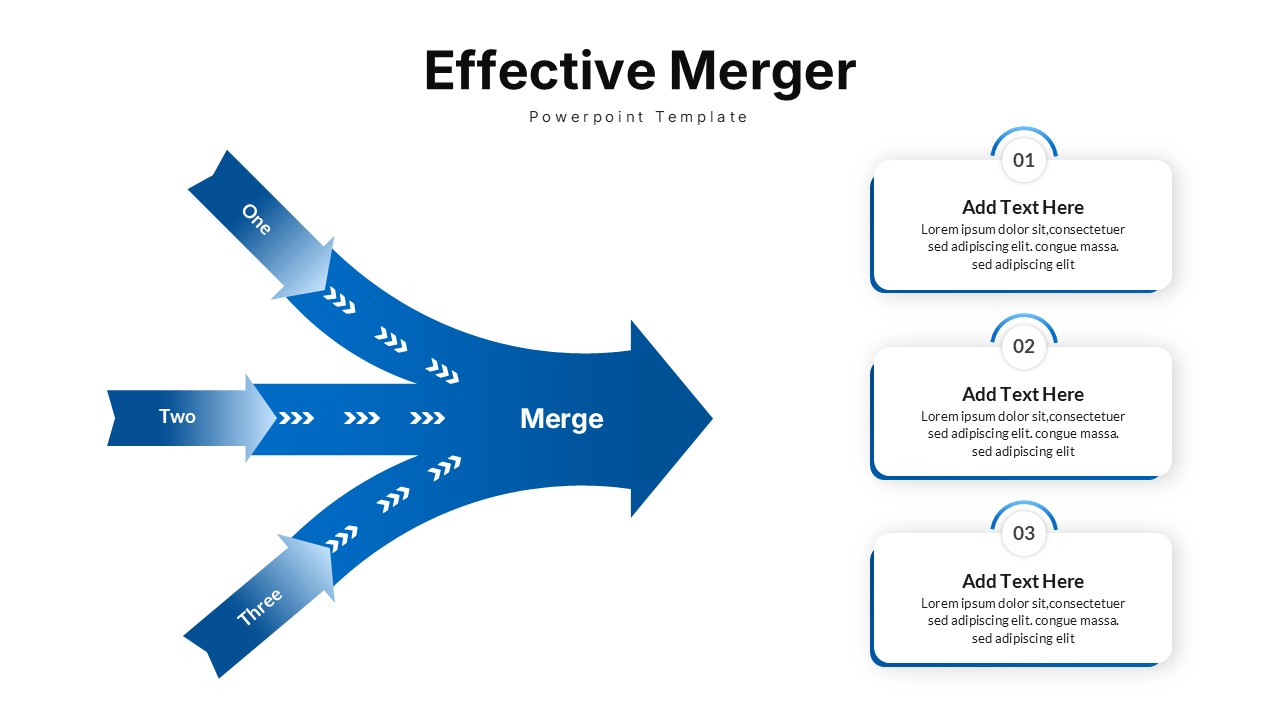
Effective Merger Arrow Diagram Template for PowerPoint & Google Slides
Arrow