


Showing results for ""
Showing 4691-4725 out of 5176
-
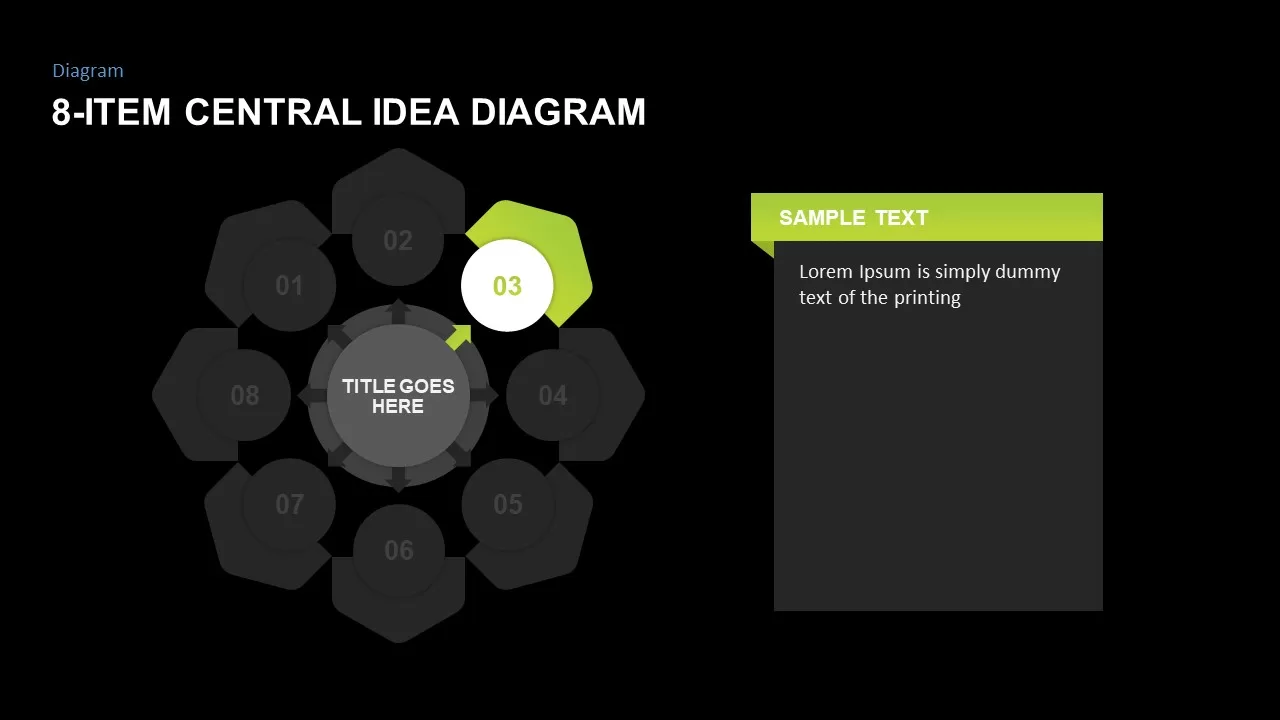
8-Item Central Idea PowerPoint Diagram 18
Circle
-
3d Spheres Fill Level Diagram for PowerPoint 20
Comparison
-
3D Spheres Diagram Design for PowerPoint Presentations sections
Comparison
-
8 Step Circular Gear Diagram PowerPoint Template
Circle
-
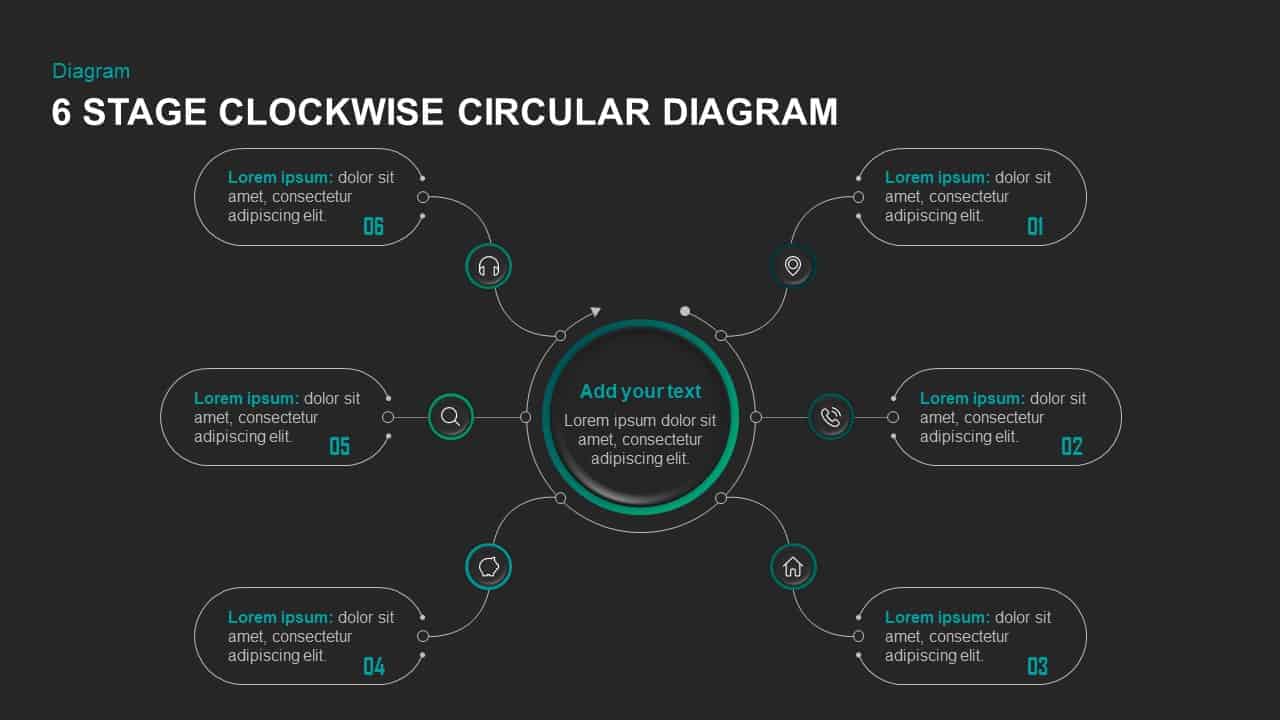
6 Steps Clockwise Circular Diagram Template for PowerPoint
Circle
-
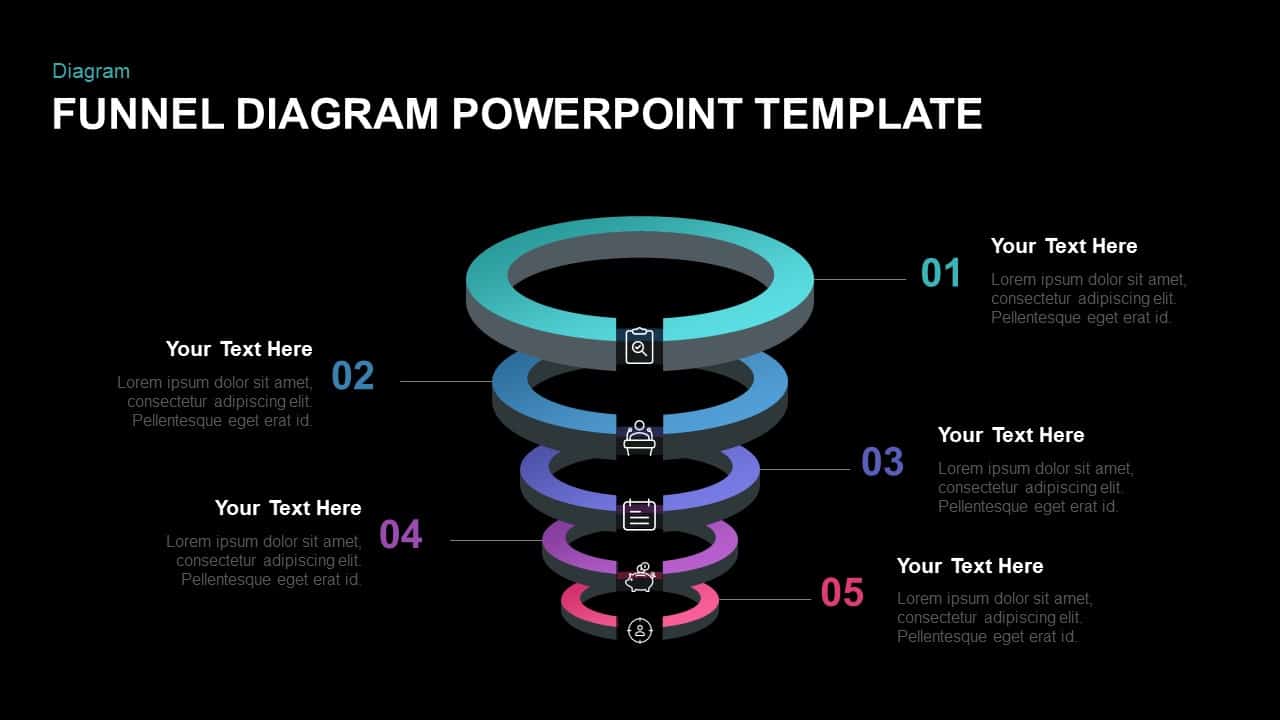
5 Step Ring Diagram Funnel Template for PowerPoint
Funnel
-
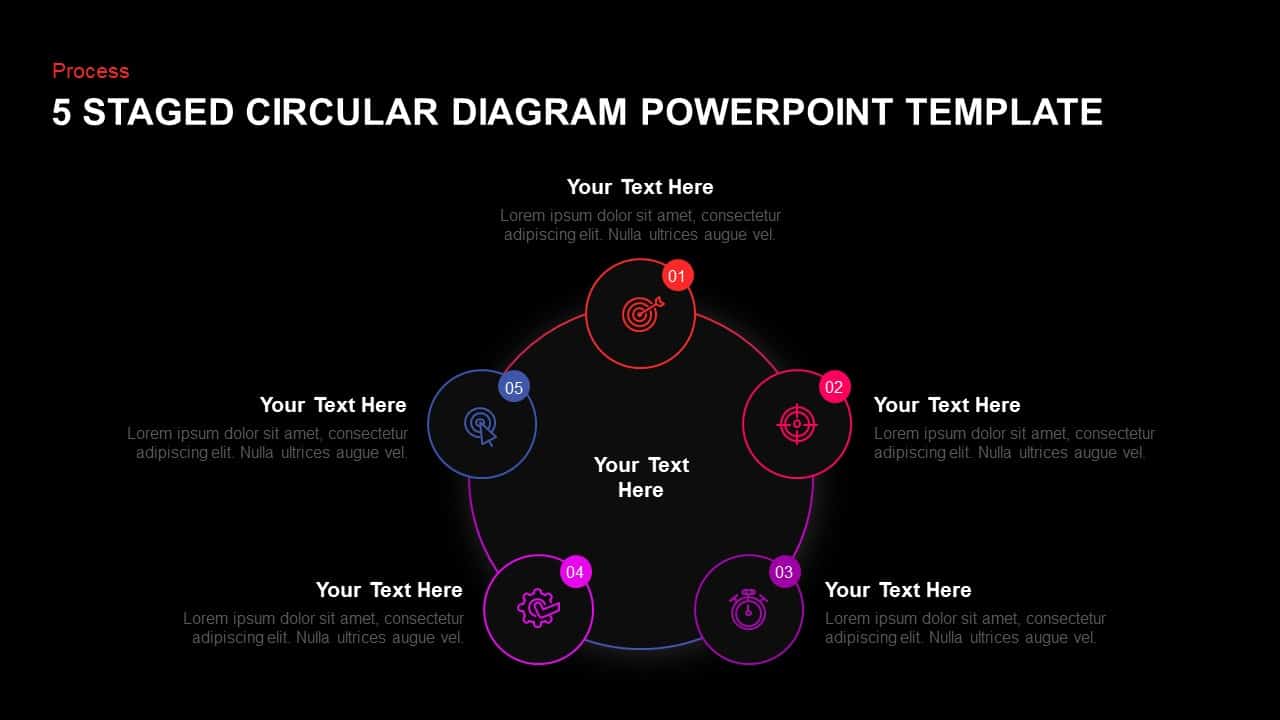
5 step circular diagram design template for PowerPoint
Circle
-
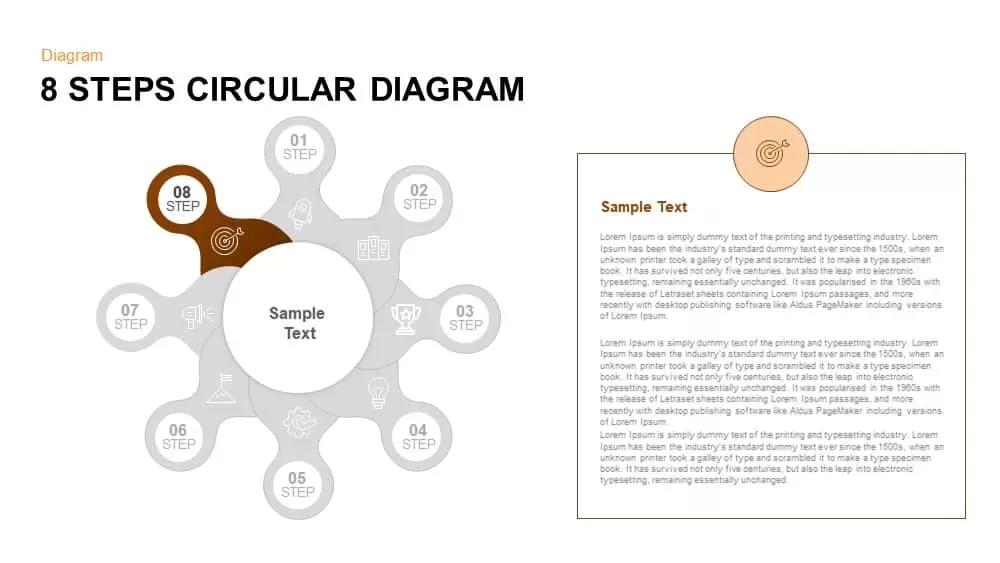
8 Steps Circular Diagram PowerPoint and Keynote template_8.
Circle
-
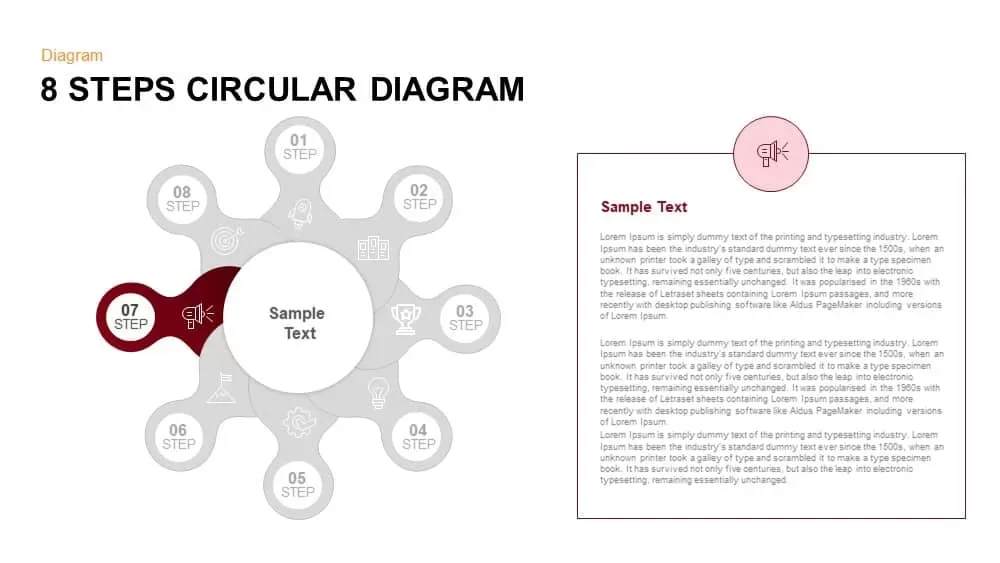
8 Steps Circular Diagram PowerPoint and Keynote template_7.
Circle
-
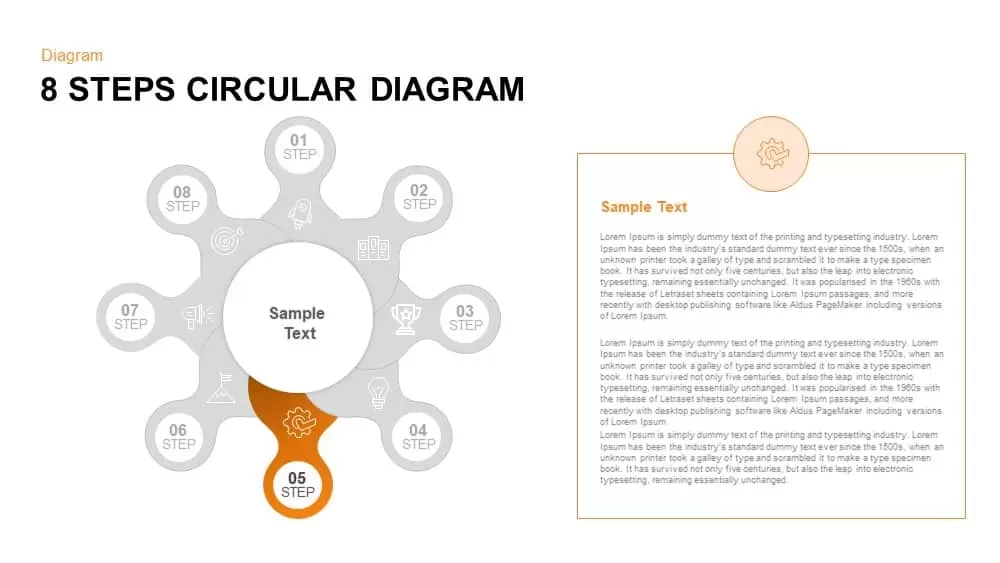
8 Steps Circular Diagram PowerPoint and Keynote template_5.
Circle
-
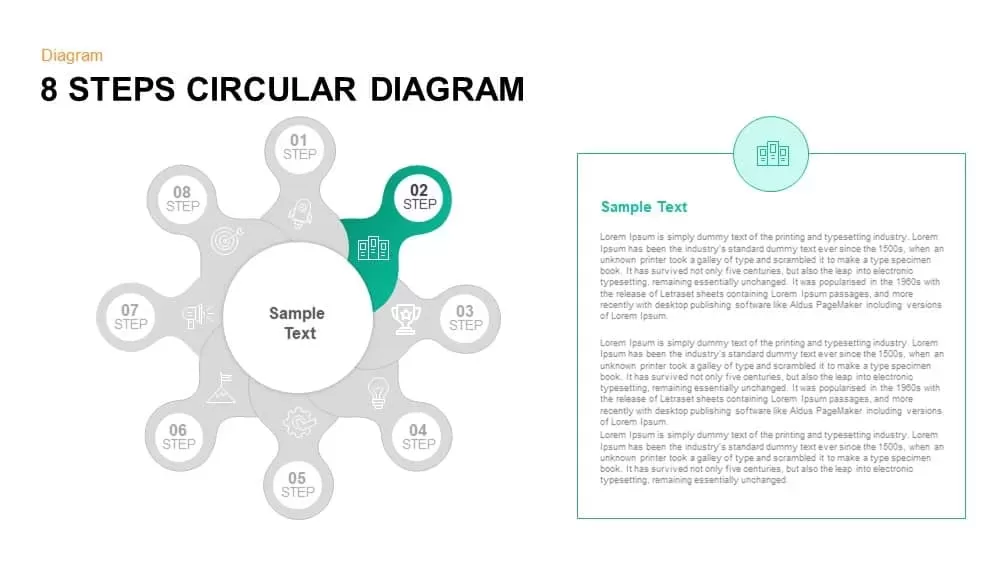
8 Steps Circular Diagram PowerPoint and Keynote template_2.
Circle
-
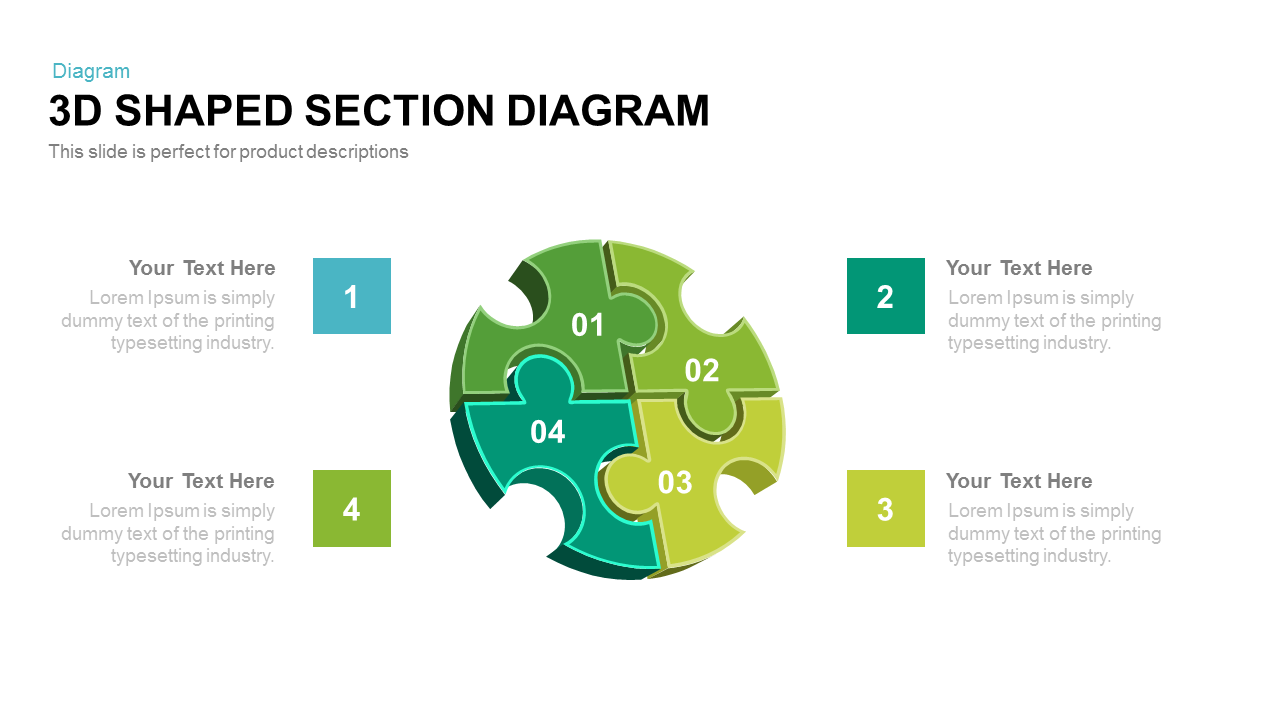
3d Shaped Section Diagram Powerpoint and Keynote template
Infographics
-
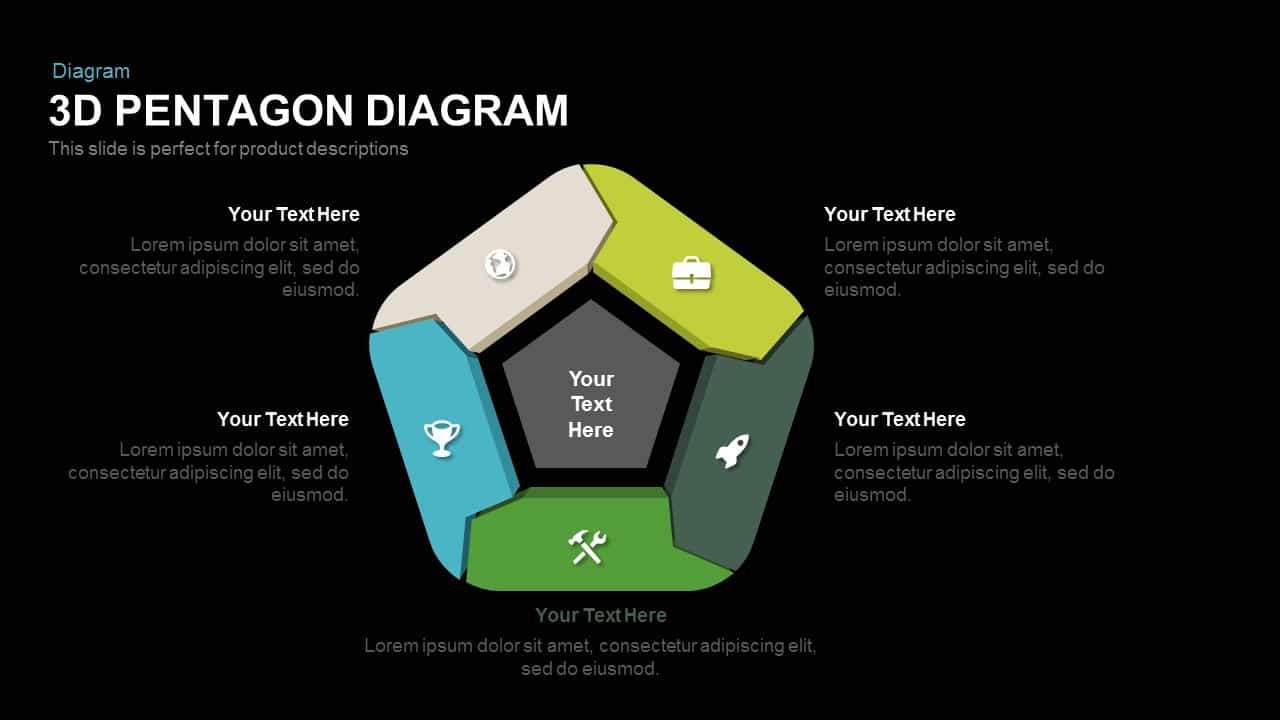
3d Pentagon Diagram Powerpoint and Keynote template 1
Process
-
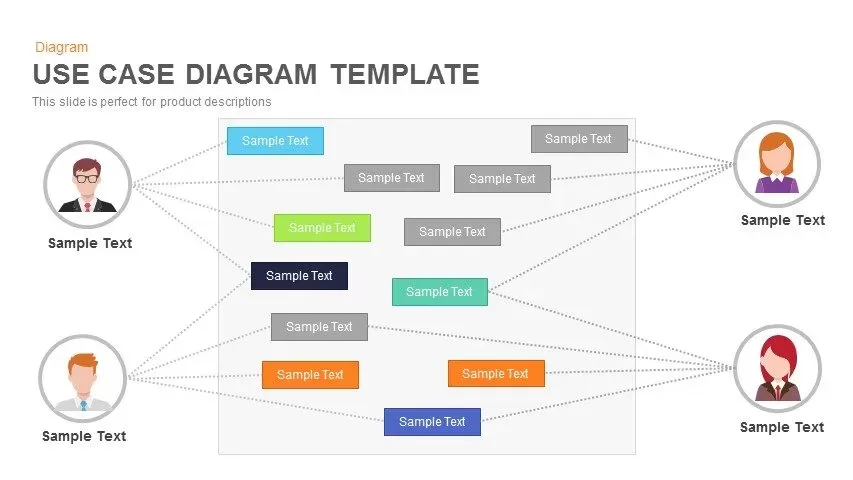
Use Case Diagram Powerpoint and Keynote template 1
Business Requirements
-
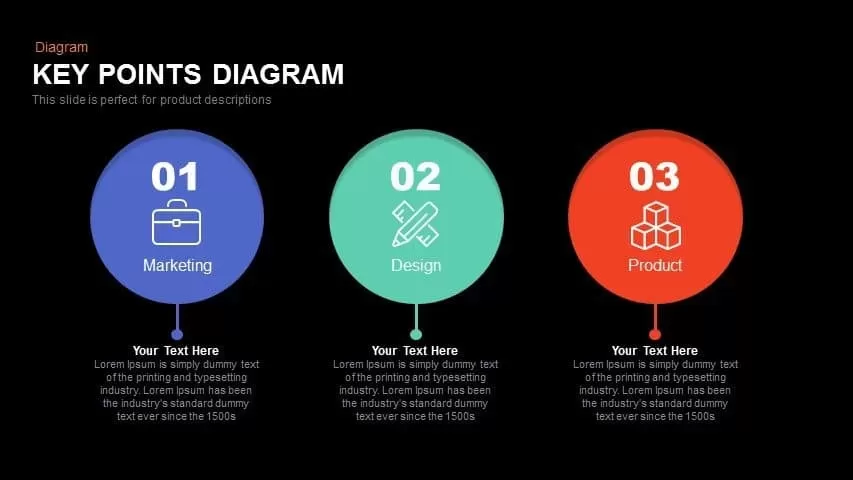
Key Points Diagram Powerpoint and Keynote template 1
Process
-
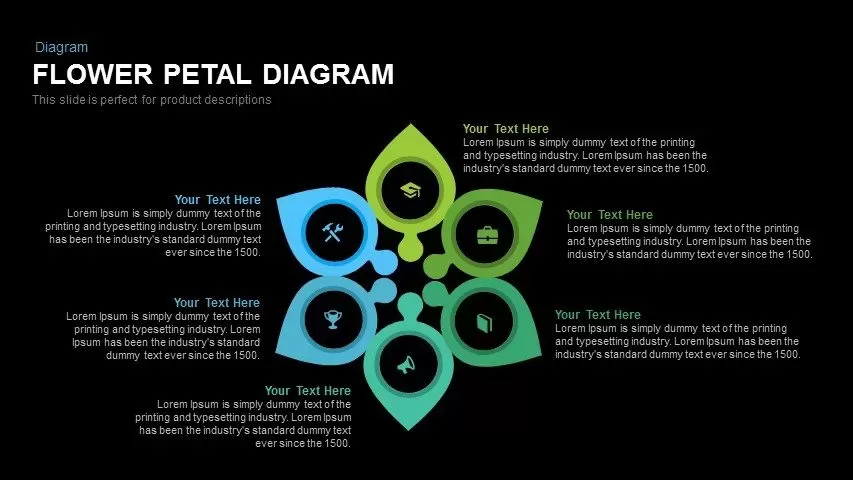
Flower Petal Diagram Powerpoint and Keynote template 1
Circle
-
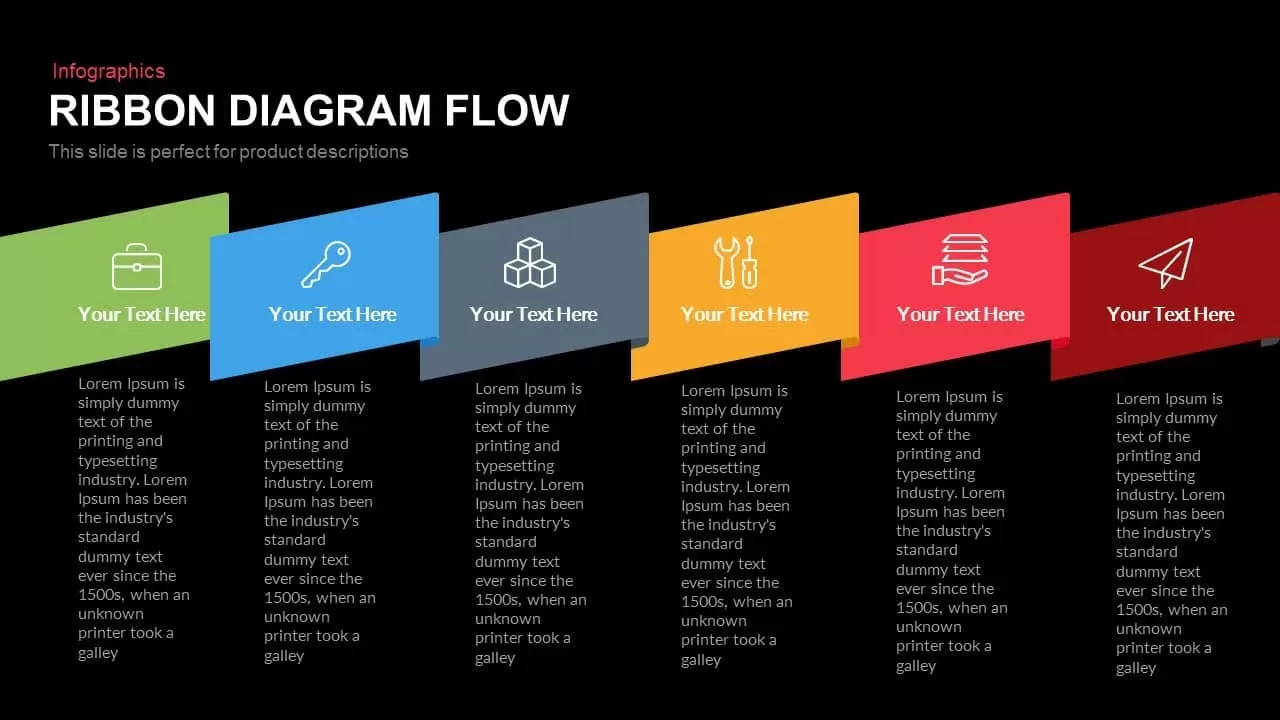
Ribbon Diagram Flow Powerpoint Keynote template 1
Process
-
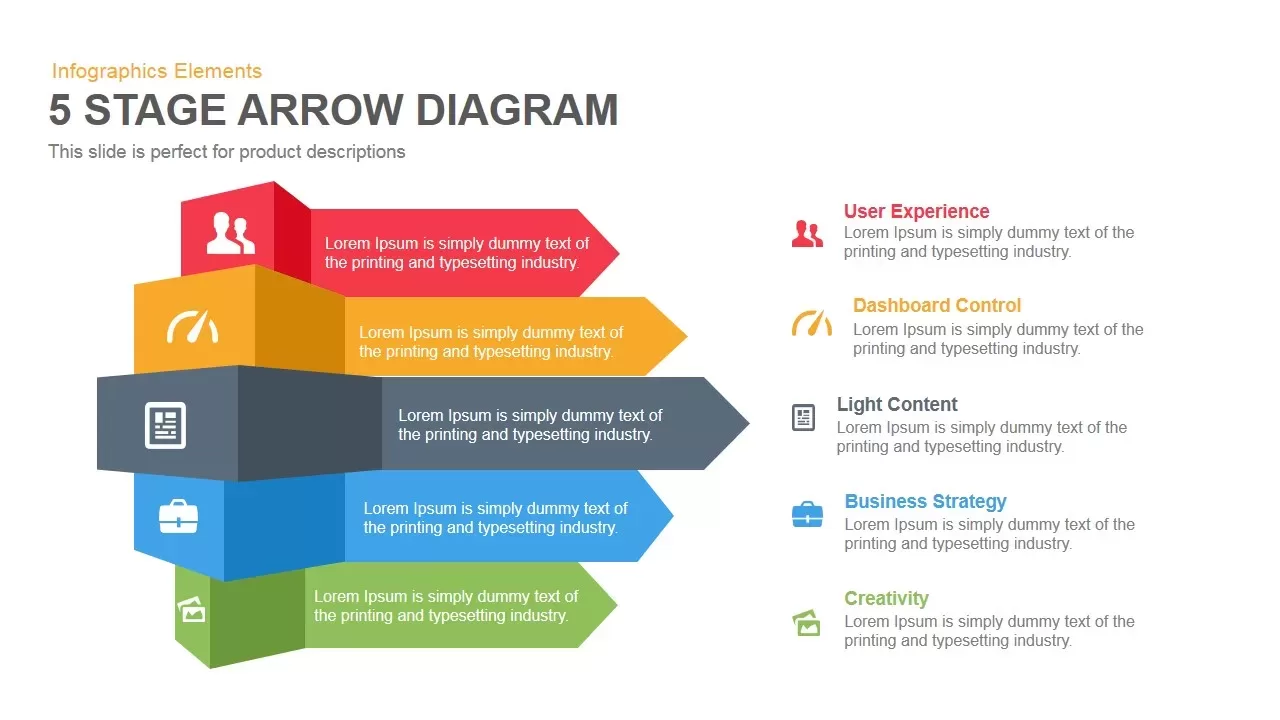
5 Stage Arrow Diagram Powerpoint Keynote template
Arrow
-
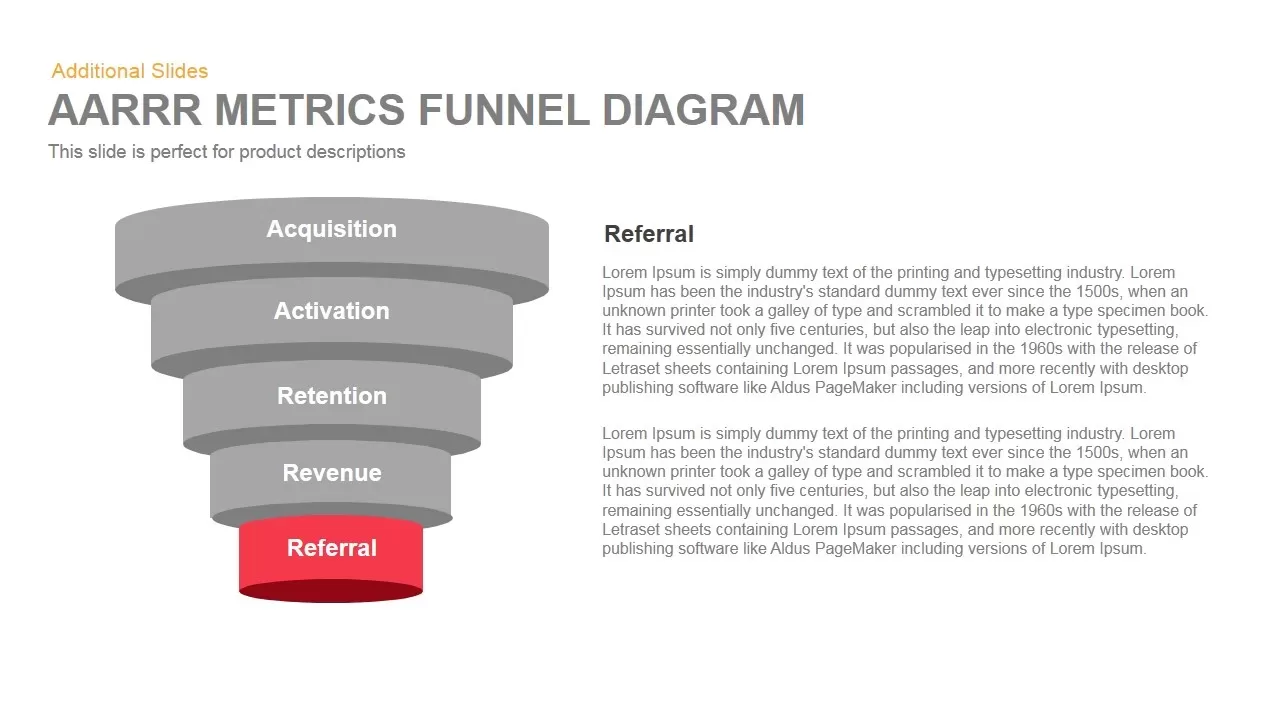
Aarrr Metrics Funnel Diagram Powerpoint Keynote 5
Funnel
-
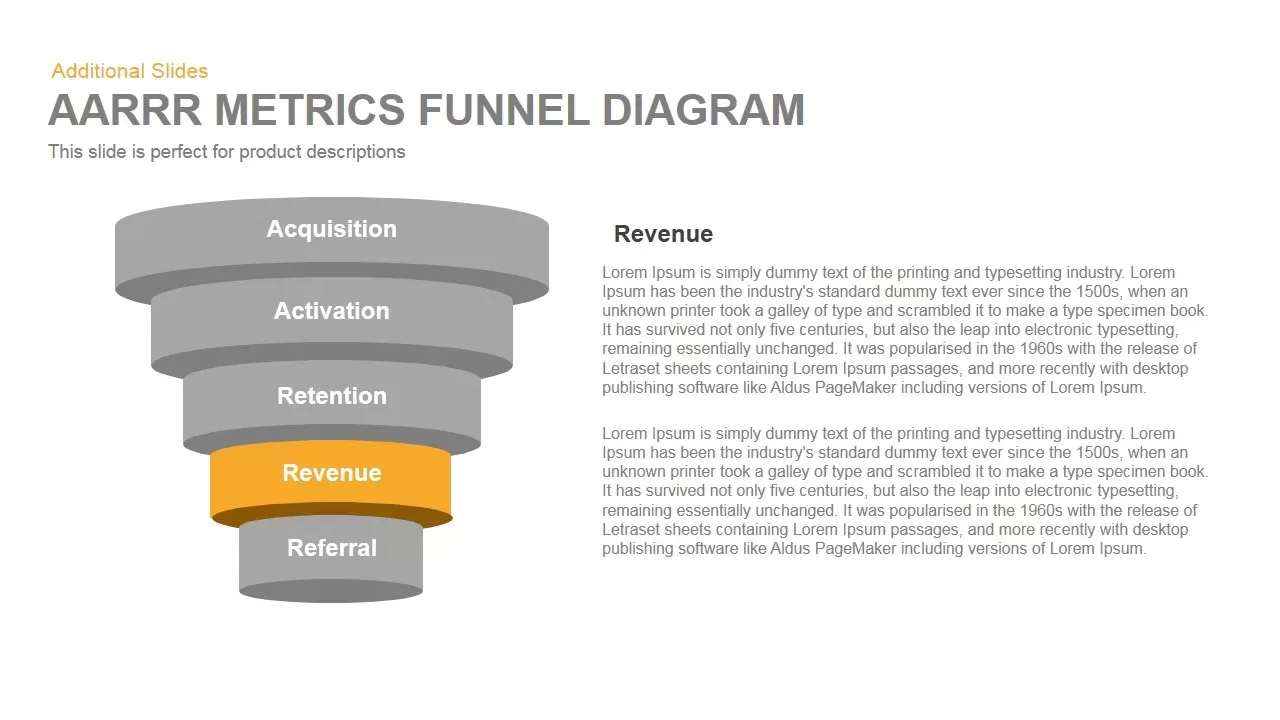
Aarrr Metrics Funnel Diagram Powerpoint Keynote 4
Funnel
-
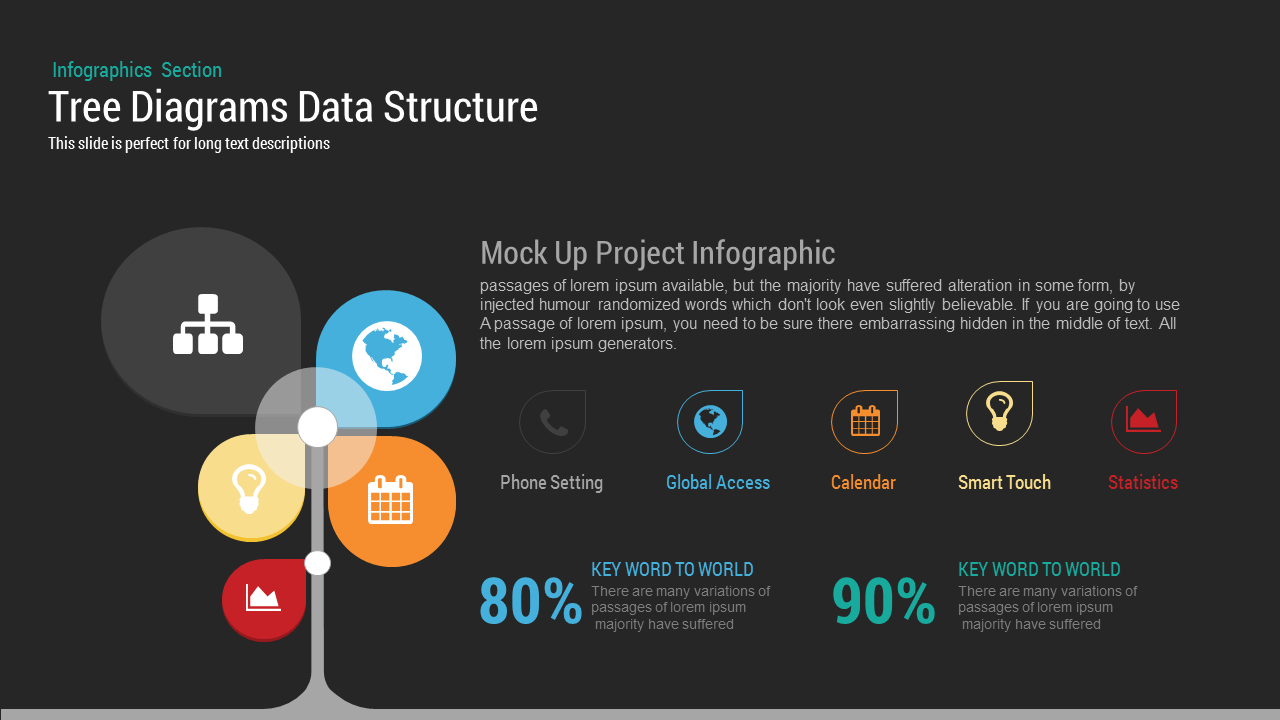
Tree Diagrams Data Structure PowerPoint and Keynote template
Decision Tree
-

Vision & Strategy 3 Diamond Shape Diagrams Slide
Vision and Mission
-
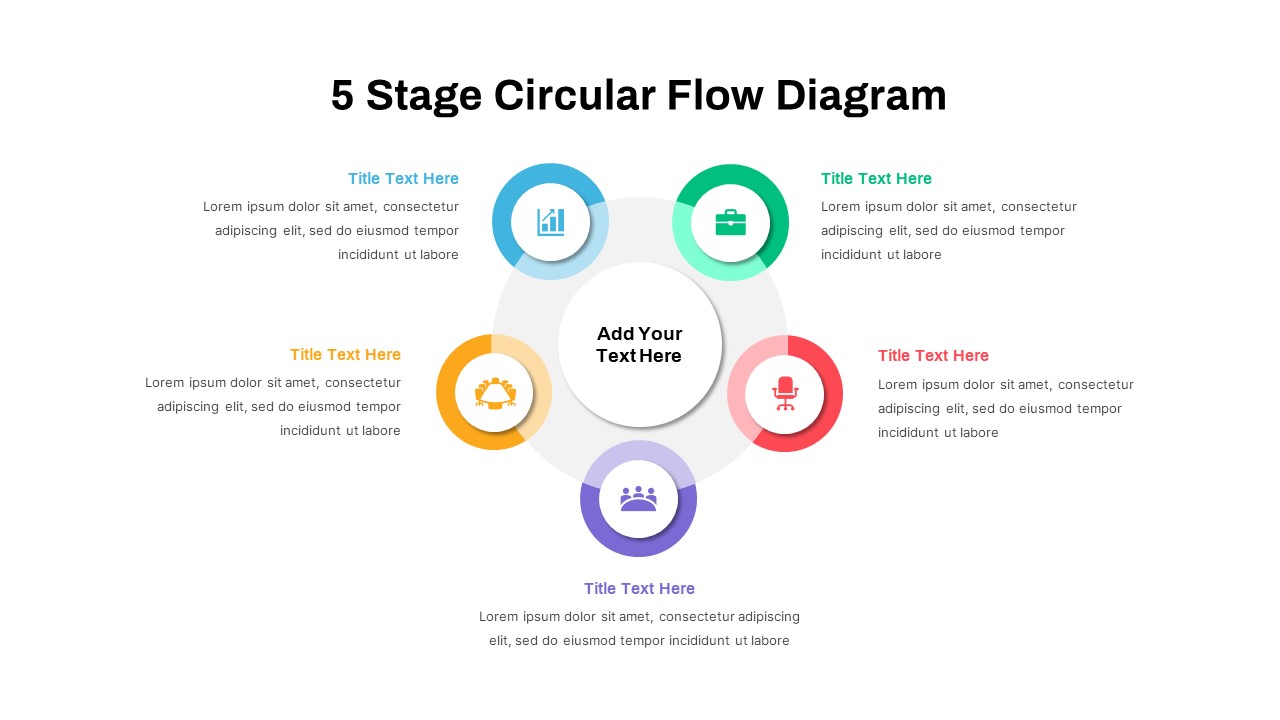
5 Stage Circular Flow Diagram PowerPoint Template
Circle
-
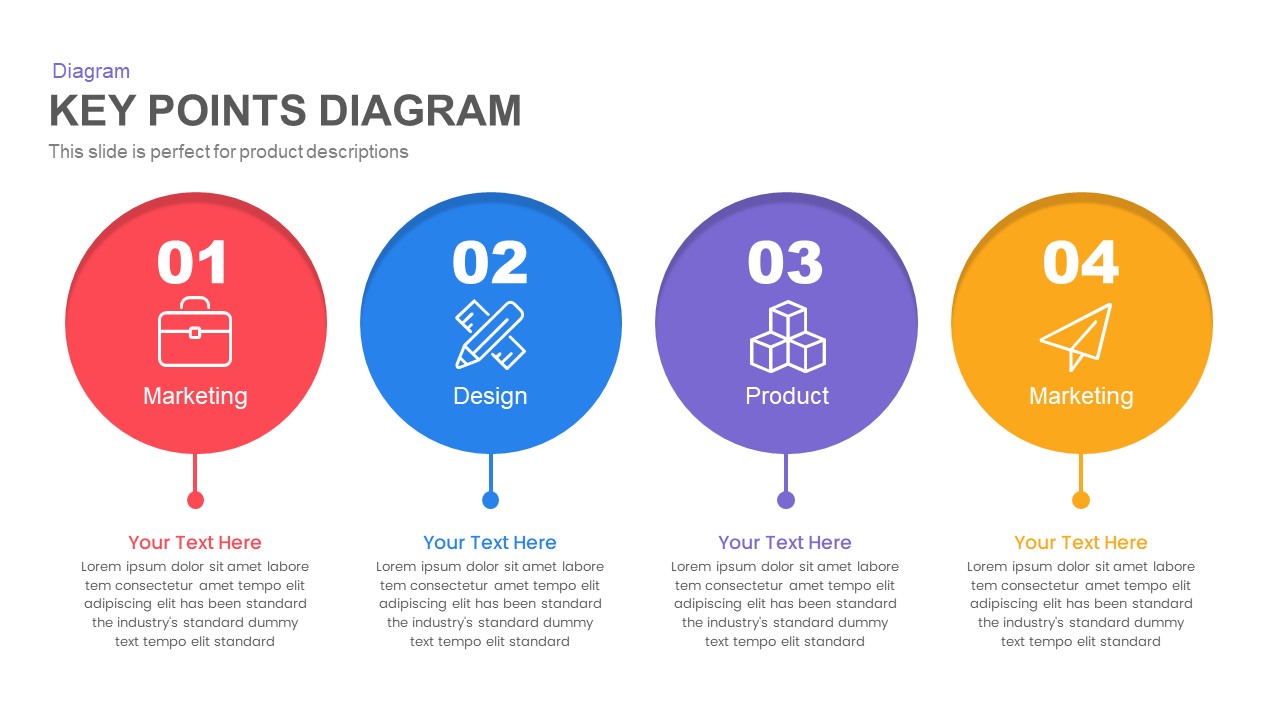
4 steps Key Points PowerPoint Presentation Diagram
Process
-
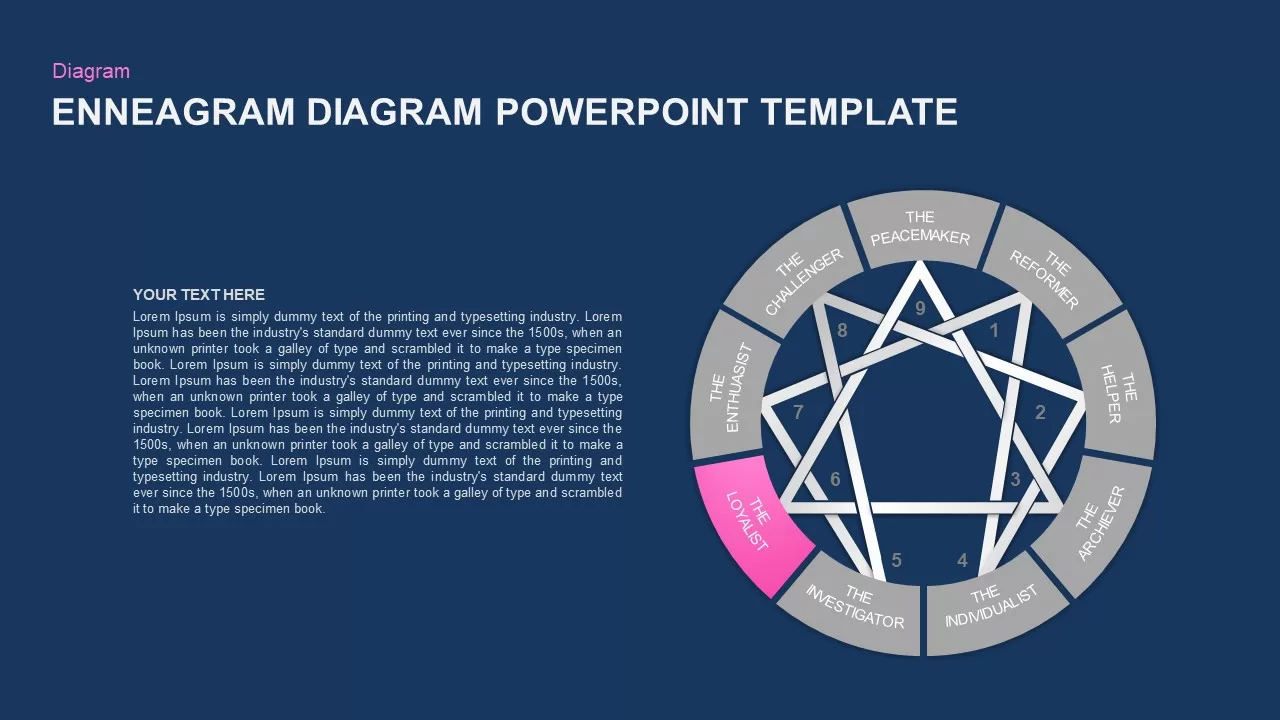
Enneagram Diagram PowerPoint Template loyalist blue slide
Circle
-
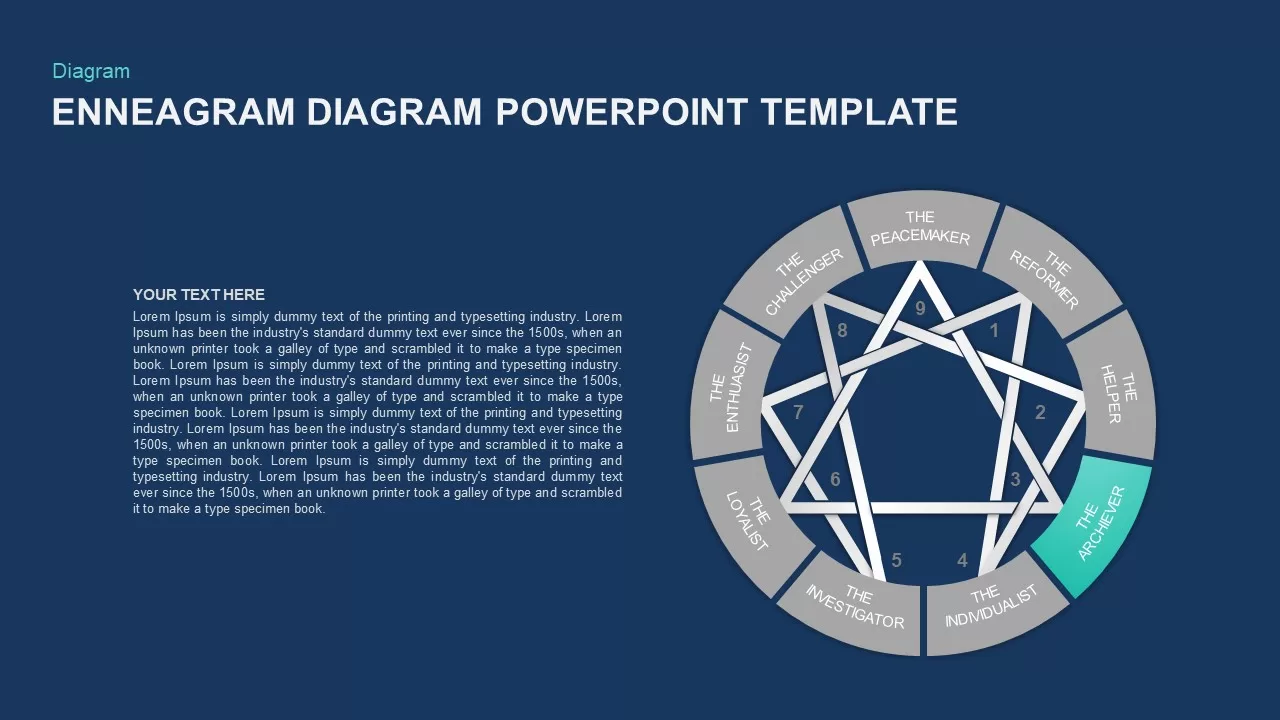
Enneagram Diagram PowerPoint Template archiever blue slide
Circle
-
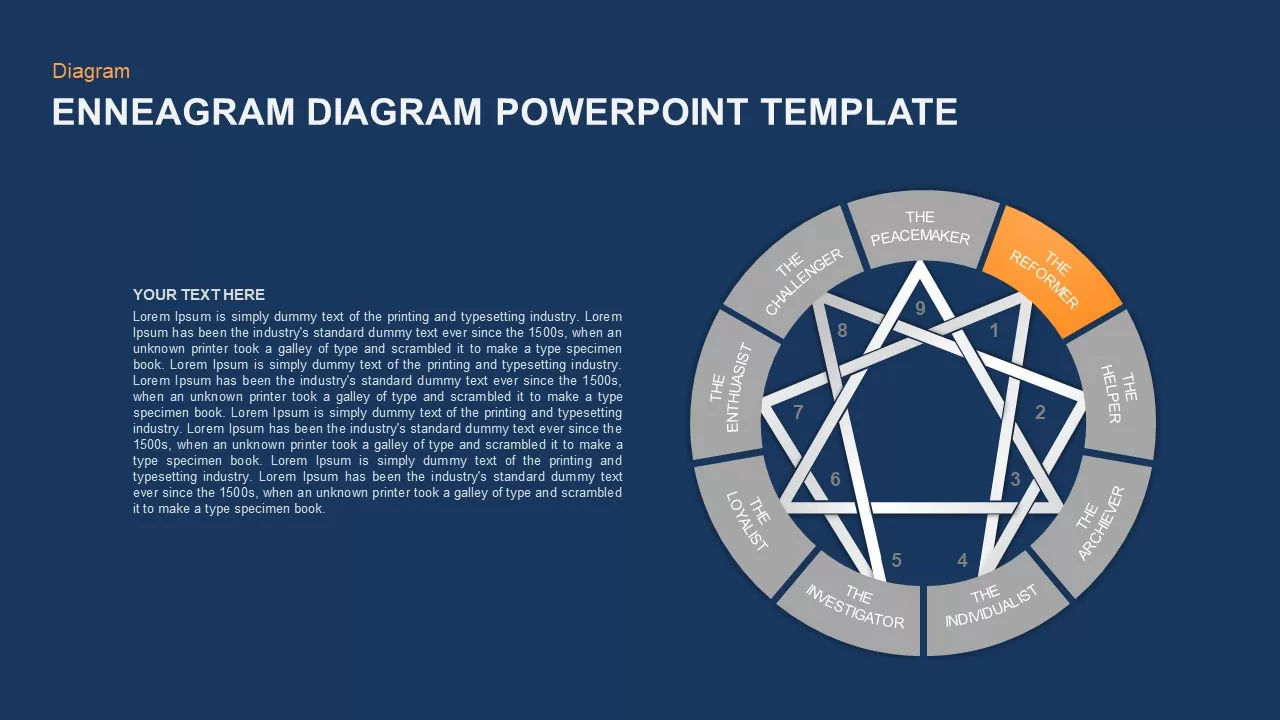
Enneagram Diagram PowerPoint Template reporter blue slide
Circle
-
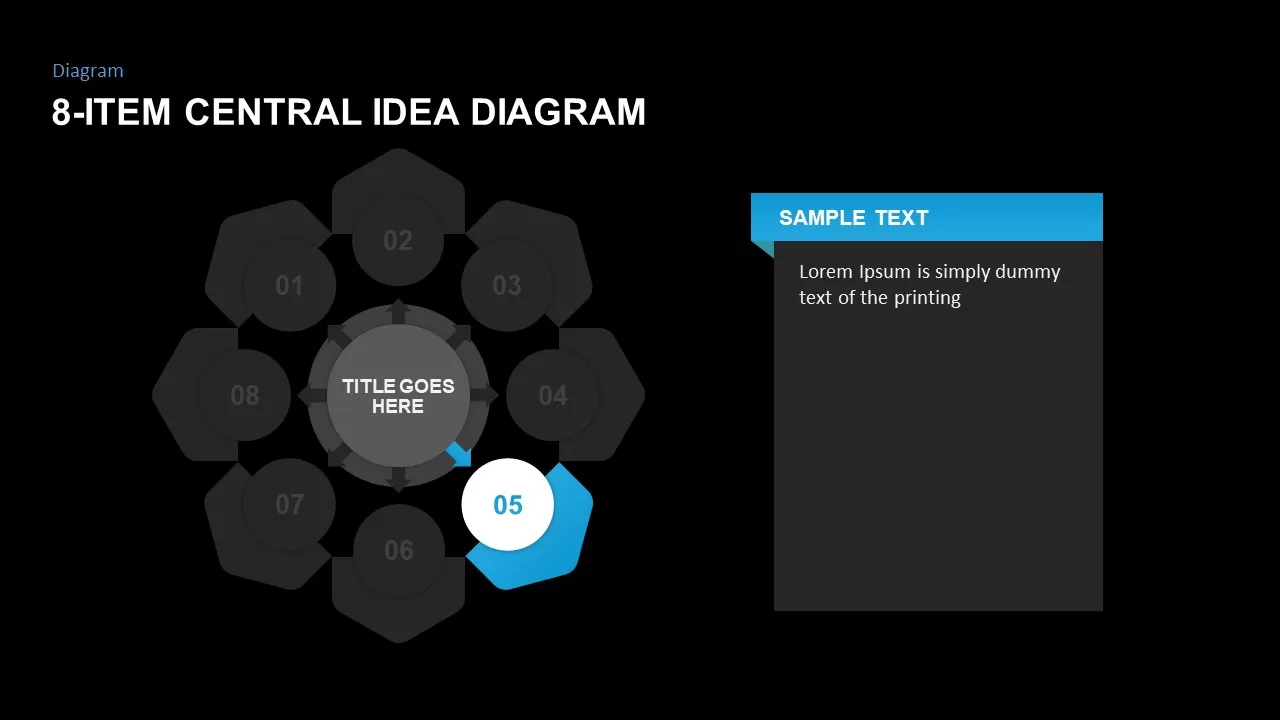
8-Item Central Idea PowerPoint Diagram 16
Circle
-
8-Item Central Idea PowerPoint Diagram 14
Circle
-
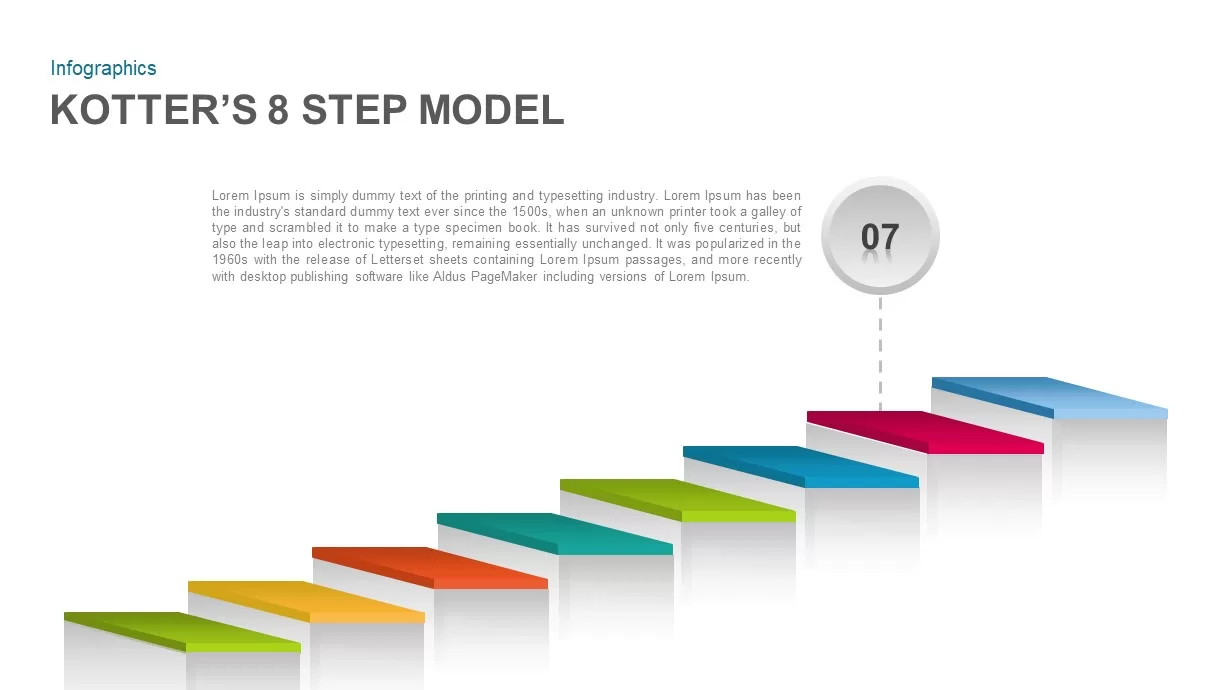
Kotter’s 8 Step Model Template Diagram 8
Process
-
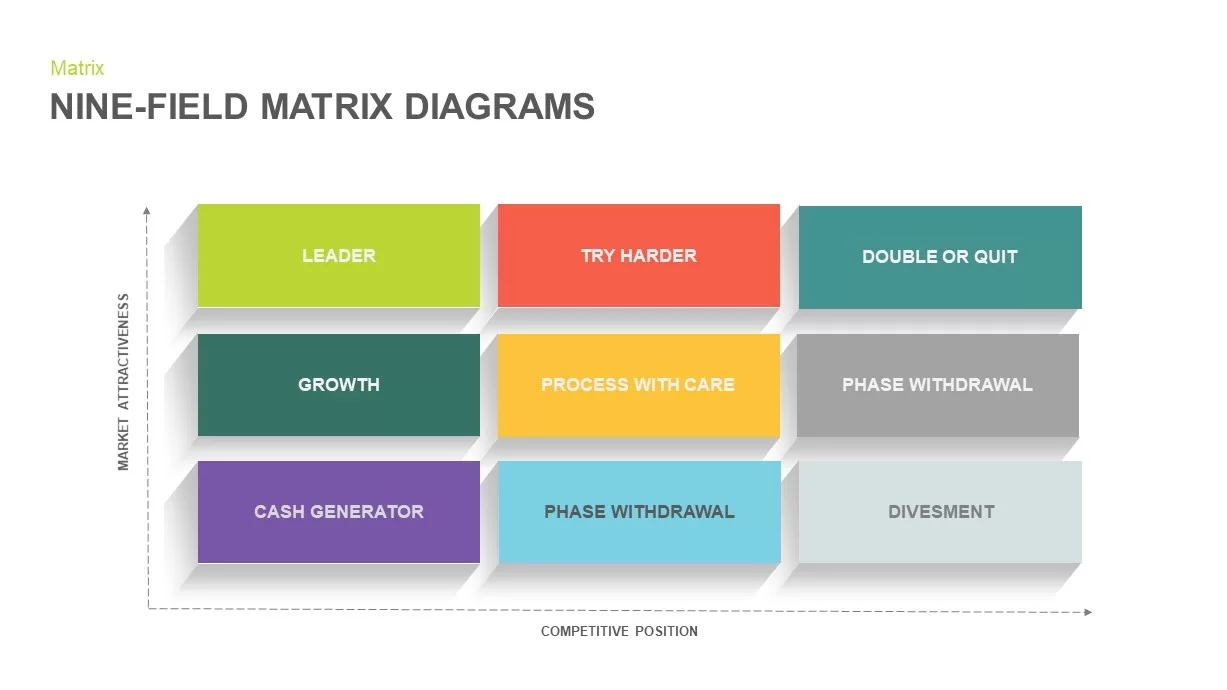
Nine Field Matrix Diagrams PowerPoint Template section
Comparison Chart
-
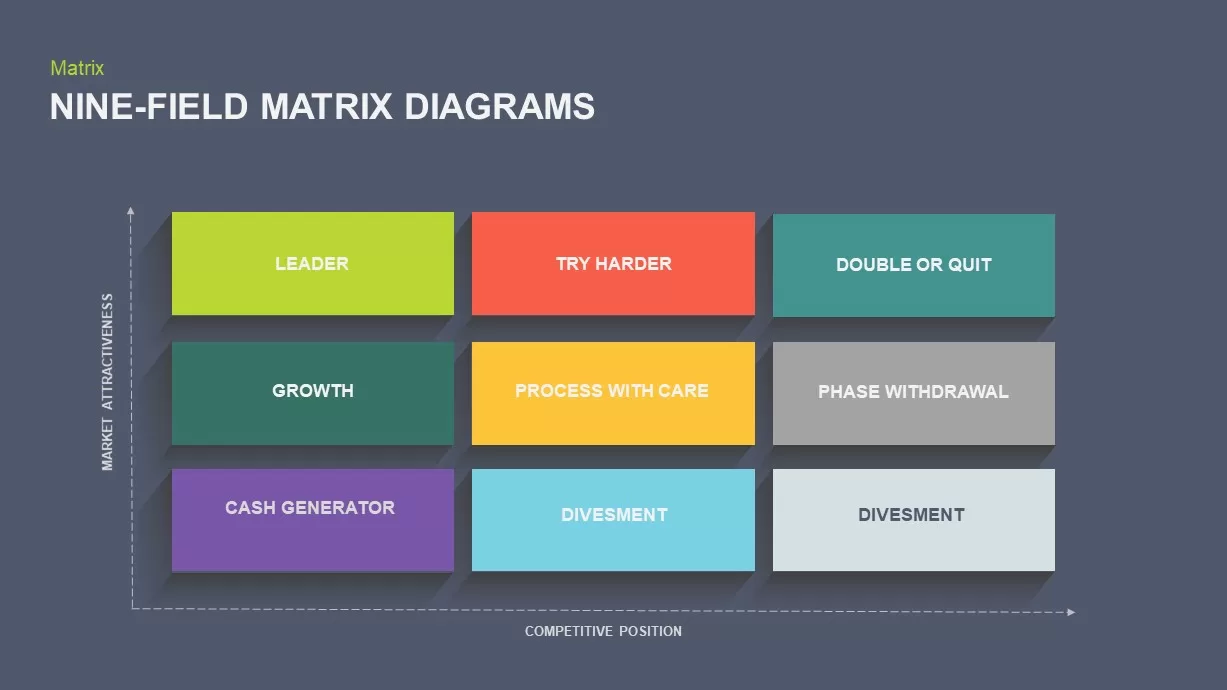
Nine Field Matrix PowerPoint Presentation Diagram 20
Comparison Chart
-
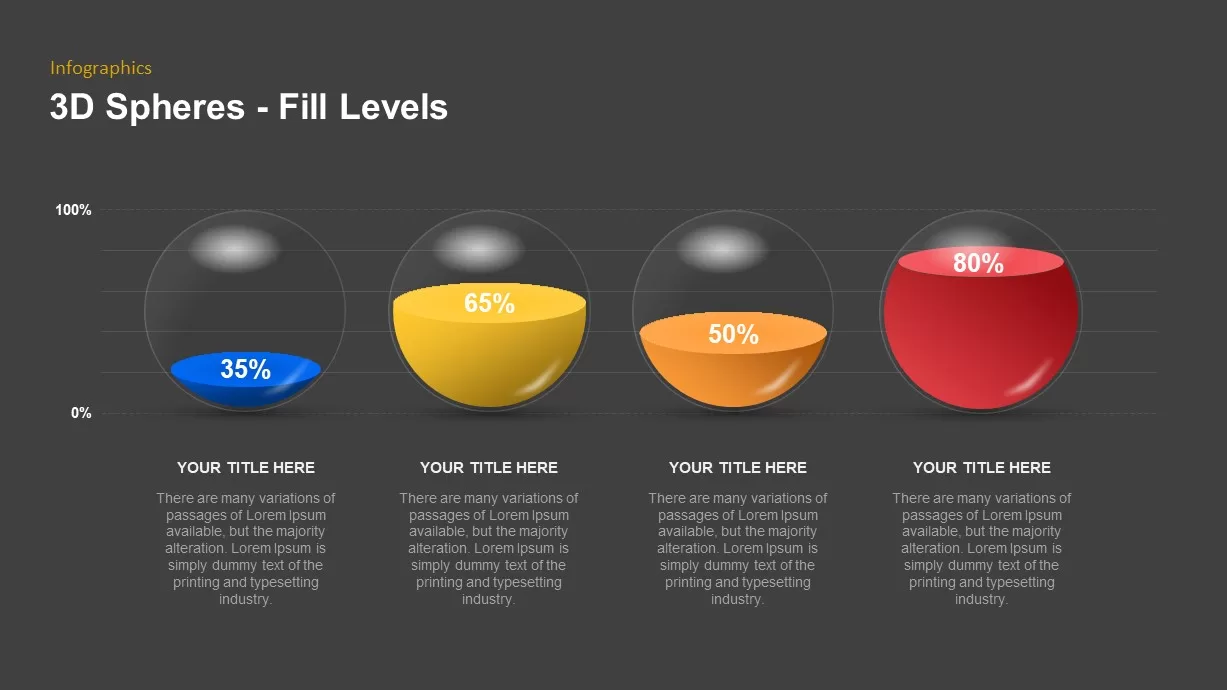
3d Spheres Fill Level Infographic Diagram 12
Comparison
-
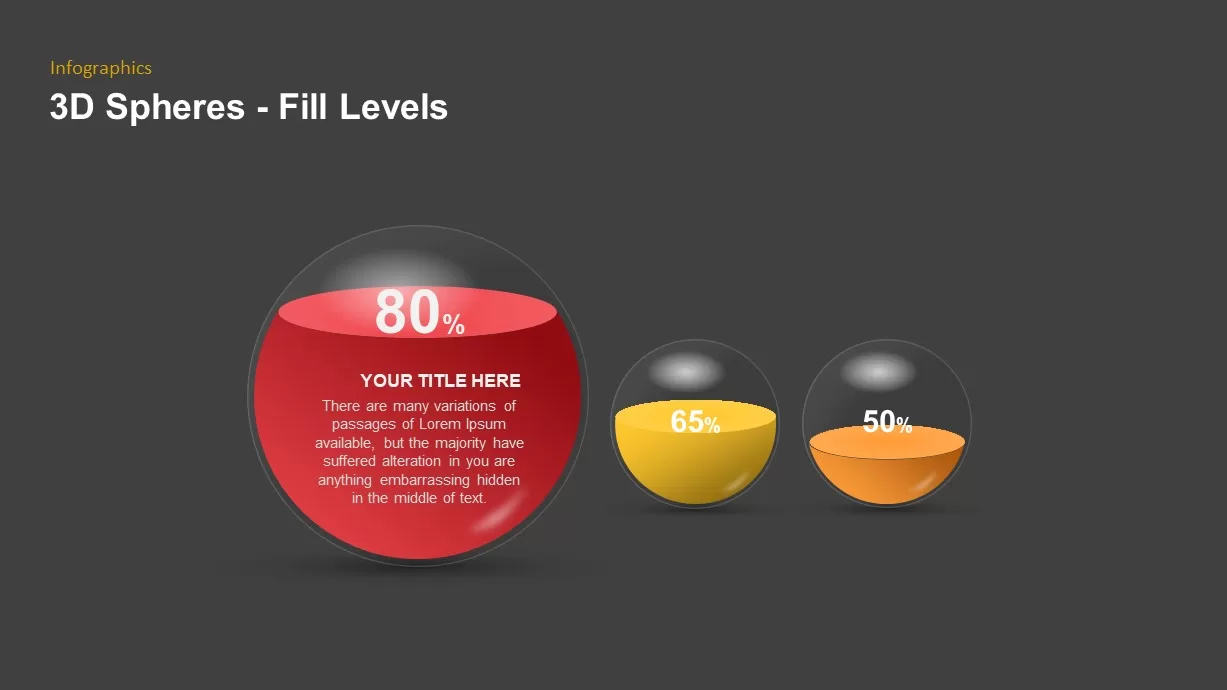
3d Spheres Fill Level Diagram for PowerPoint 19
Comparison
-
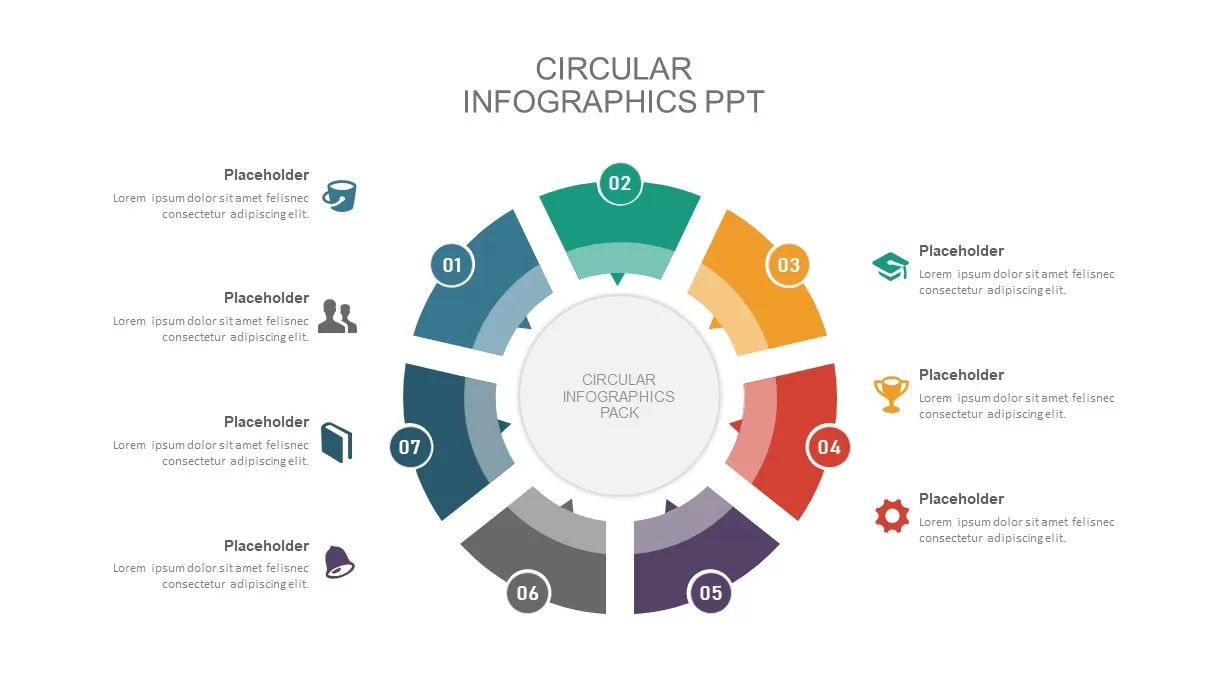
2 – 8 Step Circular Diagram PPT Template
Infographics