Greiner’s Growth Model Curve template for PowerPoint & Google Slides
Description
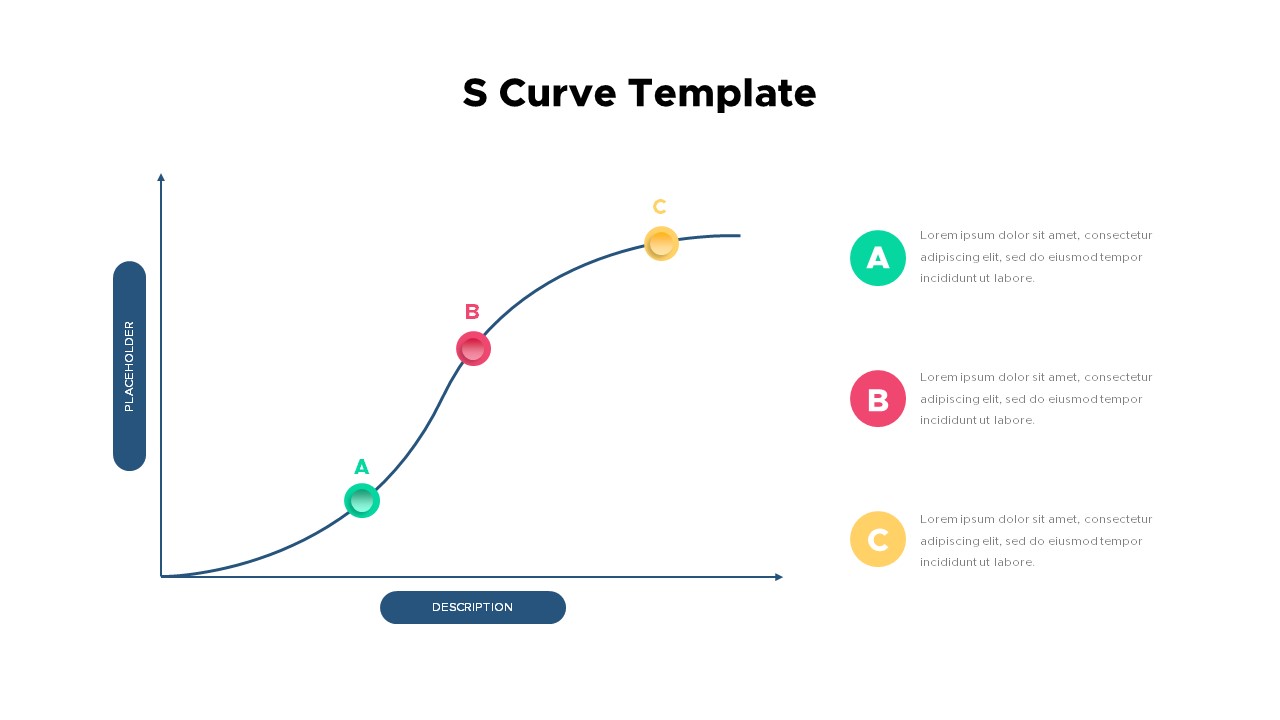
This infographic slide pack illustrates Greiner’s Growth Model Curve, a widely recognized framework for understanding the growth and development of organizations over time. The curve visually represents six distinct phases, starting from the creative phase through to the alliance stage, with accompanying “Crisis of Leadership” points at various stages. The use of vibrant color coding for each phase ensures clarity and aids in communicating the evolution of an organization as it scales and navigates different leadership challenges.
Ideal for corporate strategy presentations, business growth discussions, or leadership development workshops, this slide pack allows for easy customization. Each phase is clearly labeled with its respective phase number, helping to emphasize the crucial stages organizations go through as they mature. The clean and modern design provides a professional look while making the model easy to understand, no matter the audience.
With editable placeholders for text and data, the slides are designed for quick customization to suit different industries and organizational contexts. The dynamic color gradient enhances the visual appeal, while the structured layout ensures that the progression of the model is easy to follow.
Who is it for
Business strategists, organizational development professionals, executives, and consultants will find this slide pack essential for visualizing the growth process of a company. It is especially valuable for those involved in leadership training, corporate planning, or change management.
Other Uses
Beyond business presentations, this model can be applied to educational contexts, workshops, or conferences on business growth, leadership theory, or organizational behavior. The slides can also be adapted for use in consulting reports or as part of training programs designed to help leaders understand the challenges that come with organizational scaling.
Login to download this file


