How to Easily Create an Organizational Chart in PowerPoint

To showcase a company’s structure and hierarchy, you can use organizational charts (or “org charts”). More than just adding a visual element to your presentation, making an org chart is about providing clear and easy-to-understand information. These charts display the relationships between different roles, departments, and people, showing who reports to whom and the levels of authority in the organization.
After completing this guide, you will be able to create an org chart in Microsoft PowerPoint. Let us get down to business.
Initiating Your Org Chart Creation in PowerPoint
Step 1: Setting Up PowerPoint
To start, launch PowerPoint and open a new blank presentation. Head to the ‘Design’ tab to select a theme that aligns with your company’s branding. Then, go to the ‘Home’ tab and click ‘New Slide’.
Adding Your Org Chart
Step 2: Accessing and Selecting SmartArt Graphics
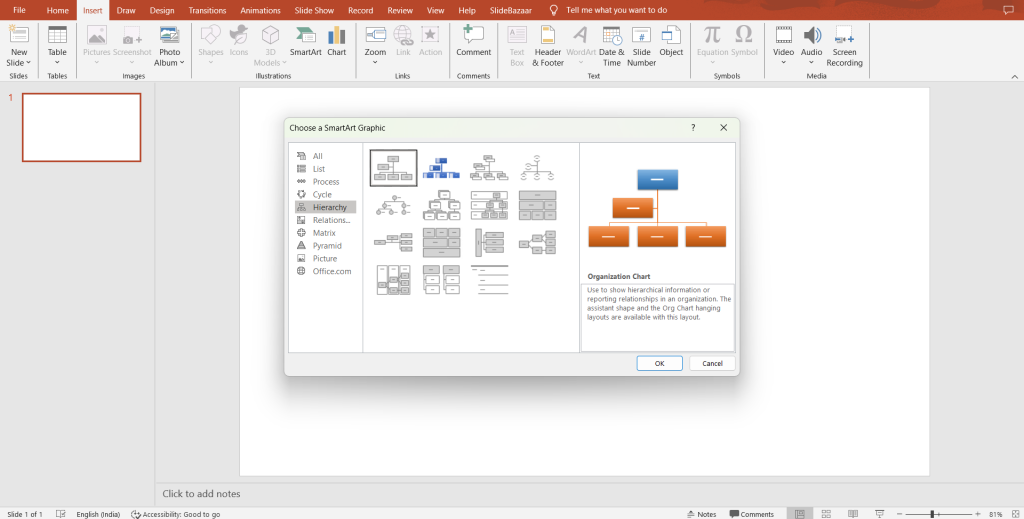
First, click on the ‘Insert’ tab. From the Illustrations group, select ‘SmartArt’. In the SmartArt Gallery, click on the ‘Hierarchy’ category to view and choose from different types of org charts.
Step 3: Selecting Your Org Chart Design
Select a style that best fits your needs. For a traditional org chart, choose ‘Organization Chart’ and click ‘OK’.
Structuring Your Org Chart
Step 4: Adding the Top-Level Position
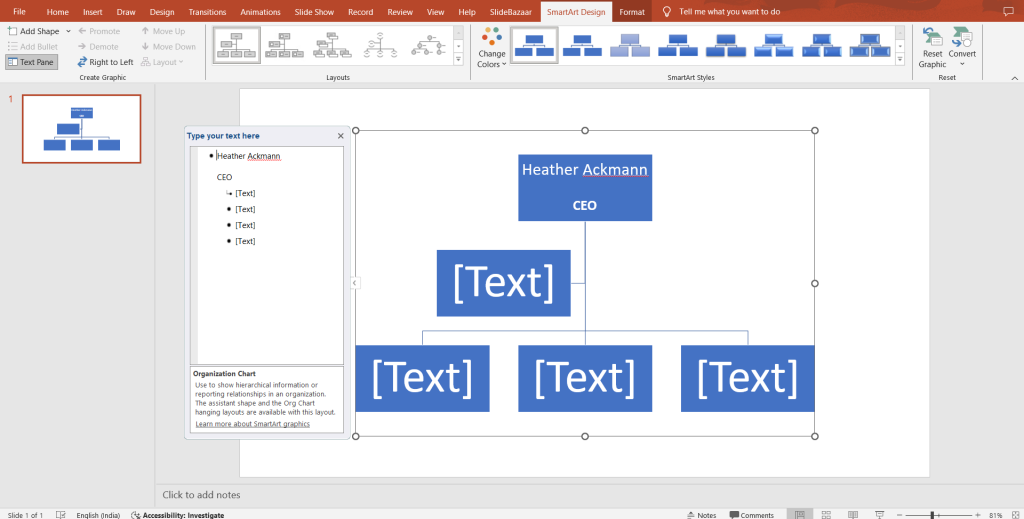
Click on the top box. Type the name and title of the highest-ranking person or the starting point of your org chart.
Step 5: Inserting Subordinate Shapes
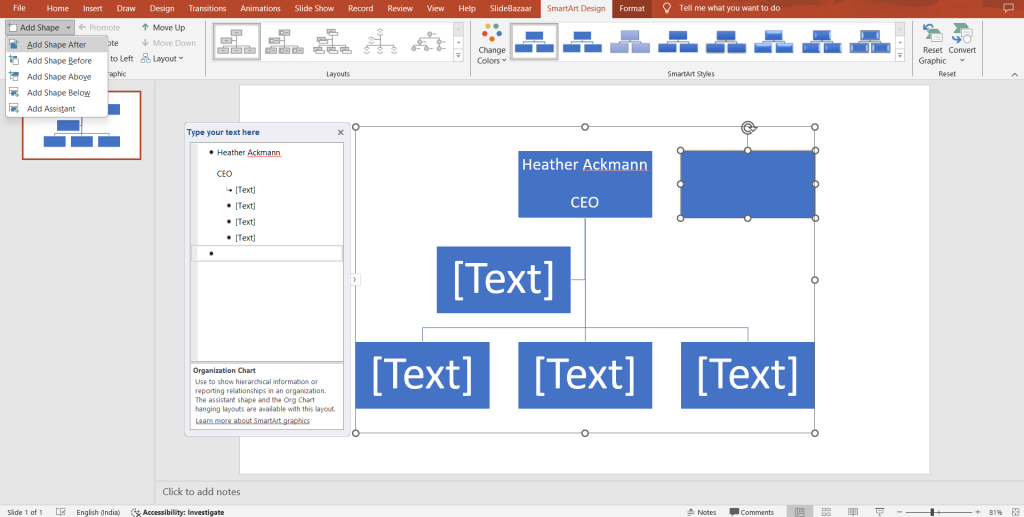
To add subordinates, click on the box below the top position. For multiple subordinates, select the box and use the ‘Add Shape’ button under the SmartArt Tools Design tab.
Step 6: Adding Assistant Positions
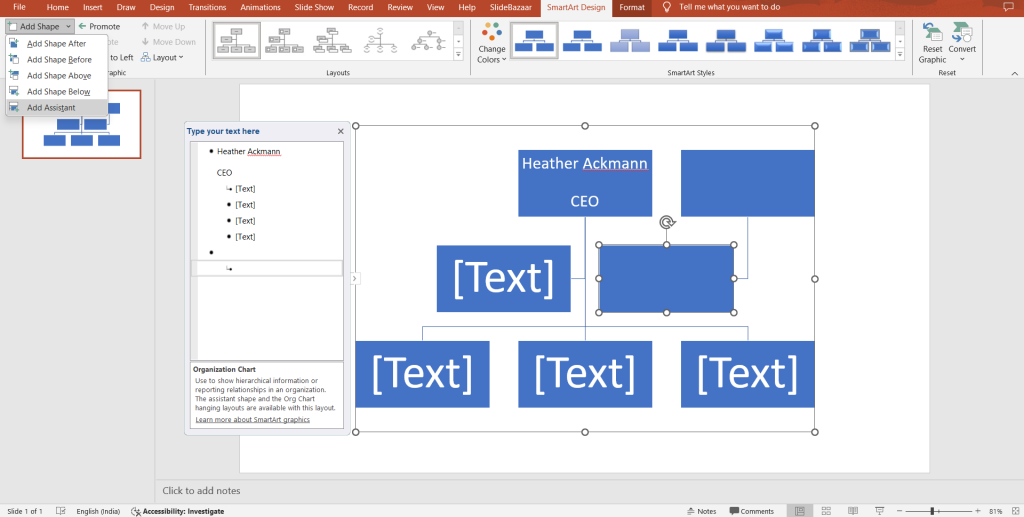
To add assistants, right-click on a box and choose ‘Add Shape’. Then select ‘Add Assistant’ to insert an assistant box.
Step 7: Using the Text Pane
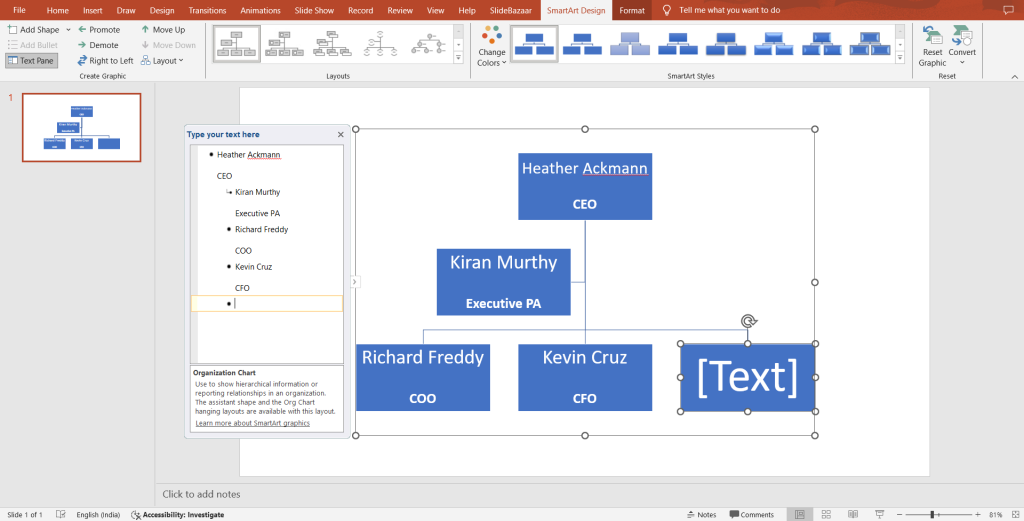
For bulk editing, use the text pane by clicking on the control to the left of the SmartArt. Here, you can type out the hierarchy in a list format, and PowerPoint will automatically format it into the org chart.
Personalizing Your Org Chart Design
Step 8: Exploring Color Schemes
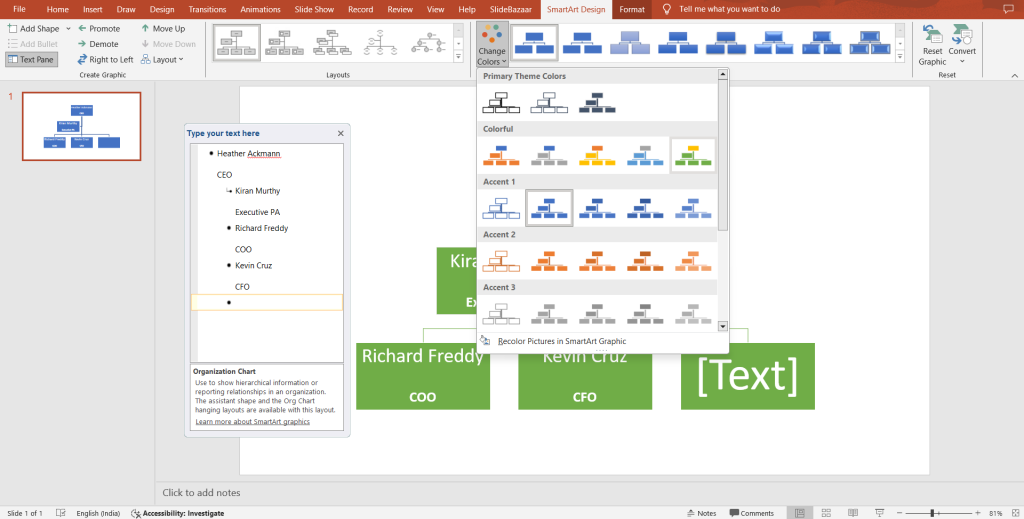
After selecting your SmartArt graphic, navigate to the SmartArt Tools Design tab. Here, find the ‘Change Colors’ button to explore color options that align with your company branding.
Step 9: Applying Smart Styles
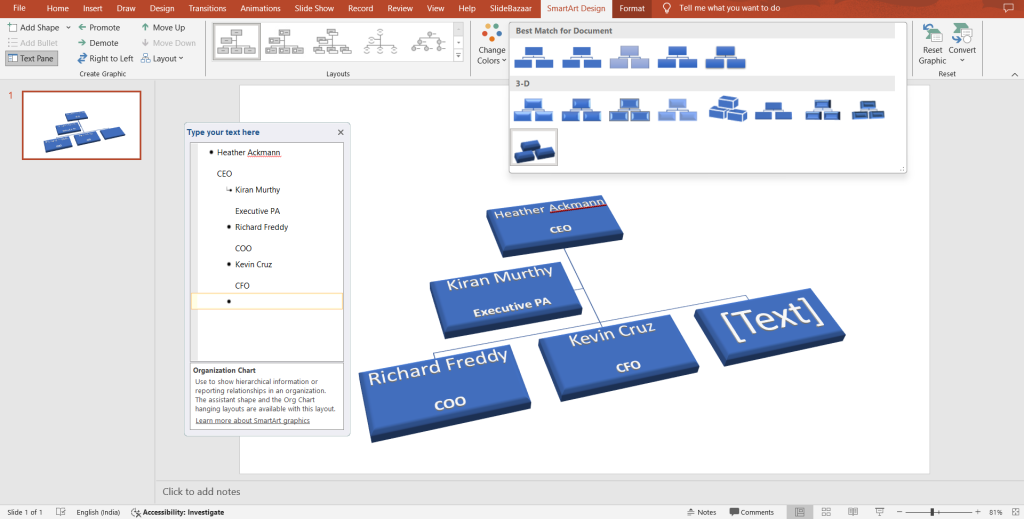
Utilize the ‘Smart Styles’ dropdown in the SmartArt Tools Format tab to apply effects such as glow, soft edges, or 3D effects to enhance the appearance of your org chart.
Step 10: Customizing Box Fill and Outline
For specific adjustments, right-click on a box, choose ‘Format Shape’, and modify the fill color, line color, and line weight.
Step 11: Grouping and Ungrouping Shapes for Consistent Styling
For consistent styling of multiple boxes, select them by holding down the ‘Ctrl’ key, or simply click and drag to select all. Right-click and choose ‘Group’ to combine them. To ungroup, right-click and select ‘Ungroup’ for individual editing.
Final Step: Review Your Org Chart
After customizing and structuring your org chart, take a moment to review it for accuracy. Ensure all positions, names, and connections correctly reflect your organization’s hierarchy. Adjust the layout, formatting, or content as needed to enhance clarity and visual appeal. This review ensures your org chart is ready to effectively support communication and decision-making within your company.
Conclusion:
Creating an organizational chart in PowerPoint isn’t just about visual representation; it’s a strategic tool for enhancing communication and understanding within your organization. By following these straightforward steps, you can craft a professional and informative org chart that reflects your company’s structure and hierarchy effectively. Remember, your org chart reflects your company’s culture and operations. Take the time to tailor it thoughtfully, and it will serve as a cornerstone for clarity and efficiency within your organization.


