
Getting started with Flowcharts in PowerPoint


Flowcharts are a great way to visualize processes, decision points, and workflows. In this article, we’ll take a look at how you can get started with and create flowcharts in PowerPoint. Here’s everything you need to know:

How to Create a Flowchart in PowerPoint
You can easily create a flowchart in PowerPoint by simply following along the steps mentioned in this video. Check out SlideBazaar’s YouTube channel for more videos like this as well. Here you go:
Alright, let’s move on to the rest of the article.
1 – Prepare your slide.
First, you need to add grids, guides, and gridlines to your slide. This ensures that each element of the flowchart you create is aligned right.
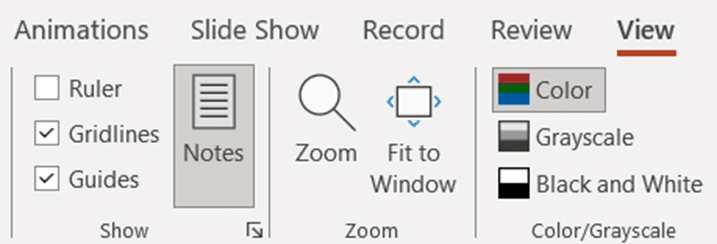
To turn on guides and gridlines, go to the View tab, and check the Gridlines and Guides checkboxes.
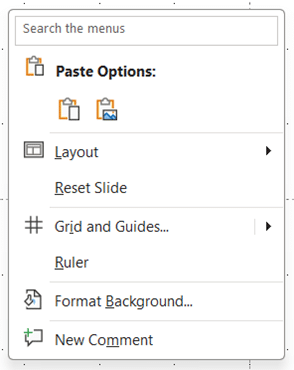
You can also right-click the slide and expand the Grid and Guides section to add guides and gridlines.
Next, right-click the slide, and click on Grid and Guides.
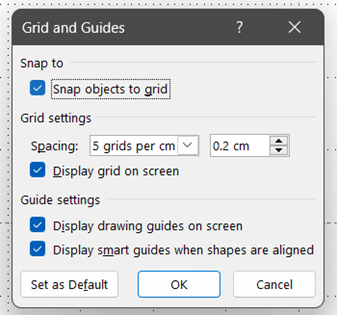
In the dialog box that appears, select the “Snap objects to grid” checkbox.
Now that your slide is ready for you to start creating your flowchart, let’s start building one!
2 – Create your flowchart.
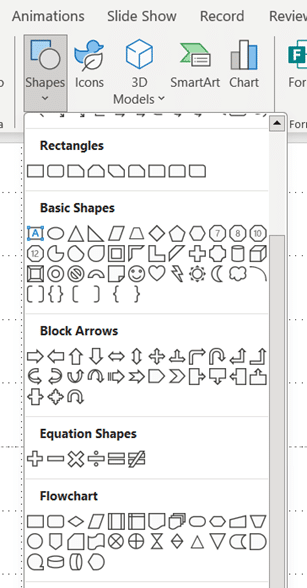
Start by creating the shapes needed for your flowchart. You can find them by going to Insert in the ribbon and clicking on Shapes. In the drop-down menu, you will find a section titled Flowchart. You will find all the shapes you need here.
Hover your mouse over each shape to know what they’re called and what they’re meant for. Start by clicking on the terminator shape. You can then either click on the slide to quickly create a terminator, or draw one while holding the Shift key on your keyboard.

You can then select the shape, and press CTRL + D to duplicate it and place it at the end of your flowchart.
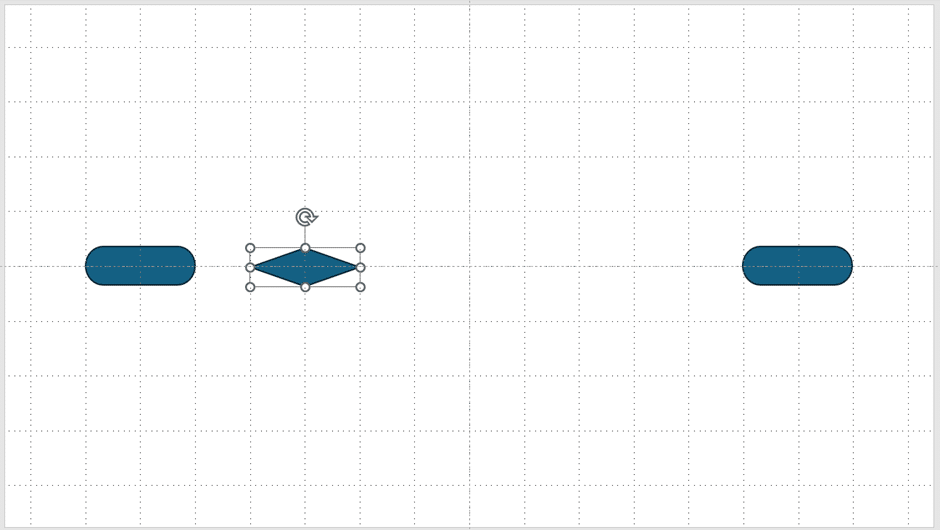
Next, you can either insert a Decision shape, or simply duplicate the terminator, select it, go to Shape Format, click on Edit Shape > Change Shape, and select Decision.
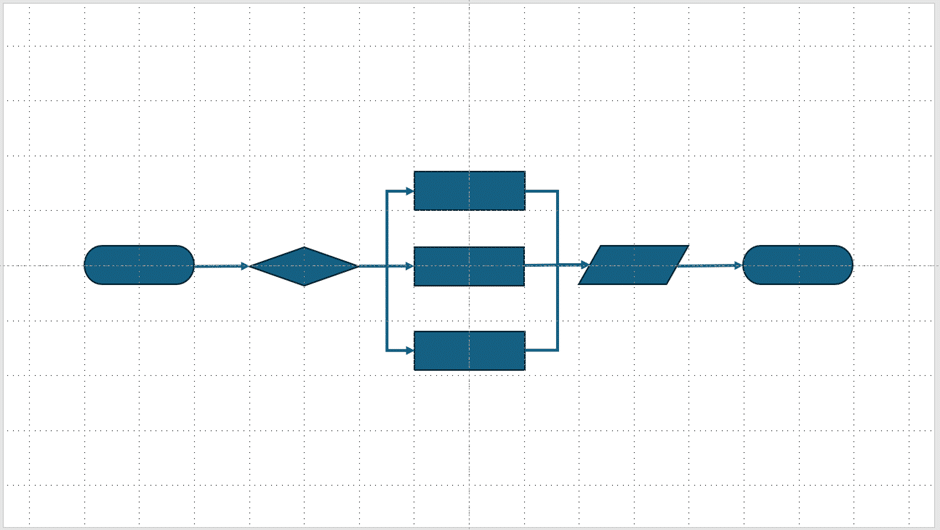
Duplicate the shapes, arrange them, and then change them to Process as shown:
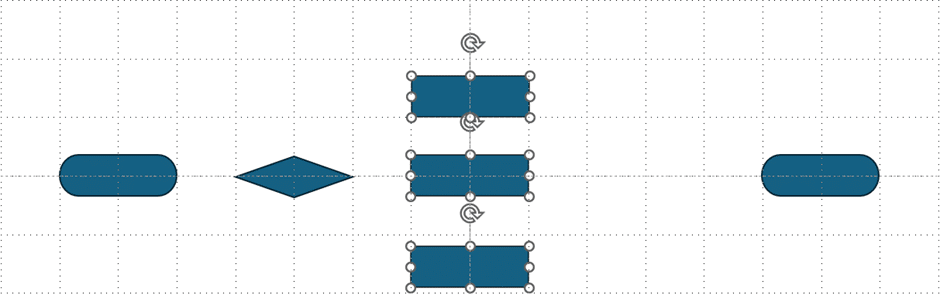
If you’re every unsure about their alignment or distribution, just select the shapes, go to Shape Format in the ribbon, and click on Align. In the drop-down menu, click on Distribute Vertically, or any other option you want.
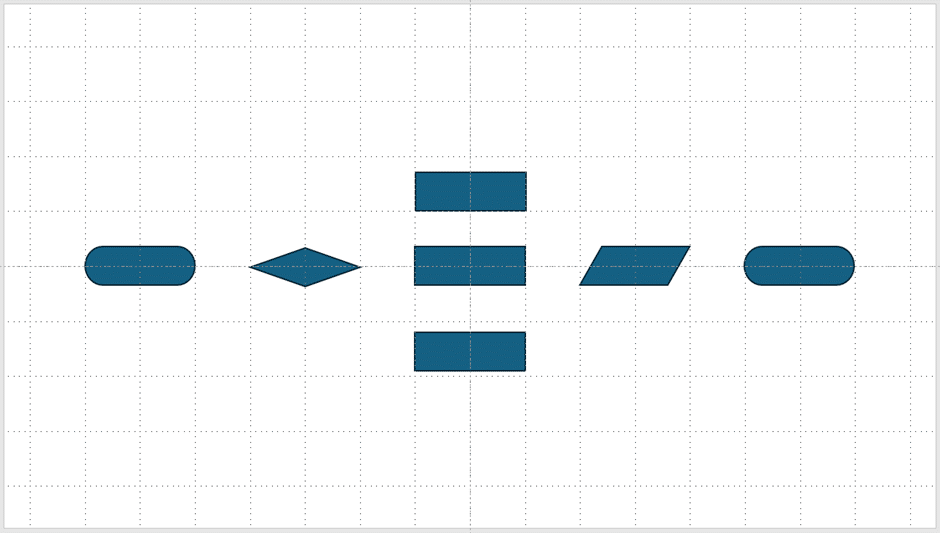
Finally, add one more element to your flowchart, by either going to Insert > Shapes, or by duplicating an existing shape, selecting it, and going to Shape Format > Edit Shape.
To add arrows, simply go to Insert > Shapes and select Line Arrow, or Elbow Arrow if the arrows need to be bent in your flowchart.
Here’s what that would look like:
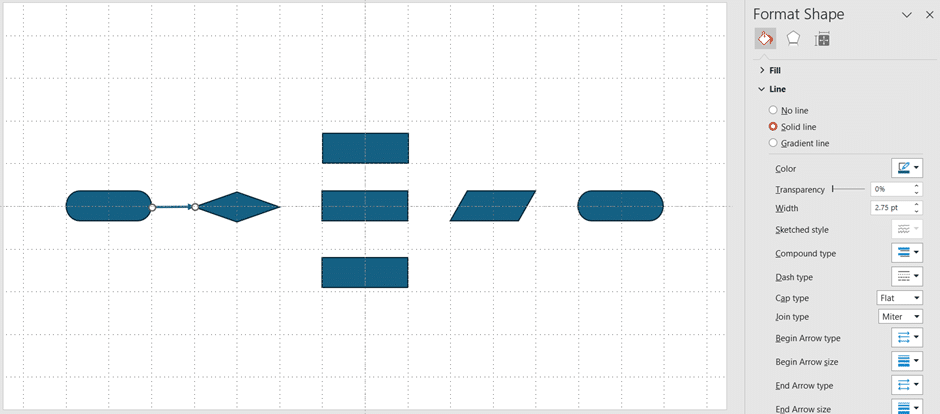
You can right-click the line and click on Format Shape to customize how the line appears. Try increasing the Width of the line arrow to make it more visible. Next, add some elbow arrows to connect the next couple of elements, and set the same width for them as well.
You can turn off the gridlines at this point by going to the View tab again.
Feel free to customize the elements, by changing the outline colors, adding shadows, etc. You can also add text to your flowchart by going to Insert > Text Box.

Understanding Flowchart Shapes:
If you’re brand new to the world of flowcharts, here’s a tiny guide on what the individual shapes mean in a flowchart.
Rectangle – Process: Represents process steps or processing function.
Diamond – Decision: Indicates decision points between two or more paths in a flowchart.
Oval – Terminator: Marks start and end points of a process.
Parallelogram – Data or Input/Output: Represents data in a flowchart.
Alternative Method
If you’re not a fan of creating a flowchart from scratch in PowerPoint, you can also try these alternative methods. Check out SlideBazaar’s templates to find a flowchart template that you can easily edit. Or you can even check out the free PowerPoint add-in for PowerPoint to insert flowcharts directly into your presentations with just a click.
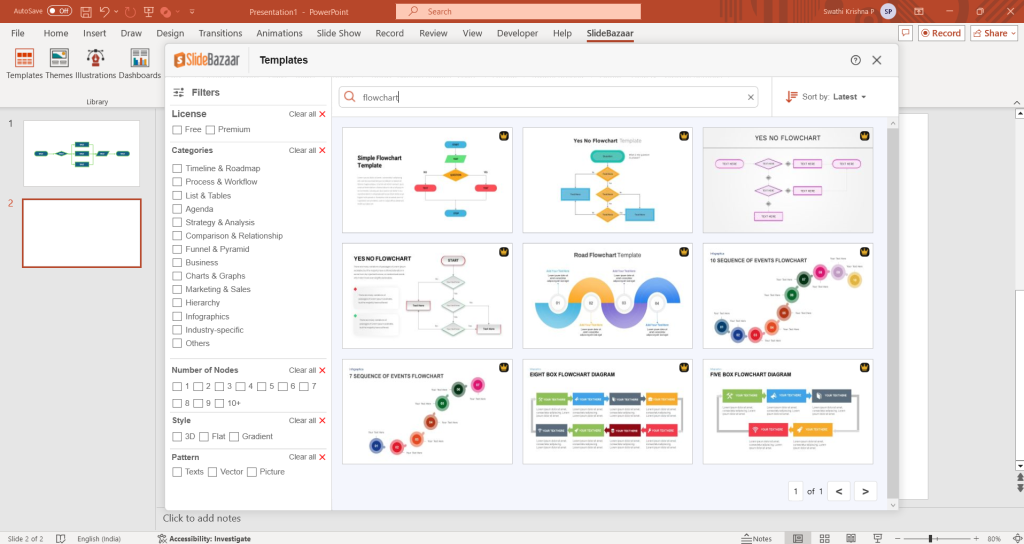
The add-in is sure to save you a ton of time, so be sure to check it out here.
By now, you’ve learned the basics of creating flowcharts in PowerPoint. Remember to explore the formatting options to create a professional and visually appealing flowchart that perfectly complements your content.
Related Articles
-
 November 10th, 2024
The Ultimate Guide to Effective and Engaging Slide Headlines
Blog Post -
 November 10th, 2025
How to Interview Presentation Designers (Portfolio Review Rubric Included)
Blog Post -
 October 31st, 2025
Measure Internal Client Satisfaction With Your Presentation Team (5-Question Survey)
Blog Post