
- How to make a timeline in PowerPoint
- Step 0: Choose the Right Type of Timeline First
- Method 1: Create a Timeline Using SmartArt
- Method 2: Create a Timeline Using Shapes
- Method 3: Create a Timeline Using a Table
- Method 4: Use a pre-built presentation template
- Making Your Timeline Accessible
- Exporting and Sharing Your Timeline
- Handling Too Many Milestones on One Slide
- Keyboard Shortcuts and Time-Saving Tips
- Saving Your Timeline as a Reusable Template
- Troubleshooting Common Timeline Problems
- Final Thoughts
How to Create a Timeline in PowerPoint [2026 Guide]
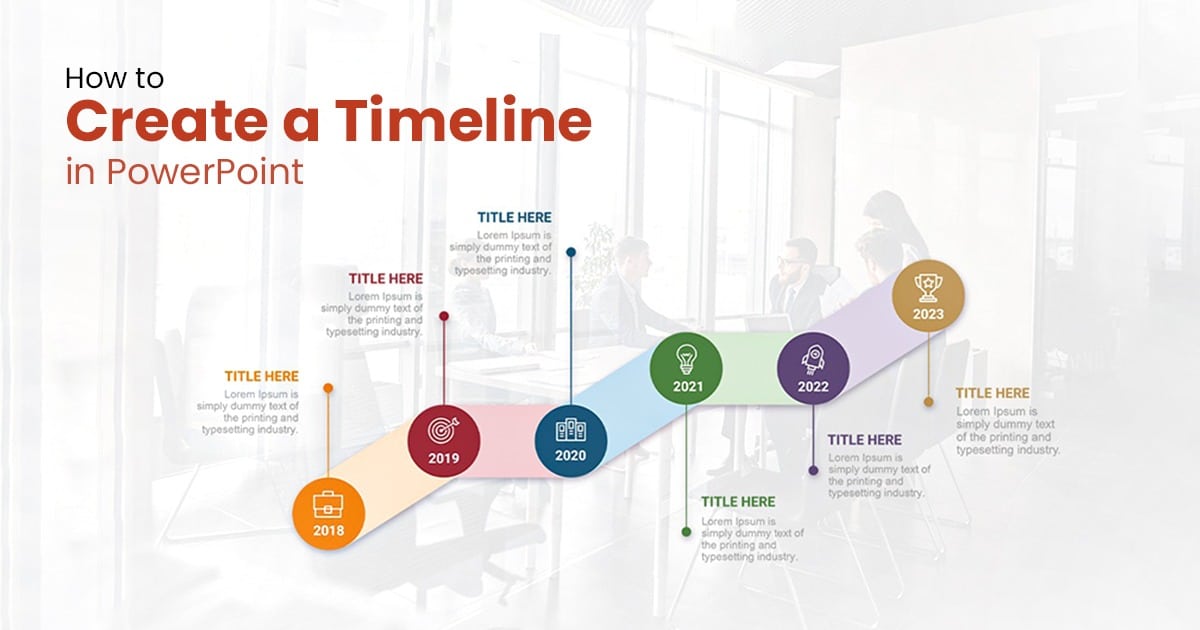

Whether you are presenting a product roadmap to your leadership team, walking a client through a project plan, or showing your company’s journey to potential investors, a well-crafted timeline slide can communicate information faster than paragraphs of text ever could.
This guide covers everything you need to know about creating timelines in PowerPoint in 2026, including accessibility best practices, keyboard shortcuts, and a full troubleshooting section. By the end, you will be able to build any type of timeline confidently, customize it to look polished, and reuse it across future presentations.
How to make a timeline in PowerPoint
Let’s get started with creating a timeline in PowerPoint. If you prefer watching a video tutorial, check out this video from our YouTube channel:
Step 0: Choose the Right Type of Timeline First
Before you open PowerPoint, take 60 seconds to decide what kind of timeline you actually need. Using the wrong format wastes time and produces a slide that confuses your audience rather than clarifying your message.
Use the table below to identify the right approach for your situation:
| Timeline Type | Best For | Audience | Recommended Method |
| Milestone Timeline | Project launches, product roadmaps | Executives, clients | SmartArt or Template |
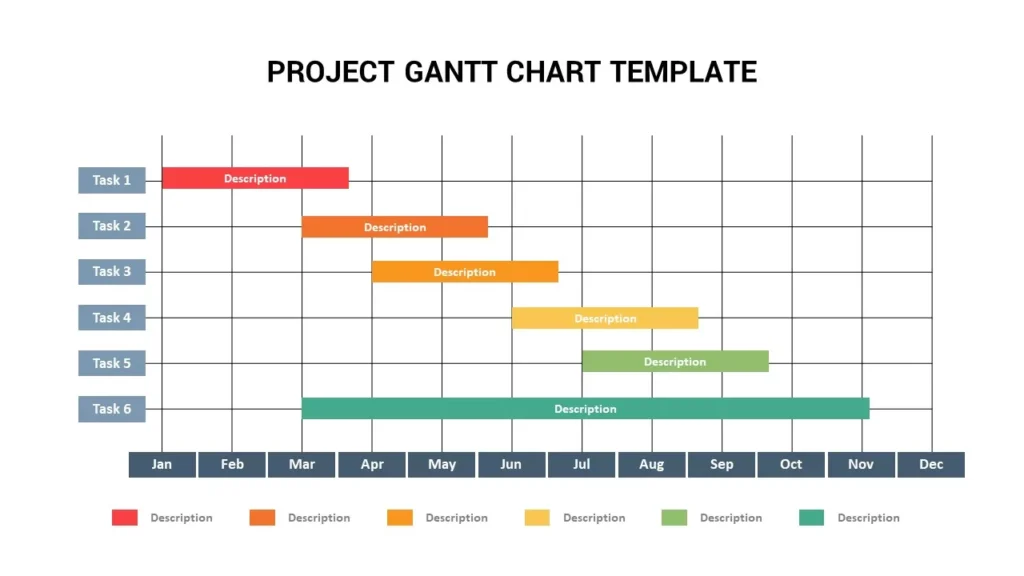
| Gantt-Style Timeline | Task tracking, project management | Project teams | Table method |
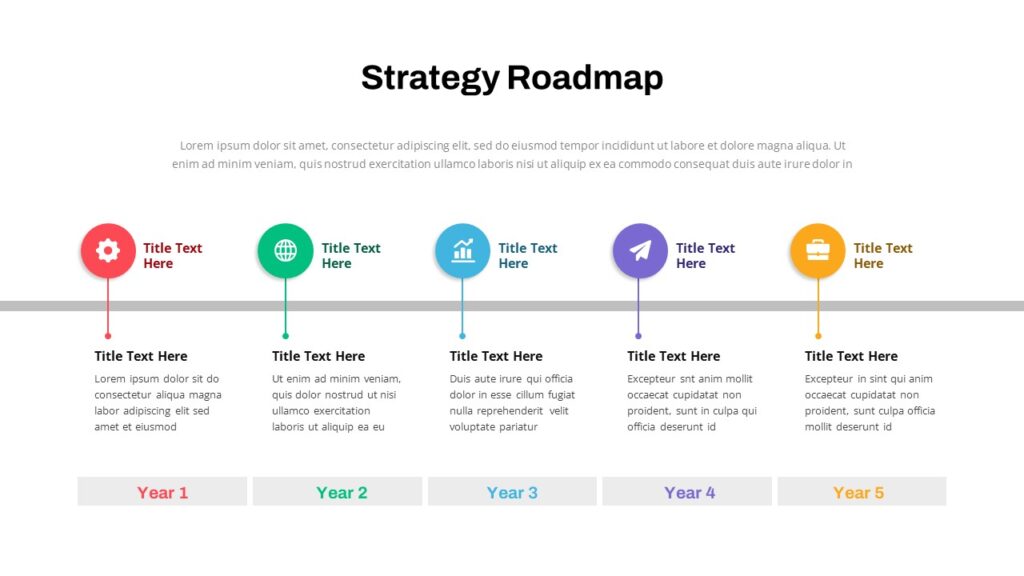
| Vertical Timeline | Company history, career journeys | General or investor audience | Shapes or Template |
| Picture Timeline | Storytelling, portfolios, education | Creative or academic audience | Template with placeholders |
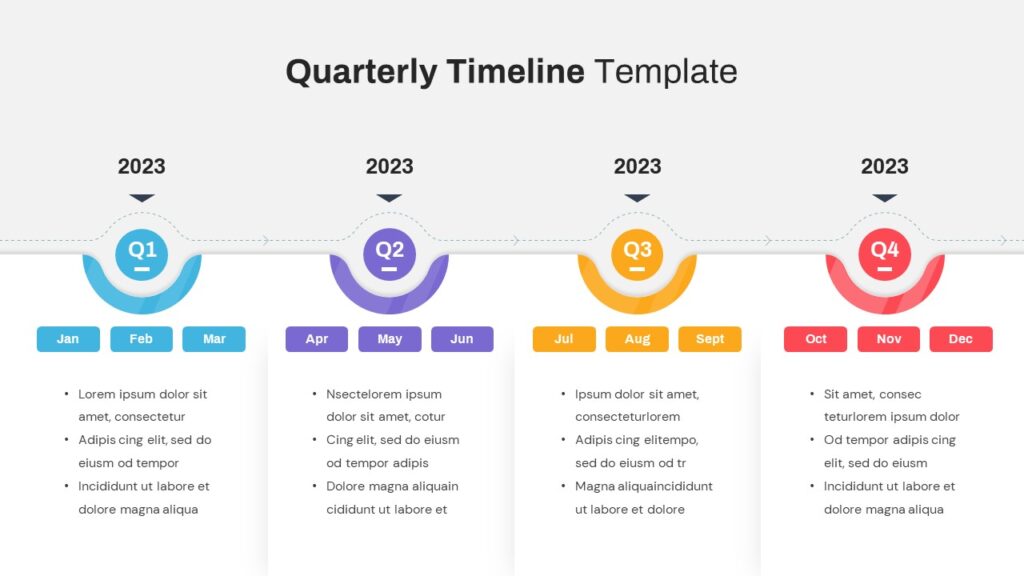
| Quarterly Timeline | Business planning, OKRs | Leadership, stakeholders | SmartArt or Table |
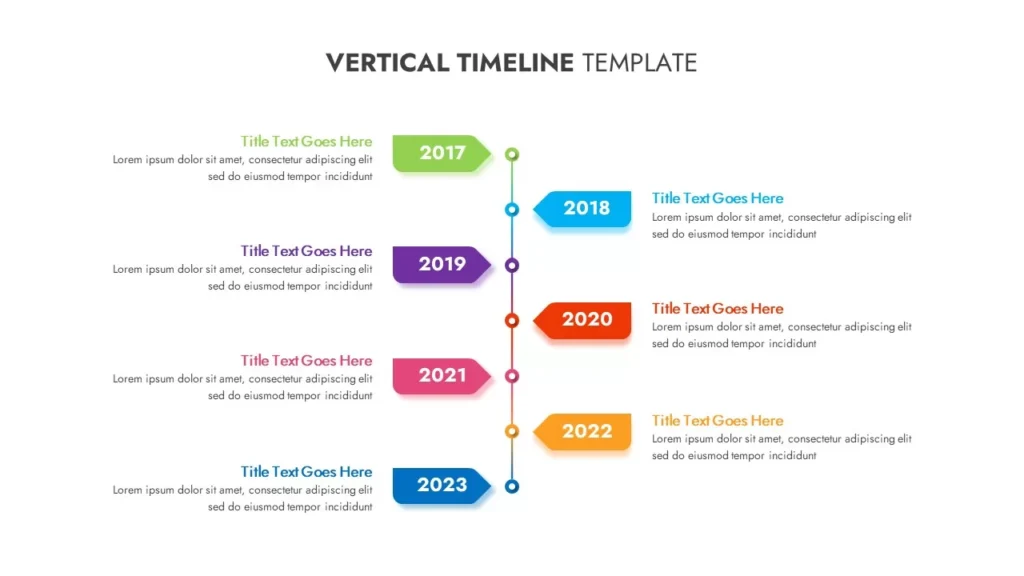
Here are a few examples of PowerPoint timeline templates:
Once you know which type of timeline you need, pick a creation method. The section below compares all five available methods so you can choose the one that fits your time, skill level, and design goals.
| Method | Time Required | Skill Level | Customization | Best For |
| SmartArt | 5-10 mins | Beginner | Low | Quick, simple timelines |
| Shapes | 15-25 mins | Intermediate | High | Custom, branded designs |
| Table | 10-15 mins | Beginner | Medium | Date-heavy or Gantt timelines |
| Template | 2-5 mins | Beginner | Medium | Polished results fast |
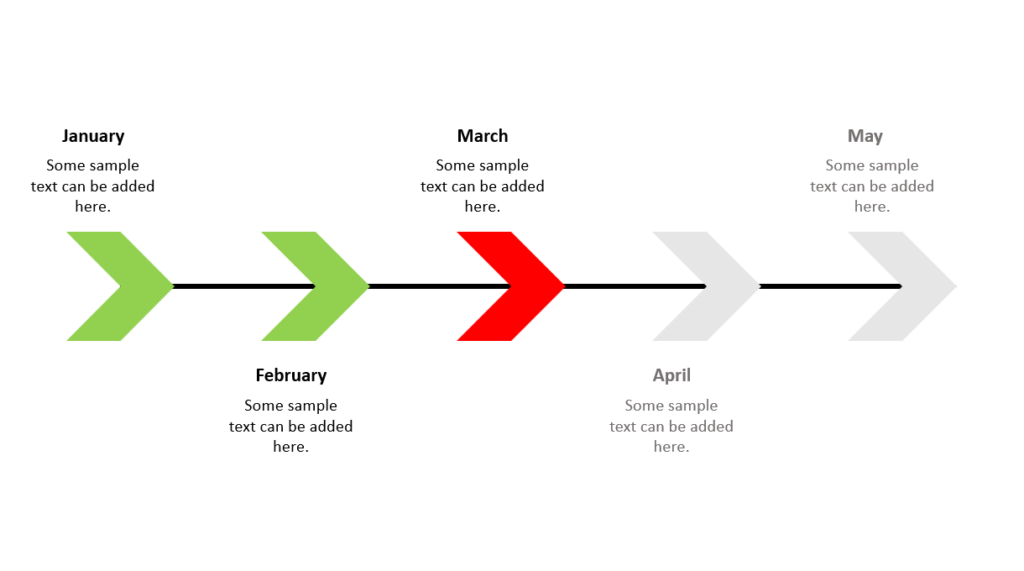
Method 1: Create a Timeline Using SmartArt
SmartArt is the fastest built-in route to a functional timeline and is ideal for beginners or anyone who needs results quickly. It is best suited for milestone and process-style timelines with up to seven events.
Step 1: Insert a SmartArt Graphic
Open your presentation and navigate to the slide where you want the timeline. Click the Insert tab on the ribbon, then click SmartArt. In the dialog box that appears, select the Process category from the left panel. From here, you have two dedicated timeline options: Basic Timeline and Circle Accent Timeline. For most use cases, Basic Timeline is the cleanest starting point.
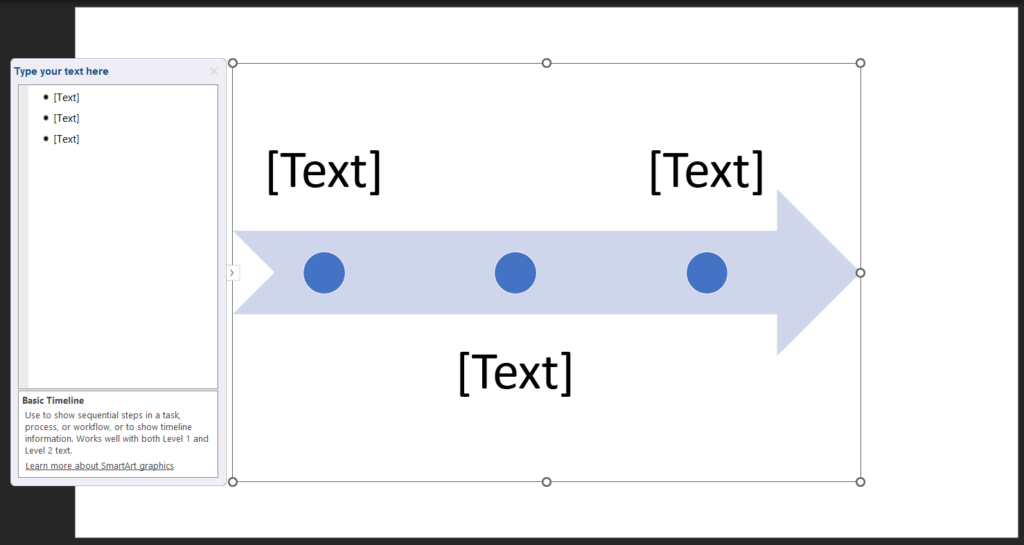
Step 2: Add Your Content Using the Text Pane
Rather than clicking directly on each shape to edit text, use the Text Pane. If it is not visible, click the small arrow on the left edge of the SmartArt graphic to open it. The Text Pane lets you add, edit, and remove milestones much faster than editing shapes individually.
Type each milestone date on the first line of a bullet point, then press Shift + Enter to add the description on the line below it. To add a new milestone, press Enter at the end of an existing item and type the new date.
| Pro Tip: Keep your milestone count to five or seven maximum. PowerPoint automatically shrinks the font the more items you add. Beyond seven, the text becomes too small to read on a projected screen. |
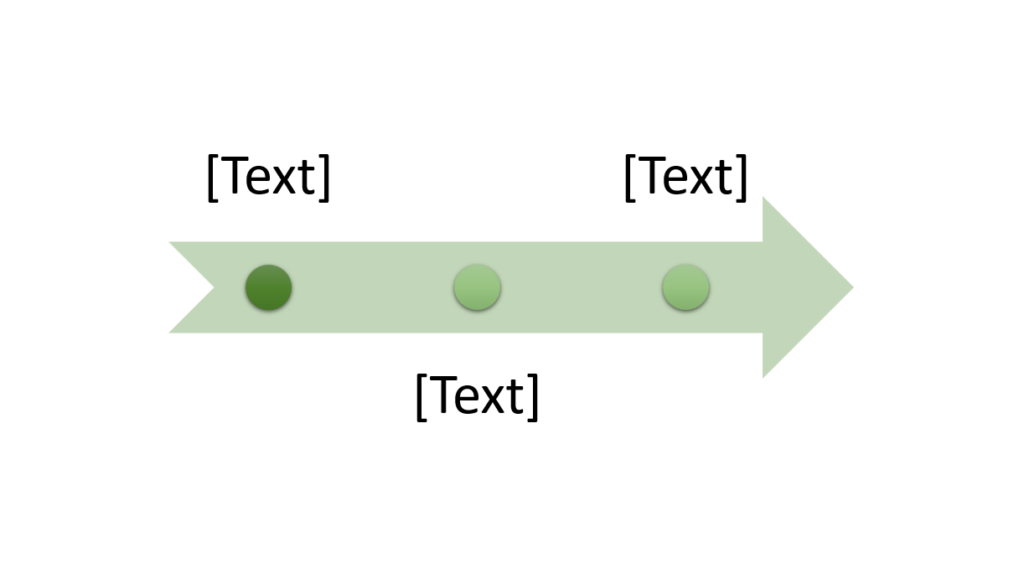
Step 3: Customize the Design
With the SmartArt selected, click the SmartArt Design tab. Use Change Colors to apply a color palette that fits your brand or presentation theme. Use SmartArt Styles to apply a visual treatment such as Intense Effect or Polished. For individual milestone customization, right-click any shape and use Shape Fill to highlight key events in a different color.
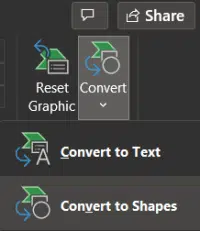
Step 4: Animate the Timeline (Optional but Impactful)
To reveal each milestone one at a time during your presentation, you will need to convert the SmartArt to individual shapes first. Go to the SmartArt Design tab, click Convert, and select Convert to Shapes.
Then right-click the resulting group and select Group, followed by Ungroup.
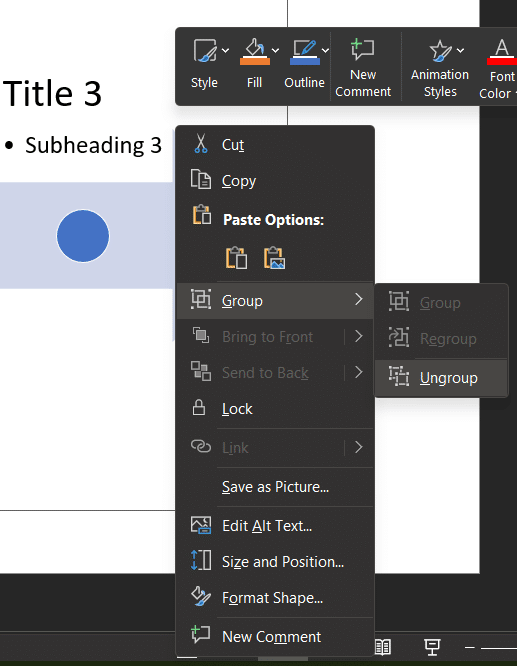
Now click the first element, go to the Animations tab, and apply an animation such as Fade or Wipe. For each element, set the Start option under Timing to After Previous. This creates a smooth, automatic reveal of each milestone without requiring a click for every step.
Method 2: Create a Timeline Using Shapes
If you need a highly customized timeline that matches specific brand guidelines or a unique layout, building it from scratch with shapes gives you the most control. This method takes more time but produces designs that SmartArt cannot replicate.
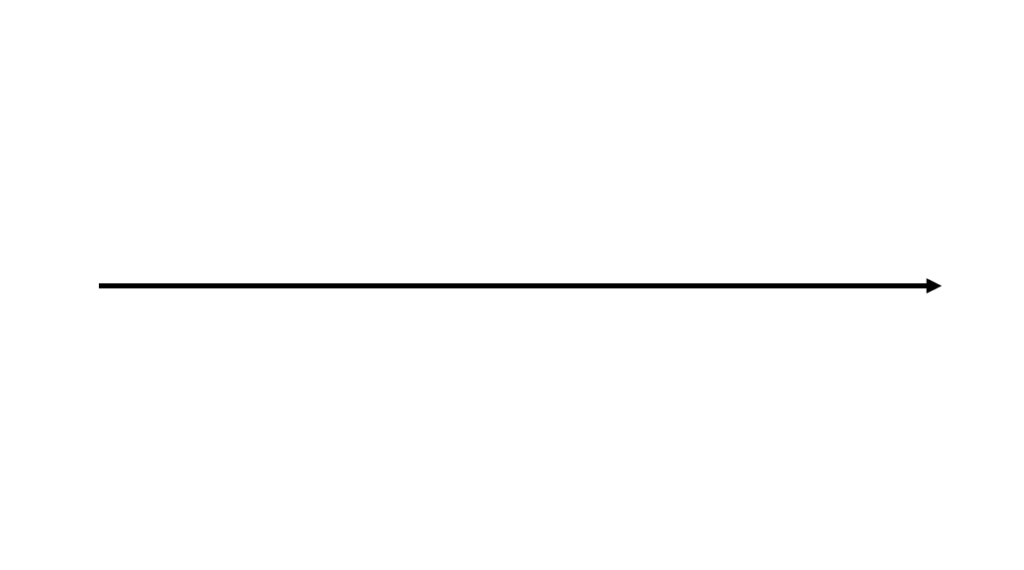
Step 1: Draw the Timeline Axis
Go to Insert, then Shapes, and select the Line shape. Draw a horizontal line across the slide. Hold Shift while drawing to keep the line perfectly straight. Then switch to the Arrow shape to create a more directional feel if your timeline shows progression.
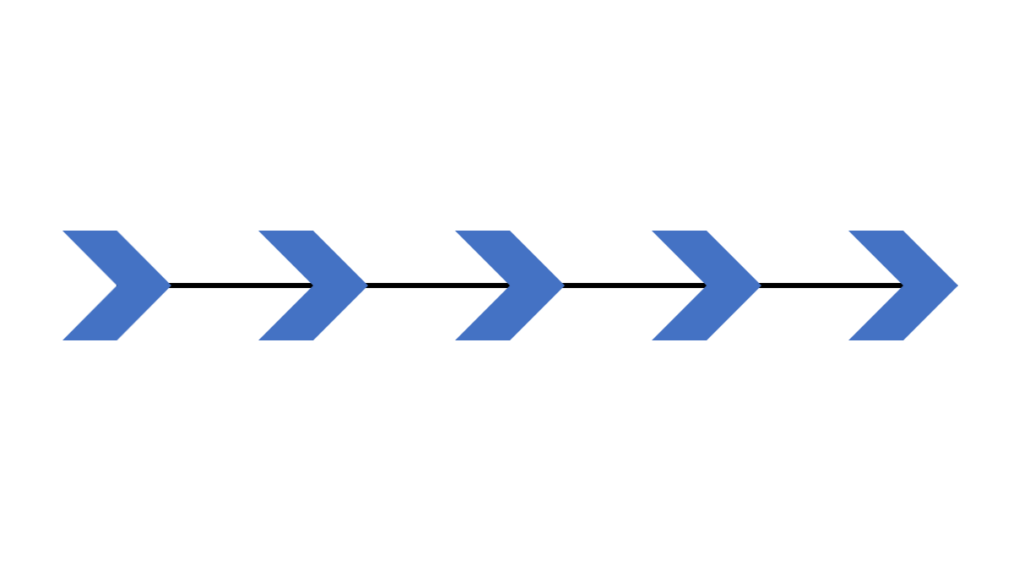
Step 2: Add Milestone Markers
Insert small circles or diamonds along the line to represent each milestone. You can copy and paste one shape, then use Align from the Shape Format tab to distribute them horizontally with equal spacing. This is much faster than positioning each one manually.
Step 3: Add Labels and Connectors
Go to Insert, then Text Box, and add a label for each milestone. Place dates above or below the line and descriptions on the opposite side for a clean, easy-to-read layout. Add short vertical lines as connectors between the milestone circles and their labels.
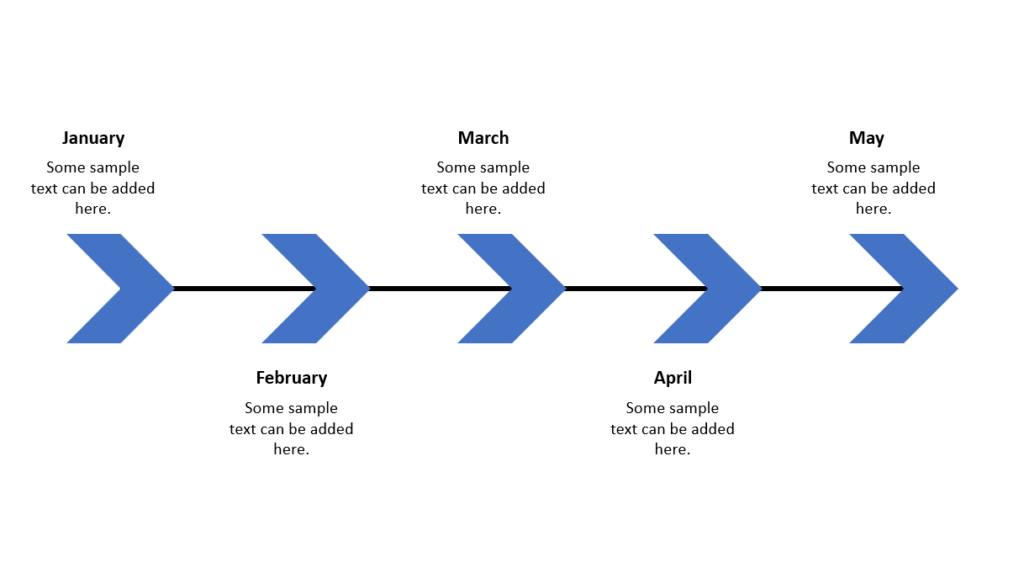
Step 4: Color Code the Timeline
Select shapes and use Shape Fill to color code by category, phase, or priority. For example, you could use blue for completed milestones, orange for in-progress, and gray for upcoming. This makes your timeline scannable at a glance.
| Pro Tip: Use the Format Painter (Home tab, or Ctrl+Shift+C then Ctrl+Shift+V) to copy the exact formatting of one shape to all others instantly. This is far faster than styling each element individually. |
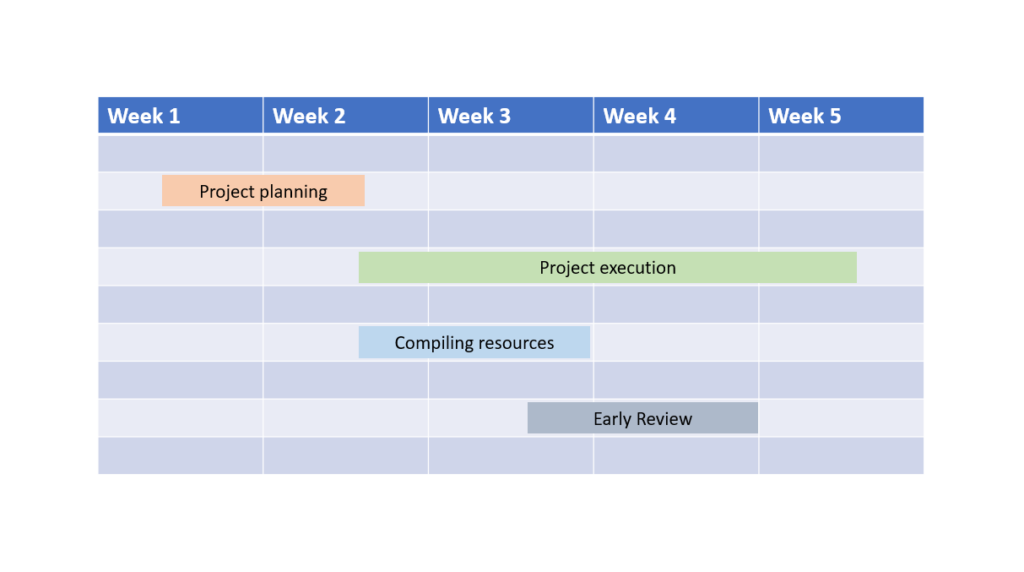
Method 3: Create a Timeline Using a Table
A table-based timeline is the best option when you need to display many dates, tasks, or when you want a Gantt-chart-style visual. It is especially useful for project timelines where multiple tasks run in parallel across weeks or months.
Step 1: Insert a Table
Click Insert, then Table. Choose a number of columns that matches your time periods (for example, 12 columns for a 12-month timeline) and enough rows for each task or category. A good starting point for a quarterly timeline is a 5-column, 6-row table.
Step 2: Populate the Table
Label the first row with your time periods (months, quarters, weeks). Add text boxes to fill in your tasks.
Step 3: Color the Text boxes
Select the text boxes and apply a fill color using Shape Fill from the Table Design tab. Use a consistent color scheme, for example green for on-track, amber for at-risk, and red for delayed. This creates a visual Gantt chart without needing any specialized software.
| Pro Tip: Merge cells that span multiple time periods to show continuous tasks cleanly. Select the cells, right-click, and choose Merge Cells. |
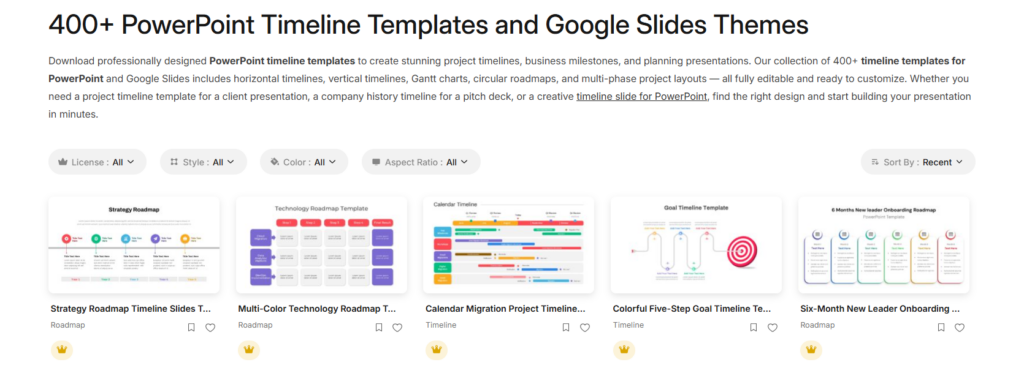
Method 4: Use a pre-built presentation template
This is the easiest way to start building a timeline for any kind of presentation. Simply head to a website like SlideBazaar.com (just click our logo at the top) and search for “timeline”. You’ll get plenty of pre-designed slides that you can download and customize easily to get your timeline ready in no time.
Making Your Timeline Accessible
Accessibility is often overlooked in presentation design, but it matters more than most people realize. Roughly 8% of men and 0.5% of women have some form of color vision deficiency. Screen readers are commonly used by people with visual impairments who may still receive your presentation as a file. Building accessibility into your timeline from the start takes only a few extra minutes.
Add Alt Text to Your Timeline
Alt text is a short written description of a visual element that screen readers use to describe images and graphics to visually impaired users. To add alt text to your timeline, right-click the SmartArt graphic or shape group, select Edit Alt Text, and type a clear description of what the timeline shows.
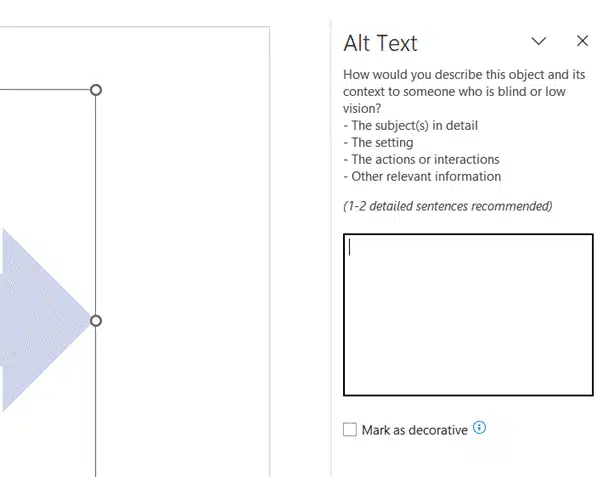
A good alt text example: ‘Horizontal milestone timeline showing four project phases in 2026: Planning in Q1, Development in Q2, Testing in Q3, and Launch in Q4.’
Check Color Contrast
Avoid relying on color alone to convey meaning. If you use green to mean ‘completed’ and red to mean ‘delayed’, someone with red-green color blindness cannot distinguish between them. Add text labels, patterns, or icons to reinforce what the color is communicating.
As a general rule, aim for a contrast ratio of at least 4.5:1 between text and its background. PowerPoint’s Accessibility Checker (Review tab, Check Accessibility) will flag low-contrast issues automatically.
Font Size for Projected Slides
Timeline text has a tendency to be small, especially when many milestones are packed into one slide. For slides projected on a screen, use a minimum font size of 18pt for labels and 14pt for supporting details. If your font is going below this threshold, it is a signal to reduce the number of milestones on the slide or split the timeline across two slides.
| Pro Tip: Use Review > Check Accessibility before finalizing your presentation. PowerPoint will highlight missing alt text, low contrast issues, and other accessibility problems automatically. |
Exporting and Sharing Your Timeline
Once your timeline is complete, how you share it matters. The format you export to affects how it looks on other people’s screens and how editable it remains.
Exporting as PDF
PDF is the safest format for sharing a timeline when you do not want anyone editing it. To export, go to File, then Export, then Create PDF/XPS. Choose Optimize for: Standard for print-quality output, or Minimum Size for email or web sharing. PDFs preserve your fonts, colors, and layouts exactly as designed.
Exporting as an Image
If you need to embed your timeline in a Word document, a report, a website, or another tool, export it as an image. Just like above, go to File, Export, and you’ll see the option to save in a different file format. Simply select the image format you want, and PowerPoint will ask which all slides you’d like to export as image.
Embedding in Microsoft Word or Teams
To embed your timeline in a Word document, copy the timeline shapes on your slide (Ctrl+A to select all, then Ctrl+C), switch to Word, and use Paste Special (Ctrl+Alt+V) to paste it as a Microsoft PowerPoint Object. This keeps it editable in both applications. For Microsoft Teams, you can share the PPTX file directly in a channel or attach it to a meeting for collaborative review.
Sharing for Collaboration
If you are working with a team, save the file to OneDrive or SharePoint and use Share from the File menu to send a link rather than an attachment. This ensures everyone is working on the same version. You can set permissions to ‘Can View’ if you do not want others making changes.
Handling Too Many Milestones on One Slide
One of the most common mistakes in timeline design is cramming too many events onto a single slide. When this happens, text shrinks, shapes overlap, and the audience ends up squinting rather than understanding. Here is how to manage this effectively.
The 5-7 Rule
A single timeline slide works best with five to seven milestones. Beyond this, the design starts to degrade. If your project or story has more events than this, you have several good options.
Option 1: Split Across Multiple Slides
Break your timeline into phases, each on its own slide. For example, a 12-month project could become four slides covering Q1, Q2, Q3 and Q4. Use a consistent visual anchor (like a progress bar or a mini-overview at the top of each slide) to remind the audience where they are in the overall timeline.
Option 2: Use a High-Level Overview Slide, Then Zoom In
Create one overview timeline slide with broad phases labeled (e.g., Research, Design, Build, Launch). Then create separate detail slides for each phase. This layered approach works especially well in executive presentations where the audience needs both the big picture and the specifics.
Option 3: Use a Table-Based or Gantt Layout
When you genuinely need to show many tasks at once (10 or more), switch to the table method covered in Method 3. A Gantt layout handles large amounts of data more gracefully than a SmartArt or shapes timeline.
| Design Rule: If you find yourself shrinking fonts below 16pt to make everything fit, that is a clear signal to redesign. A timeline your audience cannot read has no value. |
Keyboard Shortcuts and Time-Saving Tips
Once you know the shortcuts, building and editing timelines in PowerPoint becomes significantly faster. These are the most useful ones for timeline work specifically.
Essential Keyboard Shortcuts
| Shortcut | What It Does |
| Ctrl + D | Duplicate a selected shape instantly (faster than copy-paste) |
| Ctrl + Shift + C / V | Copy and paste formatting only (Format Painter shortcut) |
| Alt + F10 | Open the Selection Pane to manage overlapping elements |
| Ctrl + G / Ctrl + Shift + G | Group and ungroup shapes |
| Ctrl + A | Select all objects on the slide |
| Shift + Arrow Keys | Nudge selected shapes in small increments for precise positioning |
| Ctrl + Z / Ctrl + Y | Undo and redo |
Additional Time-Saving Tips
- Use the Align tool: Select multiple shapes, go to Shape Format > Align, and use Distribute Horizontally to space milestones evenly in one click.
- Use the Selection Pane (Alt+F10): When timeline shapes overlap, the Selection Pane lets you click on any element by name and reorder layers without hunting on the slide.
- Use Slide Master for repeated timelines: If you use the same timeline layout across multiple presentations, set it up once in the Slide Master (View > Slide Master) and it will be available as a layout for any future slide.
PS: If you’re confused about what the Slide Master is, check out our free course to learn more.
Saving Your Timeline as a Reusable Template
If you build a strong timeline slide, it is worth the two extra minutes it takes to save it as a reusable asset. This pays dividends every time you need a new timeline in the future.
Save as a PowerPoint Template (.potx)
Once your timeline slide is finalized, go to File, then Save As. In the Save As Type dropdown, choose PowerPoint Template (.potx). Give it a descriptive name like ‘Quarterly Project Timeline Template’ and save it. The next time you open PowerPoint, you can access it from the New presentation screen under Personal Templates.
Save as a Slide in Your Slide Library
If you use SharePoint, you can publish individual slides to a shared Slide Library so your whole team can access them. Go to File, then Publish, then Publish Slides. This is particularly useful for teams that regularly need the same timeline format across multiple presentations.
Add a Timeline to Your Slide Master
If your company has a standard PowerPoint template, you can add a pre-built timeline layout to it via the Slide Master. Go to View, then Slide Master, and either edit an existing layout or add a new one. This way, whenever someone on your team creates a new slide in the company template, the timeline layout is available with a single click.
| Pro Tip: Before saving as a template, replace your real content with clearly labeled placeholder text like ‘[Project Name]’ and ‘[Milestone Date]’. This makes the template immediately usable for anyone picking it up for the first time. |
Troubleshooting Common Timeline Problems
Even experienced PowerPoint users run into frustrating issues when building timelines. The table below covers the most common problems, what causes them, and how to fix them.
| Problem | Cause | Fix |
| Text shrinks as you add milestones | SmartArt auto-scales font | Expand the SmartArt box or keep milestones to 5-7 max |
| Connectors move when you resize shapes | Connectors are not locked to shapes | Right-click connector, select ‘Format Shape’, and adjust connection points manually |
| Timeline looks distorted on projector | Slide aspect ratio mismatch | Set slide size to 16:9 (Widescreen) under Design > Slide Size before building |
| SmartArt does not convert cleanly to shapes | Complex SmartArt styles cause issues | Use a simpler SmartArt style (e.g., Basic Timeline) before converting |
| Milestones are not evenly spaced after editing | Manual drag disrupts SmartArt layout | Use the Text Pane to add/remove items instead of dragging shapes |
| Colors look washed out on screen | Monitor calibration or projector settings | Use high-contrast colors and test your slide on the target display before presenting |
Final Thoughts
Creating a great timeline in PowerPoint is equal parts planning, method selection, and design discipline. The most important decision you make is often the one you make before you open PowerPoint: choosing the right type of timeline for your specific audience and purpose.
Whether you use SmartArt for speed, shapes for full control, a table for complex data, a template to save time, or Copilot to get an AI-powered head start, the methods in this guide cover every situation you are likely to encounter in a professional setting.
The finishing details, including accessibility, thoughtful exporting, and saving your work as a reusable template, are what separate a good timeline from a great one. With the keyboard shortcuts and troubleshooting tips here, you can also work faster and avoid the common pitfalls that slow most people down.
Now that you have a complete picture of how to create timelines in PowerPoint, the next step is simply to build one. Open a blank slide, pick the method that matches your needs, and get started.
Related Articles
-
 May 21st, 2024
How To Make a Circle Diagram in PowerPoint
Blog Post -
 September 27th, 2024
Essential Tips: What You Need to Know About Animations In PowerPoint
Blog Post -
 May 21st, 2024
How to Use PowerPoint on an Android Smartphone – Basic Overview
Blog Post