


Four Stage Bubble Chart PowerPoint Template and Keynote
Description
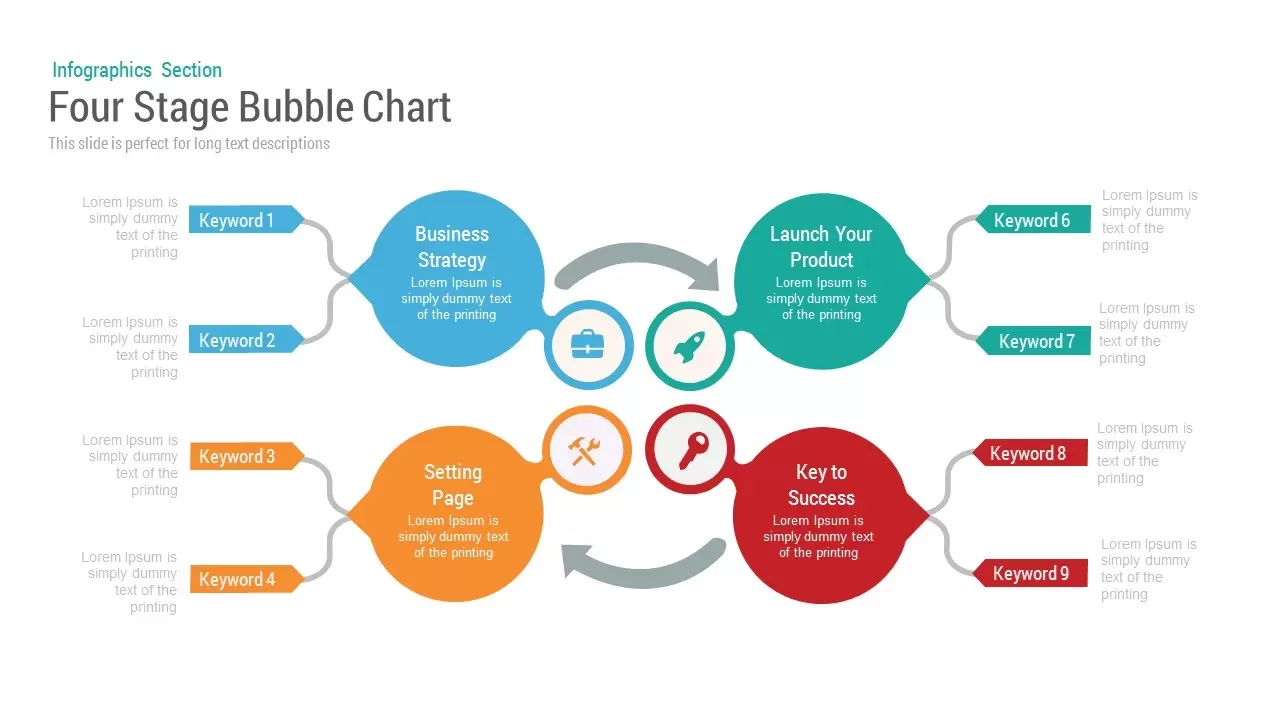
This four-stage Bubble Chart template uses interconnected circular modules to illustrate a cyclical process or workflow. Each module—Business Strategy (blue), Launch Your Product (cyan), Setting Page (orange), and Key to Success (red)—features a large bubble with a central icon and editable heading, linked by subtle arrows that guide the viewer through the sequence. Secondary callouts on each side connect to smaller keyword labels and text blocks, allowing up to two subpoints per stage. The clean white canvas and vector shapes ensure pixel-perfect scaling on both 16:9 and 4:3 displays.
Built on master slides in PowerPoint and Google Slides, every element is fully customizable: swap colors via the theme palette, replace icons with drag-and-drop ease, and update fonts globally with free web fonts. Precise alignment guides and subtle drop shadows maintain a polished aesthetic without clutter, while hidden variation slides offer alternate color schemes and layout tweaks for rapid theming. Use pre-configured entrance animations or morph transitions to lead your audience through each bubble in order, reinforcing narrative flow and maximizing engagement.
Who is it for
Project managers, consultants, and marketing teams who need to map multi-step strategies or service roadmaps. Product owners, trainers, and educators can leverage this template to break down feature launches, training modules, or process breakdowns with clarity and style.
Other Uses
Repurpose this layout for customer journey maps, departmental handoffs, or competitive analyses. Swap the main bubbles for KPI metrics or financial data to create dashboard slides, or adjust the connectors to build decision trees and organizational charts.
Login to download this file

Item ID
SB00020