Free Project Dashboard Powerpoint Template

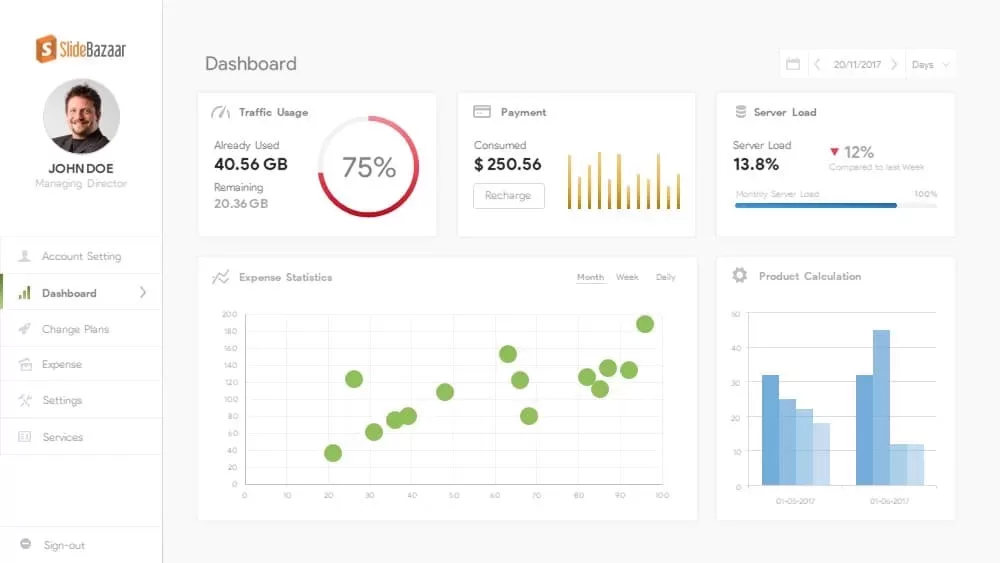
This modern dashboard slide presents a comprehensive overview of critical metrics in a clean card-based layout. It features a traffic usage donut chart with percentage and data values, a payment analytics bar graph, a server load gauge with comparative indicators, an expense statistics scatter plot, and a product calculation bar chart. Each metric resides in a separate, editable card with intuitive icons, crisp typography, and subtle drop shadows to guide viewer focus. The flat, white background and master slide structure ensure seamless integration with corporate branding, while customizable fonts and color themes let you adapt charts to your palette with a few clicks. Optimized for both PowerPoint and Google Slides, this slide maintains pixel-perfect clarity across devices, eliminating formatting issues and speeding up your presentation workflow.
Integrate dynamic data imports to keep metrics up to date, or manually adjust values to match your report. The intuitive drag-and-drop placeholders and vector shapes simplify customization—swap charts, update labels, and recolor elements in seconds. Ideal for high-resolution exports, this asset keeps your visuals sharp in print or on large displays.
Who is it for
Business analysts, data teams, IT managers, and operations leaders will find this dashboard indispensable for real-time performance monitoring, monthly reporting, and executive briefings. Finance directors, project managers, and marketing specialists can leverage the clear visualizations to highlight key performance indicators, track spending patterns, and forecast resource needs.
Other Uses
Beyond performance reporting, repurpose this slide for sales dashboards, marketing campaign summaries, budget reviews, project status overviews, customer behavior analysis, or vendor management tracking. Duplicate cards to showcase additional KPIs, reorganize chart types to suit your narrative, or combine with other slides to build a cohesive business intelligence deck.
Login to download this file
Add to favorites
Add to collection


