search

Essentials

Must-have decks for quick wins

By Industry

Professionally tailored slides for every sector

By Style

Minimal, modern and creative designs

By Topic

Explore slides curated by purpose and theme

TimelineTimelineRoadmapRoadmapStrategyStrategyGoalsGoalsTableTableComparisonComparisonSWOTSWOTAgendaAgendaArrowArrowWorld MapWorld MapMapsMapsProcessProcessFunnelFunnelTeamTeamOrg ChartOrg ChartPyramidPyramidCircularCircular

Business PlanBusiness PlanBusiness StrategyBusiness StrategyBusiness ProposalBusiness ProposalBusiness ModelsBusiness ModelsDigital MarketingDigital MarketingMarketing FunnelMarketing FunnelCustomer ExperienceCustomer ExperienceProject StatusProject StatusGantt ChartGantt ChartRecruitmentRecruitmentEmployee PerformanceEmployee PerformanceLeadershipLeadershipAIAIMachine LearningMachine Learning

AI Presentation Maker

Install the Windows plugin for quick access to templates and design tools.

AI Infographics Maker

Use our Office 365 add - in to access templates directly from the cloud.

Exe Version

Install the Windows plugin for quick access to templates and design tools.

Office 365

Use our Office 365 add - in to access templates directly from the cloud.

Mac Version

Get the Mac plugin to easily browse, insert, and customize templates and visuals within PowerPoint.

Earned Value Management PowerPoint Template Dark and Google Slides

Earned Value Management PowerPoint Template Dark and Google Slides
This template is part of a deck featuring multiple slides. To check out all slides, click on See All. See All round right arrow
Earned Value Management PowerPoint Template and Google Slides

Description

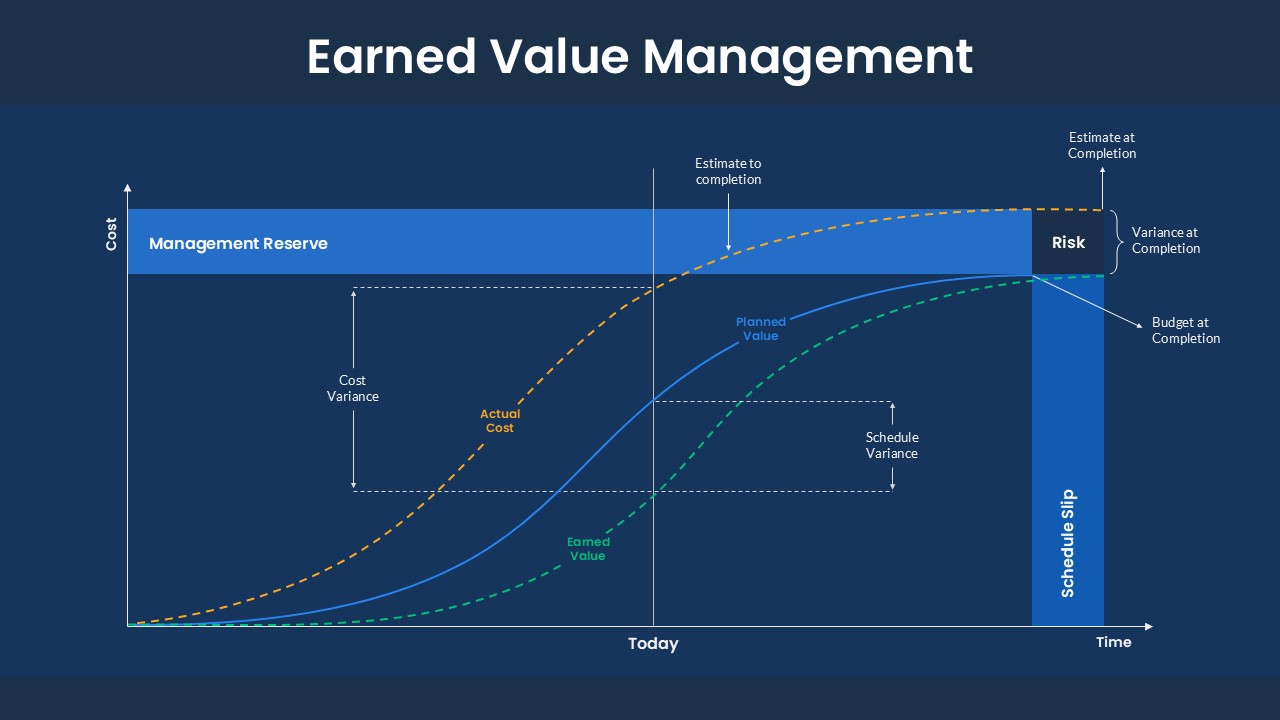
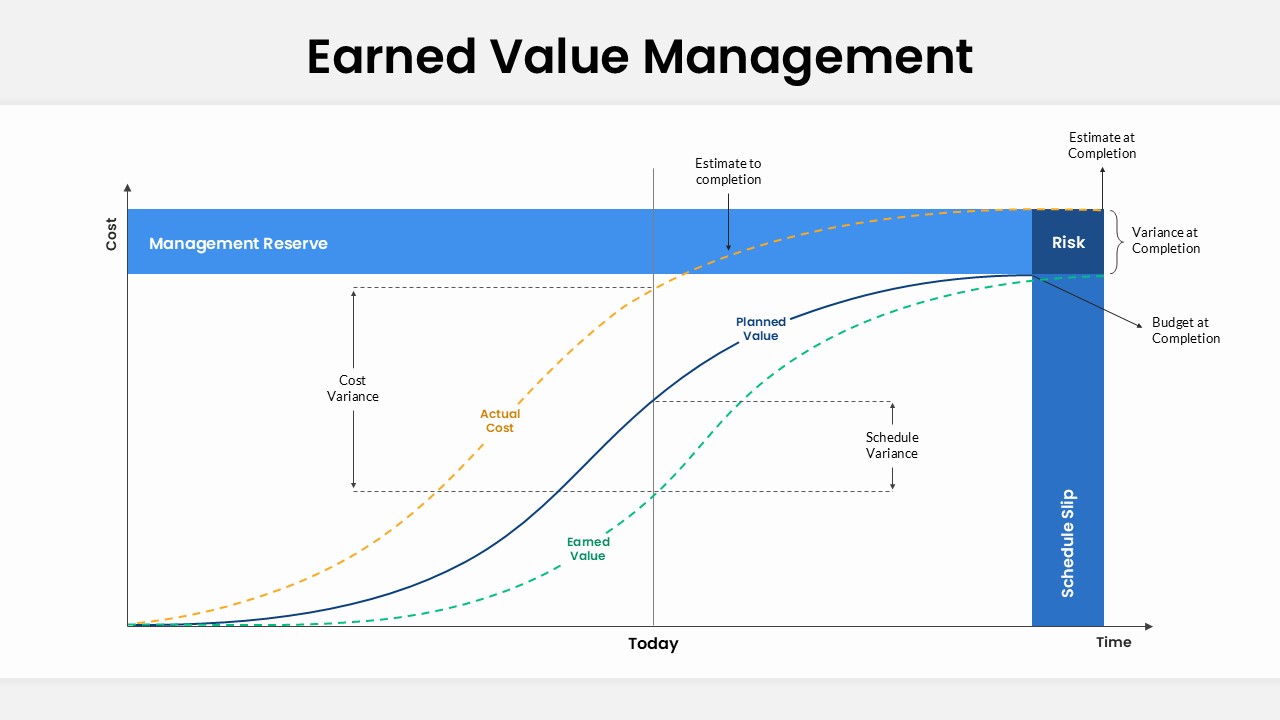
This slide presents a clear EVM overview with three cumulative curves (Planned Value in blue, Actual Cost in dashed orange, Earned Value in dashed green) plotted against time. A vertical “Today” marker shows current status. Horizontal and vertical variance callouts illustrate Cost Variance (difference between Earned Value and Actual Cost) and Schedule Variance (difference between Earned Value and Planned Value). To the right, a stacked bar shows “Budget at Completion” vs. “Risk” reserve, labeled “Variance at Completion,” and a tall blue bar marks “Schedule Slip.” A wide “Management Reserve” banner runs across the top. Axes are labeled “Cost” (Y) and “Time” (X). Clean, fully editable lines, labels, and colors make this ideal for project control reviews.

Who is it for

Project managers, PMOs, schedulers, cost control analysts, and stakeholders needing to track project performance against budget and schedule.

Other Uses

  • Status reports
  • Steering-committee briefings
  • Risk & reserve planning
  • Forecasting completion estimates

Login to download this file