


E Commerce Purchase Funnel Report
Description
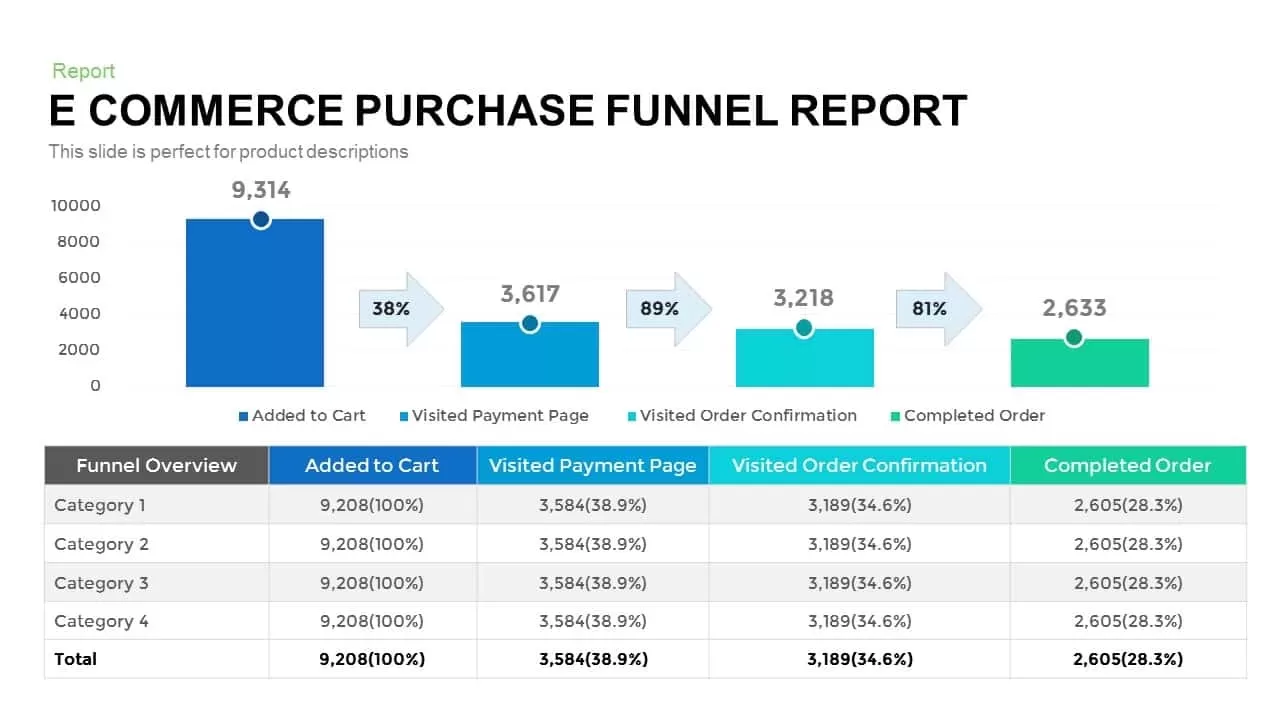
This E-commerce Purchase Funnel Report slide is an ideal tool for presenting your sales funnel data in a clear and structured way. Featuring a funnel chart that tracks customer movement through each stage—from adding items to the cart to completing the order—this slide enables you to visualize key conversion metrics. The flowchart uses vibrant colors, including blue and green, to represent each stage and percentage data that helps track the effectiveness of the e-commerce funnel.
With an easy-to-understand layout, this report provides insights into the conversion rates between each stage. The accompanying table further breaks down the data by categories, providing detailed metrics for each step of the funnel. This design is perfect for business owners, e-commerce managers, and marketers who need to assess and optimize their sales funnel. Optimized for both PowerPoint and Google Slides, this slide ensures high resolution and seamless editing across devices.
Who is it for
This slide is ideal for e-commerce managers, digital marketers, and business analysts who need to track the effectiveness of the sales funnel in an e-commerce setting. It’s also useful for teams working on optimizing conversion rates and improving customer journey performance.
Other Uses
Beyond e-commerce reports, this funnel slide can be repurposed for lead conversion tracking, customer journey mapping, marketing campaign analysis, and sales performance reviews. It can also be adapted to visualize funnel data in other industries, including SaaS, retail, and financial services.
Login to download this file
Add to favorites
Add to collection

Item ID
SB00398