


Strategy Chart PowerPoint Template profile slide
Description
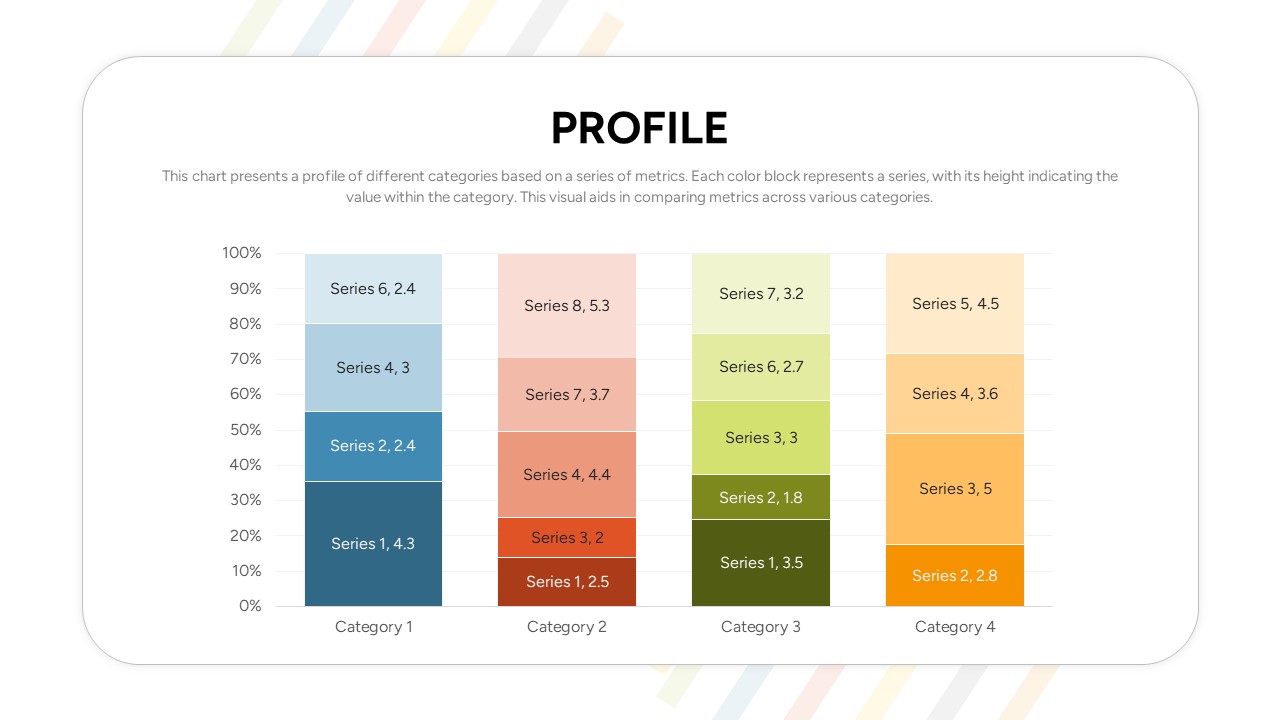
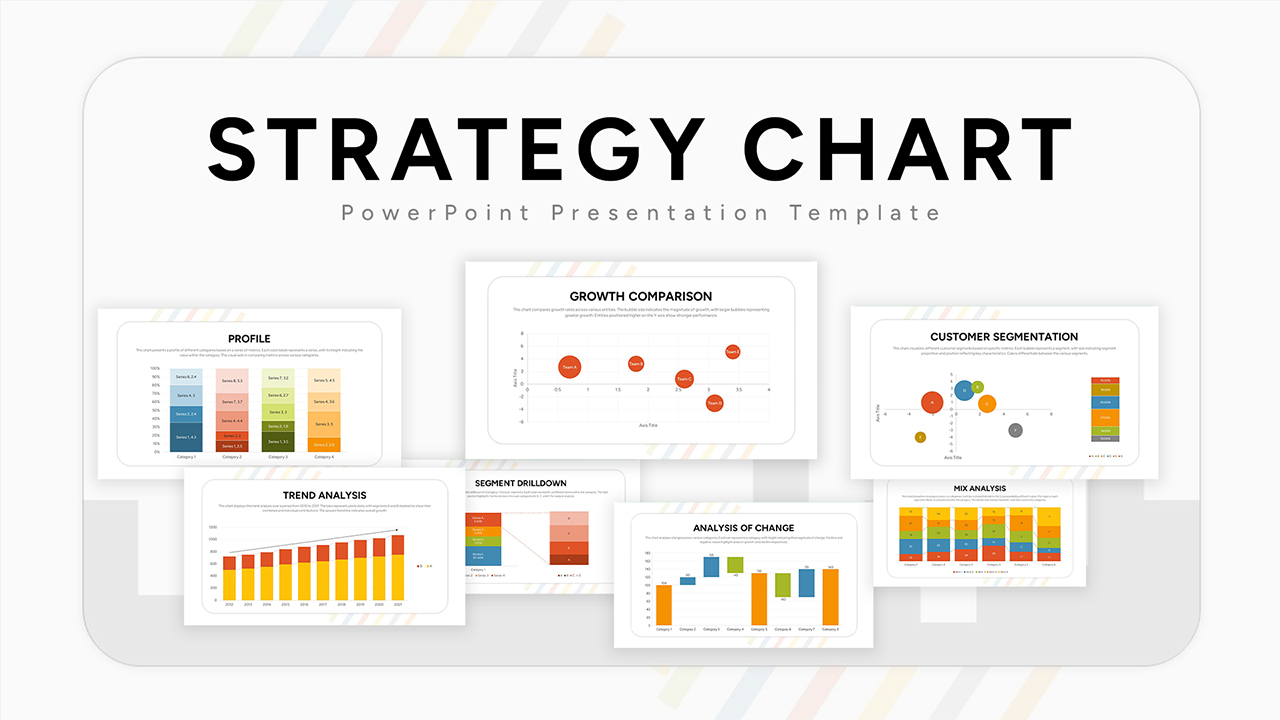
Visualize complex data with ease using this eight-slide Strategy Chart presentation template for PowerPoint & Google Slides. Begin with a cover slide showcasing six thumbnail previews of versatile chart types on a clean, rounded-corner canvas. Slide 2 offers a Growth Comparison bubble chart to plot entity performance by magnitude and position. Slide 3 features a Customer Segmentation bubble chart with proportional sizing and color-coded legend. Slides 4 and 5 present stacked Profile bars and Analysis of Change columns—ideal for comparing category values and highlighting positive or negative shifts. Slide 6 dives into Segment Drilldown with a detailed stack-and-split diagram for sub-category insights. Slide 7 delivers a Trend Analysis stacked bar timeline from 2012–2021, complete with an upward trend line. Finally, Slide 8 displays Mix Analysis across six categories, combining stacked bars and dashed trend lines for proportion tracking.
Each slide is built on master layouts with fully editable, vector-based shapes and intuitive placeholders. Swap colors to match your brand, replace icons, adjust axis titles, or duplicate charts to extend your storytelling. The neutral white background, consistent typography, and subtle drop shadows ensure clarity on screens and in print. Whether you’re preparing boardroom reports, investor decks, or academic lectures, this template streamlines chart creation—saving time and elevating your data narrative.
Who is it for
Business analysts, data scientists, consultants, marketing strategists, and executive teams
Other Uses
Quarterly business reviews, investor presentations, academic research reports, strategic planning workshops, and client proposals
Login to download this file

Item ID
SB04413