


Monthly Sales Review Presentation Slide

Description
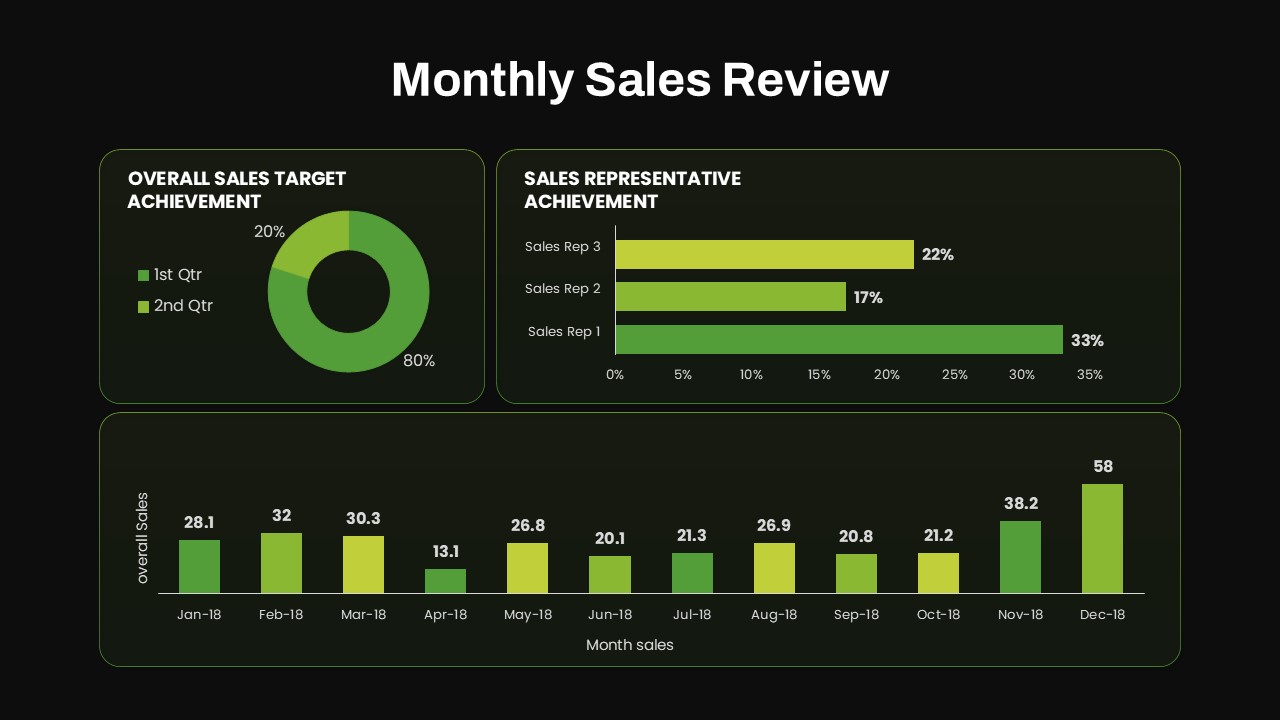
Present your sales results with this comprehensive monthly review dashboard slide, combining three clear visualizations to track performance at a glance. A large donut chart displays overall sales target achievement—80% vs. 20%—while the adjacent horizontal bar chart compares individual sales representatives’ percentages. Below, a color-coded monthly bar chart spans twelve months, illustrating actual sales figures from January through December. Each chart is enclosed in softly rounded containers with light green backgrounds and subtle borders, ensuring a clean, unified look.
Fully editable in PowerPoint and Google Slides, this template uses master layouts and intuitive placeholders so you can update chart data, swap colors, and adjust labels instantly. Change the segment hues to match corporate branding, modify axis scales, or replace the donut chart with alternative gauges. Alignment guides keep containers perfectly spaced, and vector shapes maintain crispness on any device. Whether you import live Excel tables or manually enter values, the graphics adapt seamlessly without disrupting your design.
Ideal for monthly sales meetings, executive briefings, and performance reviews, this dashboard slide streamlines stakeholder communication by presenting target attainment, individual contributions, and trend analysis in one cohesive layout. Use the top section to highlight achievements and areas for improvement, then leverage the timeline chart to drill down into seasonal fluctuations and emerging patterns. The intuitive design guides your audience through high-level summaries and detailed insights without overwhelming them with data.
Who is it for
Sales managers, regional directors, account executives, and business analysts who need to report on targets, compare team performance, and identify monthly trends in a single, impactful slide.
Other Uses
Repurpose this layout for marketing campaign metrics, project milestone tracking, financial KPI reports, resource utilization reviews, or quarterly business updates by simply relabeling charts and adjusting color schemes.
Login to download this file
Add to favorites
Add to collection

Item ID
SB04655